Article

Estimation of Sporulated Cell Concentration of Bacillus thuringiensis in a Batch Biochemical Reactor via Simple State Observers

by
José Luis Zárate-Castrejón
1,
Pablo A. López-Pérez
2,
Milagros López-López
3,
Carlos A. Núñez-Colín
1,
Rafael A. Veloz-García
1,
Hamid Mukhtar
3 and
Vicente Peña-Caballero
1,*
1
Programa de Biotecnología, División de Ciencias de la Salud e Ingenierías, Campus Celaya-Salvatierra, Universidad de Guanajuato, Mutualismo #303, Col. La Suiza, Celaya 38060, Guanajuato, Mexico
2
Escuela Superior de Apan, Universidad Autónoma del Estado de Hidalgo, Carretera Apan-Calpulalpan, Km.8., Chimalpa Tlalayote s/n, Apan 43900, Hidalgo, Mexico
3
Institute of Industrial Biotechnology, Government College University, Lahore 54000, Pakistan
*
Author to whom correspondence should be addressed.
Mathematics 2024, 12(24), 3996; https://doi.org/10.3390/math12243996
Submission received: 31 October 2024 / Revised: 26 November 2024 / Accepted: 6 December 2024 / Published: 19 December 2024
(This article belongs to the Special Issue Mathematical Models and Control of Biological Systems)

Abstract

:
This paper presents a contrast of two different observation strategies viz a nonlinear observer and a classical extended Luenberger observer applied to a bioreactor system for Bacillus thuringiensis production. The performance of the two observers was evaluated under different conditions, both with and without state perturbations. Firstly, equal initial conditions were considered without the presence of white noise in the measurement of dissolved oxygen concentration in the culture medium. The performance was then analyzed by perturbing the maximum cell growth rate with equal and different initial conditions, and, finally, the performance of the observer with the presence of white noise was evaluated. The proposed observer performed better than the extended Luenberger observer against initial conditions different from the model. The results of this study are of great interest, as they provide insight into the estimation of the state of the dynamics for the B. thuringiensis bioreactor in a batch mode. In addition, these results provide valuable information for future research in the design of observers for B. thuringiensis bioprocessing.

1. Introduction

Currently, observers are being developed for bioprocesses due to the high cost or lack of adequate sensors to measure their variables in bioreactors (the concept of observers is presented specifically below, starting first with the presentation of the biological system Bacillus thuringiensis). In this work, the model of a bioprocess of B. thuringiensis production in a bioreactor is considered for the design of a nonlinear observer.
Some microbial agents have positive impacts on pest control, such as, for example, bacteria of the genera Pseudomonas, Streptomyces, and Bacillus, which have been used as biofungicides, as in case of Bacillus, as its presence deforms the mycelium of some phytopathogenic fungi [1]. Bacillus thuringiensis is a spore-forming, Gram-positive bacterium that has been isolated from soil, aquatic vegetation, animals, marine sediments, composts, and other types of substrates. It produces several types of proteins, such as Vip, Cyt, Sip, and Cry, which are important in this regard [1,2]. Cyt (cytotoxic protein) and Cry (crystalline protein) are formed during the sporulation of the bacterium; in contrast, Vip (crystalline vegetative protein) is formed during its vegetative phase [3], while Sip (secreted insecticidal protein) is a protein that is synthesized in any growth phase of the bacterium [4].
Cry proteins exhibit insecticidal activity against Lepidoptera, Coleoptera, Diptera, Hemiptera, and even Hymenoptera [5]. There are more than 800 Cry genes, which are grouped into 75 families. These genes are found in the genome and in the plasmid coding for different types of proteins according to the nucleotide sequences [6,7,8]. To name these proteins, a nomenclature composed of numbers and upper- and lower-case letters is available, which generates several variants in the literature. Thus, a Cry protein is specific for an insect species; for example, Cry1Ab is specific for the larva of Helicoverpa armigera, while Cry1Ac is specific for Plutella xylostella [6].
The Cry proteins have a molecular weight of ~95 KDa when analyzed on acrylamide gels, although the size may vary according to the sequence of the protein in question [8]. The mechanism of action of Cry protein requires it to be present in the digestive tract of the insect, and this crystal interacts with the epithelial cells of the midgut of the insect, where it generates a pore-shaped structure, which causes lysis of the midgut cells. The insect suffers dehydration and finally dies [7].
Biotechnology has contributed to generating transgenic plants with the ability to defend themselves against pests and diseases. The use of this technology has generated genetically modified plants to produce their own insecticide (Cry protein), as seen in B. thuringiensis corn to combat lepidopteran larval stages. The specificity of this insecticide suggests adequate use in the management of this technology without the generation of residues of conventional insecticides [9]. Transgenic technology has not only been used for corn modification but also in crops, such as cotton, soybean, and rice. The use of these transgenic crops has been so successful that cultivation of these transgenic crops has been extended to two hundred million hectares in developing and developed countries [6], with the inherent benefit of lesser use of insecticides. According to the literature, Cry protein is 300 times more effective than the conventional insecticide pyrethroid and 80,000 times better than organophosphates [3]. Therefore, the use of B. thuringiensis protein makes it an innovative product in agriculture because it is harmful to the specific insects and safe for the beneficial insects and the environment [7].
The assessment of the production of proteins of B. thuringiensis requires complex and costly hardware sensors, especially for measurements of biomass or sporulated bacterial cell concentration [10]. In addition, the production of B. thuringiensis in a bioreactor represents an important challenge in modeling, simulating, estimating, and controlling the process’s feasibility to ensure the quality of the bioprocess; the state estimation of biological process variables directly influences the performance of the on-line monitoring and optimal control of the bioprocess [11]. Specifically, the process control requires measuring all variables, but due to the higher cost of sensors and their components, or the lack of a suitable sensor, the so-called virtual controllers have been implemented [12,13,14,15,16,17,18,19]. These are computer algorithms that employ measurement of data of one or several variables to estimate variables when a sensor is unavailable [19,20]. In the so-called bioprocesses, different observers have been designed and implemented for different processes [21,22]. Table 1 shows some examples of the design and use of the observers.
In addition, process monitoring is directly related to the quality of a product through process analytical technology (PAT) proposed by the Food and Drug Administration (FDA) in 2004, and monitoring is related to the hardware and the software, as well as the estimation and control of important variables [16,36,37,38,39,40]. Therefore, this paper presents a comparative analysis of two nonlinear state estimators (a proposed nonlinear observer and an extended Luenberger observer applied to a plant model for the production process of Bacillus thuringiensis in a batch biochemical reactor; the proposed observer allows for reconstructing the biomass (vegetative and sporulated cells)) and substrate in the reactor using dissolved oxygen (DO) as a measurement variable of the bioprocess.
In this manuscript, the benchmark model (the plant model) for Bacillus thuringiensis formulation is described in Section 2; the linear model of the B. thuringiensis production process is shown in Section 3; and the theory for the observability matrix of the linearized model and the nonlinear model are analyzed in Section 4. The observer design is shown in Section 5, and proof of the proposed observer appears in Section 6, while Section 7 illustrates the numerical simulations of the proposed observer.

2. Benchmark Model

Plant Model for Batch Process Model Using Bacillus thuringiensis Production

Here, we consider an isothermal batch fermenter for modeling Bacillus thuringiensis with the following unstructured model equations for the δ-endotoxins’ production of B. thuringiensis proposed in [16,41], where the model equations are as follows:
Biomass material balance (vegetative cells) X v
d X v d t = μ k s k e · X v ;   X v t = 0 = X v 0
Sporulated cells X s
d X s d t = k s · X v ;   X s t = 0 = X s 0
Substrate balance S
d S d t = μ Y X / S + m S · X v ;   S t = 0 = S 0
Dissolved oxygen dynamics D O
d D O d t = K 3 · F a i r · C s a t D O K 1 · d X v d t + K 2 · X ;     D O t = 0 = D O 0
with   K L a = K 3 · F a i r and X = X v + X s .
Furthermore, the following algebraic equations (constituent equations) define the specific growth rate μ, the spore formation rate k s , and the specific cell death rate k e :
μ D O , S = μ m a x S K S + S · D O K d + D O
k s S = k s , m a x 1 1 + e x p G s S P s k s , m a x 1 1 + e x p G s S 0 P s
k e = k e , m a x 1 1 + e x p G e t P e k s , m a x 1 1 + e x p G s t 0 P e .
In (1) and (2), the variables are time t , vegetative cells X v , sporulated cells X s , substrate balance S , dissolved oxygen D O , and growth rate μ , respectively. More details regarding the equations, the notation, the definition, the units, and the values of the model parameters are presented in Table 2. Additionally, the initial conditions are X v 0 , X s 0 , S 0 , and D O 0 , respectively, for vegetative cells, sporulated cells, the substrate balance, and dissolved oxygen.
The preceding system (Equations (1a–d) and (2a–c)) is written in the compact form of [43]:
X ˙ = F X , u ; X ( t = 0 ) = X 0   Y = H X , u = C X
Remark 1. 
The system (3) encompasses a large variety of systems, including autonomous systems with (known) input.
Notation for Equation (3): R N denotes the set of real numbers: R 0 : = [ 0 , + ) , N > 0 : = N \ { 0 } .
The state vector follows X R n x and the output (or measurement) Y R n y . The input u : R R n u and maps F : R n x × R R n x . H : R n x × R R n y is sufficiently regular, with n x , n y ,   n u N > 0 . Thus, F · is a nonlinear function that is continuously differentiable and locally Lipschitz [44,45]. It is assumed that the state is measurable ( X · ) and that F · is known. Then, for the phenomenological model of Equations (1a–d) and (2a–c) with Equation (3), it is (in the state space) where,
d X d t = X ˙ = X v ˙ X ˙ s S ˙ C ˙ D O R 4 × 1 ;   X = X v X s S C D O R 4 × 1 ;   X 0 = X v 0 X s 0 S 0 C D O 0 = X v 0 X s 0 S 0 C D O R 4 × 1
F X , u = F 1 F 2 F 3 F 4 = μ k s k e · X v k s · X v μ Y X S + m S · X v K 3 · F a i r · C s a t D O K 1 · d x d t + K 2 · X R 4 × 1
Y = H X = C X , C R 4 × 1
C a s e   I   C R 1 × 4 : i f   Y = X v 0 0 0 = X v   C a s e   I I   C R 1 × 4 :   i f   Y = 0 X s 0 0 = X s C a s e   I I I   C R 1 × 4 :   i f   Y = 0 0 S 0 = S C a s e   I V   C R 1 × 4 :   i f   Y = 0 0 0 D O = D O

3. Linear Model of the System in Equations (1a–d)–(2a–c)

The dynamic (state–space) model was developed as a class of differential dynamic systems. Its linearization yields Equation (4). Therefore, this implies that the output map Y can be related to the following state–space model by considering an equilibrium point X e .
X ˙ = F X , u ; X ( t = 0 ) = X 0   Y = H X , u = C X l i n e a r   s y s t e m s D = 0 X ˙ = A X + B U ;   X t = 0 = X 0         Y = C X + D U , D = 0    
in which the coefficient matrix A , B , C , and D can be obtained by using the Jacobian linearization method [46,47]:
A = F X , U , t X X = X e U = u e R 4 × 4 ,   B = F X , U , t U X = X e U = u e R 4 × 1
C = H X , U , t X X = X e U = u e R 1 × 4 , D = H X , U , t U X = X e U = u e = 0 ,     X e = X v e X s e X e D O e S e R 4 × 1
For the actual bioreactor system (Equations (1a–d)–(2a–c)), the inlet volumetric flow rate of the air affects the output (the oxygen concentration). From a practical point of view, the inlet volumetric flow rate of air should and could become a control variable (Figure 1). In this work, this operation variable was used to prove the performance of the proposed observer (Section 6) by using an initial condition and white noise for this variable [48,49].
For the biochemical reactor model described in Equations (1a–d) and (2a–c) considering the inlet volumetric flow rate of the air is F a i r = G 0 for Bacillus thuringiensis production (see Figure 1 for a reactor in batch operation mode) with a defined operating value for F a i r = 1800   L / h (see Table 2) a dynamic state will be obtained for the state variables that is evaluated with equations4 andfor this point if matrix D = 0 , Equation (4) yields Equation (5):
X ˙ = A X Y = C X = D O  
Therefore, the matrix of the state space and the output matrix can be obtained as follows:
A = a i j ,   C = c i j = c o l 0 0 0 1
See Equation (4).

Observability Properties of the System in Equations (1a–d)–(2a–c)

For the purpose of state estimation, first, the local observability properties must be established to define an adequate estimation structure [39,50,51]. The output matrix of this system is [52]
y y y y = C X C A X C A 2 X C A n 1 X
or, in vector form,
Y = O X
where
O = c o l C C A C A 2 C A n 1 .
As it can be seen, if the state vector can be determined, the matrix O (called the observability matrix) must be invertible (of full rank, i.e., r a n k O = n = 4 ) to obtain
X = O 1 Y
Thus, the state vector X is observable with respect to the measurable output Y .
The local observability analysis was condensed as follows.
Definition 1: Local observability theorem. 
A continuous time linear system in Equation (4) is observable if and only if   r a n k O = 4   [52,53].

4. Nonlinear Observability Analysis

According to Equation (3), the functions F X and G X are smooth vector fields, and they represent the kinetics and the transport terms, respectively. For this process, the state vector is X = c o l u m X v   X s   S   D O and the input vector is u = F a i r , which are determined from Equation (3). In actual implementation, the inputs for the bioprocess can be the substrate feed rate and the airflow rate F a i r · C s a t , but in this bioprocess, it is the air flow to the bioreactor F a i r .
The details of the nonlinear observability analysis are presented in Appendix A.
Preposition 1
([54]). The system (1a–d)–(2a–c) or as matrices in (3) is observable with any measurement  Y i = h i X , if the observability matrix defined by  O = c o l u m L F 0 h i L F 1 h i L F 2 h i L F 3 h i  is of full rank. Where  · · X = · X v · X s · S · D O , h h X = h X v h X s h S h D O , and  F F X F i j F i x j ; i = 1 ,   2 ,   3 ,   4   j = X v ,   X s ,   S ,   D O . Then, the Lie derivatives of   h  with respect to  F , which is denoted by  L F k , is a scalar function defined by  L F k X = h F = h X F . Note that  L F 2 k X = L F L F k = L F L F k = L F k F = L F k X F  and  L F 3 k X = L F L F L F k = L F   L F 2 k X = L F k F =   L F 2 k X X F , so that, in general,  L F k k X = L F L F k 1 k = L F   L F 2 k X =   L F k 1 k X X F , k = 1 ,   2 ,    and  L F 0 k = k , L G L F k = L F k G
The observability analysis shows that if the dissolved oxygen was measured, then DO contains enough information to make the system (1a–s)–(2a–d) observable.
At this point, the controllability of the proposed observer is not analyzed, but as it will be seen later, its dynamics for different case studies and convergent trajectories are observed, which is an indication of stability. Furthermore, for the operating point of interest in this work, X = X R 4 L x X U x   g / L , where L x = 0   0   0   0 is the lower bound of the states and U x = 0.425   0   20   0.00759 or X ( t = 0 ) = X 0 = X 0 0.425 ,   0 ,   20 S 32 ,   0.00759   is the upper and admissible control actions set at U = u R 0 u 1800   L / h . The eigenvalues λ i ; i = 1 ,   2 ,   3 ,   4 are negative in Equation (4), and they are all negative for the linear model of the system. The reader is referred to the reference in [55] for details regarding the controllability (using the state controllability index) for a batch reactor to demonstrate that the inputs (air and substrate concentration) can impact the controllability of the bioreactor for B. thuringiensis production.

5. Observer Design

A nonlinear observer takes the following form:
z ^ ˙ = F z ^ , y ,       x ^ ˙ = T z ^ , y
Here, Z ^ R n Z for n Z N > 0 and F : R n Z × R n Y × R R n z , T : R n z × R n y × R R n x are chosen so that the following holds.
Definition 2. 
The system (10) is a nonlinear observer for system (1a–d)–(2a–c) if there exists   Z t = 0 = Z 0 R n Z   for any solution   t x t   to (model) defined on   [ 0 , + )   with   X 0 X 0   and any solution   t z ^ t   to (equation of server) with   z ^ t = 0 Z 0 .   F i n a l l y ,   input   y t = H X t , u t   is defined on   [ 0 , + )   and verifies
= lim t + E t lim t + x ^ t x t = 0
with x ^ t = T z ^ , y .
In other words, x ^ t is an estimate of the current plant state (the system or model for B. thuringiensis), and the error made with this estimation converges to zero as the time goes to infinity. Finally, for the system (model), n z = 4 and n y = 4 (for an ideal case, in this paper, n y = 1 , i.e., x ^ = T z ^ , y ).

Proposed Observer Algorithm for B. thuringiensis Bioreactor

The system (12) was proposed as a state observer for the system in Equations (1a–d)–(2a–c) by using the form in Equation (3), and the design of the observer was inspired by [56], with the following structure:
Z ^ ˙ = F z ^ , y ,       x ^ ˙ = T z ^ , y
Z ^ ˙ = F Z ^ , Y + γ 1 E t + γ 2 Φ E t , G β + γ 3          
Here, the E t is defined as Equation (13), and it is the observer error
E t = X t X ^ t
In Equation (12b), there are three parameters (gains): γ 1 (proportional gain), γ 2 , and γ 3 . The function Φ E t , G has other positive parameters according to its selection or design (as will be shown in Equation (14)).
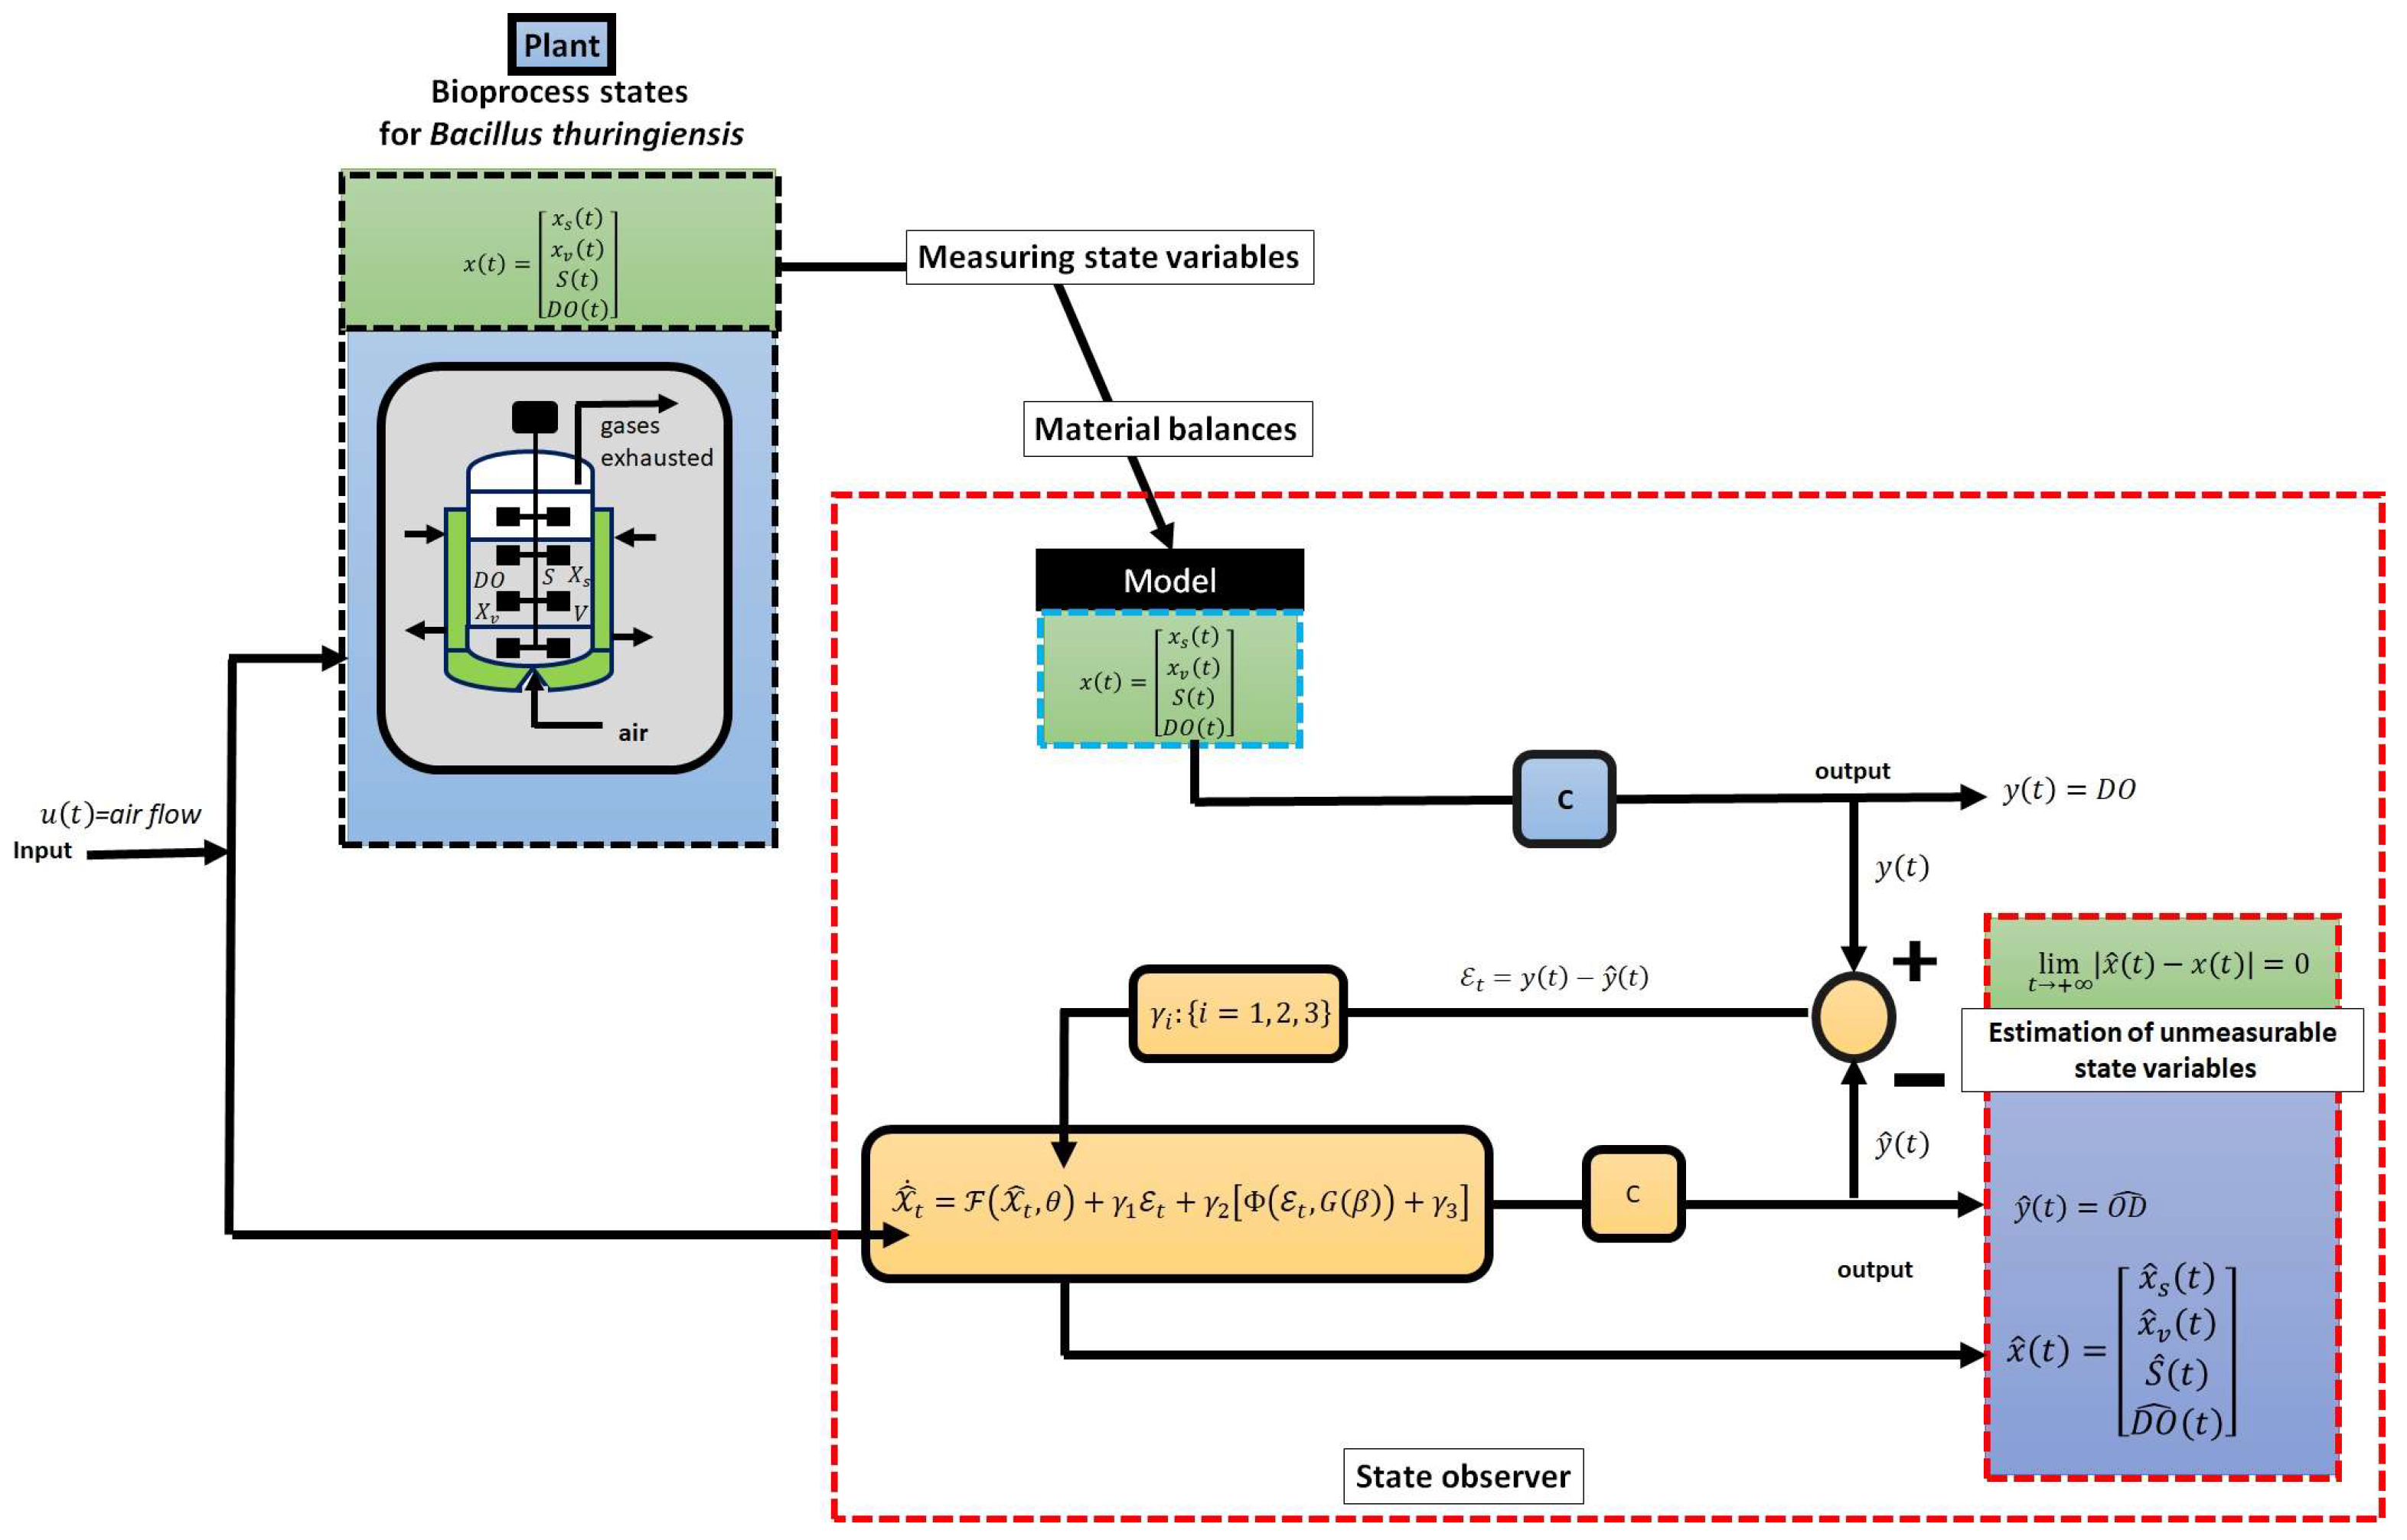
As shown in Figure 2, according to Equation (12), the stages in the nonlinear observer design can be identified below.
(i)
The first stage involves the proper definition of a model bioreactor, which involves process modeling and, hence, the general state–space dynamical model or the plant model.
(ii)
The observer must then be formulated in mathematical terms (Equation (14)).
Remark 2. 
 The design of the state observer was completed by designing the function  Φ E t , G or by selecting a suitable function reported in the scientific literature with specific properties according to the nature of the observer and the convergence and stability test of the observer; see, for example, [57].
Assumption 1 (A1). 
On-line measurements of the dissolved oxygen (DO) are available.
Proposition 2. 
For observer design, according to the system in Equation (12), in this work, the phi function is proposed below:
Φ E t , G = e x p β E t e x p β E t u E t + e x p β E t u E t    
where  β R + .
Then, substitute Equation (14) in Equation (12b) to obtain Equation (15).
By substituting Equation (13) for Equation (7), the proposed observer’s system in Equation (14) was then obtained:
Z ^ ˙ t = F X ^ t , θ + γ 1 E t + γ 2 e x p β E t u E t + γ 2 e x p β E t u E t + γ 2 γ 3 .

6. Sketch of Proof of Proposition 2 (Equation (15))

This section shows the convergence analysis of the observer proposed in Equation (15) based on the error dynamics using Equation (13): E ˙ t = d E t d t E ˙ t = E q u a t i o n   ( 3 ) E q u a t i o n   ( 15 ) = X ˙ t Z ^ ˙ t .
The error dynamic is then
d E t d t = F X , u F X ^ t , θ = F X , u γ 1 E t γ 2 e x p β E t γ 2 γ 3 .
Taking the norm to maximize Equations (14)–(16),
d E t d t F X , u F X ^ t , θ γ 1 E t γ 2 e x p β E t γ 2 γ 3 .
Now, we consider the following assumptions and the corresponding functions’ properties:
Definition 3. Lipschitz application. 
Given an application  F : R n R m , F   is (globally) Lipschitz on the set  U when there exists a constant L > 0 such that [58]
F X , u F X ^ t , θ L E t .
Thus,
d E t d t γ 1 E t γ 2 e x p β E t .
For the above equations, consider the assumption (A2–3)/definition D of Table 3 and Table 4.
Therefore, to analyze the observer convergence, the Laplace transformation was applied to the differential inequality in Equation (19):
L d E t d t γ 1 L E t γ 2 L e x p β E t
Above, when calculating the Laplace transform of Equation (20), the independent variable is t , and the transform variable is s or the Laplace variable.
Thus,
s · E s E 0 γ 1 E s 2 β γ 2 s 2 β 2
For Equations (20) and (21), consider the assumption (A1 and A2)/definition of Table 3 and Table 4.
If the definition of the error E s = X s X ^ s and E 0 = X 0 X ^ 0 is now considered, the above equation takes the following form (Equations (20) and (21)):
s · X s X ^ s X 0 X ^ 0 γ 1 X s X ^ s 2 β γ 2 s 2 β 2
Without a loss of generality, it was assumed that the initial condition of inequality in Equation (22) is homogeneous, i.e., X 0   =   0 and X ^ 0   =   0 ; therefore,
s X s s X ^ s γ 1 X s + γ 1 X ^ s 2 β γ 2 s 2 β 2
Via an algebraic arrangement,
lim s 0 X s s + γ 1 lim s 0 X ^ s s + γ 1 lim s 0 2 β γ 2 s 2 β 2
Then
lim s 0 X s γ 1 lim s 0 X ^ s γ 1 lim s 0 2 γ 2 β
Thus, if suitable values to verify γ 2   β   a r e   s e l e c t e d , Equation (25) simplifies to Equation (26).
Now, let us consider the final value theorem for the Laplace transformation to evaluate the asymptotic behavior of inequality as
lim s 0 X s X ^ s 1 γ 1 γ 1 1 = 1
and
lim s 0 X s X ^ s 1 1 ,
or in the time domain
lim t X t X ^ t 1 1 .
Finally, different studies have been developed to control and estimate variables of the B. thuringiensis production bioprocess [16,30,42,55], but the design of a state observer with the structure proposed in Equation (15) has not been reported, which makes an important contribution in the field of observer design for bioprocesses.

7. Numerical Results and Simulation Research

The numerical results and the simulation research of the proposed estimation system applied to the Bacillus thuringiensis plant model are presented in this section. The initial conditions selected for the model, based on Amicarelli et al. [41,42] were as follows:   X v 0 = X v 0 ; X s 0 = X s 0 ; X 0 = X 0 ; S 0 = S 0 ; and D O 0 = D O 0 (see Figure 3).

7.1. Dynamics of Bacillus thuringiensis Production Culture in a Batch Bioreactor

Batch, batch-fed, and continuous growth of B. thuringiensis have mainly been used to study the nutrient requirements and the formation of spores as a benchmark simulation model for monitoring, control design, and fault diagnosis of the fermentation process for B. thuringiensis (see [16]). In Figure 3, simulation results are shown for the state variables   X v , X s , and S and the dynamic behavior D O i.e., the vegetative cells, the sporulated cells, the substrate balance, and the dissolved oxygen, respectively.
The production of vegetative cells occurred in the exponential growth phase as shown in Figure 3a. In this phase, the substrate was consumed (more specifically, for t > 10 h with S 0   g / L ) with the consumption of oxygen in the fermentation medium, from 7   m g / L (100% oxygen saturation) to 4   m g / L (57% oxygen saturation). If the initial substrate concentration, S 0 , had been varied (for example, with 20, 25, and 30 g/L as in Rómoli et al. [16], then the oxygen dynamics, i.e., the dissolved oxygen, would have changed as a result of substrate consumption [59]; see Figure 4. Similarly, Rowe et al. [60] also reported the importance and the effect of the initial substrate concentration (at t = 0 h) on the dynamics of the oxygen concentration in the culture medium. More specifically, in that research, an initial glucose concentration of 20 g/L for B. thuringiensis fermentation was found; therefore, in our work, the same concentration was the initial condition for oxygen in the proposed estimator in Equation (15). In addition, B. thuringiensis growth and product formation have been associated with a high rate of oxygen uptake [16,42,60,61,62,63]. Finally, the monitoring of dissolved oxygen dynamics in a bioreactor is important to evaluate the volumetric oxygen transfer coefficient K L a , [23,24] or to control the process by manipulating the dynamics of dissolved oxygen in the culture [16,64]. For example, Rowe et al. [62] examined dissolved oxygen dynamics for batch bioreactor cultures based on the authors’ data, with K L a values of 55 and 18 1/h. In our work, according to the simulations in Figure 4, the K L a values correspond to 15 and 18 1/h; see lines l 1 to l 8 and Table 3 for details. The oxygen concentration dynamics considering O T R , i.e., the oxygen transfer rate (the reactor design and operating parameters) and the oxygen demand rate (the demand by the cell population), are related to the quality of the culture and the cells and their yield. These rates changed in relation to the initial substrate concentration in the bioreactor (Table 5).
Figure 5 shows the phase diagram for the biomass, product, and substrate concentrations for three initial concentrations of substrate ( S 0 ) : 20, 25, and 30 g/L. Furthermore, three different final states of the B. thuringiensis production process were observed. Numerically, it was observed that when starting cultures with a higher glucose concentration, the residual concentration of this substrate was high at the end of the sporulation phase. This is numerically consistent with batch model bioreactor cultures of B. thuringiensis ([16] Rómoli et al., 2016).

7.2. Observability Properties

Continuing with the results for the observability test of the phenomenological model for the dynamics of B. thuringiensis production (Figure 3), for the output variable, y t , the cases in Table 6 and the equilibrium point X e = c o l 0.22 20.91 0.00 0.0036   ( g / L ) are considered (in g/L). This equilibrium point corresponds to the operating conditions reported by Rómoli et al. [16] for optimal dynamics for the bioprocess transformation in the bioreactor. For all cases of the output variable, it was observed that the observability matrix is of full rank (see Equation (1d)). For our study, however, the dynamics of the oxygen concentration dissolved in the culture medium (% oxygen saturation) were considered a measurable variable,   y t = D O , because of the ease and availability of hardware and software for the on-line measurement of this process variable [65,66,67,68]. With this result, it can be concluded that the bioreactor is detectable, and the unobserved mass concentration is stable ([68] Gupta & Agarwal, 2014).

7.3. Observer Design: Application to Bioreactor System for B. thuringiensis Production

An estimation of vegetative cells, sporulated cells, and substrate concentrations via a nonlinear observer (as seen in Equation (15)) was performed in a batch regime with the initial conditions as follows.
X ( 0 ) = X 0 = c o l u m X v 0   X s 0   S 0   D O 0 = c o l u m 0.425   g / L   0   g / L   20   g / L   0.00759   g / L
See the plant model in Equations (1a–d) and (2a–c). White noise was added to the dissolved oxygen measurement signal, with a power of 2 ×   10 5 and a sample time of 0.05 h. In addition, the kinetic parameter μ m a x was perturbed to a value of 90% of its nominal value. Different numerical experiments were developed to evaluate the performance of the proposed observer according to Table 7.
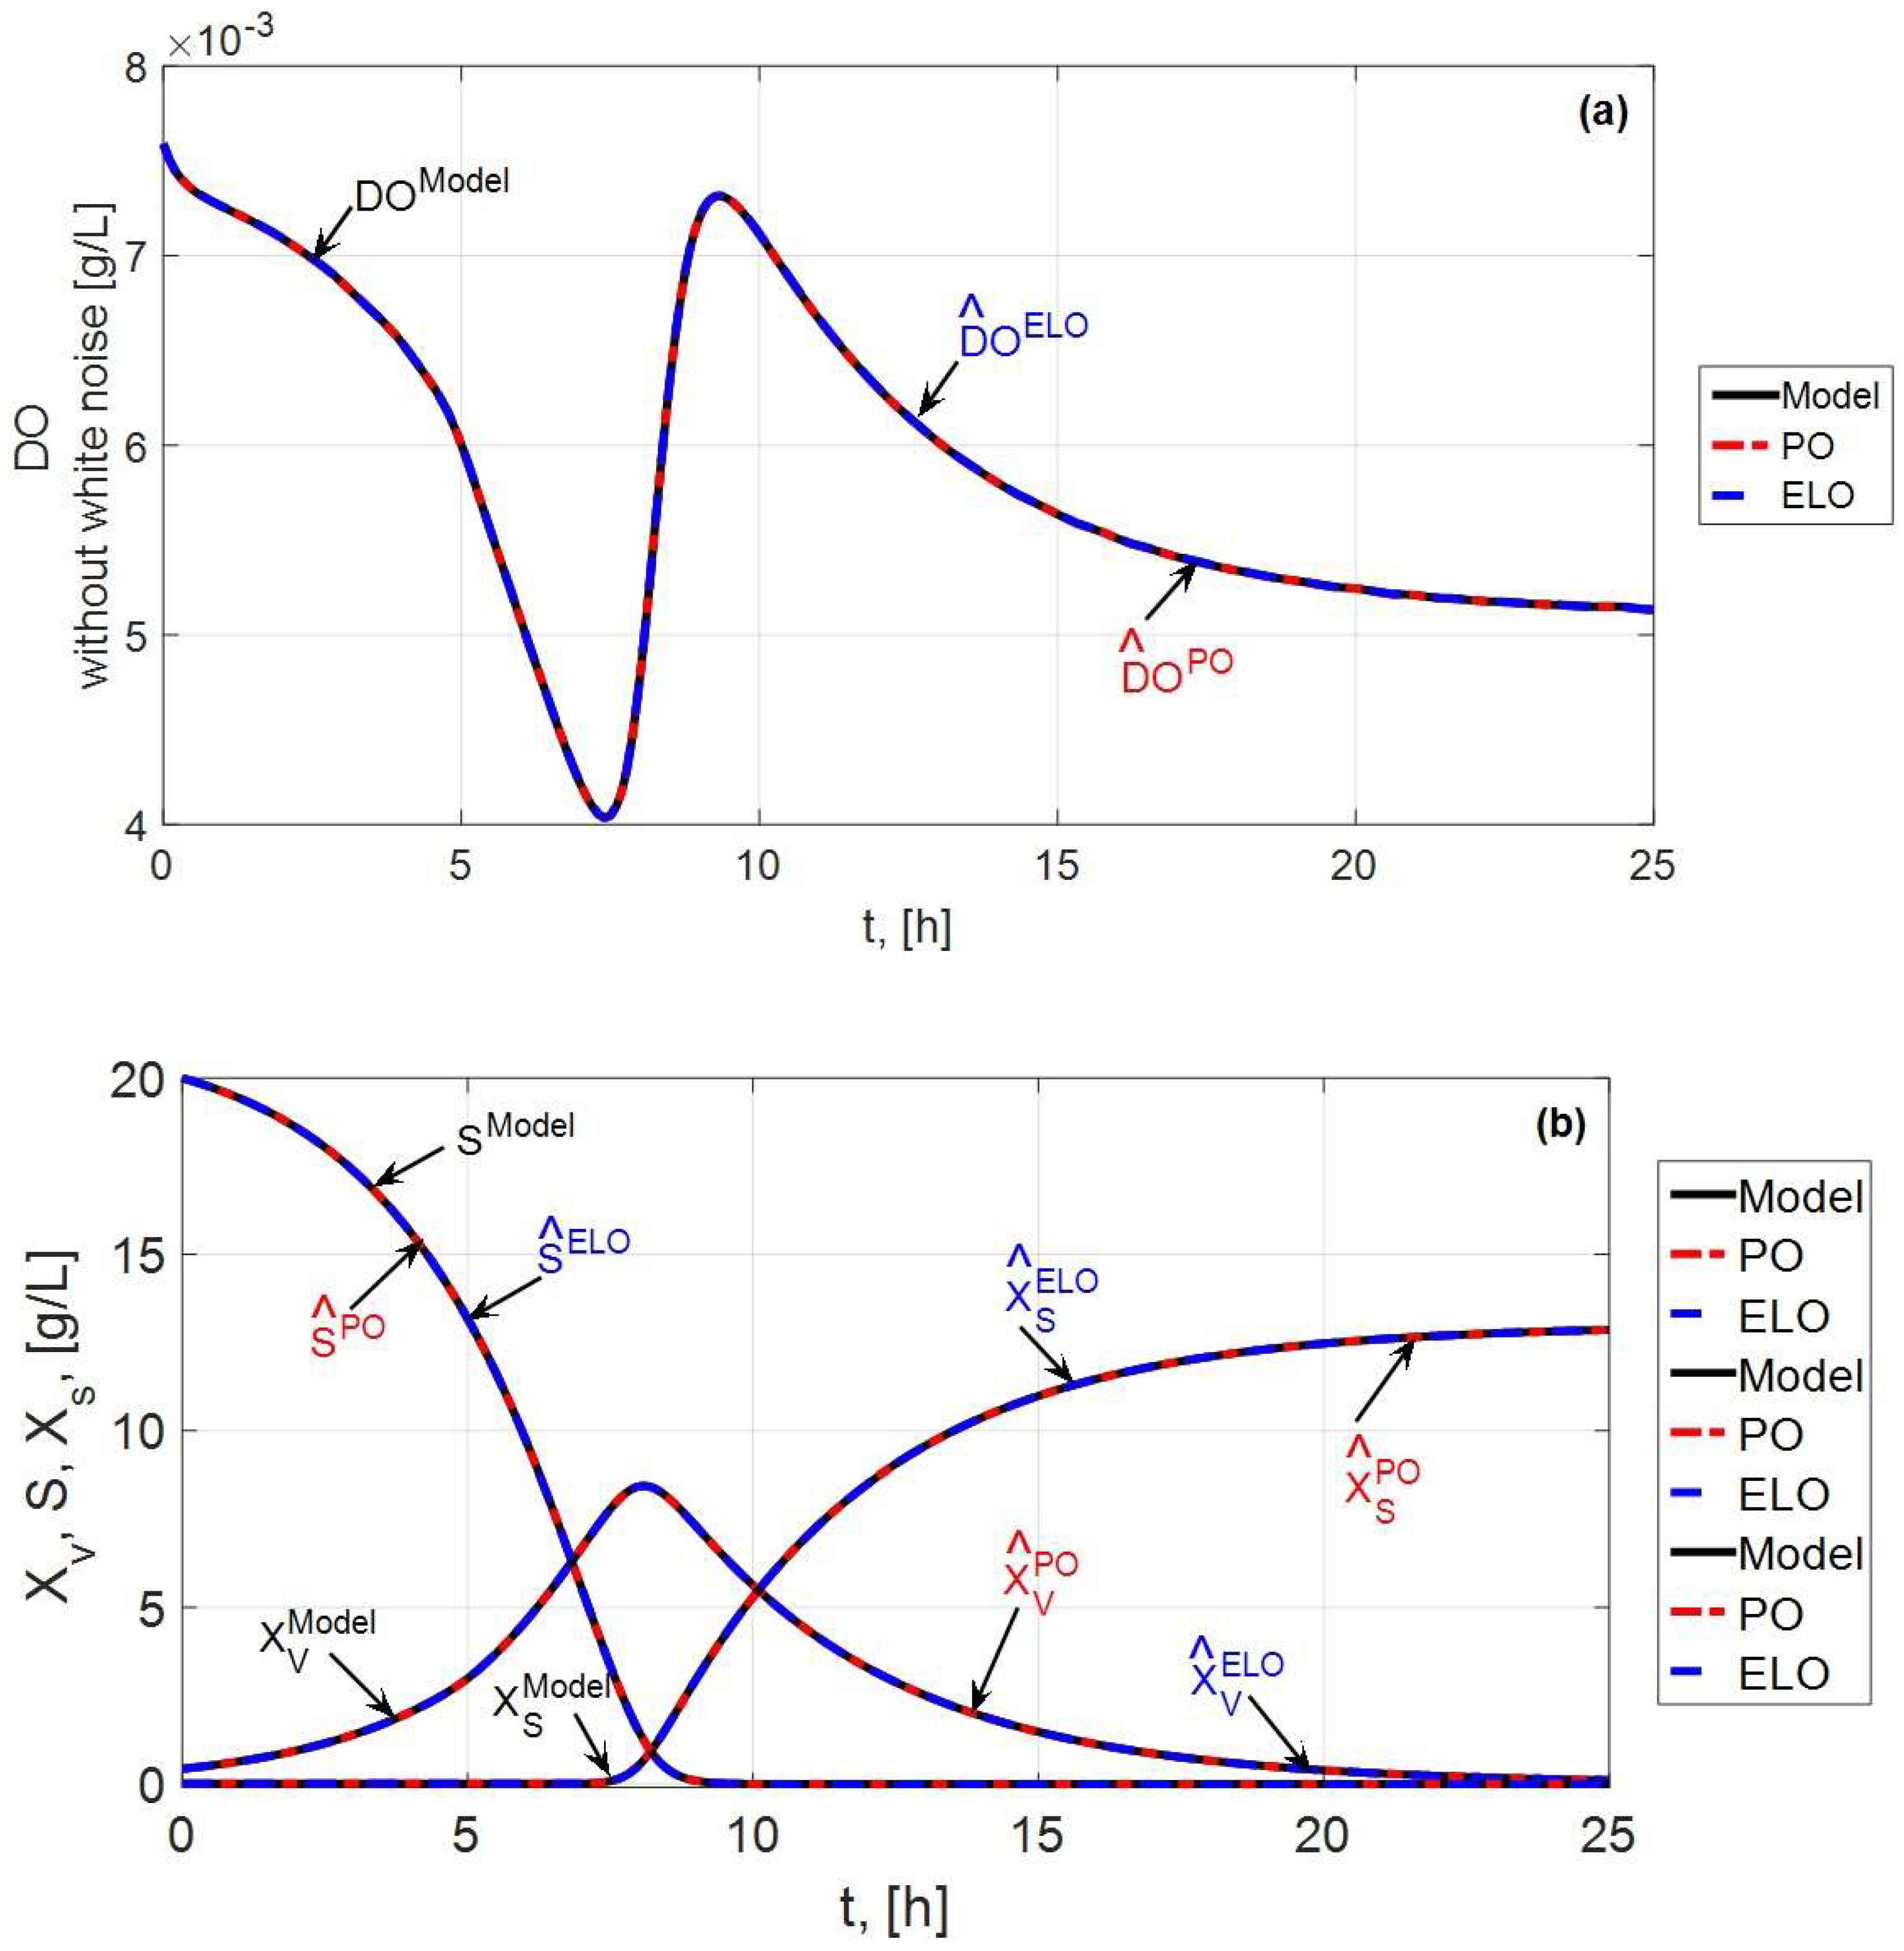
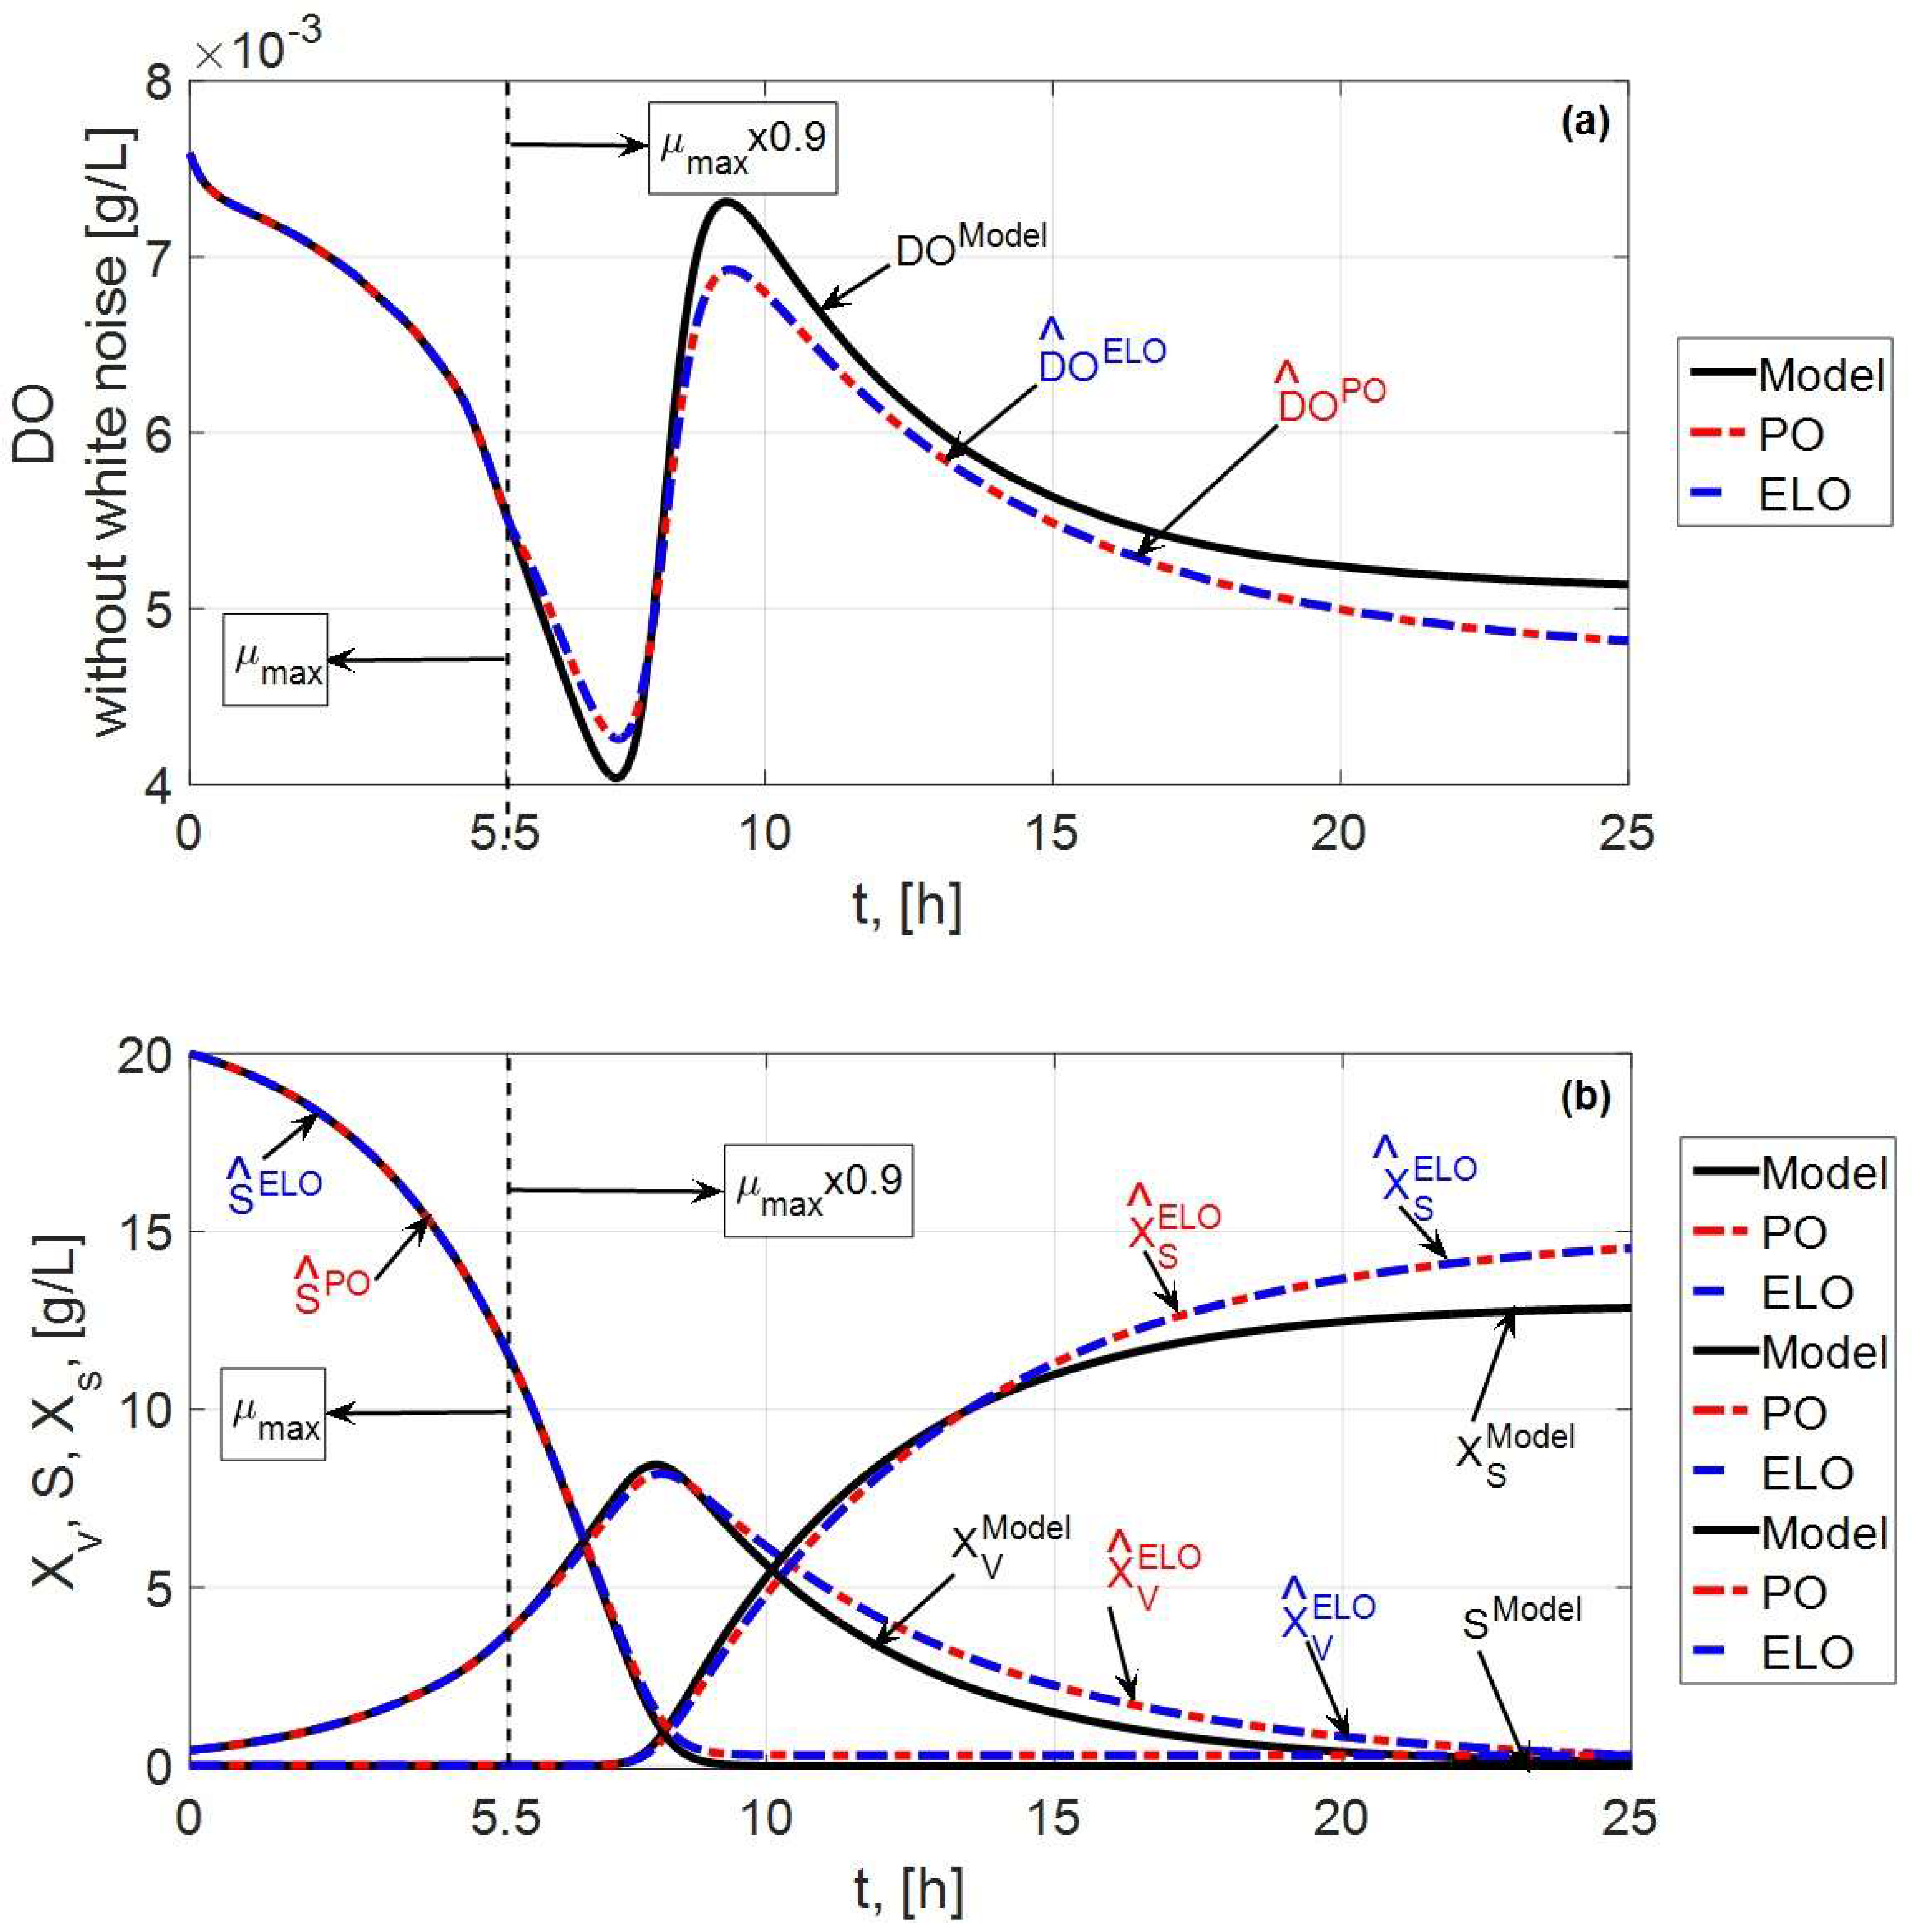
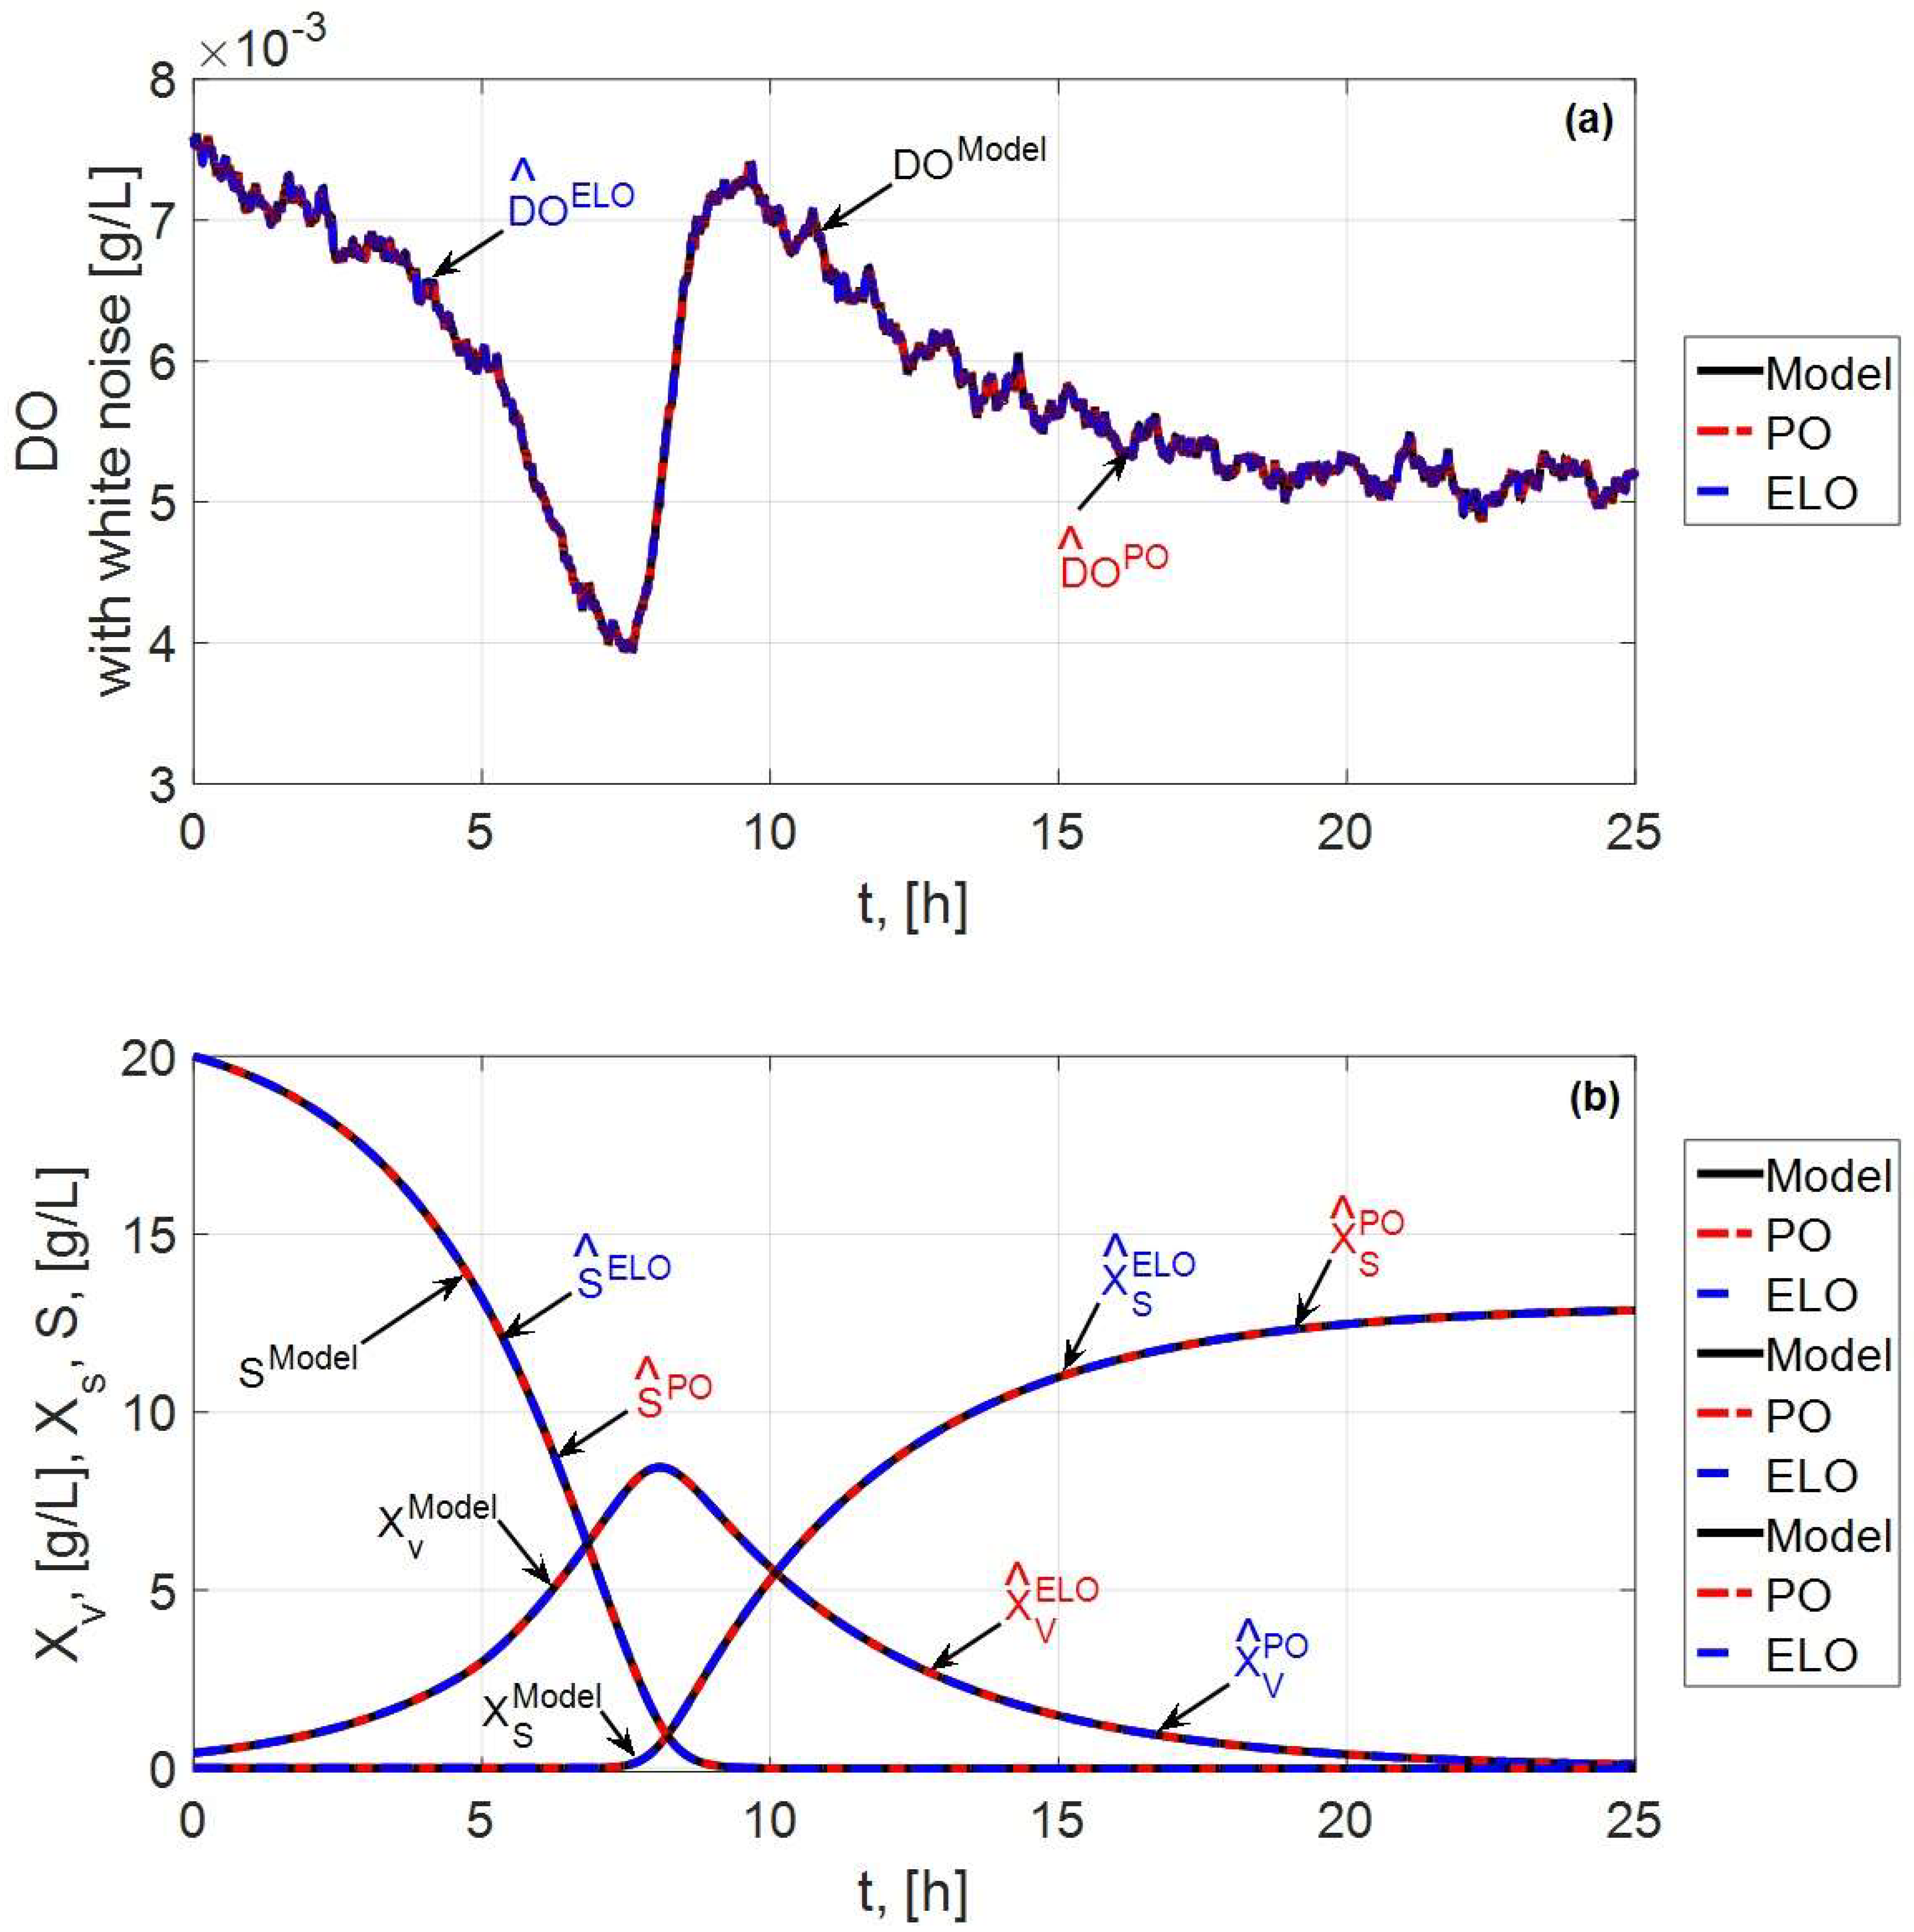
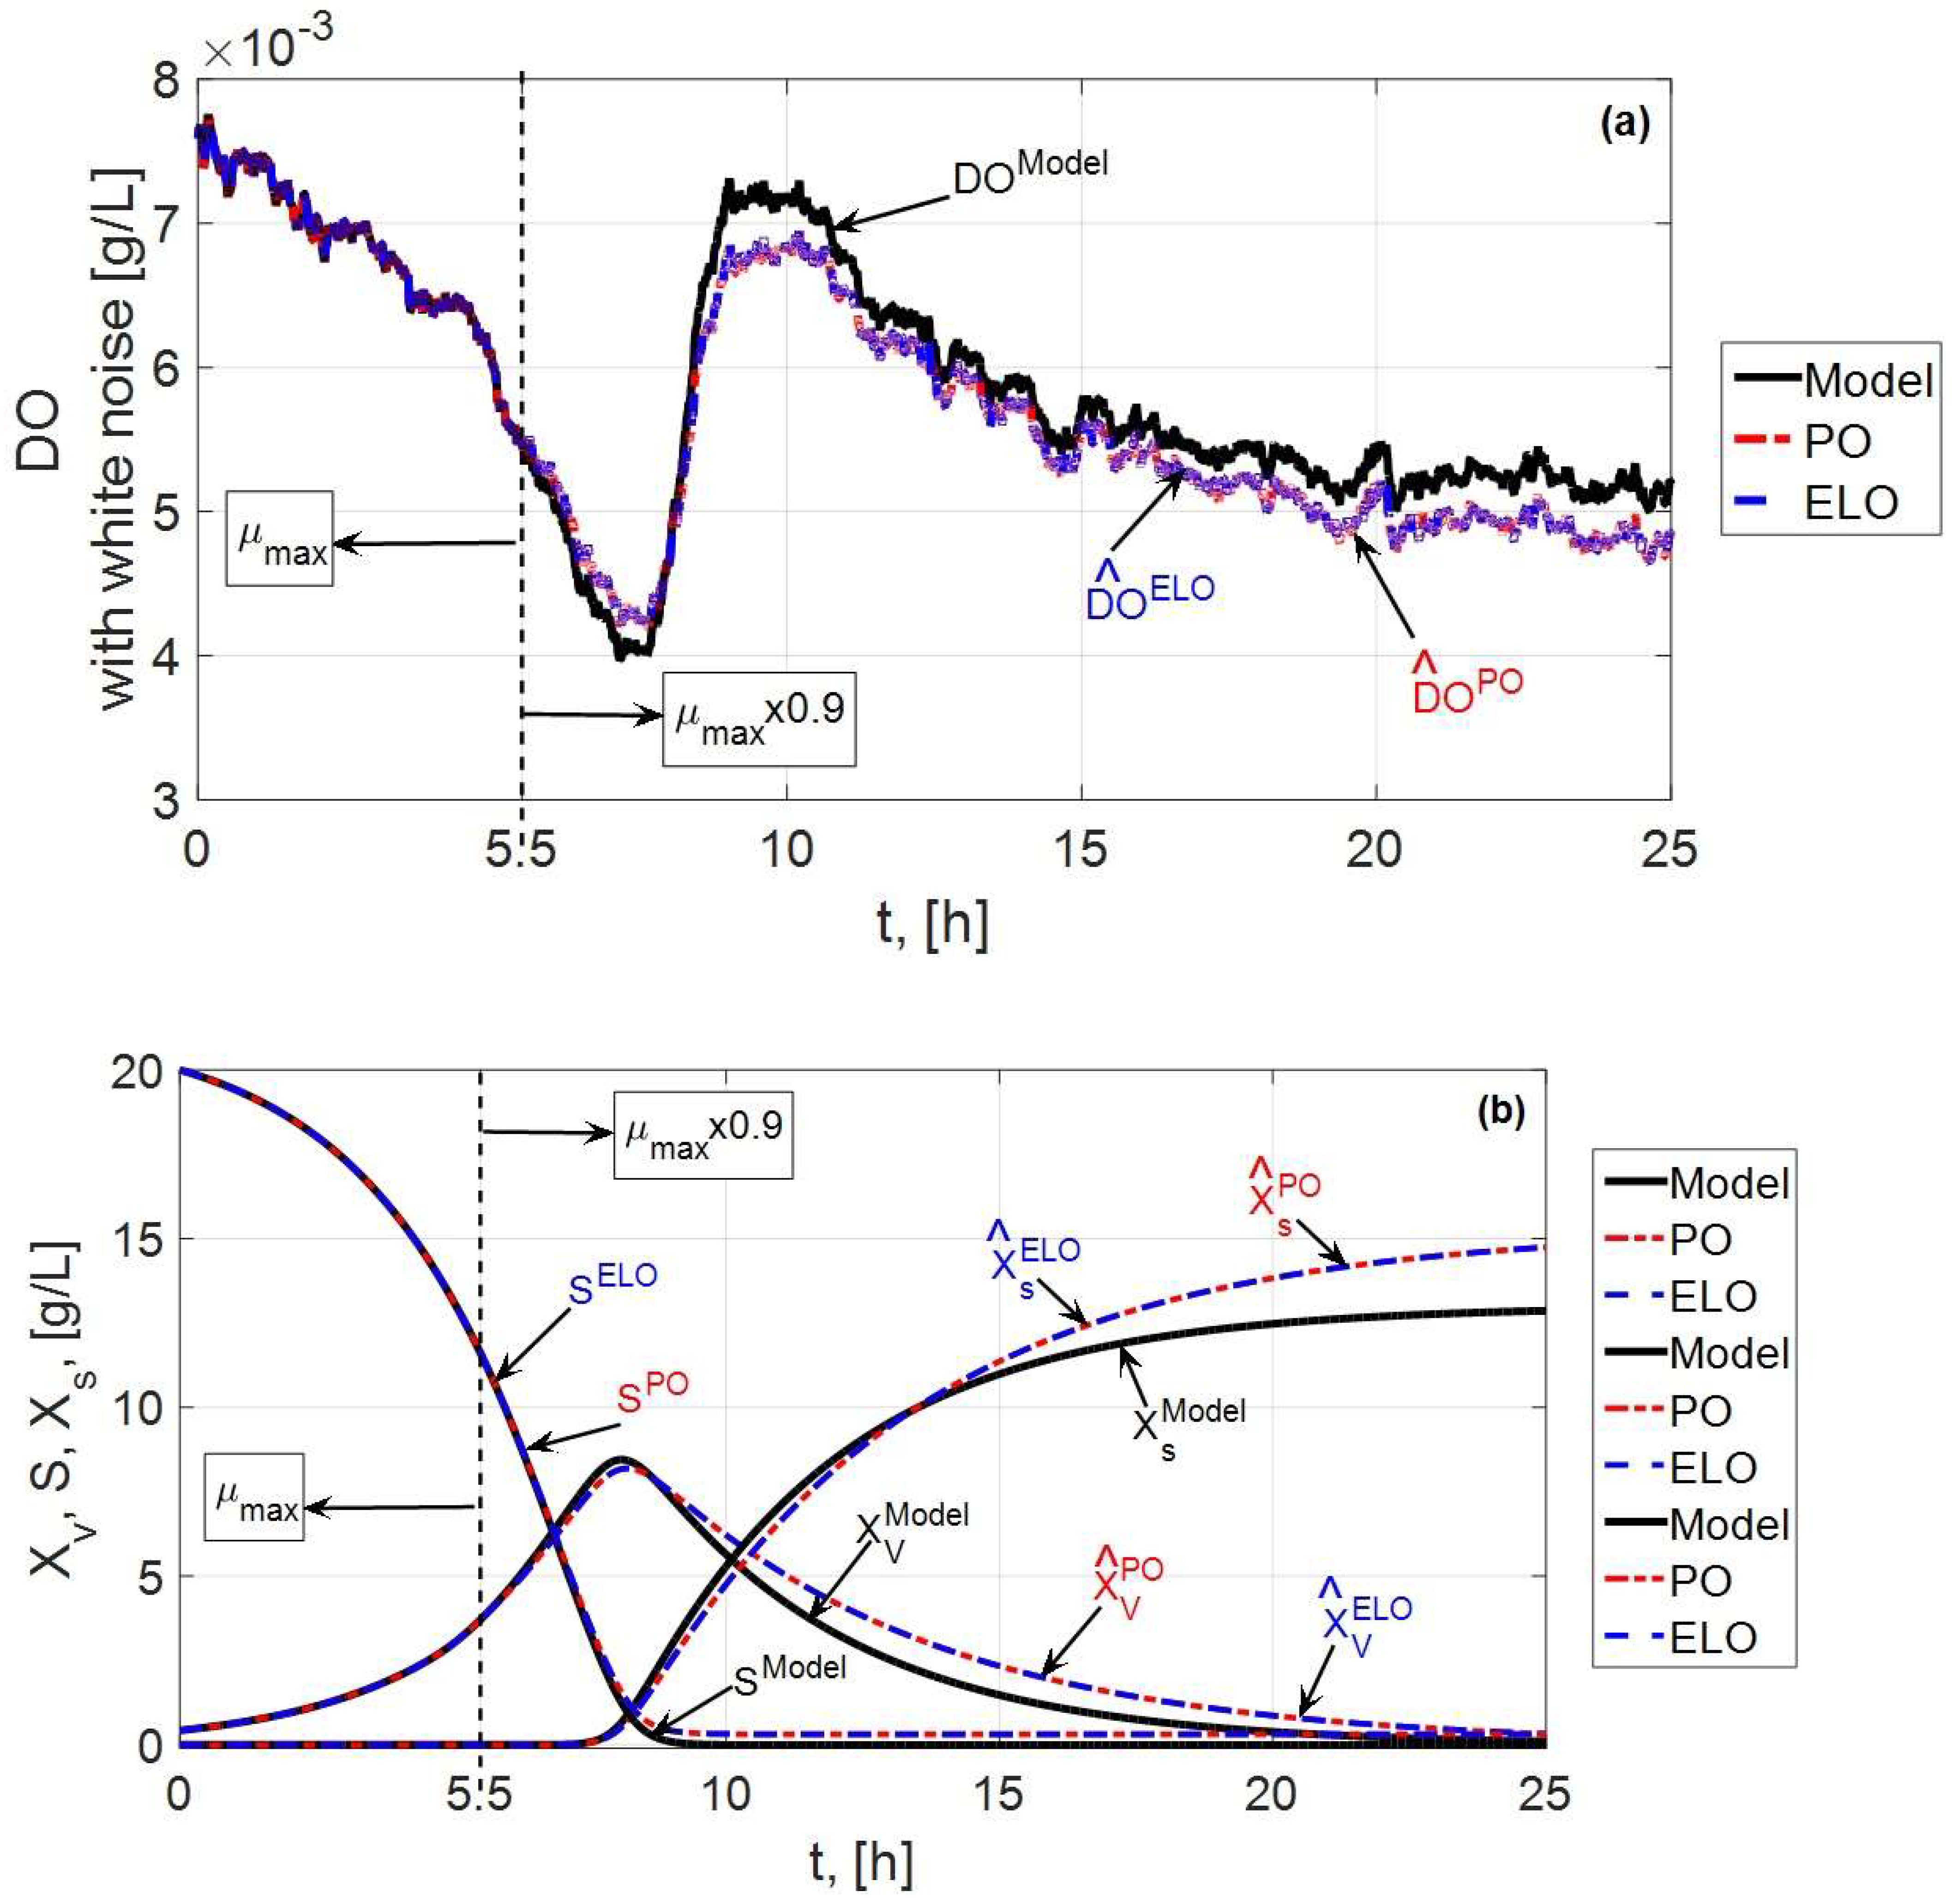
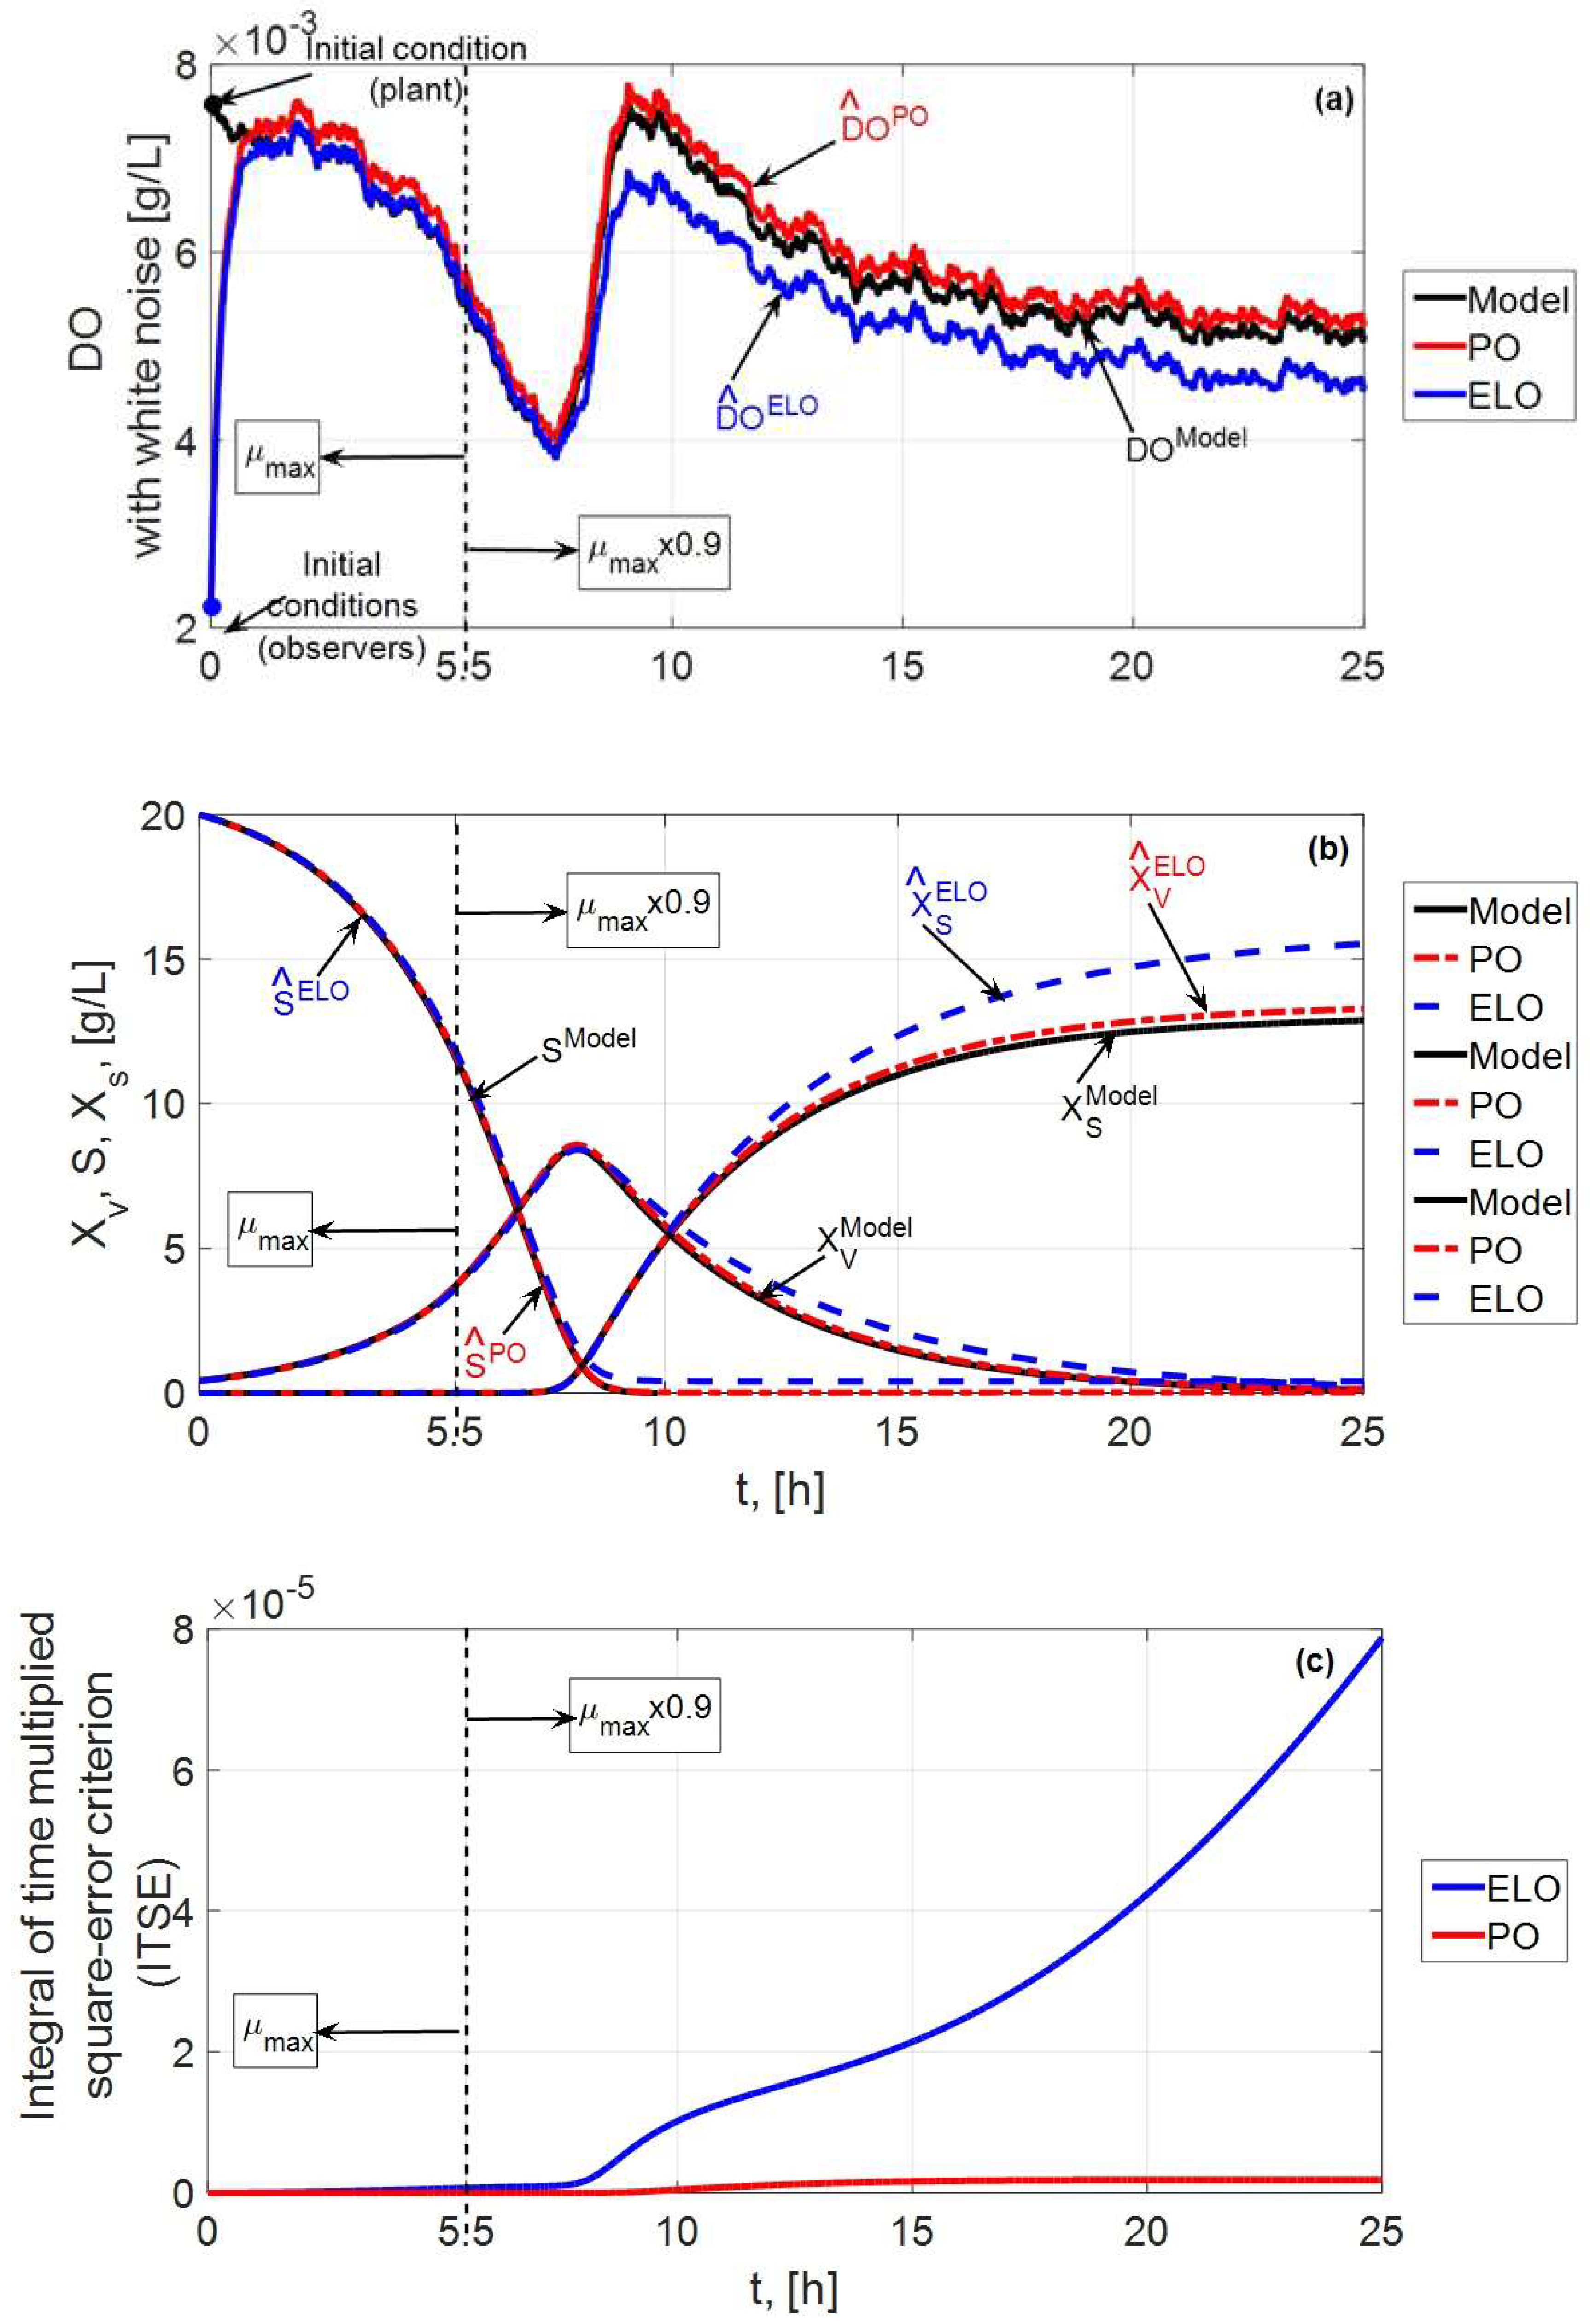
Briefly, to assess the performance of the proposed observer (PO), it was compared with the extended Luenberger observer (ELO) for different conditions reported in Table 5. For the first test, code T1, initial conditions were the same for the PO and ELO without white noise added to the dissolved oxygen measurement. The second test, code T2, had the same initial conditions as T1, but for over 5.5 h, the nominal value of the maximum specific growth rate was perturbed to 90%. For the third test, code T3, the same conditions as the first test were considered, but white noise was added to the oxygen concentration measurement. For the fourth test, code T4, the same conditions as the second test were considered, but white noise was added to the oxygen concentration measurement. Finally, the fifth test, code T5, included the same conditions as the fourth test, but the initial conditions for the oxygen concentration started at 30% of its nominal value.
For T1, Figure 6a illustrates the evolution of the signal of the dissolved oxygen without white noise for the batch fermentation for B. thuringiensis, as well as the performance of the proposed observer and the extended Luenberger observer for this variable. Figure 6b shows the performance of the observers for vegetative cells, sporulated cells, and substrate concentrations. In all simulations, the initial condition of the observer was the same as the real initial condition of the process ( X ( 0 ) = X 0 = c o l u m X v 0   X s 0   S 0   D O 0 ), and both estimators performed adequately.
Additionally, for T2, the effect of parametric changes (kinetic parameters) in the behavior of the observers was analyzed. This was evaluated because the parameters of the fermentation process were modified over time because many environmental factors, such as the pH, the temperature, and the presence of inhibitors, among others, directly affect the performance of state estimators and control systems. Therefore, the maximum specific cell growth velocity ( μ m a x ) in the model was perturbed in the exponential growth phase at 5 h, decreasing to 90% of its nominal value. Figure 7a,b show the performance of the proposed observer and the extended Luenberger observer for dissolved oxygen without white noise (Figure 7a) and for vegetative cells, sporulated cells, and substrate concentrations (Figure 7b). Both estimators were unable to reject the perturbations of the maximum specific growth rate. Continuing with the observer performance test, as shown in Figure 8a,b for T3, the observers closely followed the actual trajectory of the dissolved oxygen white noise (Figure 8a) as well as for the vegetative cells, the sporulated cells, and the substrate concentrations (Figure 8b). Regarding T4, the observers’ performance was like the case of T2. Again, we discovered that the observers were sensitive to variations in the maximum specific cell growth rate (Figure 9).
Finally, the proposed observer and the extended Luenberger observer were compared in terms of initial conditions different from the initial conditions of the model; a condition of 30% was considered for the variable being measured with respect to the nominal value. For this analysis, the performance criterion ITSE was used. The increase and/or decrease of oxygen concentration in the culture medium, i.e., oxygen solubility, was a critical factor for spore production and toxicity in B. thuringiensis cultures in a batch culture. Figure 10 shows the results, where it was observed that the proposed estimator presented the best performance in estimating the states in contrast to the performance of the ELO. This is also apparent in Figure 10c for a lower value of the performance index over time I T S E = 0 t t e 2 t d t , i.e., the integral of the time-multiplied squared error criterion.

8. Conclusions

The design of a nonlinear observer for batch fermentation processes for Bacillus thuringiensis was developed as a nonlinear dynamic. The model was described by five nonlinear differential equations. The observer design was developed with a copy of the B. thuringiensis model. The proposed estimation methodology contains a linear term, i.e., a proportional plus exponential-type output injection term to infer the biomass and concentrations from the on-line measurement of the dissolved oxygen. The simulation results emphasize the excellent performance of the proposed observer, specifically in different initial conditions. The proposed observer was able to reach a satisfactory estimation performance that was better than a standard observer, as shown by numerical simulations.
A theoretical framework was provided by employing the dynamics of the error between the model and the estimated state analysis to demonstrate the stability of the estimation error. Finally, this approach will provide a solution to the monitoring of this type of bioprocess. Details related to sensor management, signal noise, sampling time, and its coupling to the numerical method should be considered in real time; however, potential improvements of the proposed observer are related to the robustness analysis against noisy measurements and unmodeled dynamics for an observer-based controller while considering the difficulties of the measurement of in-line mass concentrations for feedback purposes.

Author Contributions

Conceptualization, H.M.; Methodology, P.A.L.-P.; Formal analysis, C.A.N.-C.; Investigation, M.L.-L.; Writing—original draft, J.L.Z.-C.; Writing—review & editing, R.A.V.-G.; Project administration, V.P.-C. All authors have read and agreed to the published version of the manuscript.

Funding

This research received internal funding in relation to project 008/2024 CIIC24.

Data Availability Statement

Data is contained within the article.

Acknowledgments

This work has received financial support from the Directorate of the DCSI and from the Rector’s office of the Celaya-Salvatierra Campus of the Universidad de Guanajuato and the authors wish to thank the anonymous reviewers for their valuable comments and suggestions.

Conflicts of Interest

The authors declare no conflict of interest.

Appendix A

Nonlinear Observability Analysis

The observability analysis presented here has been carried out considering that DO can be measured in turn [54].
The system (1a–d)–(2a–c) is now represented as (A1):
X v ˙ X ˙ s S ˙ D ˙ O = μ k s k e · X v k s · X v μ Y X S + m S · X v K 1 · μ k s k e · X v + K 2 · X v + X s + 0 0 0 K 3 · C s a t D O F a i r
where
F X = f 1 X v , S , D O f 2 X v , S f 3 X v , S , D O f 4 X v , X s , S , D O = μ k s k e · X v k s · X v μ Y X S + m S · X v K 1 · μ k s k e · X v + K 2 · X v + X s
and
G X u = 0 0 0 K 3 · C s a t D O F a i r
u = F a i r
Dissolved oxygen concentration DO as observation ( k X = D O ).
Compute L F 1 0 k
L F 1 0 k = 0 0 0 1 X v X s S D O = D O
Compute L F 1 1 k
L F 1 1 k = h F = 0 0 0 1 f 1 f 2 f 3 f 4 = f 4 X v   X s   S   D O
Compute L F 2 2 k
L F 2 2 k = L F 1 F = f 4 X v f 4 X s f 4 S f 4 D O f 1 f 2 f 3 f 4 = ψ X v   X s   S   D O
Compute L F 3 3 k
L F 3 3 k = L F 2 F = ψ X v ψ X s ψ S ψ D O f 1 f 2 f 3 f 4 = ϕ X v   X s   S   D O
Construct the observability rank matrix
O = L F 1 0 k L F 1 1 k L F 2 2 k L F 3 3 k = 0 0 0 1 f 4 X v f 4 X s f 4 S f 4 D O ψ X v ψ X s ψ S ψ D O ϕ X v ϕ X s ϕ S ϕ D O
Now, calculate symbolically the corresponding derivatives in the Equations (A5)–(A8).
Then, the Lie derivatives of the model are given by the Equations (A10)–(A21).
Compute L F 1 1 k
L F 1 1 k = h F = 0 0 0 1 f 1 f 2 f 3 f 4 = f 4 X v   X s   S   D O = K 1 · μ k s k e · X v + K 2 · X
Compute L F 2 2 k
L F 2 2 k = L F 1 F = f 4 X v f 4 X s f 4 S f 4 D O f 1 f 2 f 3 f 4 = ψ X v   X s   S   D O
where
f 4 X v = K 1 · μ k s k e K 2 f 4 X v = z 1 S , D O
f 4 X s = K 2 f 4 X s = z 2
f 4 S = K 1 · μ ˙ S k ˙ s f 4 S = z 3 S , D O
f 4 D O = K 1 · μ ˙ D O f 4 D O = z 4 S , D O
and
k s = k s , m a x 1 1 + e x p G s S P s k s , m a x 1 1 + e x p G s S 0 P s k s S = k ˙ s = G s k s , m a x e x p G s P s S 1 e x p G s P s S
μ S , D O = μ m a x S K S + S · D O K d + D O μ S , D O S = μ ˙ S = μ m a x K S K S + S 2 · D O K d + D O ; i f   S 0 μ ˙ S = μ m a x K S K S 2 · D O K d + D O ; μ ˙ S > 0 i f   D O 0 μ ˙ S = μ m a x K S K S + S 2 · 0 ,   b u t   D O 20 %   t h e n , μ ˙ S > 0
Similarly,
S , D O = μ m a x S K S + S · D O K d + D O μ S , D O D O = μ ˙ D O = μ m a x K d K d + D O 2 · S K S + S ; i f   S μ ˙ D O f   D O μ ˙ D O
Remark 3 
 In general, the functions μ S ,   D O   μ ˙ S and μ ˙ D O are complex and do not lead to zero elements in Equation (A9).
Now, Equations (A12)–(A18) L F 2 2 k are as follows:
L F 2 2 k = L F 1 F = z 1 S , D O z 2 z 2 S , D O z 3 S , D O f 1 X v , S , D O f 2 X v , S f 3 X v , S , D O f 4 X v , X s , S , D O = ψ X v   X s   S   D O
or
ψ X v   X s   S   D O = z 1 S , D O f 1 X v , S , D O + z 2 f 2 X v , S + z 3 S , D O z 3 S , D O + z 4 S , D O f 4 X v , X s , S , D O
According to the functionality of the ψ X v   X s   S   D O function, all derivatives exist, i.e., they are not zero.
Compute L F 3 3 k
L F 3 3 k = L F 2 F = ψ X v ψ X s ψ S ψ D O f 1 f 2 f 3 f 4 = ϕ X v   X s   S   D O
Similarly, the derivatives of the ϕ X v   X s   S   D O function give an opportunity to establish that they exist, i.e., they are not zero.
Finally, the determinant d e t O needs to be evaluated to establish that d e t O 0 , i.e., it is nonsingular. In general, the functions ψ X v   X s   S   D O and ϕ X v   X s   S   D O are complex and obtained from the usually nonlinear functions in F and do not lead to zero elements. In bioprocess systems, the d e t O usually gives the constraints for the observability condition.

References

  1. Aguilar-López, R.; Alvarado-Santos, E.; Thalasso, F.; López-Pérez, P.A. Monitoring Ethanol Fermentation in Real Time by a Robust State Observer for Uncertainties. Chem. Eng. Technol. 2024, 47, 779–790. [Google Scholar] [CrossRef]
  2. Aguilar-López, R.; González-Viveros, I.; López-Pérez, P.A. Sinusoidal control strategy applied to continuous stirred-tank reactors: Asymptotic and exponential convergence. Can. J. Chem. Eng. 2024. [Google Scholar] [CrossRef]
  3. Aguilar-López, R.; Mata-Machuca, J.; Martinez-Guerra, R. On the Observability for a Class of Nonlinear (Bio)chemical Systems. Int. J. Chem. React. Eng. 2010, 8. [Google Scholar] [CrossRef]
  4. Alford, J.S. Bioprocess control: Advances and challenges. Comput. Chem. Eng. 2006, 30, 1464–1475. [Google Scholar] [CrossRef]
  5. Alvarez-Ramirez, J.; Meraz, M.; Monroy, O. Mathematical analysis of proportional-integral control for fixed bed bioreactors. J. Chem. Technol. Biotechnol. 1999, 74, 78–84. [Google Scholar] [CrossRef]
  6. Amicarelli, A.; di Sciascio, F.; Toibero, J.M.; Alvarez, H. Including dissolved oxygen dynamics into the Bt δ-endotoxins production process model and its application to process control. Braz. J. Chem. Eng. 2010, 27, 41–62. [Google Scholar] [CrossRef]
  7. Amicarelli, A.; Quintero, O.; di Sciascio, F. Behavior comparison for biomass observers in batch processes. Asia-Pac. J. Chem. Eng. 2014, 9, 81–92. [Google Scholar] [CrossRef]
  8. Arsov, A.; Gerginova, M.; Paunova-Krasteva, T.; Petrov, K.; Petrova, P. Multiple cry Genes in Bacillus thuringiensis Strain BTG Suggest a Broad-Spectrum Insecticidal Activity. Int. J. Mol. Sci. 2023, 24, 11137. [Google Scholar] [CrossRef]
  9. Belmonte-Izquierdo, R.; Carlos-Hernandez, S.; Sanchez, E.N. A new neural observer for an anaerobic bioreactor. Int. J. Neural Syst. 2010, 20, 75–86. [Google Scholar] [CrossRef] [PubMed]
  10. Bolton, L.; Smith, R. On the Role of Material Balances in the Synthesis of Overall Process Control Systems. Process Integr. Optim. Sustain. 2023, 7, 971–987. [Google Scholar] [CrossRef]
  11. Boniolo, F.S.; Rodrigues, R.C.; Prata, A.M.R.; López, M.L.; Jacinto, T.; da Silveira, M.M.; Berbert-Molina, M.A. Oxygen supply in Bacillus thuringiensis fermentations: Bringing new insights on their impact on sporulation and δ-endotoxin production. Appl. Microbiol. Biotechnol. 2012, 94, 625–636. [Google Scholar] [CrossRef] [PubMed]
  12. Bouraoui, I.; Farza, M.; Ménard, T.; Ben Abdennour, R.; M’Saad, M.; Mosrati, H. Observer design for a class of uncertain nonlinear systems with sampled outputs—Application to the estimation of kinetic rates in bioreactors. Automatica 2015, 55, 78–87. [Google Scholar] [CrossRef]
  13. Brunner, V.; Siegl, M.; Geier, D.; Becker, T. Challenges in the Development of Soft Sensors for Bioprocesses: A Critical Review. Front. Bioeng. Biotechnol. 2021, 9. [Google Scholar] [CrossRef] [PubMed]
  14. Caraballo, T.; López-de-la-Cruz, J.; Caraballo-Romero, V. Effects of real random perturbations on Monod and Haldane consumption functions in the chemostat model. Math. Comput. Simul. 2024, 218, 482–497. [Google Scholar] [CrossRef]
  15. Chandra, K.P.B.; Gu, D.-W. Control Systems and State Estimation. In Nonlinear Filtering; Springer International Publishing: Berlin/Heidelberg, Germany, 2019; pp. 1–11. [Google Scholar] [CrossRef]
  16. Christie, L.; Rutherford, S.; Palmer, D.S.; Baker, M.J.; Butler, H.J. Bioprocess monitoring applications of an innovative ATR-FTIR spectroscopy platform. Front. Bioeng. Biotechnol. 2024, 12, 1349473. [Google Scholar] [CrossRef] [PubMed]
  17. Czyżniewski, M.; Łangowski, R. Robust asymptotic super twisting sliding mode observer for non-linear uncertain biochemical systems. J. Process Control. 2024, 136, 103192. [Google Scholar] [CrossRef]
  18. da Costa, A.C.; Lima, E.L.; Alves, T.L.M. Start-up Strategy for Continuous Bioreactors. Braz. J. Chem. Eng. 1997, 14, 167–177. [Google Scholar] [CrossRef]
  19. de Assis, A.J.; Filho, R.M. Soft sensors development for on-line bioreactor state estimation. Comput. Chem. Eng. 2000, 24, 1099–1103. [Google Scholar] [CrossRef]
  20. Demirtas, M.U.; Kolhatkar, A.; Kilbane Ii, J.J. Effect of Aeration and Agitation on Growth Rate of Thermus thermophilus in Batch Mode. J. Biosci. Bioeng. 2003, 95, 113–117. [Google Scholar] [CrossRef]
  21. Díaz Pacheco, A.; Dinorín-Téllez-Girón, J.; Martínez Montes, F.J.; Martínez Tolibia, S.E.; López y López, V.E. On-line monitoring of industrial interest Bacillus fermentations, using impedance spectroscopy. J. Biotechnol. 2022, 343, 52–61. [Google Scholar] [CrossRef] [PubMed]
  22. Du, S.; Wang, W.; Fu, H.; Wan, X. Fault Detection and State Estimation in Automatic Control. Appl. Sci. 2023, 13, 12936. [Google Scholar] [CrossRef]
  23. García-Mañas, F.; Guzmán, J.L.; Berenguel, M.; Acién, F.G. Biomass estimation of an industrial raceway photobioreactor using an extended Kalman filter and a dynamic model for microalgae production. Algal Res. 2019, 37, 103–114. [Google Scholar] [CrossRef]
  24. Grijalva-Hernández, F.; Peña-Caballero, V.; López-Pérez, P.A.; Aguilar-López, R. Estimation of plasmid concentration in batch culture of Escherichia coli DH5α via simple state observer. Chem. Pap. 2018, 72, 2589–2598. [Google Scholar] [CrossRef]
  25. Gu, J.; Ye, R.; Xu, Y.; Yin, Y.; Li, S.; Chen, H. A historical overview of analysis systems for Bacillus thuringiensis (Bt) Cry proteins. Microchem. J. 2021, 165, 106137. [Google Scholar] [CrossRef]
  26. Gupta, V.; Agarwal, R.P. Convergence Estimates in Approximation Theory; Springer: Cham, Switzerland, 2014; Volume 13. [Google Scholar]
  27. Gupta, M.; Kumar, H.; Kaur, S. Vegetative Insecticidal Protein (Vip): A Potential Contender from Bacillus thuringiensis for Efficient Management of Various Detrimental Agricultural Pests. Front. Microbiol. 2021, 12. [Google Scholar] [CrossRef]
  28. Hrnčiřík, P.; Kohout, J. A MATLAB-based simulator for the study of process control of fed-batch yeast fermentations. Educ. Chem. Eng. 2024, 49, 67–77. [Google Scholar] [CrossRef]
  29. Jin, X.-B.; Robert Jeremiah, R.J.; Su, T.-L.; Bai, Y.-T.; Kong, J.-L. The New Trend of State Estimation: From Model-Driven to Hybrid-Driven Methods. Sensors 2021, 21, 2085. [Google Scholar] [CrossRef] [PubMed]
  30. Joshi, H.; Jha, B.K. Generalized Diffusion Characteristics of Calcium Model with Concentration and Memory of Cells: A Spatiotemporal Approach. Iran. J. Sci. Technol. Trans. Sci. 2022, 46, 309–322. [Google Scholar] [CrossRef]
  31. Jurat-Fuentes, J.L.; Crickmore, N. Specificity determinants for Cry insecticidal proteins: Insights from their mode of action. J. Invertebr. Pathol. 2017, 142, 5–10. [Google Scholar] [CrossRef]
  32. Kazantzis, N.; Wright, R.A. Nonlinear observer design in the presence of delayed output measurements. Syst. Control. Lett. 2005, 54, 877–886. [Google Scholar] [CrossRef]
  33. Kemmer, A.; Fischer, N.; Wilms, T.; Cai, L.; Groß, S.; King, R.; Neubauer, P.; Cruz Bournazou, M.N. Nonlinear state estimation as tool for online monitoring and adaptive feed in high throughput cultivations. Biotechnol. Bioeng. 2023, 120, 3261–3275. [Google Scholar] [CrossRef] [PubMed]
  34. Koilybayeva, M.; Shynykul, Z.; Ustenova, G.; Abzaliyeva, S.; Alimzhanova, M.; Amirkhanova, A.; Turgumbayeva, A.; Mustafina, K.; Yeleken, G.; Raganina, K.; et al. Molecular Characterization of Some Bacillus Species from Vegetables and Evaluation of Their Antimicrobial and Antibiotic Potency. Molecules 2023, 28, 3210. [Google Scholar] [CrossRef] [PubMed]
  35. Kumar, P.; Kamle, M.; Borah, R.; Mahato, D.K.; Sharma, B. Bacillus thuringiensis as microbial biopesticide: Uses and application for sustainable agriculture. Egypt. J. Biol. Pest Control 2021, 31, 95. [Google Scholar] [CrossRef]
  36. Lim, H.C.; Shin, H.S. 6- Models Based on Mass Balance Equations. In Fed-Batch Cultures Principles and Application of Semi-Batch Bioreactors; Lim, H.C., Shin, H.S., Eds.; Cambridge University Press: Cambridge, UK, 2013; pp. 85–120. [Google Scholar] [CrossRef]
  37. Longhi, L.G.S.; Marcon, S.M.; Trierweiler, J.O.; Secchi, A.R. State estimation of an experimental bioreactor using the extended kalman filtering technology. IFAC Proc. Vol. 2002, 35, 379–382. [Google Scholar] [CrossRef]
  38. López-Pérez, P.A.; López-López, M.; Núñez-Colín, C.A.; Mukhtar, H.; Aguilar-López, R.; Peña-Caballero, V. A novel nonlinear sliding mode observer to estimate biomass for lactic acid production. Chem. Prod. Process Model. 2023, 18, 565–580. [Google Scholar] [CrossRef]
  39. Lyubenova, V.; Ignatova, M.; Zoteva, D.; Roeva, O. Model-Based Adaptive Control of Bioreactors—A Brief Review. Mathematics 2024, 12, 2205. [Google Scholar] [CrossRef]
  40. Mandenius, C.; Gustavsson, R. Mini-review: Soft sensors as means for PAT in the manufacture of bio-therapeutics. J. Chem. Technol. Biotechnol. 2015, 90, 215–227. [Google Scholar] [CrossRef]
  41. Marafioti, G.; Tebbani, S.; Beauvois, D.; Becerra, G.; Isambert, A.; Hovd, M. Unscented Kalman Filter state and parameter estimation in a photobioreactor for microalgae production. IFAC Proc. Vol. 2009, 42, 804–809. [Google Scholar] [CrossRef]
  42. Maschke, R.W.; John, G.T.; Eibl, D. Monitoring of Oxygen, pH, CO2, and Biomass in Smart Single-Use Shake Flasks. Chem. Ing. Tech. 2022, 94, 1995–2001. [Google Scholar] [CrossRef]
  43. Menara, T.; Baggio, G.; Bassett, D.S.; Pasqualetti, F. Conditions for Feedback Linearization of Network Systems. IEEE Control Syst. Lett. 2020, 4, 578–583. [Google Scholar] [CrossRef]
  44. Mohamed, M. High order Sliding control with High order observer applied on a bioreactor. Przegląd Elektrotechniczny 2024, 1, 188–193. [Google Scholar] [CrossRef]
  45. Mohd Ali, J.; Ha Hoang, N.; Hussain, M.A.; Dochain, D. Review and classification of recent observers applied in chemical process systems. Comput. Chem. Eng. 2015, 76, 27–41. [Google Scholar] [CrossRef]
  46. Moreno, J.A.; Alvarez, J. On the estimation problem of a class of continuous bioreactors with unknown input. J. Process Control 2015, 30, 34–49. [Google Scholar] [CrossRef]
  47. Moreno, J.A.; Dochain, D. Global observability and detectability analysis of uncertain reaction systems. IFAC Proc. Vol. 2005, 38, 37–42. [Google Scholar] [CrossRef]
  48. Noll, P.; Henkel, M. History and Evolution of Modeling in Biotechnology: Modeling & Simulation, Application and Hardware Performance. Comput. Struct. Biotechnol. J. 2020, 18, 3309–3323. [Google Scholar] [CrossRef]
  49. Oliveira, R.; Ferreira, E.C.; Feyo de Azevedo, S. Stability, dynamics of convergence and tuning of observer-based kinetics estimators. J. Process Control 2002, 12, 311–323. [Google Scholar] [CrossRef]
  50. Pappenreiter, M.; Sissolak, B.; Sommeregger, W.; Striedner, G. Oxygen Uptake Rate Soft-Sensing via Dynamic kLa Computation: Cell Volume and Metabolic Transition Prediction in Mammalian Bioprocesses. Front. Bioeng. Biotechnol. 2019, 7. [Google Scholar] [CrossRef] [PubMed]
  51. Peng, Q.; Yu, Q.; Song, F. Expression of cry genes in Bacillus thuringiensis biotechnology. Appl. Microbiol. Biotechnol. 2019, 103, 1617–1626. [Google Scholar] [CrossRef]
  52. Rahmatnejad, V.; Wei, Y.; Rao, G. Recent Developments in Bioprocess Monitoring Systems; Springer: Cham, Switzerland, 2023; pp. 39–66. Available online: https://www.researchgate.net/publication/377318420_Recent_Developments_in_Bioprocess_Monitoring_Systems (accessed on 25 November 2024).
  53. Richards, J.R.; Congalidis, J.P. Measurement and control of polymerization reactors. Comput. Chem. Eng. 2006, 30, 1447–1463. [Google Scholar] [CrossRef]
  54. Rómoli, S.; Amicarelli, A.N.; Ortiz, O.A.; Scaglia, G.J.E.; di Sciascio, F. Nonlinear control of the dissolved oxygen concentration integrated with a biomass estimator for production of Bacillus thuringiensis δ-endotoxins. Comput. Chem. Eng. 2016, 93, 13–24. [Google Scholar] [CrossRef]
  55. Roubíček, T.; Valášek, M. Optimal control of causal differential–algebraic systems. J. Math. Anal. Appl. 2002, 269, 616–641. [Google Scholar] [CrossRef]
  56. Rowe, G.E. Central Metabolism of Bacillus Thuringiensis During Growth and Sporulation. Digitized Thesis, Western University, London, ON, Canada, 1990. Available online: https://ir.lib.uwo.ca/digitizedtheses/1987 (accessed on 25 November 2024).
  57. Rowe, G.E.; Margaritis, A.; Wei, N. Specific oxygen uptake rate variations during batch fermentation of Bacillus thuringiensis subspecies kurstaki HD-1. Biotechnol. Prog. 2003, 19, 1439–1443. [Google Scholar] [CrossRef] [PubMed]
  58. Sanchez-Torres, J.D.; Jimenez-Rodriguez, E.; Isaza, J.A.; Botero, H. An equivalent control-based observer for biomass in a batch process. In Proceedings of the 2017 IEEE 3rd Colombian Conference on Automatic Control (CCAC), Cartagena, Colombia, 18–20 October 2017; pp. 1–5. [Google Scholar] [CrossRef]
  59. Sharabiany, M.G.; Ebrahimkhani, S.; Lataire, J. Nonlinear continuous-time system identification by linearization around a time-varying setpoint. Int. J. Robust Nonlinear Control. 2024. [Google Scholar] [CrossRef]
  60. Singh, D.; Samiksha; Thayil, S.M.; Sohal, S.K.; Kesavan, A.K. Exploration of insecticidal potential of Cry protein purified from Bacillus thuringiensis VIID1. Int. J. Biol. Macromol. 2021, 174, 362–369. [Google Scholar] [CrossRef]
  61. Soberón, M.; Monnerat, R.; Bravo, A. Mode of Action of Cry Toxins from Bacillus thuringiensis and Resistance Mechanisms. In Microbial Toxins; Springer: Dordrecht, The Netherlands, 2016; pp. 1–13. [Google Scholar] [CrossRef]
  62. Sun, Y.; Dong, S.; Zhou, W.; Guo, L.; Guo, G.-L.; Zhang, X. A Comprehensive Review of Secondary Metabolites with Antialgal Activity from Marine Macroalgae against Red Tide Microalgae. J. Coast. Res. 2019, 93, 475. [Google Scholar] [CrossRef]
  63. Valero, C.E.; Bakosova, M. Classic Methodologies in Control of a Yeast Fermentation Bioreactor. In Proceedings of the 2021 23rd International Conference on Process Control (PC), Strbske Pleso, Slovakia, 1–4 June 2021; pp. 200–205. [Google Scholar] [CrossRef]
  64. Wei, Y.; Jiao, Y.; An, D.; Li, D.; Li, W.; Wei, Q. Review of Dissolved Oxygen Detection Technology: From Laboratory Analysis to Online Intelligent Detection. Sensors 2019, 19, 3995. [Google Scholar] [CrossRef] [PubMed]
  65. Winter, M.; Achleitner, L.; Satzer, P. Soft sensor for viable cell counting by measuring dynamic oxygen uptake rate. New Biotechnol. 2024, 83, 16–25. [Google Scholar] [CrossRef] [PubMed]
  66. Yan, S.; Gu, Z.; Park, J.H.; Xie, X.; Sun, W. Distributed Cooperative Voltage Control of Networked Islanded Microgrid via Proportional-Integral Observer. IEEE Trans. Smart Grid 2024, 15, 5981–5991. [Google Scholar] [CrossRef]
  67. Zhu, Y.; Dong, Z.; Huang, X. Neural Network Extended State-Observer. In Proceedings of the 2022 China Automation Congress (CAC), Xiamen, China, 25–27 November 2022; pp. 5104–5109. [Google Scholar] [CrossRef]
  68. Zuluaga-Bedoya, C.C.; Amicarelli, A.; Gómez, L.M.; di Sciascio, F. Bacillus thuringiensis process design using state controllability index. In Proceedings of the 2015 XVI Workshop on Information Processing and Control (RPIC), Cordoba, Argentina, 6–9 October 2015; pp. 1–6. [Google Scholar] [CrossRef]
Figure 1. Block diagram of bioreactor.
Mathematics 12 03996 g001
Figure 2. Information flow diagram for simulation test setup for the proposed observer. The part within the red, dashed area is called the observer.
Mathematics 12 03996 g002
Figure 3. Dynamic response of the state variables of the B. thuringiensis process: vegetative cells X v , sporulated cells X s , substrate balance S , and dissolved oxygen D O . Initial conditions:   X 0 = X t = 0 X X v 0 = 0.425   g / L , X s 0 = 0 ,   20   g / L O D 0 32   g / L , S 0 = 0.00759   g / L . (a) the production of vegetative cells occurred in the exponential growth phase; (b) sporulated biomass; (c) substrate; (d) dissolved oxygen.
Mathematics 12 03996 g003
Figure 4. Measurement of oxygen concentration. Dynamic response of the state variables of the B. thuringiensis process: dissolved oxygen, D O , with initial conditions X 0 = X t = 0 X X v 0 = 0.425   g / L , X s 0 = 0 ,   20   g / L O D 0 32   g / L , S 0 = 0.00759   g / L   .
Mathematics 12 03996 g004
Figure 5. Phase diagram for vegetative cells, sporulated cells, and substrate concentrations for four initial conditions of substrate concentration in the fermentation.
Mathematics 12 03996 g005
Figure 6. Observer performance: link position (solid curves or black lines) and its estimate (broken curves). Dissolved oxygen (a), vegetative cells, sporulated cells, and substrate estimation (b); see Code T1 in Table 7.
Mathematics 12 03996 g006
Figure 7. Observer performance: link position (solid curves or black lines) and its estimate (broken curves). Dissolved oxygen (a) and vegetative cells, sporulated cells, and substrate estimation (b) (see Code T2 in Table 7).
Mathematics 12 03996 g007
Figure 8. Observer performance: link position (solid curves or black lines) and its estimate (broken curves). Dissolved oxygen (a) and vegetative cells, sporulated cells, and substrate estimation (b) (see Code T3 in Table 7).
Mathematics 12 03996 g008
Figure 9. Observer performance: link position (solid curves or black lines) and its estimate (broken curves). Dissolved oxygen (a), vegetative cells, sporulated cells, and substrate estimation (b) (see Code T4 in Table 7).
Mathematics 12 03996 g009
Figure 10. Observer performance: link position (solid curves or black lines) and its estimate (broken curves). Dissolved oxygen (a), vegetative cells, sporulated cells, and substrate estimation (see code T5 in Table 7) (b), and integral of time-multiplied squared error criterion (c).
Mathematics 12 03996 g010
Table 1. Examples of some state estimators/algorithms (software sensors) designed to estimate unmeasured (or difficult to measure) variables of a bioprocess.
Observer Design
(Type)
MicroorganismBioprocesses Reference
Kalman filterKluyveromyces marxianus yeast
(β-galactosidase enzyme)
Biochemical reactor[23]
Extended Kalman filter (EKF)MicroalgaeBiotechnological processes (photobioreactors)[24]
Unscented Kalman filter (UKF) (state and parameter estimation)Microalgae (biomass estimation)Biotechnological processes (photobioreactors)[25]
Cubature Kalman filter (CKF)Estimation for penicillinBiotechnological processes [26]
Linear observer Biological reactor[27]
Nonlinear observerYeats Fed-batch reactor for ethanol production[28,29]
Sliding-mode observerδ-endotoxin production of Bacillus thuringiensisBatch bioprocess[30,31]
Neural observerAnaerobic digestion processAnaerobic process for paper mills’ effluent treatment[32]
Adaptive observerEstimation of the biomass concentration (Escherichia coli)Sigma-Point Kalman filter[33]
Modeling Biotechnology: modeling and simulationIn bioprocessDifferent bioprocesses[34,35]
Control of a bioreactorYeast fermentation [11]
Table 2. The nominal parameters of a B. thuringiensis model [16,42].
SymbolDescriptionValueUnits
S Substrate concentration g · L 1
D O Dissolved oxygen g · L 1
t Time 0 25 [ h ]
X S Sporulated cells’ concentration g · L 1
X V Vegetative cells’ concentration g · L 1
X Total cell concentration g · L 1
μ Specific growth rate [ h 1 ]
μ m a x Maximum specific growth rate 0.65 [ h 1 ]
m S Maintenance constant 0.005 g   s u b s t r a t e · h 1 · g c e l l s 1
k S Kinetic constant representing the spore formation [ h 1 ]
k e Cell death specific rate [ h 1 ]
K S Saturation constant 3 g · L 1
Y X / S Growth yield 0.37 g   s u b s t r a t e · g c e l l s 1
F a i r Inlet volumetric flow rate of air1800 L · h 1
K L a Volumetric oxygen transfer coefficient h 1
k s , m a x Maximum kinetic constant representing the spore formation0.5 [ h 1 ]
G s Exponential parameter for spore formation1 g · L 1 1
P s Parameter for spore formation1 g · L 1
k e , m a x Maximum death cell specific rate0.1 [ h 1 ]
G e Exponential parameter for death rate5 [ h 1 ]
P e Parameter for death rate4.9 h
C D O * O 2 saturation concentration (OD concentration in equilibrium with the oxygen partial pressure of the gaseous phase)0.00759 g · L 1
K 1 Oxygen consumption constant by growth 3.795 × 10 3
K 2 Oxygen consumption constant for maintenance 0.729 × 10 3 [ h 1 ]
K 3 Ventilation constant 2.114 × 10 3 [ L 1 ]
Table 3. Assumptions for observer design in Equations (15) and (16).
Assumption/DefinitionRemarkReference
A2.
F X t , θ F X ^ t , θ F
It is a realistic assumption based on a mass conservation principle.[58]
A3.
γ 1 γ 2 F <
Select the parameters g1 and g2 to obey the restriction.[56,58]
D.
d E t d t = x ˙ x ^ ˙
Dynamic error.
Table 4. Laplace theorems for Equation (19).
Definition No. L f s F t
1 s · F s F 0 d F t d t
2 F s s 0 t F U · d U
Table 5. Accumulation oxygen rate in the liquid phase in B. thuringiensis cultures for a first stage characterized by its vegetative growth and a second stage called the sporulation phase (life cycle for production of insecticidal crystal proteins known as δ-endotoxins).
S 0   =   S 0   [g/L] d C L d t = O T R     O U R   1
[g/L h]
Slope of the Line/Coefficient of Determination   R 2 )
d C L d t   =   O T R     O U R   1
[g/L h]
Slope of the Line/Coefficient of Determination   R 2 )
Process lines (slope of the line in Figure 4)Exponential growth (first stage, see Figure 4) 2,3Sporulation (second stage, see Figure 4) 2,3Reference
20
Batch
l 1 , l 5
± 0.0009 / ( R 2 = 0.9999 ) + 0.0013 / ( R 2 = 0.9988 ) In this work
(see Figure 4)
25
Batch
l 2 , l 6
± 0.0011 / ( R 2 = 0.9995 ) + 0.0041 / ( R 2 = 0.9944 ) In this work
(see Figure 4)
30
Batch
l 3 , l 7
± 0.0012 / ( R 2 = 0.999 ) + 0.0056 / ( R 2 = 0.9968 ) In this work
(see Figure 4)
31.5
Batch
l 4 , l 8
± 0.0012 / ( R 2 = 0.997 ) + 0.0054 / ( R 2 = 0.9898 ) In this work
(see Figure 4)
Run 10
12
± 0.0036 / ( R 2 = 0.998 ) + 0.0026 / ( R 2 = 0.9895 ) [63]
Run 11
12
± 0.0036 / ( R 2 = 0.999 )
± 0.0048 / ( R 2 = 0.995 )
± 0.0048 / ( R 2 = 0.998 )
± 0.0028 / ( R 2 = 0.996 )
[63]
Run 12
12
+ 0.0026 / ( R 2 = 0.9895 ) ± 0.0015 / ( R 2 = 0.998 ) [63]
1 In this Table 5: d C L d t = the accumulation oxygen rate in the liquid phase; O T R = the oxygen transfer rate from the gas to the liquid = K L a C L * C L , with K L a being the volumetric mass transfer coefficient, C L * the saturation concentration in the liquid phase, and C L the oxygen concentration in the liquid phase; O U R = the oxygen uptake rate by B. thuringiensis = q O 2 C x , where q O 2 is the specific oxygen uptake rate of the microorganism employed and C x is the biomass concentration. 2 Only in the time domain for the first-order consumption and transfer reaction, i.e., when the oxygen concentration is a function of time; see Figure 2. 3 The sign + refers to the “supply” because of K L a , and refers to the oxygen demand by B. thuringiensis cells. Model of a benchmark batch reactor with B. thuringiensis (numerical experiments).
Table 6. Observability test results for different measures of the output variable [52].
Measurement
y t   =   C X t   =   i
(Equation (5))
i ; i   =   1 , 2 , , 4
Matrix   O   (Equation (8))
i y t = C = r a n k O =
1 X v 1 0 0 0 4
2 X s 0 1 0 0 4
3 S 0 0 1 0 4
4 D O 0 0 0 1 4
Table 7. Tests for the estimation of vegetative cells, sporulated cells, and substrate concentrations via a nonlinear observer (Equations (1a–d), (2a–c), (3) and (15), as well as Figure 2).
Test CodeFigure No.System
(Estimator)
Parameter
Disturbance
μ m a x :
Nominal Value 0.53 1/h
Initial Conditions:
X ( 0 )   =   X 0   =   X v 0   X s 0   S 0   D O 0   +   W h i t e   N o i s e
X v 0 X s 0 S 0 D O + N o i s e
N o i s e = o f f : 0 o n : 1
T16a,bModel 0   h t 25   h
μ m a x = 0.53
0.425 0 20 0.00759 + 0
ELO
PO
T27a,bModel 0   h t 5.5   h t 3
5.5   h t 25   h t 0
0.425 0 20 0.00759 + 0
ELO
PO
T38a,bModel 0   h t 25   h
μ m a x = 0.53
0.425 0 20 0.00759 + 1
ELO
PO
T49a,bModel 0   h t 5.5   h t 3
5.5   h t 25   h t 0
0.425 0 20 0.00759 + 1
ELO
PO
T510a–cModel 0   h t 5.5   h t 3
5.5   h t 25   h t 0
0.425 0 20 0.00759 × 0.3 + 1
ELO
PO
ELO, extended Luenberger observer; PO, proposed estimator.
Disclaimer/Publisher’s Note: The statements, opinions and data contained in all publications are solely those of the individual author(s) and contributor(s) and not of MDPI and/or the editor(s). MDPI and/or the editor(s) disclaim responsibility for any injury to people or property resulting from any ideas, methods, instructions or products referred to in the content.