Article

Network Long-Term Evolution Quality of Service Assessment Using a Weighted Fuzzy Inference System

by
Julio Ernesto Zaldivar-Herrera
1,
Luis Pastor Sánchez-Fernández
1,* and
Luis Manuel Rodríguez-Méndez
2
1
Centro de Investigación en Computación, Instituto Politécnico Nacional, Av. Juan de Dios Bátiz s/n, Nueva Industrial Vallejo, Gustavo A. Madero, Mexico City 07738, Mexico
2
Escuela Superior de Ingeniería Mecánica y Eléctrica Zacatenco, Instituto Politécnico Nacional, Mexico City 07738, Mexico
*
Author to whom correspondence should be addressed.
Mathematics 2024, 12(24), 3985; https://doi.org/10.3390/math12243985
Submission received: 27 November 2024 / Revised: 15 December 2024 / Accepted: 16 December 2024 / Published: 18 December 2024
(This article belongs to the Section D2: Operations Research and Fuzzy Decision Making)

Abstract

:
The United Nations has pushed for improved mobile connectivity, ensuring that 97% of the world’s population lives within reach of a mobile cellular signal. This is within the framework of objective nine regarding industry, innovation, and infrastructure for sustainable development. The next challenge is for users to know the quality of this service. The Long-Term Evolution (LTE) network’s quality of service (QoS) is evaluated with key performance indicators (KPI) that only specialists can interpret. This work aims to assess the QoS and effectiveness of the fourth-generation (4G) LTE network using a weighted fuzzy inference system. Analytic Hierarchy Process (AHP) is integrated to rank the fuzzy rules. The KPIs that are considered for the evaluation are download speed, upload speed, latency, jitter, packet loss rate, reference received signal power (RSRP), and reference received signal quality (RSRQ). The evaluated data were collected collaboratively with end-user equipment (UEs). Different usage scenarios are contemplated to define the importance according to the positive impact of the QoS of the LTE mobile network. The advantage of the weighted fuzzy inference system concerning the fuzzy inference system is that each KPI is assigned a different weight, which implies having rules with hierarchies. In this way, the weighted fuzzy inference system provides two indices of quality and effectiveness. It can be a valuable tool for end users and regulatory bodies to identify the quality of the LTE mobile network.

1. Introduction

Mobile network operators (MNOs) face the challenge of growing user numbers. They demand multiple data and high speeds for various applications, such as high-quality content streaming and the ability to work remotely effectively. Therefore, the challenge for MNOs is to ensure a reliable and high-quality experience for users on the mobile network [1,2]. The mobile broadband network’s quality of service (QoS) is improved by having quality control and network performance monitoring [3,4]. In addition, it impacts the quality perceived by the user (QoE). Therefore, an alternative to evaluating the quality of service (QoS) of Long-Term Evolution (LTE) mobile networks is through crowdsourcing measurements with end-user equipment (UE) [5,6,7].
On the other hand, the fifth generation 5G network is being implemented in two phases or two deployment approaches. The first approach is 5G Non-Standalone (NSA) or 5G NSA; it consists of deploying 5G on the 4G infrastructure. Therefore, the existing fourth-generation (4G) infrastructure is being used. The second approach is 5G standalone (SA) or 5G SA, whose Next-Generation Core Network (NGCN) network core is based on network software and the cloud; it is a unique development for 5G without the need to adapt legacy technologies [8,9]. In addition, according to the Global Mobile Suppliers Association (GSA), 94 mobile network operators in 48 countries worldwide had invested in 5G SA networks as of November 2021 [10,11]. Mexico has decided to start differently and implemented the first 5G NSA approach [9,12]. To date, no open data have been found on this network implemented in Mexico that allows the development of the QoS evaluation of the 5G network, so it has been decided to continue working with data from the 4G network.
Various research focus on presenting reviews and analyses of state-of-the-art networks to understand or solve the problems and challenges faced by mobile networks such as 5G or later. For example, the state-of-the-art coexistence between traffic in the enhanced mobile broadband (eMBB) and ultra-reliable low latency communication (URLLC) scenarios for resource scheduling has been investigated [13]. On the other hand, a review of transfer management in future ultra-dense mobile networks has been carried out, finding methodologies, such as dual connectivity (DC) and handover management algorithms, that have the potential to be used in improving data speed, coverage, and spectral efficiency [14]. Similarly, the analysis of the standardization activities in 3rd generation partnership program (3GPP) and open–radio access network (O-RAN) for artificial intelligence and machine learning (AI/ML) applications and the future technological trends of AI/ML in mobile systems was carried out, to improve the KPIs between the network and the UE [15].
Among the works that aim to improve mobile networks, a service classifier using ML based on supervised learning (SL) is proposed, making use of the KPIs and key quality indicators (KQIs) of the different services to improve the management of 5G and beyond 5G (B5G) networks [16]. Meanwhile, in [17], a hidden Markov model (HMM) is proposed to proactively predict cellular degradation using KPI real-time time series data. On the other hand, to optimize the handover control parameters (HCP) configurations based on the network experiences experienced by UEs in 5G network mobility, an artificial intelligence multiple linear regression algorithm (AI-MLR) is proposed [18]. To support the future implementation of large-scale 5G network performance in vehicular services, the design, development, and evaluation of four categories of 5G-enabled services/use cases in the Transport vertical were proposed [19]. Similarly, a mobile network simulator is presented with the realistic recreation of the dual-link enabled Hybrid Vehicular Network (HNV) in a simulator running with dual-link radio access technologies (RATs), in addition to proposing a parameterized data traffic steering algorithm [20]. Finally, proposing the use of multi-attribute decision-making based on fuzzy logic (MADM-FL), a scalable video coding—Dynamic adaptive streaming over HTTP (SVDC-DASH) method is presented over the vehicular environment based on the Multi-access Edge Computing (MEC) architecture [21]. These works are an excellent contribution to emerging mobile networks.
Regarding the QoS of mobile networks, several researchers have proposed various methodologies. First, a machine learning (ML) model is proposed that analyzes the vertical sector quality of service and predicts the degradation of the perceived quality (QoP) in the next 5 min [22]. Second, a cost-effective hybrid analytical model was proposed to obtain the user quality index (UQI) and know the quality perceived by the user of the eMBB scenario in the 5G SA network. ML and statistical tools were applied [9]. Third, to provide a better QoS, the cubic Hermit spline (CHS) method is applied, which allows knowing the impact of the KPIs on a key quality indicator (KQI) [23]. Finally, to know the characteristics of the QoS in the flow transfer between the Ethernet Time-Sensitive Networks (TSN) network exchange and 5G, a QoS mapping algorithm (QoS-MAN) is proposed [24]. Although these investigations are valuable for improving QoS, they focus on benefiting mobile network operators and not users.
Particularly for the LTE mobile network, different investigations have addressed the evaluation of the quality of service of the LTE mobile network, such as the study of graphical comparisons of the key performance indicators (KPI) with the signal parameters [25], as well as other works that aim to improve the quality of service and the quality of experience during video transmission by evaluating different configurations [26,27,28,29,30]. However, their main objective is to serve mobile network operators (MNOs), not users.
In addition, other works focus on optimizing LTE mobile networks using various computational models and simulation-based techniques. For example, improvements in downlink scheduling aim to optimize resource allocation using algorithms such as Knapsack and Priority-only [31]. The QoS-aware downlink scheduling algorithm (QuAs) improves the user-perceived quality of service (QoE) at the network edge [32]. Simulators are often used to assess network capacity and propose improvements in the scheduling process, which affects QoS and QoE, leading to increased spectral efficiency [33,34,35,36,37]. In handover scenarios, Sugeno-type fuzzy models have been applied to evaluate KPIs in LTE networks, with comparisons made against adaptive neuro-fuzzy inference systems (ANFIS) tailored for QoS [38,39]. The results of these simulations are often based on non-real-world data, which can lead to a discrepancy with real-world conditions [38,39].
It represents a significant challenge when designed with numerous inputs and membership functions in fuzzy inference systems [40]. The design of the FIS can be based on expert knowledge, data, or a hybrid using expert knowledge and data [41]. In particular cases, expert knowledge is applied when data are insufficient [42]. Models based on expert knowledge are a good candidate for evaluations of different specific domains and are interpretable for users (non-experts) [43].
On the other hand, the Analytic Hierarchy Process (AHP) is a multi-criteria decision-making method developed by Thomas L. Saaty [44]. It allows for interpreting levels of importance in mathematical weights that amplify or reduce the behavior of each proper parameter in a decision system [45]. In other words, AHP sections the problem into hierarchies of decision elements [46]. At each hierarchical level, the weights of the components are calculated. The final decision is made based on these weights [44]. The fuzzy inference system (FIS) uses the weights to hierarchize the fuzzy rules according to the importance given to each parameter [47]. Several investigations have applied the weighted fuzzy inference system to evaluate air quality, the environmental risk of artificial nanomaterials, water quality, beach tourism factors, and the safety of coastal sites, among other things [47,48,49,50,51,52].
Within mobile networks, a simple additive weighting (SASAW) vertical handover algorithm based on the signal-to-interference ratio (SINR) and AHP has been proposed, allowing the consideration of the QoS of different attributes according to the traffic [46]. Although a good performance is achieved for the network and the user, this work uses simulated data. On the other hand, a multiple handover parameter selection system has been proposed, using the AHP and FIS to determine when the handover is activated between an LTE and Worldwide Interoperability for Microwave Access (WiMAX) network [53]. The relevance of this work prioritizes the connectivity between heterogeneous networks, giving more importance to the base stations than to the users.
This paper proposes a new solution for evaluating the quality of service and the effectiveness of data transfer in the LTE mobile network. A FIS is proposed, taking into account that LTE network users mostly use over-the-top (OTT) applications [54]. Therefore, it is decided to assign levels of importance to the KPIs according to their relevance to the performance of these applications [55].
  • In this FIS, the International Telecommunication Union (ITU)-recommended QoS KPIs are evaluated using a weighted fuzzy inference system, which will allow for the identification of desirable quality situations from the different combinations between the KPIs.
  • The Analytic Hierarchy Process identifies the importance of each KPI in the form of a weight for each rule, increasing the efficiency of the evaluation.
  • Finally, two indices are obtained for evaluating the QoS and the effectiveness of data transfer in the LTE network, in a range of [0–1] consistent with the QoE, Very good, Good, Acceptable, Poor, or Very Poor.
This work is organized as follows: Section 2 presents the Materials and Methods, followed by the Results in Section 3, and the discussion in Section 4. Finally, Section 5 presents the conclusions.

2. Materials and Methods

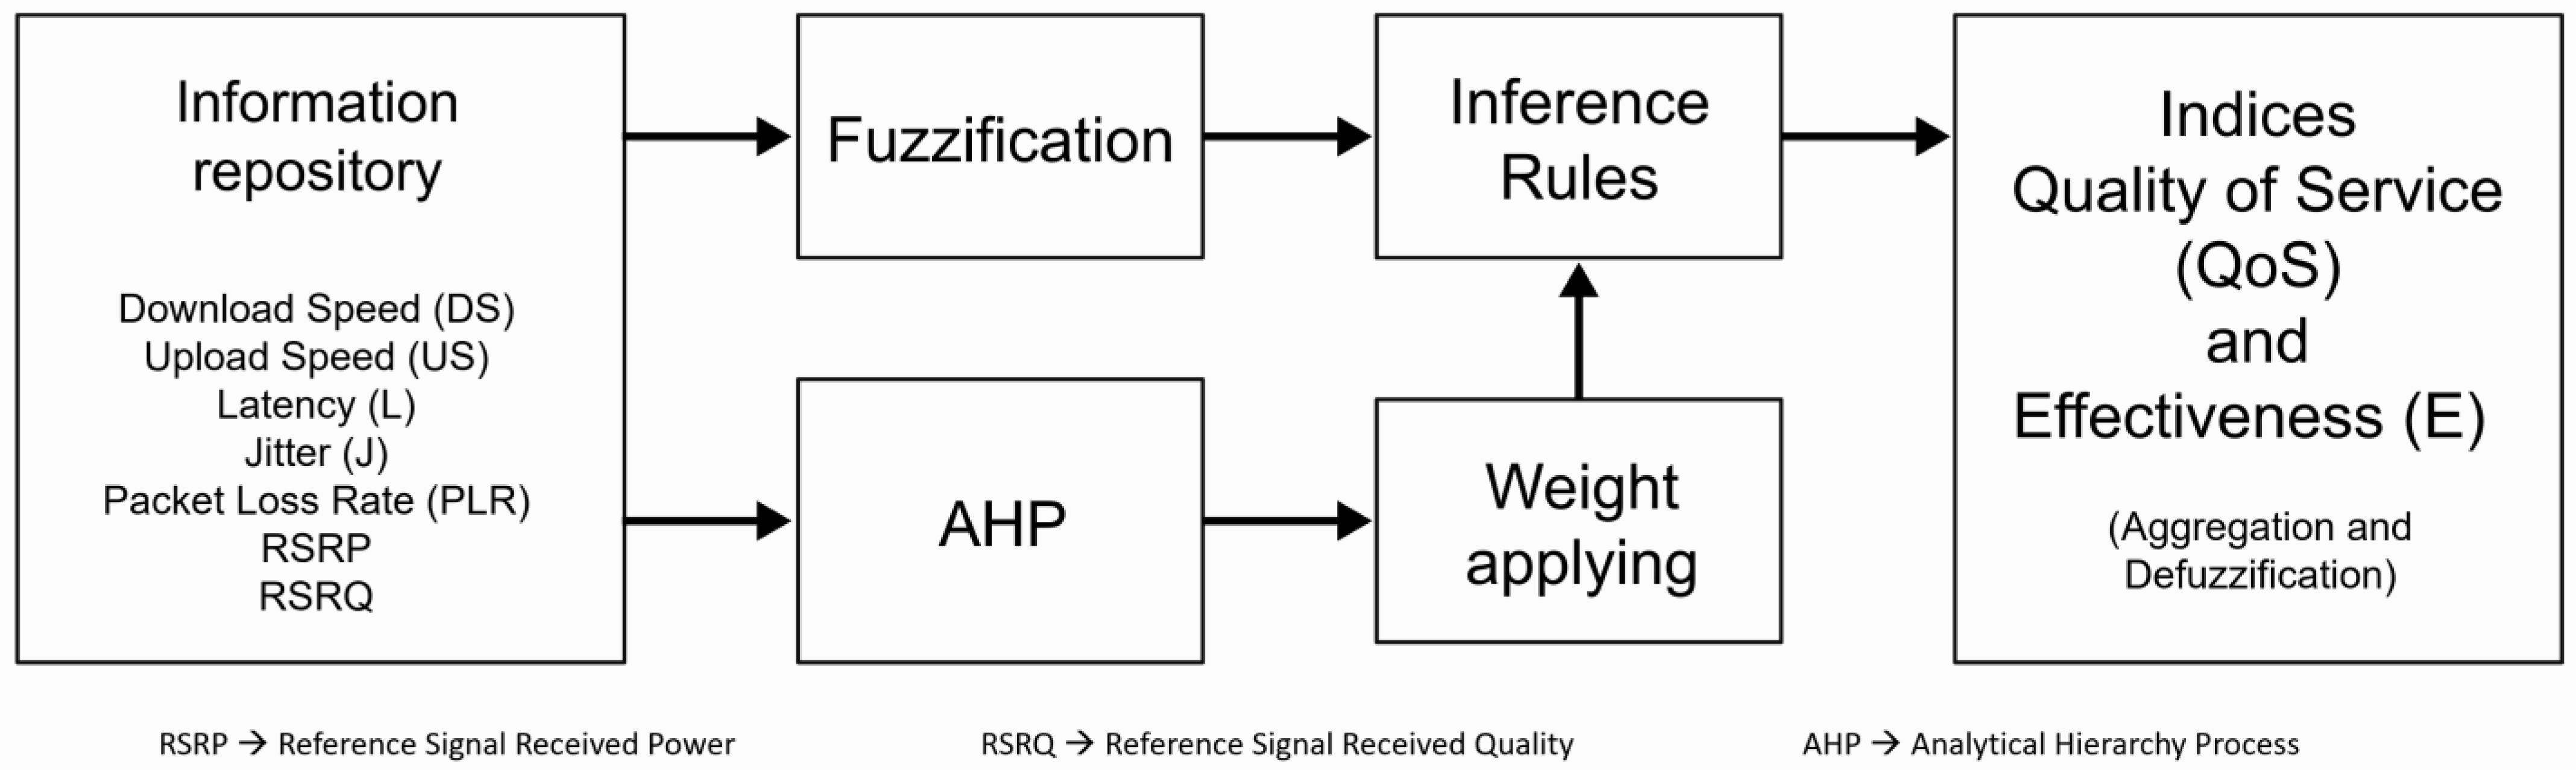
The proposed methodology is shown in the block diagram in Figure 1, inspired by [47,
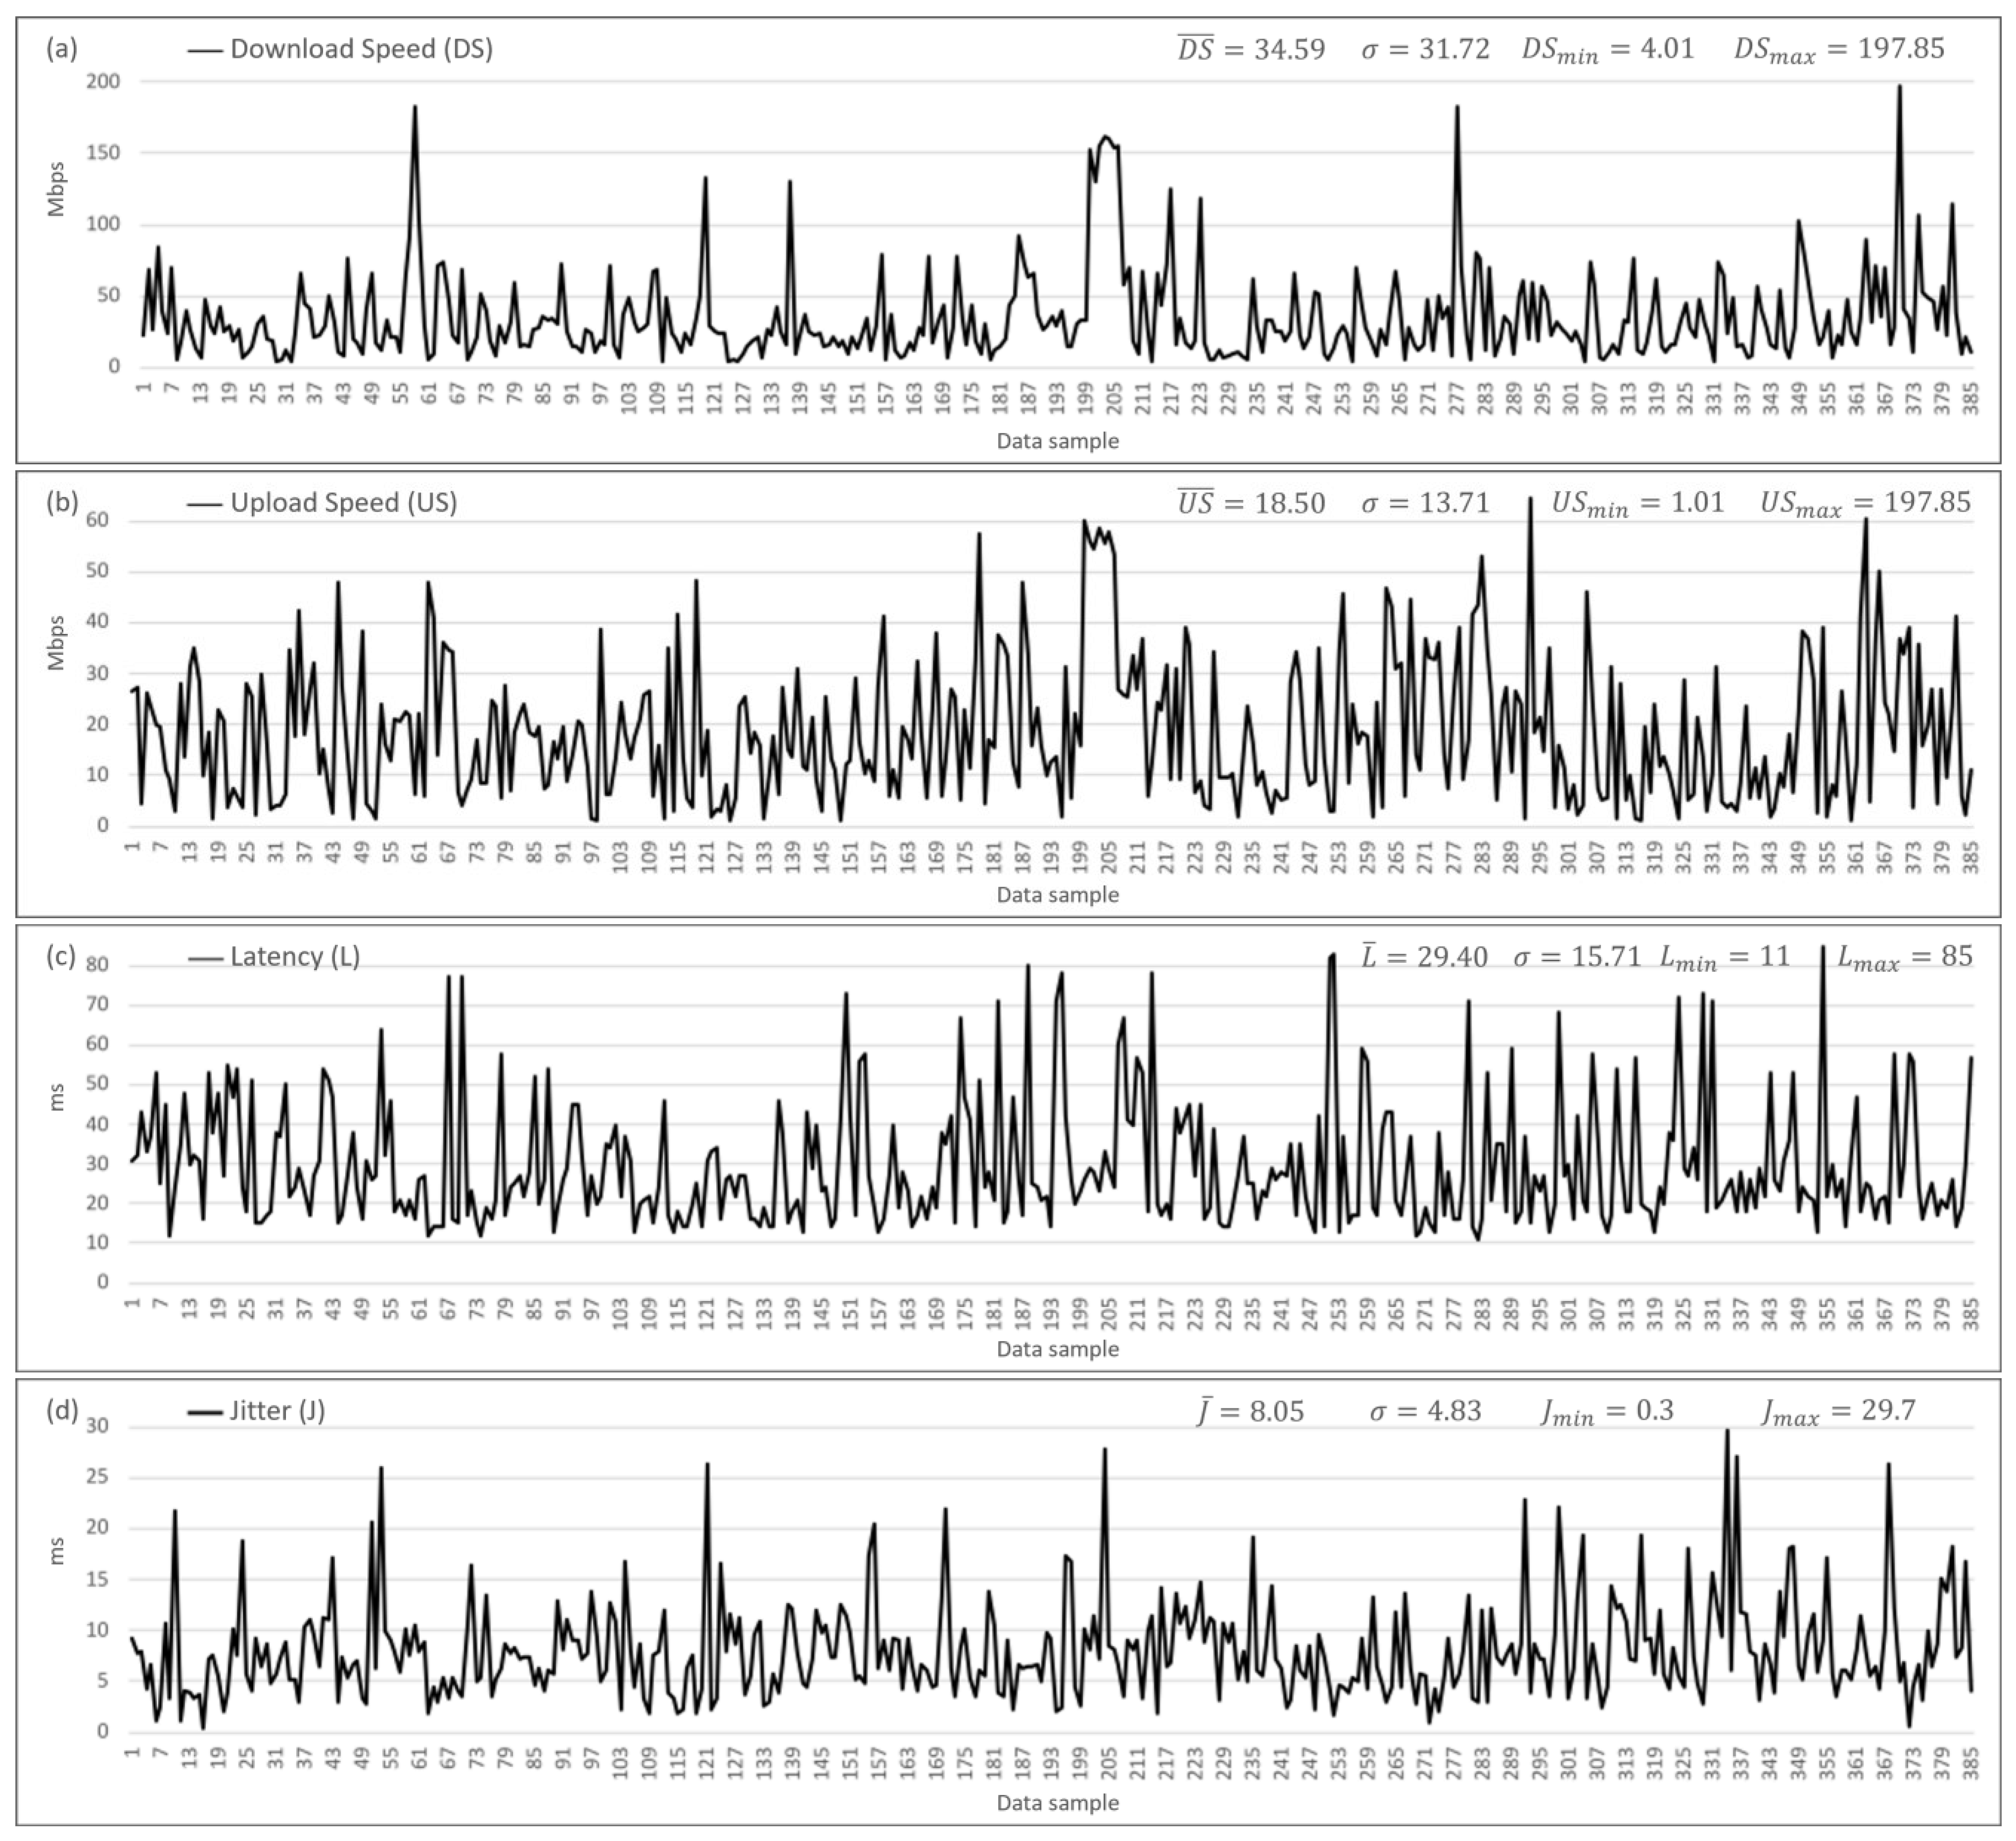
49]. In the first block, reference is made to the information repository collected through crowdsourcing with user equipment (UE). The KPIs recommended by the ITU for the evaluation of the QoS of the LTE network are shown: download speed (DS), upload speed (US), latency (L), jitter (J), packet loss rate (PLR), the reference received signal power (RSRP), and the reference received signal quality (RSRQ). Next is the fuzzification block, where each input’s membership functions and membership degrees are determined. Then, the inference rules block is observed, and the fuzzy rules are proposed based on expert knowledge. On the other hand, the analytical hierarchy process block proposes the importance of weighting for each input KPI, aiming to obtain the importance weights corresponding to the weight application block, which are to be applied to the fuzzy rules. Finally, in the last block, the QoS and Effectiveness indices are obtained through Aggregation and Defuzzification. Each of the blocks is detailed in Section 2.1, Section 2.2, Section 2.3, Section 2.4, Section 2.5 and Section 2.6.
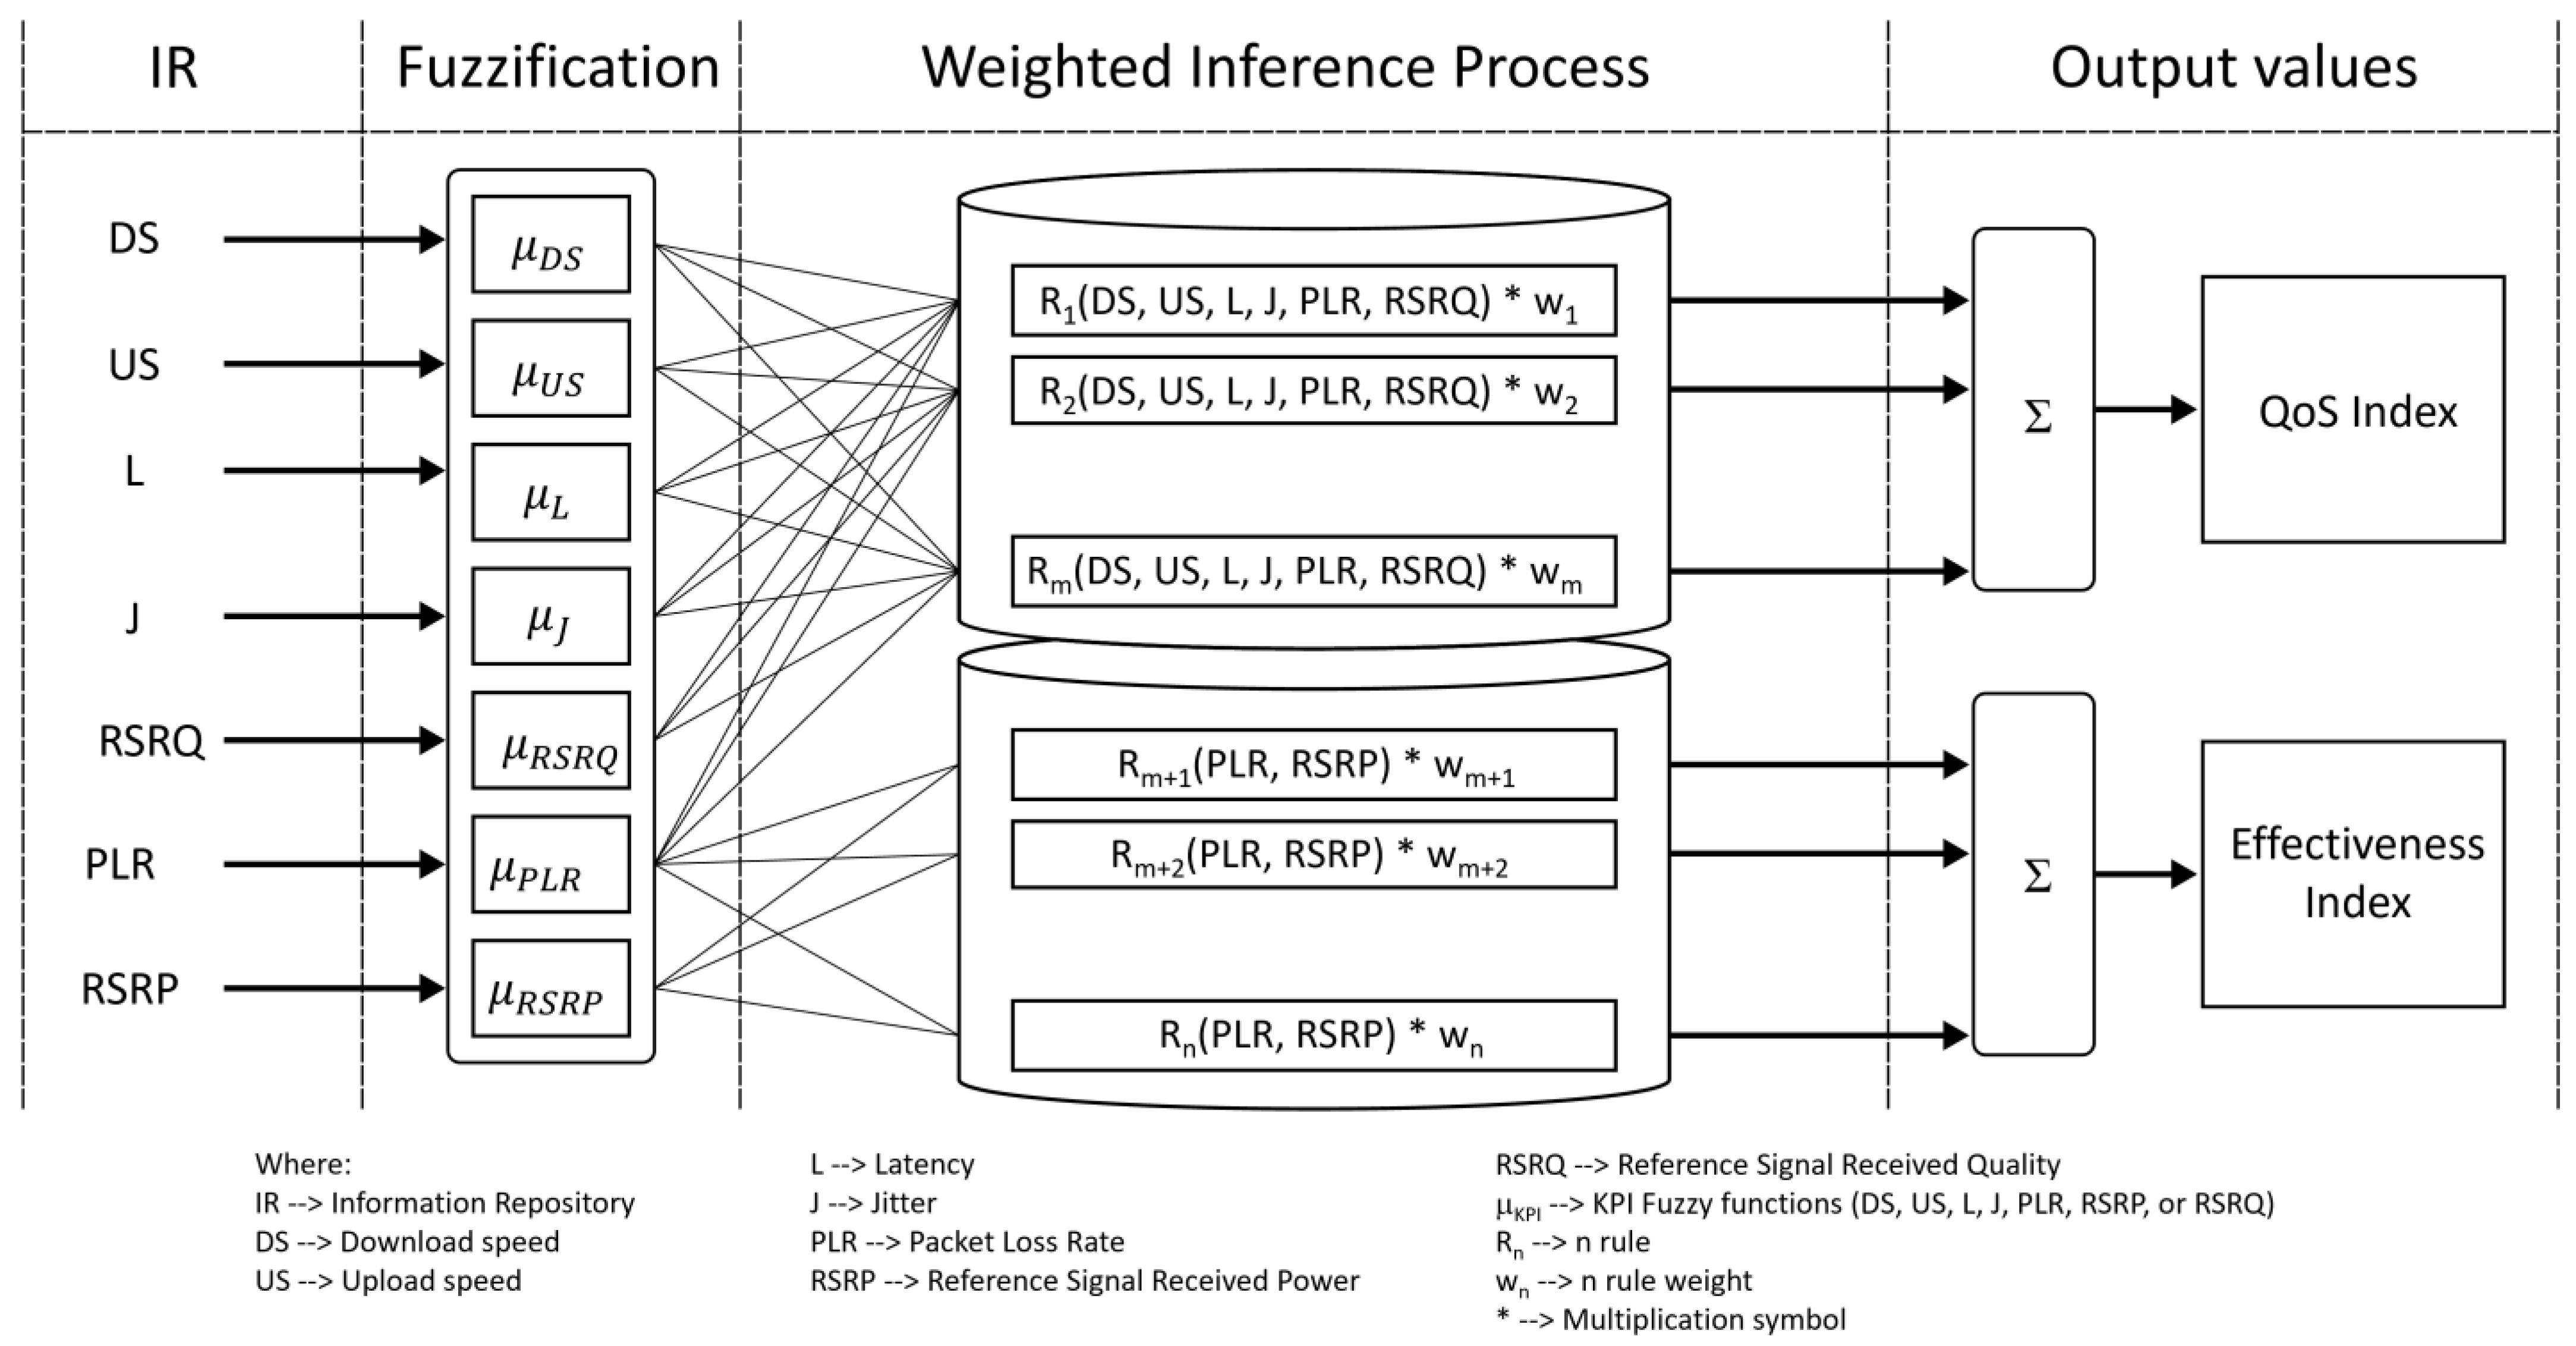
Figure 2 presents a complementary diagram to the block diagram in Figure 1, detailing the architecture of the weighted fuzzy inference system. The first column contains the information repository (IR), where the input variables (KPI) used to obtain the fuzzy QoS index are DS, US, L, J, RSRQ, and PLR. The input variables for the fuzzy effectiveness index are PLR and RSRP. The second column shows the fuzzification, where each input KPI’s functions and degrees of membership are determined, with three linguistic variables for each: Low, Medium, and High. Next, in the third column, the Weighted Inference Process is observed. Here, the fuzzy rules are proposed as follows: 433 to obtain the fuzzy QoS index and 9 for the effectiveness index. In addition, the weight vector or eigenvector corresponding to the input variables is obtained for each output index. For quality of service, important comparisons between DS, US, L, J, PLR, and RSRQ are considered, while for effectiveness, importance comparisons between PLR and RSRP are considered. Subsequently, the result of each fuzzy rule is multiplied by the weight of the KPI that determines that same rule (weight that applies). Finally, in the output values column, the quality of service and effectiveness indices are obtained with aggregation and defuzzification. The above is detailed in Section 2.1, Section 2.2, Section 2.3, Section 2.4, Section 2.5 and Section 2.6.

2.1. Information Repository

The information repository used in this research is the same one used in [
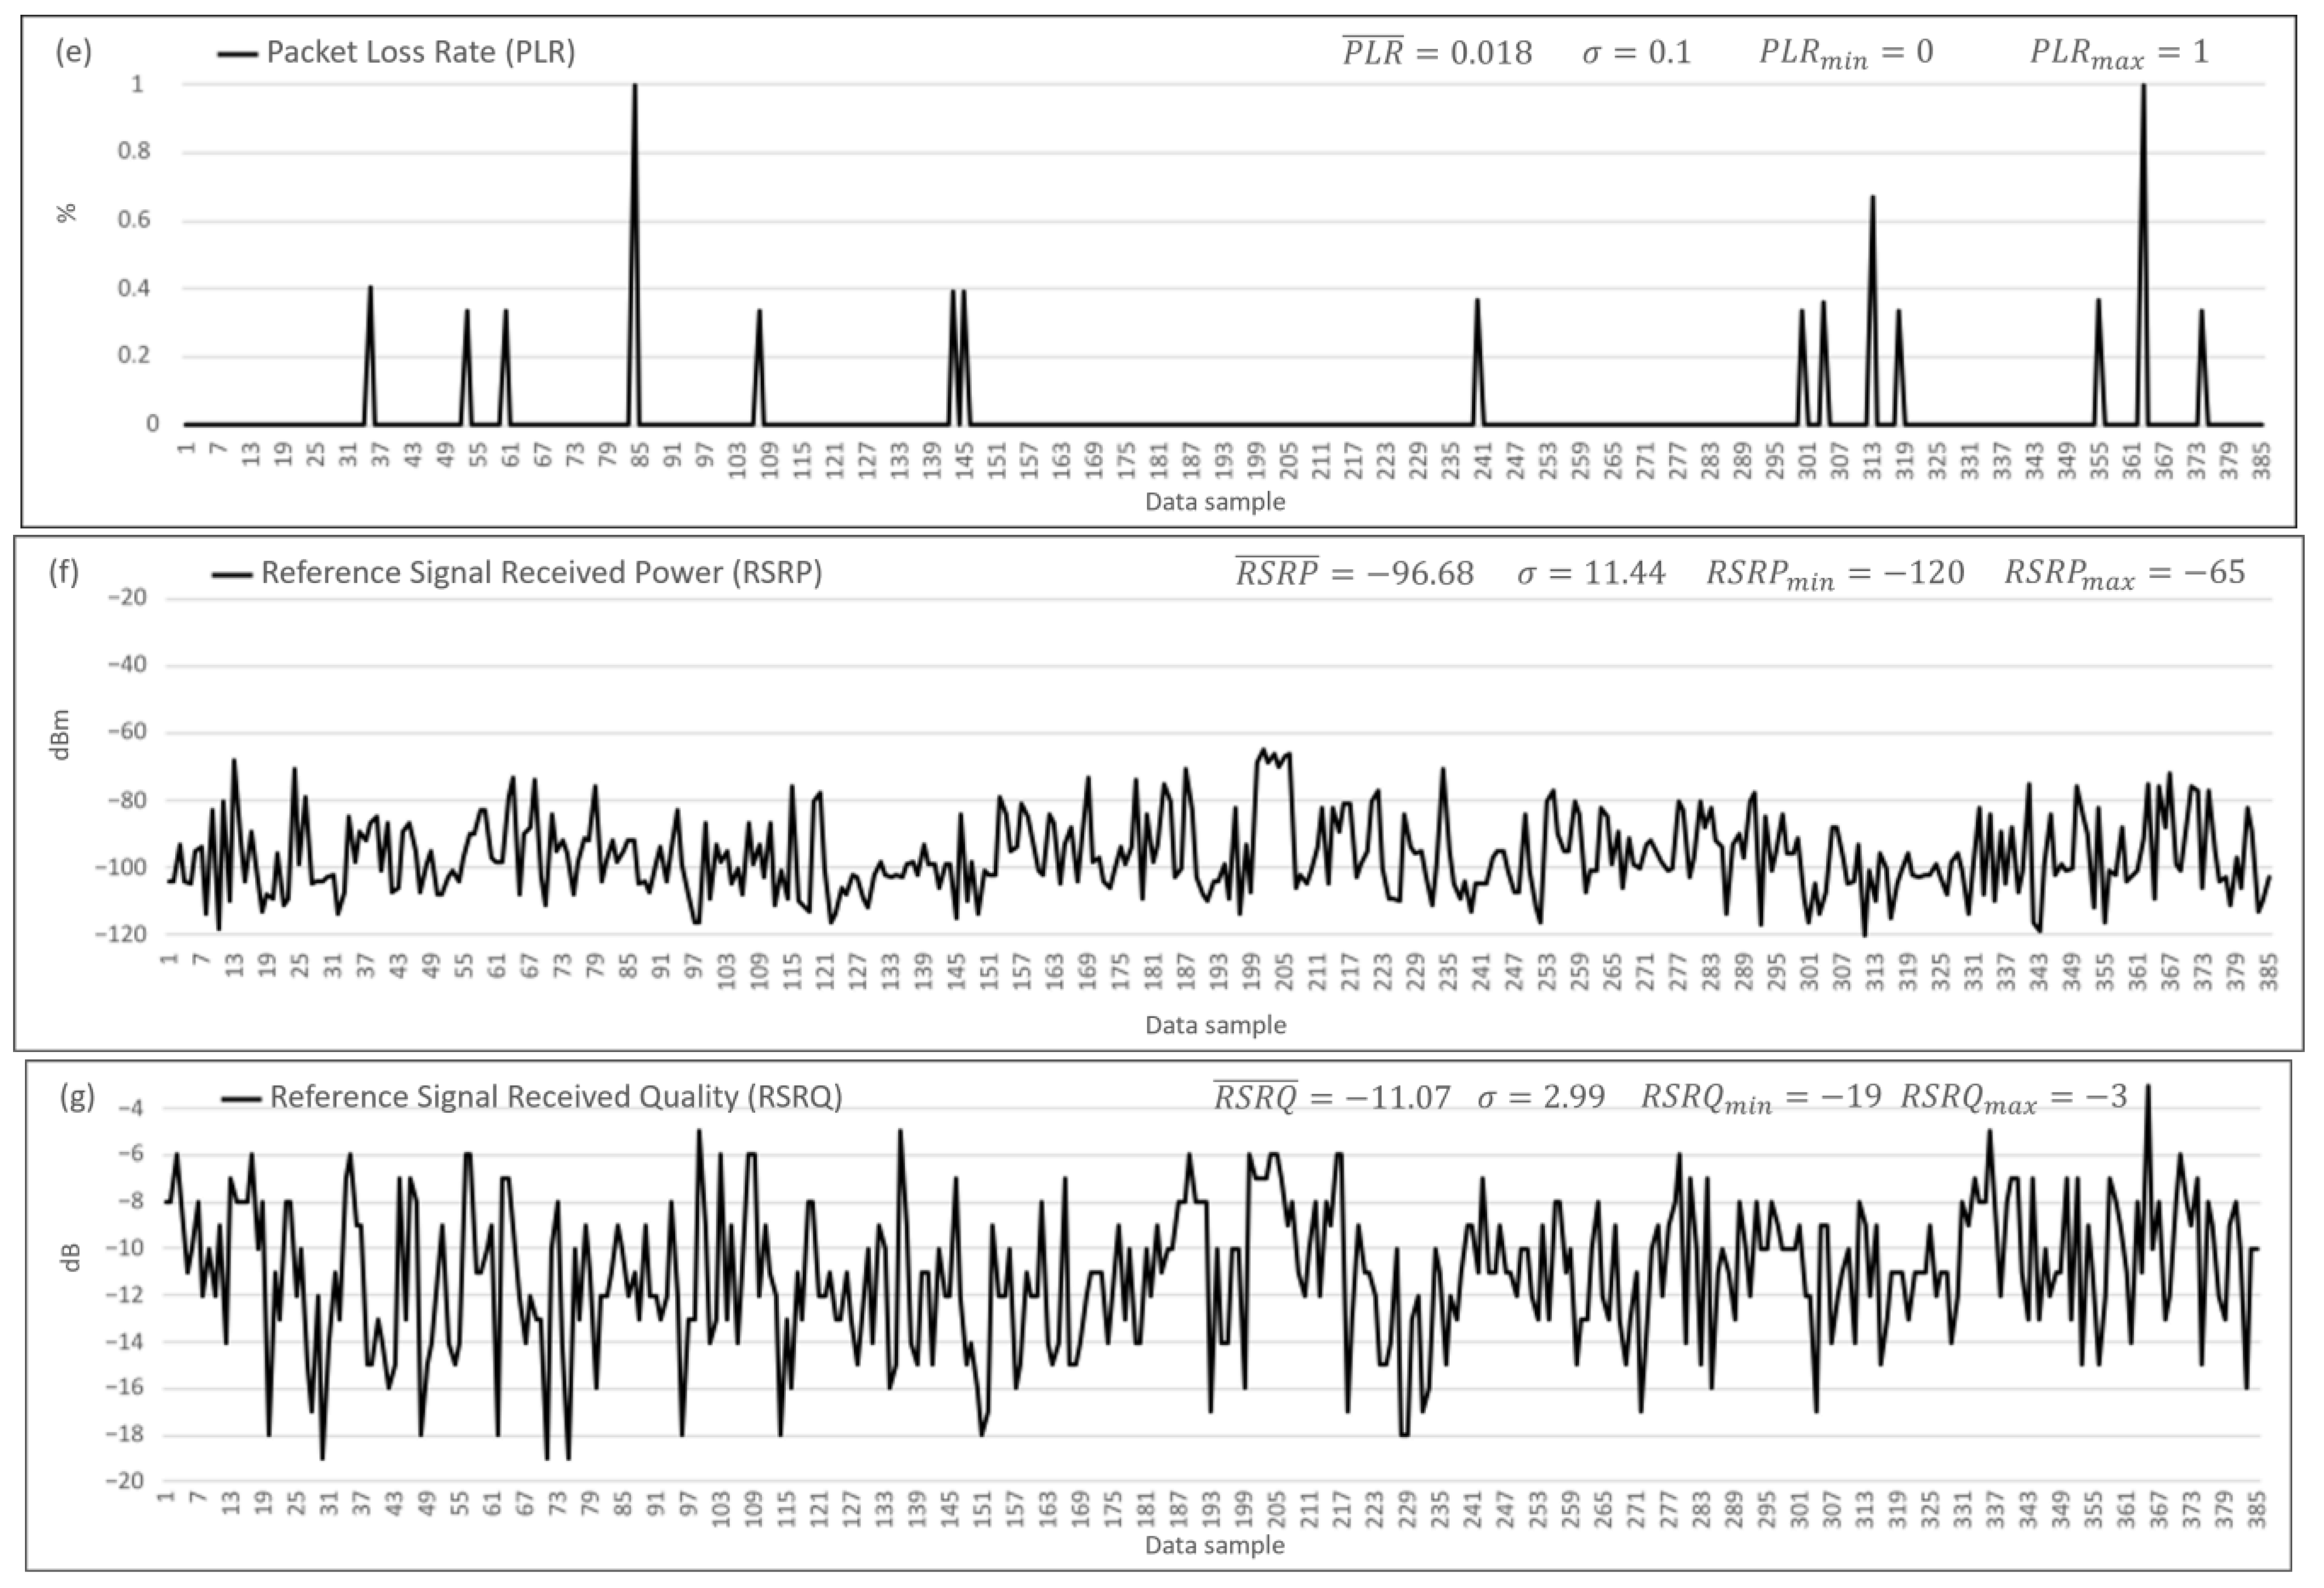
56]. The variables of interest are the seven key performance indicators recommended by the ITU for evaluating the quality of service of the LTE network: download speed, upload speed, latency, jitter, packet loss rate, RSRP, and RSRQ [55]. The repository’s data dictionary is in Table A1. The data samples were obtained collaboratively with mid-range user equipment in the Alameda Central area of Mexico City during the first two months of 2021.
The information repository analysis found that data samples from five mobile network operators are reported in 39 geolocated points of the study area. It is relevant to indicate that each geolocated point does not have data from each operator or measurements from each day of the collection period. This implies that the dataset of the information repository is not balanced. However, most data classification tools require balanced data or a balancing process. In the case of the FIS, the advantage is that when being designed, they can be based on expert knowledge and not on data. In addition, starting the FIS with expert knowledge is possible, and the parameters should be adjusted based on the available data, as was conducted in [43].
Considering that we propose to evaluate and not classify the KPIs to obtain the LTE mobile network’s service quality and effectiveness indices, the statistics of mean, variance, and standard deviation shown in Table 1 were obtained. It is essential to mention that for this calculation, from the total 607 samples of the information repository, filters were applied with the valid ranges for each KPI in Table 2 and Table 3, leaving 385 valid data samples. In this way, the characteristics of the input variables were determined. The statistics show that the variables are not linear and change over time; mathematically, these variables follow a stochastic process. Based on what was explained in the previous paragraph and this one, it was considered that this evaluation should be approached with a weighted fuzzy inference system, which is detailed in Section 2.2, Section 2.3, Section 2.4, Section 2.5 and Section 2.6.
On the other hand, the valid ranges for each key performance index with linear units of the LTE mobile network, download speed, upload speed, latency, jitter, and packet loss rate, are shown in Table 2. It is observed that the fuzzy limits Q l lower, Q u upper, and the optimal point Q m . These are values with which the trapezoidal membership functions of these KPIs are determined. Meanwhile, sigmoid membership functions are considered for the KPIs with nonlinear units RSRP and RSRQ. Thus, the values Q a n , that determine the slope, and Q c n , the crossing point value found in Table 3, are essential fuzzy parameters for the sigmoid functions. The above is vital for the development of fuzzification in Section 2.2.

2.2. Fuzzification

In this section, the membership degrees of each input KPI are determined according to the input membership functions. In Section 2.1, two types of membership functions, trapezoidal and sigmoid, were assigned for KPIs with linear and nonlinear units, respectively. This is because linear membership functions (triangular and trapezoidal) are inappropriate in many practical situations. Instead, nonlinear membership functions may better reflect reality [57,58]. Three linguistic terms, Low, Medium, and High, were proposed for each KPI. Then, the boundaries of each term, Q l lower, Q m medium, and Q u upper, were assigned to the trapezoidal functions µ k , Equations (1)–(3), where k represents the sample data of the KPIs. In Equation (1), the k ranges are defined by the upper and lower boundaries, see Table 2.
μ I k = m a x m i n Q k Q l k Q m k Q l k , 1 , Q h k Q k Q h k Q m k , 0
where Q k denotes the sample value of the KPI data, l is the lowest allowed value, u is the upper allowed value, and m is the central value. Meanwhile, Equation (2) occurs when the fuzzy function is defined with only the lower bound.
μ I k = m a x m i n Q k Q l k Q m k Q l k , 1 , 0
On the other hand, when a range is defined only with the upper bound, the fuzzy function can be obtained as follows.
μ I k = m a x m i n 1 , Q h k Q k Q h k Q m k , 0
Equations (1)–(3) are applied to each KPI: download speed, upload speed, latency, jitter, and packet loss rate, using the three linguistic terms Low, Medium, and High.
Similarly, Equations (4)–(6) apply to the KPIs with non-line units, RSRP and RSRQ. The values defining these sigmoid membership functions μ k are observed in Table 3. The same linguistic terms, Low, Medium, and High, are considered. Where the limits of each term are defined by Q a l k and Q c l k slope and lower crossing point, respectively. Also, Q a u k and Q c u k slope and upper crossing point are considered.
μ I k = m a x m i n 1 1 e Q a l k Q k Q c l k , 1 , 1 1 e Q a u k Q k Q c u k , 0
where c l is the lowest crossing point, and c u is the highest. Meanwhile, in Equation (5), the fuzzy function is defined with the lower limit.
μ I k = m a x m i n 1 1 e Q a l k Q k Q c l k , 1 , 0
Finally, when the membership function is defined with the upper bound, it is denoted as:
μ I k = m a x m i n 1 , 1 1 e Q a 2 k Q k Q c 2 k , 0
These membership functions allow for the definition of fuzzy rules, which are discussed in detail in Section 2.3.

2.3. Inference Rules

To process each rule, the use of fuzzy logic operations is required. A fuzzy operator is used to process the results of membership functions within an inference rule, see Equation (7) [59]. In this work, the fuzzy intersection operator (AND) has been used:
μ A B ( x ) = m i n μ A x , μ B ( x )
For evaluating the quality of service and the effectiveness of the LTE mobile network. Fuzzy logic-based systems are helpful due to the handling of subjectivity, which allows the interpretation of any knowledge and mapping them into several parallel evaluations. In the LTE mobile network data transfer, it is essential to identify all possible scenarios generated with the different key performance indicators that evaluate the QoS. In this sense, the combinations of the KPIs of the LTE network quality of service can be expressed with phrases commonly used by experts, such as, for example: if the download speed is high, the download speed is medium, the latency is high, the jitter is medium, and the packet loss rate is low, then the quality of service (QoS) is acceptable. This state can be expressed in fuzzy logic, as shown in the examples of the fuzzy rules in Table 4.
For this work, the set of fuzzy rules covering all possible scenarios was demonstrated. Once the rules are defined, their mathematical calculation can be performed in two phases, taking as an example the rules for obtaining the effectiveness index.
First, all membership functions for the effectiveness index are evaluated with Equation (8).
μ R = m i n μ P L R k , μ R S R P l
where P L R and R S R P are the packet loss rate and RSRP is the reference signal received power. Furthermore, k and l     { L o w ,   M e d i u m ,   H i g h } and μ R is known as the rule’s antecedent. Finally, the consequent or output of the rule μ o u t is obtained with Equation (9).
μ o u t = m i n μ R , μ E f f e c t i v e n e s s l
where l { V e r y   p o o r ,   P o o r ,   A c c e p t a b l e ,   G o o d ,   V e r y   g o o d } 
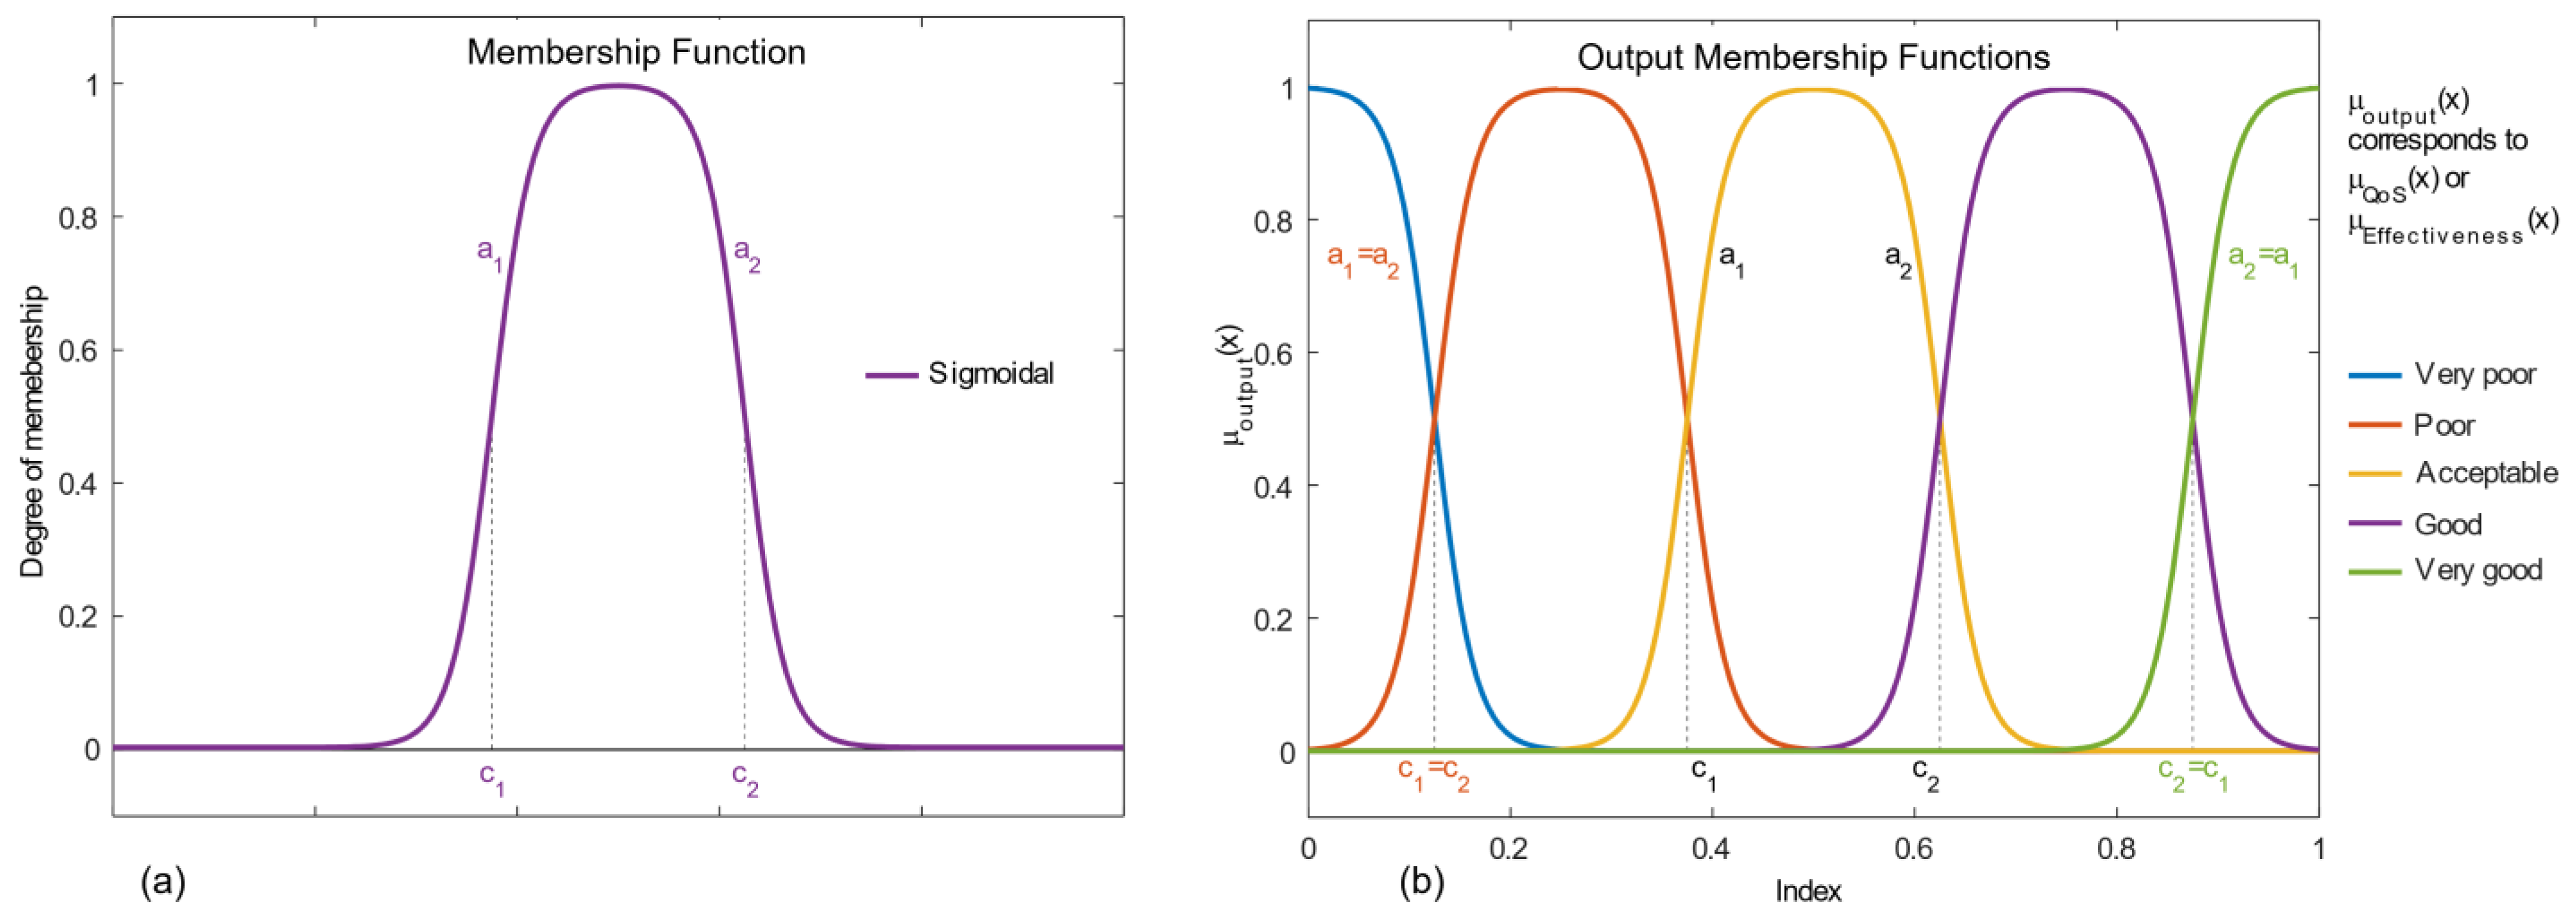
. The membership function of the QoS and effectiveness indices can be calculated using Equation (10).
μ o u t x = m a x m i n 1 1 + e a 1 ( x c 1 ) , 1 , 1 1 + e a 2 ( x c 2 ) , 0
where a 1 , c 1 , a 2 , and c 2 are the parameters defined by the output membership function; see Table 5 and Figure 3.

2.4. Analytical Hierarchy Process

The Analytical Hierarchy Process (AHP), a multi-criteria decision-making tool, can solve a problem by decomposing related factors in a hierarchy and evaluating the priorities of the hierarchy in simple pairwise comparison judgments [60]. Thus, the fuzzy inference system (FIS) is robust using the AHP of L. Saaty in 1980 [61].

2.4.1. Hierarchy Assignment

After establishing the rules between KPIs, hierarchies are assigned by applying the Analytic Hierarchy Process (AHP). To verify the order of hierarchy between the seven key performance indicators (download speed, upload speed, latency, jitter, packet loss rate, RSRP, and RSRQ), the dependency links must be identified to establish these hierarchies. Therefore, the relative importance scale proposed by Saaty was used to select the level of importance from a comparison between KPIs. Table 6 shows the relative importance scale for obtaining the QoS and effectiveness indices.
The level of importance assigned to each KPI focused on the applications that general LTE network users use daily. These users take advantage of the cost reduction in the mobile network service to access over-the-top (OTT) applications [54]. These are applications for video streaming, video calls, messaging, voice, audio, social networks, data transmission, cloud services, and browsers [55,62]. To evaluate the network quality aspects of these applications, the ITU in [55] recommends the relevance of quality parameters in the performance of these applications. The download and upload speed is most relevant, followed by the packet loss rate, jitter and latency, and RSRP and RSRQ. It is essential to evaluate the degradation based on these considerations.
Considering these services, the upload speed and download speed KPIs are determined to be paramount for QoS. Meanwhile, for the packet loss rate, the level of importance is weak compared to upload and download. Jitter is moderate, and latency is moderate +. Finally, RSRQ was assigned a much lower level of importance because this relationship is considered lower regarding upload and download.
The packet loss rate KPI was found to be most important for the effectiveness index due to its influence on evaluating data transfer effectiveness. However, the RSRP was assigned the lowest importance concerning the packet loss rate.

2.4.2. Pairwise Comparison Matrix

Once the importance has been assigned to the KPIs, pairwise comparisons between each KPI are performed. First, a pairwise matrix ( A = a i j ) is used to store the comparisons of each index. A is a positive n x n reciprocal matrix and is constructed as follows:
A = K P I 1 K P I 2 K P I n K P I 1 K P I 2 K P I n a 11 a 12 a 1 n a 21 a 22 a 2 n a n 1 a n 1 a n n = w 1 w 1 w 1 w 2 w 1 w n w 2 w 1 w 2 w 2 w 2 w n w n w 1 w n w 2 w n w n
where w i is the importance scale of the i t h   K P I , substituting the assigned values from Table 6 in Equations (11)–(13) for the Q o S and effectiveness indices, respectively.
A Q o S = D S U S L J P L R R S R Q D S U S L J P L R R S R Q 1 1 4 3 2 9 1 1 4 3 2 9 1 / 4 1 / 4 1 3 / 4 2 / 4 9 / 4 1 / 3 1 / 3 4 / 3 1 2 / 3 9 / 3 1 / 2 1 / 2 4 / 2 3 / 2 1 9 / 2 1 / 9 1 / 9 4 / 9 3 / 9 2 / 9 1
where D S is the download rate, U S is the upload rate, L is the latency, J is the jitter, P L R is the packet loss rate, and R S R Q is the reference signal received quality. Similarly, the matrix for effectiveness is defined by:
A E f f e c t i v e n e s s = P L R R S R P P L R R S R P 1 9 1 / 9 1
where P L R is the packet loss rate, and R S R P is the reference signal received power.

2.4.3. Square Matrix of A

The square of the pairwise comparison matrix is then calculated using the expression in Equation (14).
B = A × A = a 11 a 12 a 1 n a 21 a 22 a 2 n a n 1 a n 1 a n n × a 11 a 12 a 1 n a 21 a 22 a 2 n a n 1 a n 1 a n n
Substituting values from Equation (12) into Equation (14) gives the square of the matrix A for the Q o S .
B Q o s = 6 6 24 18 12 54 6 6 24 18 12 54 1.5 1.5 6 4.5 3 13.5 2 2 8 6 4 18 3 3 12 9 6 27 0.667 0.667 2.667 2 1.3333 6
The square of the effectiveness matrix A is calculated similarly.
B E f f e c t i v e n e s s = 2 18 0.2222 2

2.4.4. Obtaining the Vector C

Next, vector C is obtained, which will be used to obtain the weight vector. To do this, the rows of matrix B are added using Equation (17) to calculate each element of vector C .
C i = j = 1 n B i j i = 1,2 , , n
Using Equation (17), vector C for the quality of service is calculated.
C Q o S = 120 120 30 40 60 13.3333
For effectiveness, the corresponding steps are taken.
C E f f e c t i v e n e s s = 20 2.2222

2.4.5. Weight Vector or Eigenvector

After obtaining the weight vector, the vector C i must be normalized by applying Equation (18).
w i = C i j = 1 n C j i = 1,2 , , n
where w i is the weight vector, known as the eigenvector, proposed by Perron in [63]. This process is repeated until the eigenvector solution is unchanged from the previous iteration. The priority weights for each KPI concerning Q o S and effectiveness are shown in Equations (19)–(20), respectively.
w Q o S = 0.3130 0.3130 0.0783 0.1043 0.1565 0.0348
w E f f e c t i v e n e s s = 0.9 0.1

2.4.6. Iteration

The iteration starts by repeating the process described in Section 2.4.3, Section 2.4.4 and Section 2.4.5. It ends when there are changes of less than four decimal places between the elements of the eigenvector of the current iteration and those of the eigenvector of the previous iteration. The matrix B i is initially obtained by calculating the square matrix of B i 1 , obtained in the last iteration.
B 1 _ Q o S = B Q o S × B Q o S = 216 216 864 648 432 1944 216 216 864 648 432 1944 54 54 216 162 108 486 72 72 288 216 144 648 108 108 432 324 216 972 24 24 96 72 48 216
B 1 _ E f f e c t i v e n e s s = B E f f e c t i v e n e s s × B E f f e c t i v v e n e s s = 8 72 0.8889 8
Then, the vector C i of each index is obtained:
C 1 _ Q o S = 4320 4320 1080 1440 2160 480
C 1 _ E f f e c t i v e n e s s = 80 8.8889
Next step is to calculate the weight vector w i .
w 1 _ Q o S = 0.3130 0.3130 0.0783 0.1043 0.1565 0.0348
w 1 _ E f f e c t i v e n e s s = 0.9 0.1
Finally, the difference between the current iteration’s eigenvector and the previous iteration’s eigenvector is obtained. The difference in eigenvectors for the Q o S is calculated:
0.3130 0.3130 0.0783 0.1043 0.1565 0.0348 0.3130 0.3130 0.0783 0.1043 0.1565 0.0348 = 0 0 0 0.1388 × 10 16 0 0
Meanwhile, for effectiveness:
0.9 0.1 0.9 0.1 = 0 0
when the result for both eigenvectors is less than four decimal places, the iteration stops, and the process continues to Section 2.4.7.

2.4.7. Consistency

Finally, the Consistency Ratio ( C R ) of the matrix “ A ” was calculated. According to Saaty [44], a limit of 0.1 is defined as the maximum acceptable inconsistency. Equation (21) is used to calculate C R .
C R = λ m a x n n 1 R I
where λ m a x is the maximum eigenvalue of the comparison pair matrix, n is the matrix’s size, and R I is the random consistency index, which can be determined according to Table 7.
If the ratio (called the consistency ratio C R ) between the consistency index and that of the random matrices is significantly tiny (it is carefully specified that it should be 10% or less), we accept the estimate of w . Otherwise, we try to improve the consistency.
The Equation (22) is applied to obtain the λ m a x .
( λ m a x ) w = A w
where A is the pairwise comparison matrix proposed in Section 2.4.2, λ m a x is the maximum eigenvalue of the matrix, and w is the eigenvector or vector of resulting weights obtained at the end of the iteration of Section 2.4.6. In addition, the equality shown in Equation (23) is fulfilled.
A w = 1 a 12 a 1 n 1 / a 12 1 a 2 n 1 / a 1 n 1 / a 2 n 1 w 1 w 2 w n = c w
It is verified whether the matrix A for the Q o S is consistent by applying Equation (23).
A Q o S w Q o S = 1 1 4 3 2 9 1 1 4 3 2 9 1 / 4 1 / 4 1 3 / 4 2 / 4 9 / 4 1 / 3 1 / 3 4 / 3 1 2 / 3 9 / 3 1 / 2 1 / 2 4 / 2 3 / 2 1 9 / 2 1 / 9 1 / 9 4 / 9 3 / 9 2 / 9 1 × 0.3130 0.3130 0.0783 0.1043 0.1565 0.0348 = 1.8783 1.8783 0.4696 0.6261 0.9391 0.2087
c Q o S w Q o S = 1.8783 1.8783 0.4696 0.6261 0.9391 0.2087
Furthermore, by relating Equations (22)–(23), it is observed that there is equality between c and λ m a x ; therefore:
c = λ m a x = j = 1 n w j
Calculating λ m a x for the quality of service we have:
λ m a x _ Q o S = 6
To verify that the correct value of λ m a x is obtained, Equation (25) is applied.
c λ m a x w = λ m a x w 1 w 2 w n
λ m a x _ Q o S w Q o S = 6 × 0.3130 0.3130 0.0783 0.1043 0.1565 0.0348 = 1.8783 1.8783 0.4696 0.6261 0.9391 0.2087
It is observed that the result is the identical resulting vector of A Q o S w Q o S ; therefore, λ m a x can be used to calculate the consistency ratio for quality. The consistency ratio is calculated by substituting values.
C R Q o S = 6 6 6 1 1.25 = 0
It is verified that C R Q o S < 0.1 ; therefore, the matrix A Q o S is consistent. For effectiveness, the matrix A E f f e c t i v e n e s s is of dimension 2 × 2 . Thus, the consistency is verified by demonstrating that λ m a x = 2 for each positive reciprocal matrix of 2 by 2. Therefore, each positive reciprocal matrix of 2 by 2 is a positive reciprocal matrix, as shown in Equation (26).
1 α α 1 1 1 + α 1 + α α 1 = 2 1 + α 1 + α α 1
As the proof is fulfilled, it is verified that the matrix proposal is consistent. Therefore, the weight vector for the Q o S is:
w Q o S = D o w n l o a d S p e e d U p l o a d S p e e d L a t e n c y J i t t e r P a c k e t L o s s R a t e R S R Q 0.3130 0.3130 0.0783 0.1043 0.1565 0.0348
Furthermore, the weight vector for effectiveness is:
w E f f e c t i v e n e s s = P a c k e t L o s s R a t e R S R P 0.9 0.1

2.5. Weight Applying

The FIS works by giving equal importance to the input variables, in this case, to the KPIs. However, the significance of some KPIs can be weighted to benefit the response of the indices. In this sense, some KPIs must have a different mathematical importance for this hierarchy to impact each index. The weights of these variables were obtained in Section 2.4. It is essential to mention that the assignment of these weights cannot be integrated separately into the rules since they would unbalance the calculation of the output rule; however, when the result of a function defined for a KPI establishes the result of the rule, then the weight corresponding to the KPI of this function is multiplied to the result according to the following expression.
μ w = w i × μ R _ o u t
where w is the selected weight of the i t h KPI that defined μ w . When two or more KPIs have the same membership value, the KPI with the highest priority establishes the weight to be used. Particularly for Q o S , the rules are defined with six KPIs: download speed ( D S ), upload speed ( U S ), latency ( L ), jitter ( J ), packet loss rate ( P L R ), and R S R Q . Thus, the weight to be used is defined with Equation (30).
w Q o S = m a x { w D S , w U S , w L , w J , w P L R , w R S R Q }
Similarly, the effectiveness index rules are generated with two K P I s , the P L R and the R S R P . Therefore, the weight to be used is assigned using Equation (31).
w E f f e c t i v e n e s s = m a x { w P L R , w R S R P }
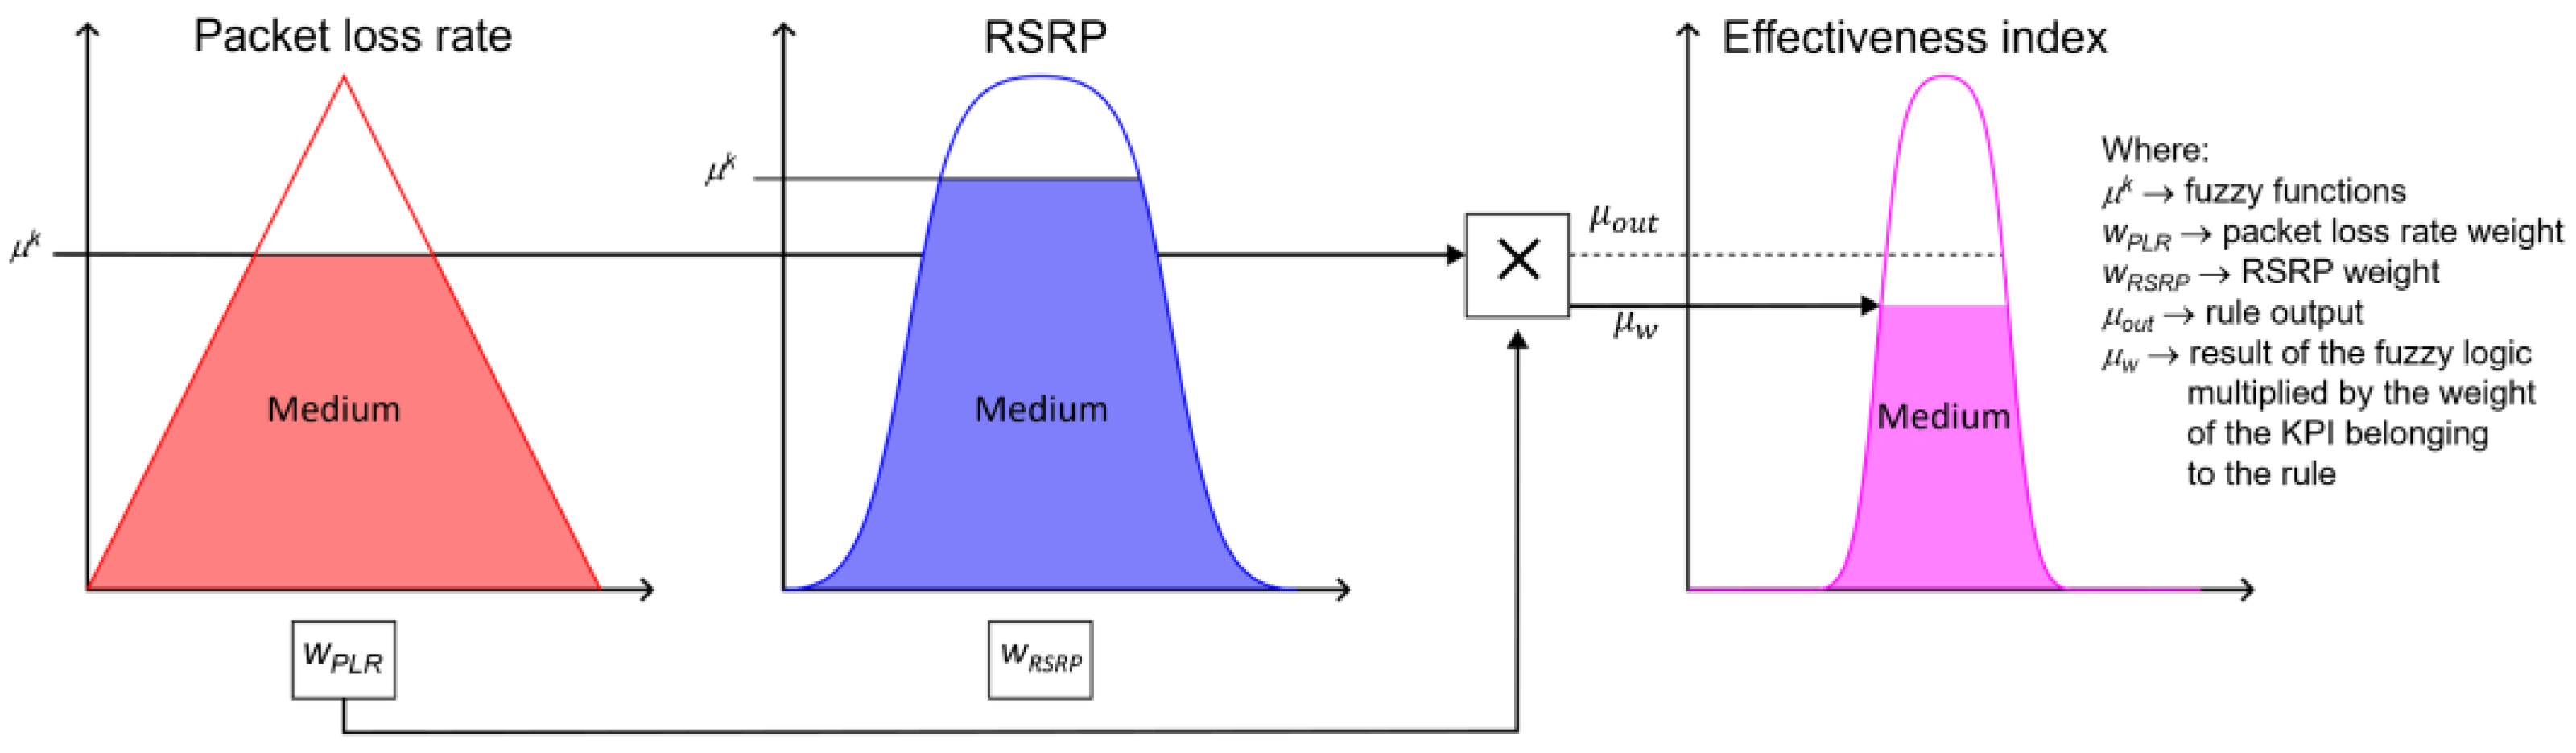
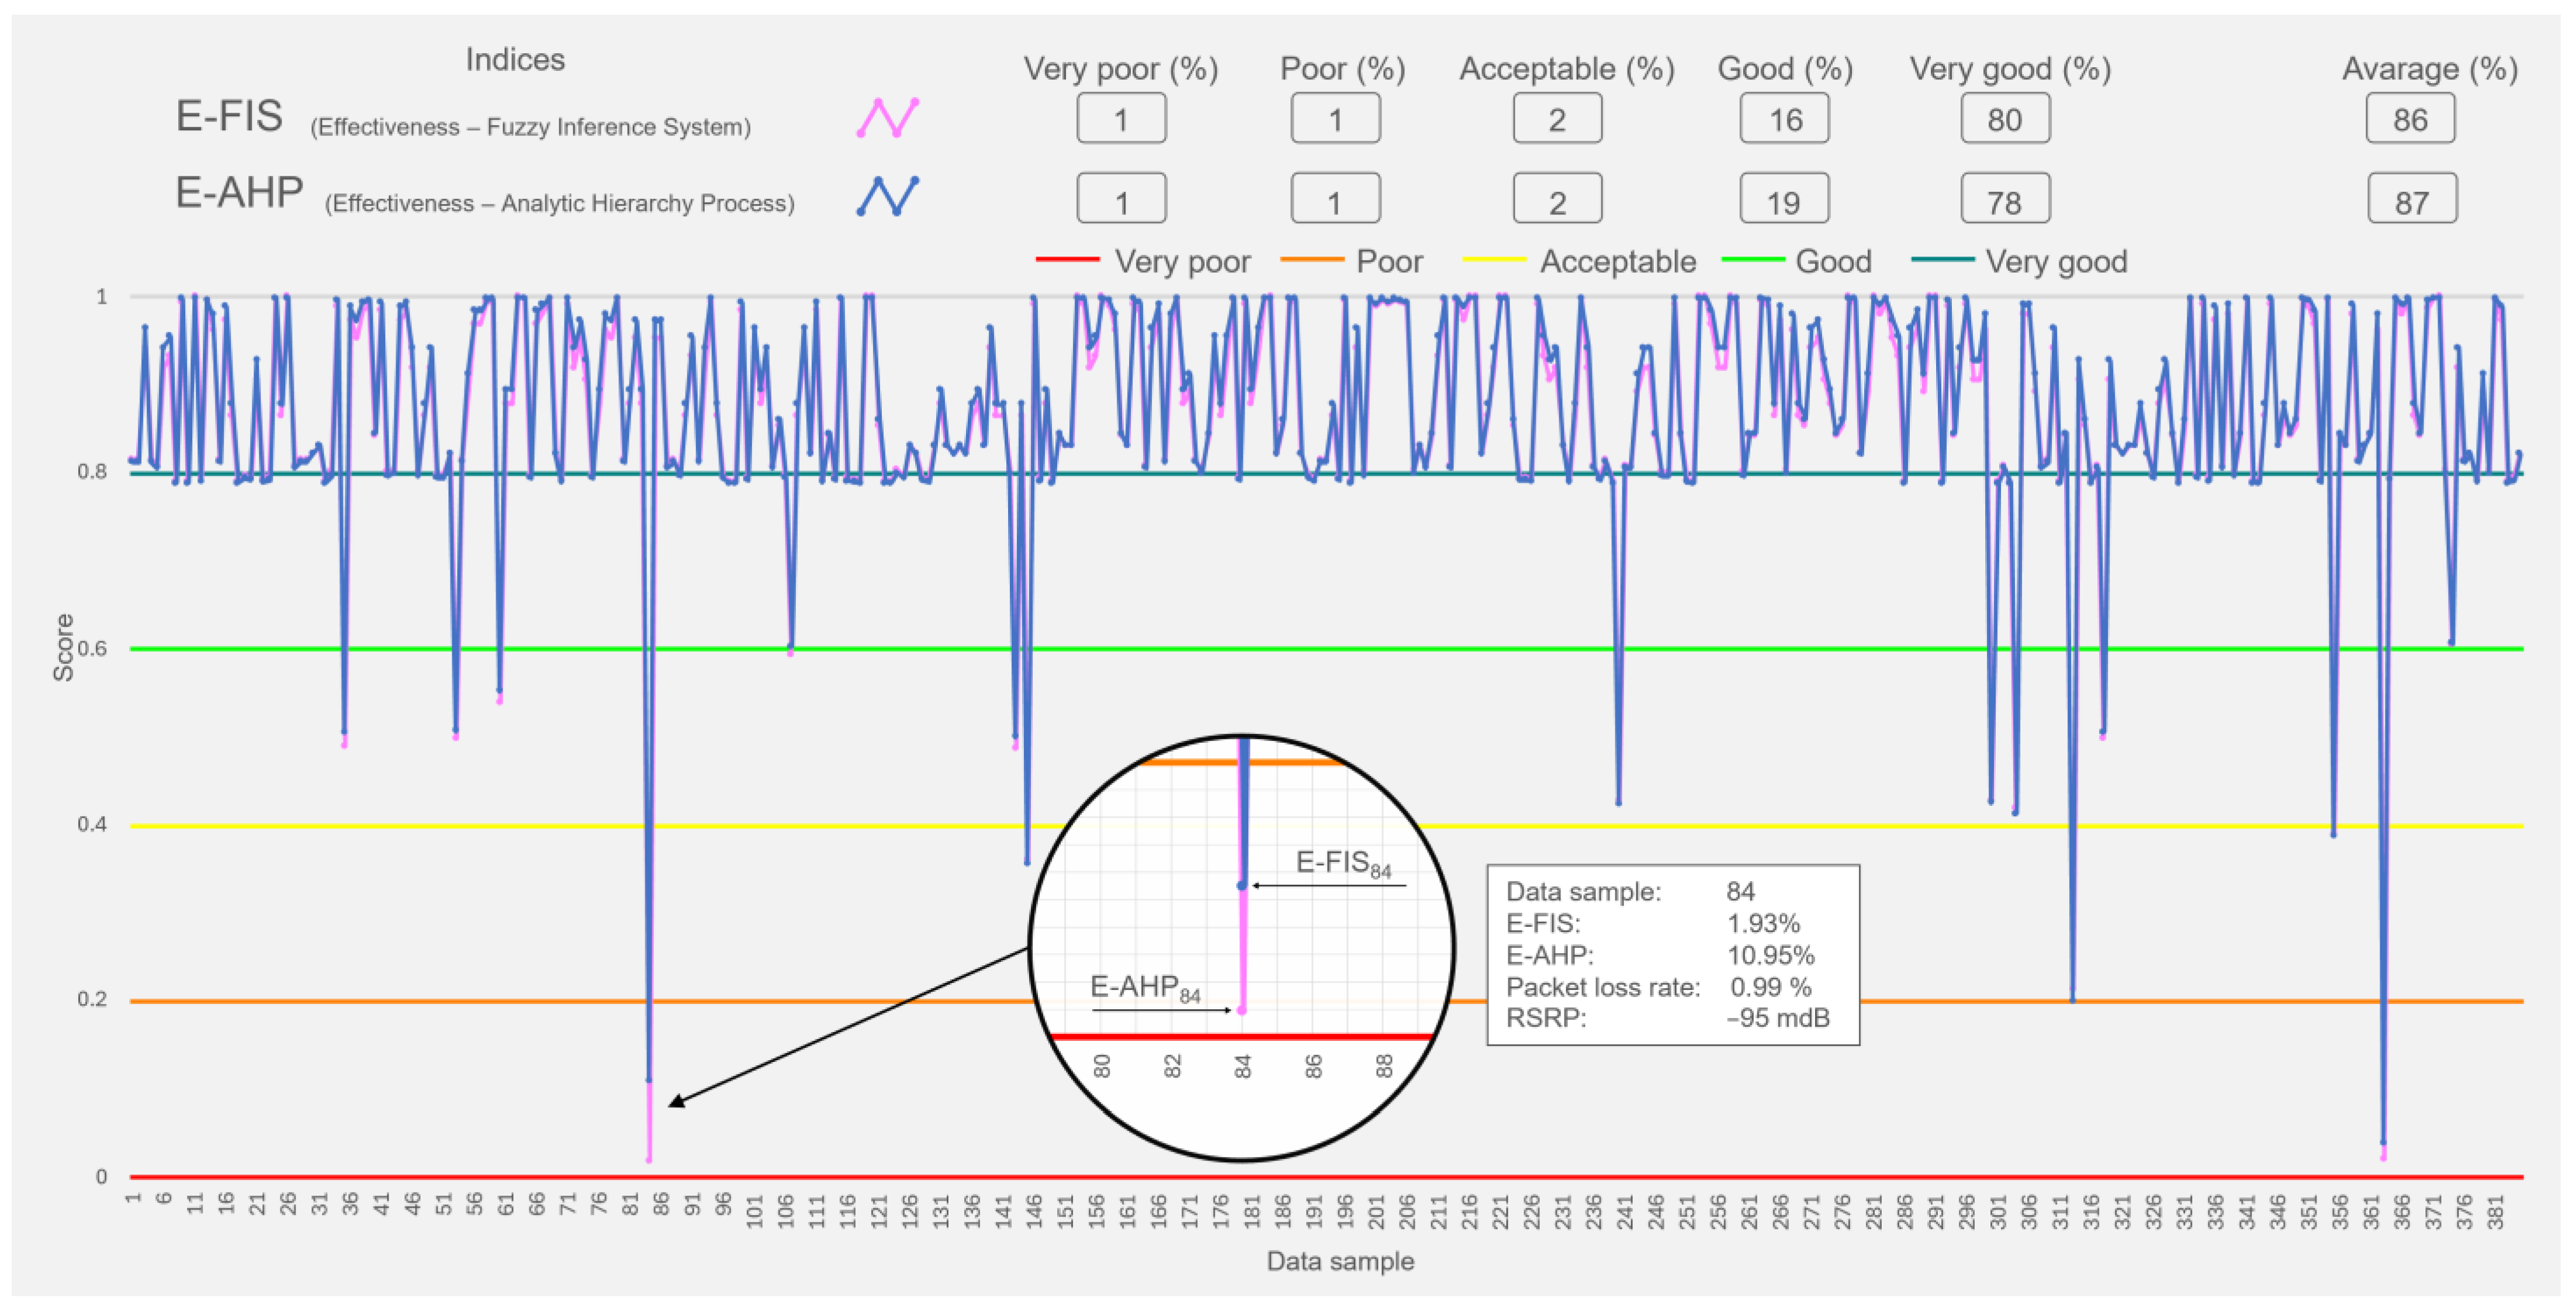
Figure 4 shows how the K P I influences the exit rule with the highest importance, exemplifying the process of obtaining the effectiveness index.

2.6. QoS and Effectiveness Indices (Aggregation and Defuzzification)

After the output rules ( μ o u t ) have been calculated, the area of all these rules is combined by superposition, known as the aggregation process. Thus, a final membership function ( μ g ) is obtained that integrates all the particular evaluations ( μ o u t ). The aggregation for the QoS index is presented as an illustrative example (see Figure 5).

3. Results

3.1. KPI Analysis

It is essential to analyze the LTE network’s KPIs to understand their behavior in terms of quality of service and effectiveness. Each KPI was analyzed using the corresponding fuzzy functions based on Table 1 and Table 2. Three fuzzy states were determined for each KPI: Low, Medium, and High. It considered the repository of information collected collaboratively through user teams in the first two months of 2021 in the Alameda Central area of Mexico City.
The data samples from the download speed, upload speed, latency, jitter, packet loss rate, RSRP, and RSRQ information repository are shown in Figure 6a–g, respectively. Figure 6a shows that the download speed presents 42% of the data samples between the ranges of 21 and 55 Mbps; that is, it is classified as Medium speed, leading to an Acceptable quality of service. On the other hand, 40% is between the range of 0 and 21 Mbps, which makes it susceptible to having mostly a Poor or Very Poor quality of service. The remaining 18% is between the limits of 55 and 300 Mbps, which have a Good or Very Good QoS.
In Figure 6b, the download speed shows 39% of data within the range of 20.5 to 100 Mbps, meaning the QoS is Good or Very Good. In addition, 34% of the samples are in the 7.5 to 20.5 Mbps range, which results in an Acceptable QoS. The remaining 27% range is from 0 to 7.5 Mbps, generating a Poor or Very Poor QoS. On the other hand, Figure 6e shows the rate of lost packets where 96% of the data is in the range of 0 to 0.25%, which benefits from having good results in both indices, but especially in Effectiveness since the weighting for this index is very high, presenting 3% in the range 0.25 to 0.75 and 1% within 0.75 to 1, which limits an unfavorable response for both indices.
On the other hand, in Figure 6d, it can be observed that jitter accounts for 55% of the data samples in the range of 0 to 7.5 ms, benefiting from a good evaluation of the quality of service. Meanwhile, 44% is within the limits of 7.25 to 22.5 ms, promoting an acceptable QoS, and the remaining 2% is in the range of 22.5 to 30 ms, generating a poor QoS evaluation. On the other hand, in Figure 6c, latency accounts for 52% of data in the range of 0 to 25.5 ms, which promotes a better QoS, while 45% of the data is between 25.5 and 74.5 ms, impacting an acceptable quality. Finally, the remaining 3% is 74.5 to 100 ms, causing a poor QoS.
On the other hand, in Figure 6f of the RSRP, it is observed that 60% of the data is in the lowest range, while 38% is in the middle range, and 2% is in the highest, −120 to −96 dBm, −96 to −70 dBm, and −70 to −44 dBm, respectively. This affects the effectiveness index to a lesser extent by the assigned weighting. Finally, Figure 6g presents the RSRQ with 57% in the range of −14 to −8.5 dB, contributing to having an acceptable QoS. In comparison, 22% presents a better level in the range of −8.5 to −3 dB, contributing to having an enhanced evaluation of the QoS; on the other hand, the remaining 21% is in the lowest level of −19.5 to −14 dB, affected by having a poor quality of service of the LTE network.

3.2. Quality of Service and Effectiveness Index

Previously, the evaluation of the QoS and the effectiveness of the data transfer of the LTE network was carried out with an FIS in [56] using seven KPIs: download speed, upload speed, latency, jitter, packet loss rate, RSRP, and RSRQ. On the other hand, this work proposes strengthening the FIS by adding the AHP (FIS-AHP). Although both works propose a tool for evaluating QoS and effectiveness, which general users of the LTE network can interpret, both propose their design using the 385 samples of the information repository, considering the same valid ranges of Table 2 and Table 3, as well as the functions and membership degrees for each KPI. The differences lie in that the FIS model of [56] considered the same level of importance in five KPIs: download speed, upload speed, latency, jitter, and packet loss rate, but did not consider RSRP and RSRQ KPIs as the same levels of importance. This is because they evaluate the LTE network’s transmission as medium (RF); therefore, RSRP and RSRQ were assigned a much lower importance than the rest of the KPIs.
The proposal for the weighted FIS-AHP considered different levels of importance for the KPIs, considering that general users of the LTE network mostly access over-the-top (OTT) applications daily. In this way, the ITU recommendation [55] for quality assessment in OTT applications was considered. It mentions the relevance of the KPIs in these applications. The most relevant are the download and upload speeds, followed by the packet loss rate, jitter, latency, and RSRP and RSRQ. In addition, 372 rules were proposed in the FIS, and 441 were proposed in the FIS-AHP.
The results of both evaluations for the quality of service are compared in Figure 7. It is observed that both quality of service indices applying the Fuzzy System Inference (QoS-FIS) and the Analytic Hierarchy Process (QoS-AHP) have similar behavior. However, due to the importance assigned to the upload speed and download speed KPIs in the QoS-AHP index, there are differences concerning the QoS FIS index. Table 8 summarizes these differences and the minimum and maximum values obtained for both indices.
The weighting of the QoS-AHP index amplifies the effect of the most representative KPIs. Generally, the quality of service index obtained with AHP averaged 67%, one percentage point higher than the average obtained with the QoS-FIS index.
On the other hand, Figure 7 shows in detail the data sample 228, where the QoS-AHP evaluation presents an improvement of 13.5% concerning the QoS-FIS due to weighting in the AHP. Sample 228 has the following input linguistic values about each KPI: download speed value, upload speed, latency, jitter, packet loss rate, and RSRQ of Low, Medium, Low, Low, Low, and Low, respectively, which translates to obtaining a Good classification in the FIS evaluation. The above is why the values of the latency, jitter, and packet loss rate KPIs benefit from good quality. Meanwhile, for the AHP, an Acceptable classification is obtained due to the importance assigned to the upload and download speed KPIs, penalizing the evaluation result more. In addition, the difference between the highest peak value of each index is 3.84%, where the QoS-AHP has the highest score. Meanwhile, the difference between the lowest peak value of each index is 0.17%, where the QoS-FIS also has the lowest score, see Table 8.
In the same way, the effectiveness indices evaluated with the fuzzy inference system (E-FIS) and the analytical hierarchy process (E-AHP) are compared. Figure 8 shows both indexes, which have similar behavior with a slight difference due to the importance of the packet loss rate KPI rules. The average obtained by the E-AHP is higher than that of the E-QoS by 1%.
Also, the evaluation of the effectiveness of sample 84 can be seen, where the linguistic values of packet loss rate are High, and that of the RSRP is Medium. This implies that both evaluation systems should obtain a result classified in the Very Poor category. However, the difference between both evaluations is 9%; this is due to the critical weighting assigned to the packet loss rate in the AHP because this KPI strongly impacts the effectiveness of the data transfer of the LET network. Table 9 summarizes the results of the comparison between both effectiveness indices. On the other hand, the difference between the high peak value of both indices is 2.26%, where the E-AHP index is higher.

4. Discussion

The information repository was collected collaboratively with mid-range user equipment during the first two months of 2021. Data from five mobile network operators are reported at 39 geolocated points. It is essential to clarify that each geolocated point does not have data from all operators or measurements from all collection period days. In addition, after statistically analyzing the data, it was found that the KPI values are variants over time, so the behavior of these variables refers to a stochastic process. Therefore, it will be determined that the data in the repository are not balanced. Subsequently, the information repository was analyzed regarding the range of valid values for each KPI, as shown in Table 1, and 385 valid data were found. Therefore, to evaluate the quality of service and effectiveness, the weighted fuzzy inference system (FIS-AHP) is used to strengthen the first FIS carried out [38].
The relevance of this model is the ability to offer LTE mobile network users a pair of indices that allows them to assess the quality of service and effectiveness without being experts. In other words, an additional tool for assessment is proposed that does not replace the KPIs recommended by regulators. Particularly for QoS, the weighting assigned to the download speed and upload speed KPIs in the FIS-AHP is because this pair is decisive in the data transfer of over-the-top services. Similarly, importance was assigned to the KPI of the packet loss rate for effectiveness, considering that this KPI is essential in evaluating the effectiveness of data transfer.
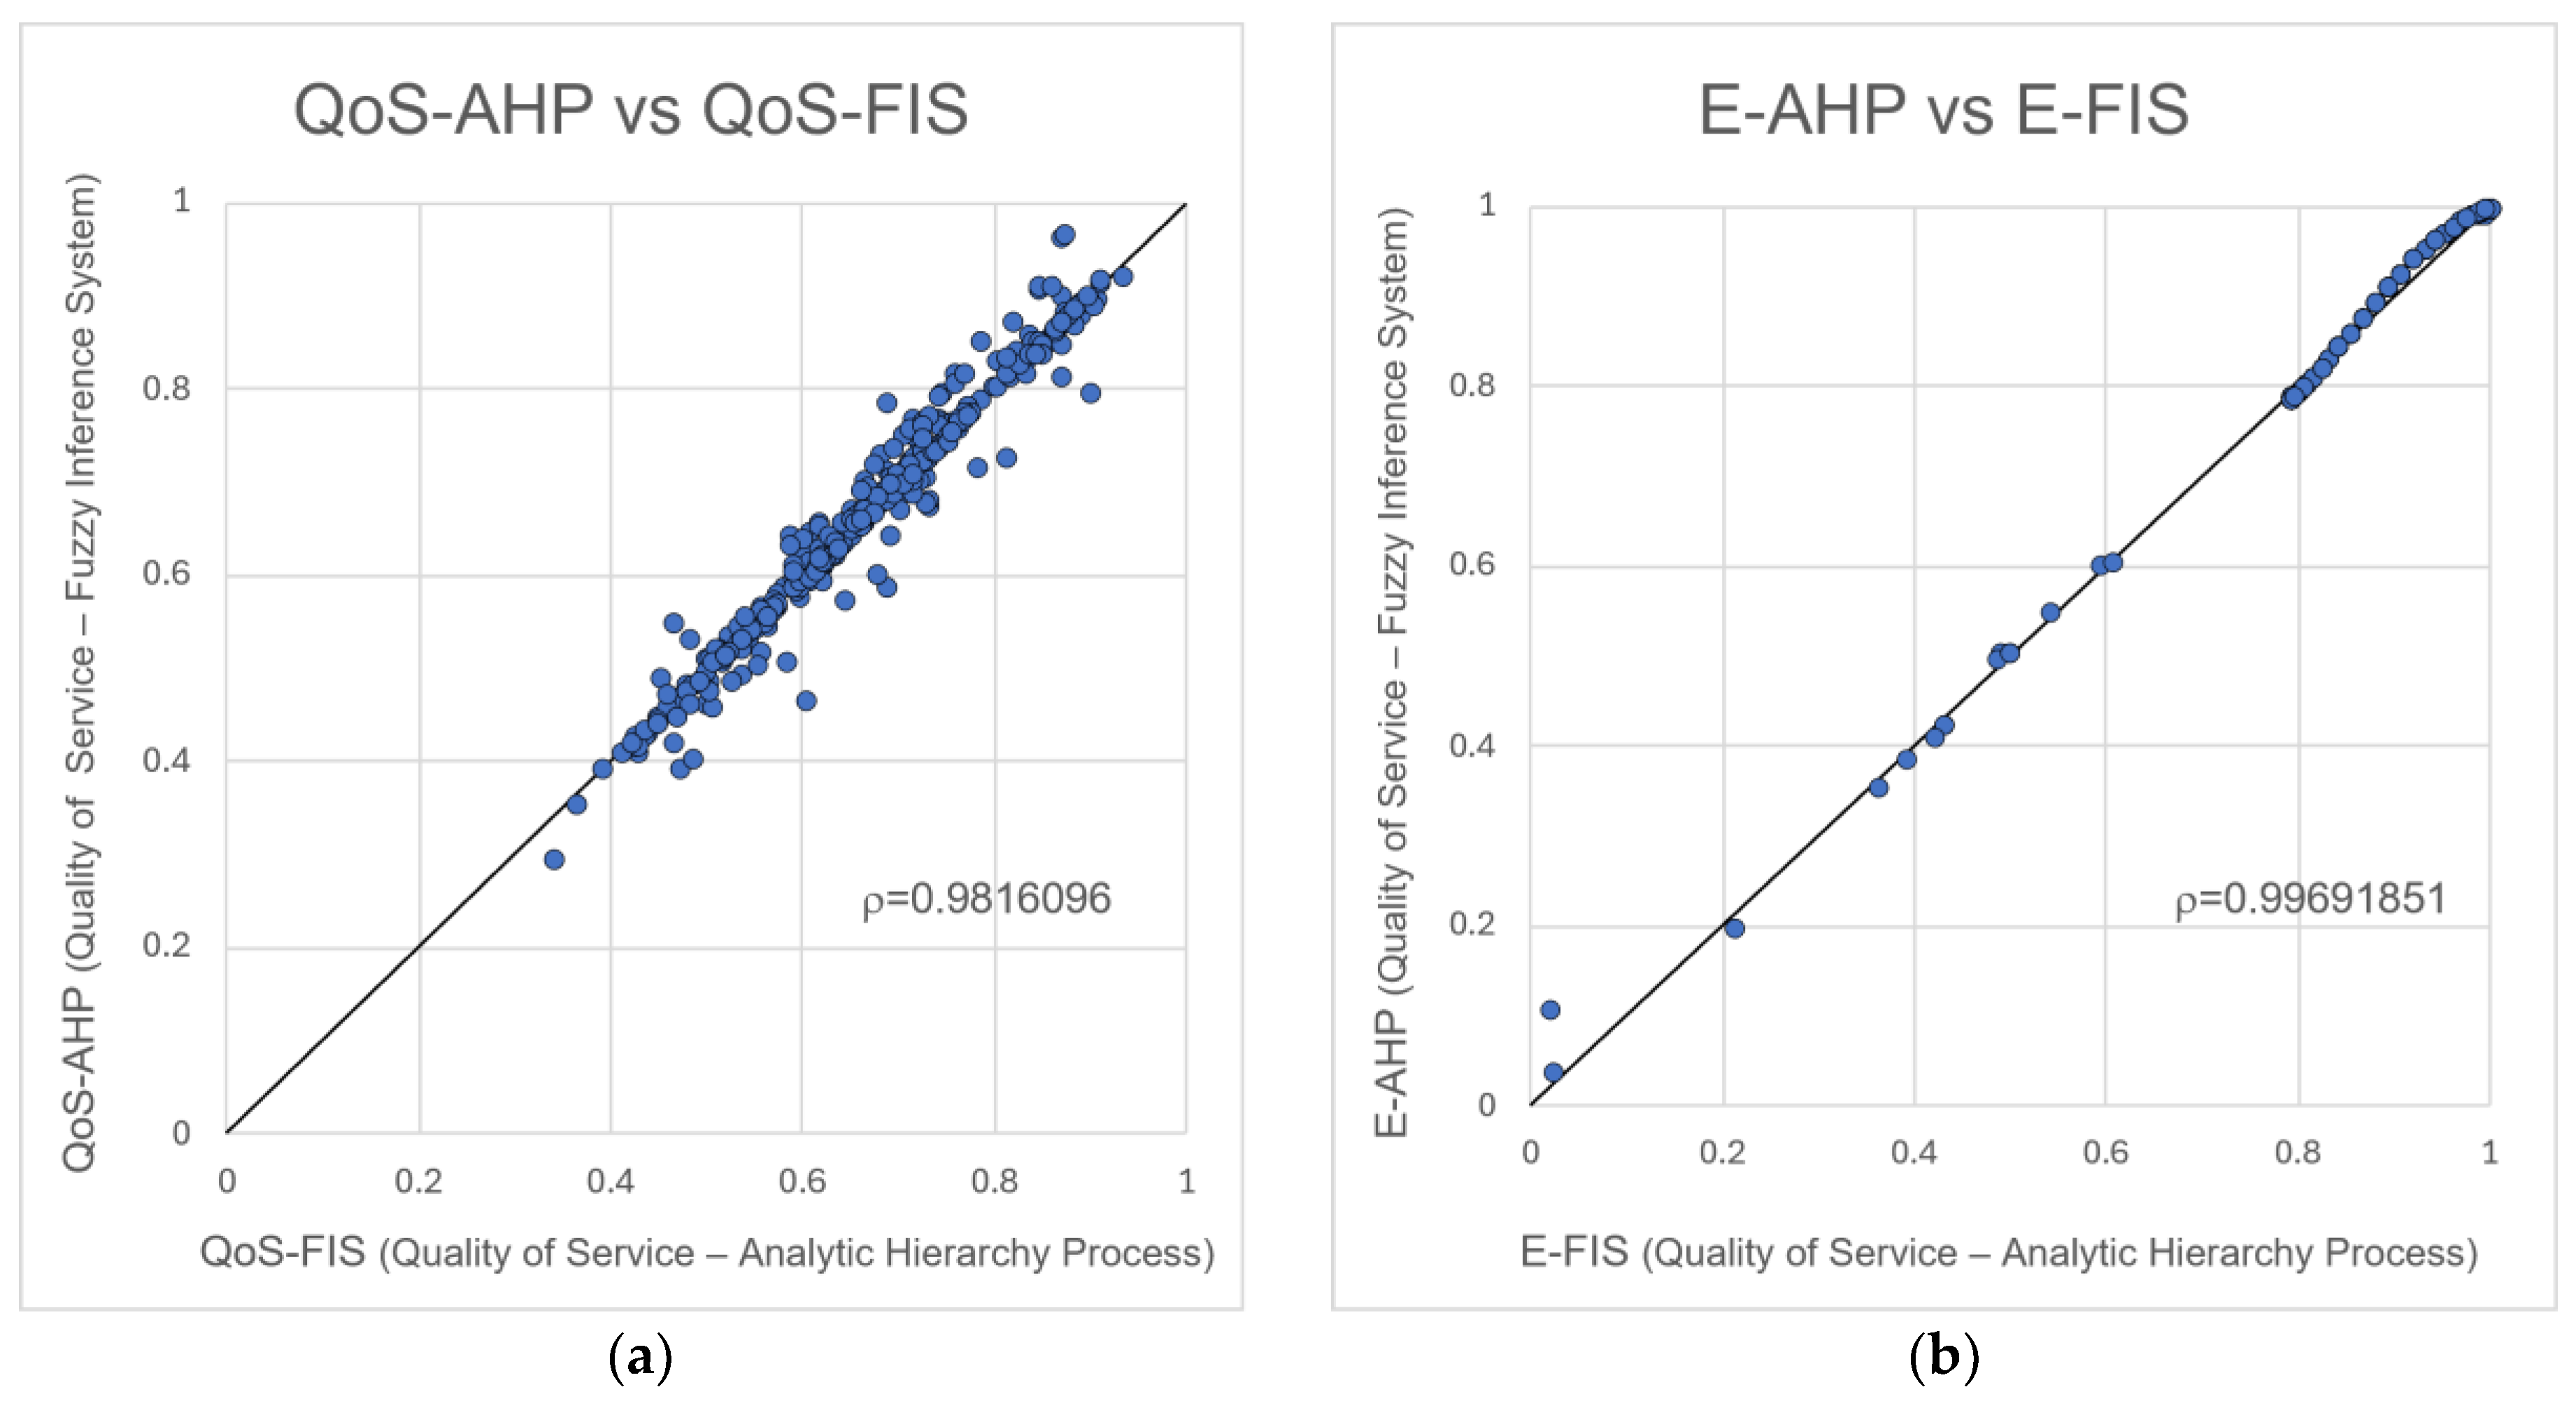
To discuss the results, an example is presented in Figure 9. It can be observed that the evaluation coefficient of the absolute values (ρ) in (a) and (b) is positive. In addition, in both sections, there is a strong relationship between the evaluation models due to the coincidence in the behavior of the input KPIs of the evaluation with the FIS and the importance weights assigned in each AHP. The differences in Figure 9a between the QoS-FIS and the QoS-AHP can be seen in different data samples. This is caused because, in the AHP evaluation, the importance weights assigned to the upload and download speed amplify or attenuate the behavior of the quality of service concerning the FIS. In the AHP evaluation, the importance levels assigned to each KPI were based on the relevance of the quality parameters in the performance of OTT applications recommended in the ITU Quality of Service Regulator Manual. Download and upload speed are the most relevant, followed by packet loss rate, jitter, latency, RSRP, and RSRQ.
In other words, if the data samples from the information repository have values in the ranges of 55 to 300 Mbps and 20.5 to 100 Mbps for download and upload speed, respectively, or in linguistic terms, they have a high value for both, they will influence more than the rest of the KPIs to amplify the result of the evaluation. On the contrary, if the data samples have low linguistic values or values in the range of 0 to 21 Mbps for the upload speed or 0 to 7.5 Mbps for the download speed, they will weaken the result of the Quality of Service Index.
Meanwhile, Figure 9b shows a more significant difference between the E-FIS and E-AHP models in the effectiveness evaluations with values of less than 1% because the influence of the weighting on the packet loss rate is more critical than RSRQ’s. In this case, the AHP evaluation is amplified. The rest of the values compared between E-FiS and EAHP present an average difference of 1% due to the similarity between both evaluation models.

5. Conclusions

In this work, a new computational model was proposed to evaluate the quality of service and the effectiveness of data transfer in the LTE mobile network, using the fFuzzy inference system (FIS) and an Analytic Hierarchy Process. The KPIs of download speed, upload speed, latency, jitter, packet loss rate, RSRP, and RSRQ were evaluated to provide an extra tool to users and regulators of mobile networks. Different works have been developed around the evaluation of QoS, but the importance of developing specialized models depends on the types of data to be analyzed; in this case, data are collaboratively collected by user equipment. Firstly, telecommunications experts carry out QoS evaluations, and users only have a subjective perception of this quality of service. On the other hand, providing an additional tool to users or regulators will allow them to identify undesirable quality situations based on the different values of the KPIs. It is essential to mention that the proposed model can be adapted to other information repositories collected with specialized equipment, not necessarily with user equipment or other more advanced generation mobile networks such as 5G or sixth generation (6G). Therefore, for future work, it is considered that the computational model should be adapted with other information repositories from other geographical areas, in addition to integrating other artificial intelligence techniques such as Adaptive Neuro-fuzzy Inference Systems (ANFIS), multilayer perceptron networks (MLP), recurrent networks (RNN), or generative adversarial networks (GANs) to evaluate the eight KPIs and five key quality indicators (KQI) in the scenario of enhanced mobile broadband use of the 5G network.

Author Contributions

Conceptualization, methodology, investigation, supervision, validation, funding acquisition, project administration, review, and editing, L.P.S.-F.; Conceptualization, investigation, methodology, data acquisition, formal analysis, validation, software, visualization, and writing—original draft preparation, J.E.Z.-H.; Conceptualization, methodology, investigation, supervision, verification, review, and editing, L.M.R.-M. All authors have read and agreed to the published version of the manuscript.

Funding

This work was supported by the Instituto Politécnico Nacional, México SIP 20241747-20231285, and the Mexican Council for Humanities, Science and Technology (CONAHCYT). We want to thank the Telecommunications Engineering branch of the Postgraduate Sciences program (PCIT), which is part of the Postgraduate Studies and Research Section (SEPI) at the Higher School of Mechanical and Electrical Engineering (ESIME), Zacatenco unit.

Data Availability Statement

The data presented in this study are available upon request from the corresponding author.

Conflicts of Interest

The authors declare no conflicts of interest.

Appendix A

Table A1. The telecommunications department of IPN ESIME Zacatenco provided the information repository.
Field Name in ExtractDefinitionData TypeMax Field Size
test_idA unique ID for every speed test performed based on the platform.number11
test_dateThe date and time of the test are in UTC (default). Previously, this data was presented in Pacific time (default).datetime19
download_kbpsThe result of the download portion of the test was measured in kilobits per second.number11
upload_kbpsThe result of the upload portion of the test was measured in kilobits per second.number11
latencyThe result of the latency portion of the test was measured in milliseconds.number6
ploss_sent_aThe number of packages sent to the host server from the device. To determine packet loss percentage, take the ploss_recv divided by ploss_sent. A 100% means zero packet loss since 100% of the packets were sent and received.number5
ploss_recv_aThe number of packages received by the host server from the device. To determine packet loss percentage, take the ploss_recv divided by ploss_sent. A 100% means zero packet loss since 100% of the packets were sent and received.number5
rsrp_aReference Signal Received Power. LTE metric displaying the received power of the reference LTE signal, similar to the old school “signal strength”. Range: −40 to −140, where −140 is the lowest and −44 is the highest the device will report.number4
rsrq_aReference Signal Received Quality The received quality of the LTE reference signal. Range: −19.5 to −3, where −3 is the best.number5

References

  1. AL-nasrawi, M.; AL-Din Makki, S.V.; Al-Sabbagh, A. KPI Analysis of 4G/5G Networks. Prz. Elektrotech. 2024, 7, 67–71. [Google Scholar] [CrossRef]
  2. Imoize, A.L.; Udeji, F.; Isabona, J.; Lee, C.C. Optimizing the Quality of Service of Mobile Broadband Networks for a Dense Urban Environment. Future Internet 2023, 15, 181. [Google Scholar] [CrossRef]
  3. El-Saleh, A.A.; Alhammadi, A.; Shayea, I.; Hassan, W.H.; Honnurvali, M.S.; Daradkeh, Y.I. Measurement Analysis and Performance Evaluation of Mobile Broadband Cellular Networks in a Populated City. Alex. Eng. J. 2023, 66, 927–946. [Google Scholar] [CrossRef]
  4. Imoize, A.L.; Obakhena, H.I.; Anyasi, F.I.; Sur, S.N. A Review of Energy Efficiency and Power Control Schemes in Ultra-Dense Cell-Free Massive MIMO Systems for Sustainable 6G Wireless Communication. Sustainability 2022, 14, 11100. [Google Scholar] [CrossRef]
  5. Hossfeld, T.; Wunderer, S.; Ben Houidi, Z.; Beyer, A.; Casas, P.; Gassner, C.; Guillemin, F.; Hall, A.; Hirth, M.; Robitza, W.; et al. White Paper “Crowdsourced Network and QoE Measurements—Definitions, Use Cases and Challenges”. arXiv 2020, arXiv:2006.16896. [Google Scholar]
  6. Ogundokun, R.O.; Awotunde, J.B.; Imoize, A.L.; Li, C.T.; Abdulahi, A.R.T.; Adelodun, A.B.; Sur, S.N.; Lee, C.C. Non-Orthogonal Multiple Access Enabled Mobile Edge Computing in 6G Communications: A Systematic Literature Review. Sustainability 2023, 15, 7315. [Google Scholar] [CrossRef]
  7. Silalahi, L.M.; Uli, I.; Simanjuntak, V.; Budi-Yanto, S.; Silaban, F.A.; Dendi Rochendi, A.; Osman, G. Analysis of Lte 900 Implementation to Increase Coverage and Capacity of 4g Lte Network On Telkomsel Provider. In Proceedings of the Conference on Broad Exposure to Science and Technology 2021 (BEST 2021), Virtual, 31 August 2021; Atlantis Press: Amsterdam, The Netherlands, 2022; Volume 210, pp. 166–172. [Google Scholar] [CrossRef]
  8. 3GPP Universal Mobile Telecommunications System (UMTS), LTE, Architecture Enha Plane Separation of EPC Nodes. 2017. Available online: https://www.etsi.org/deliver/etsi_ts/123200_123299/123214/14.02.00_60/ts_123214v140200p.pdf (accessed on 25 June 2024).
  9. Dahj, J.N.M.; Ogudo, K.A.; Boonzaaier, L. A Hybrid Analytical Concept to QoE Index Evaluation: Enhancing EMBB Service Detection in 5G SA Networks. J. Netw. Comput. Appl. 2024, 221, 103765. [Google Scholar] [CrossRef]
  10. GSA. Global Mobile Suppliers Association 5G Standalone: November Executive Summary. Available online: https://gsacom.com/paper/5g-standalone-november-executive-summary/ (accessed on 22 September 2024).
  11. Taheribakhsh, M.; Jafari, A.H.; Peiro, M.M.; Kazemifard, N. 5G Implementation: Major Issues and Challenges. In Proceedings of the 2020 25th International Computer Conference, Computer Society of Iran (CSICC), Tehran, Iran, 1–2 January 2020. [Google Scholar] [CrossRef]
  12. Instituto Federal de Telecomunicaciones ARQUITECTURA 5G. Available online: https://sensor5g.ift.org.mx/arquitectura5g (accessed on 21 September 2024).
  13. Kumar, R.; Sinwar, D.; Singh, V. QoS Aware Resource Allocation for Coexistence Mechanisms between EMBB and URLLC: Issues, Challenges, and Future Directions in 5G. Comput. Commun. 2024, 213, 208–235. [Google Scholar] [CrossRef]
  14. Khan, S.A.; Shayea, I.; Ergen, M.; Mohamad, H. Handover Management over Dual Connectivity in 5G Technology with Future Ultra-Dense Mobile Heterogeneous Networks: A Review. Eng. Sci. Technol. Int. J. 2022, 35, 101172. [Google Scholar] [CrossRef]
  15. Yeh, C.; Choi, Y.-S.; Ko, Y.-J.; Kim, I.-G. Standardization and Technology Trends of Artificial Intelligence for Mobile Systems. Comput. Commun. 2024, 213, 169–178. [Google Scholar] [CrossRef]
  16. Preciado-Velasco, J.E.; Gonzalez-Franco, J.D.; Anias-Calderon, C.E.; Nieto-Hipolito, J.I.; Rivera-Rodriguez, R. 5G/B5G Service Classification Using Supervised Learning. Appl. Sci. 2021, 11, 4942. [Google Scholar] [CrossRef]
  17. Omer, A.S.; Tufa, A.D.; Debella, T.T.; Woldegebreal, D.H. Hidden Markov Models for Predicting Cell-Level Mobile Networks Performance Degradation. e-Prime Adv. Electr. Eng. Electron. Energy 2024, 9, 100742. [Google Scholar] [CrossRef]
  18. Saad, S.A.; Shayea, I.; Sid Ahmed, N.M.O. Artificial Intelligence Linear Regression Model for Mobility Robustness Optimization Algorithm in 5G Cellular Networks. Alex. Eng. J. 2024, 89, 125–148. [Google Scholar] [CrossRef]
  19. Kakkavas, G.; Diamanti, M.; Stamou, A.; Karyotis, V.; Bouali, F.; Pinola, J.; Apilo, O.; Papavassiliou, S.; Moessner, K. Design, Development, and Evaluation of 5G-Enabled Vehicular Services: The 5G-HEART Perspective. Sensors 2022, 22, 426. [Google Scholar] [CrossRef]
  20. Mir, Z.H.; Dreyer, N.; Kürner, T.; Filali, F. Investigation on Cellular LTE C-V2X Network Serving Vehicular Data Traffic in Realistic Urban Scenarios. Futur. Gener. Comput. Syst. 2024, 161, 66–80. [Google Scholar] [CrossRef]
  21. Huang, C.M.; Wang, H.I. Fuzzy-Rule-Decided Small Cell Offloading for Rate-Adaptive SVC-DASH Video Streaming over the Vehicle Environment. Comput. Commun. 2023, 212, 1–20. [Google Scholar] [CrossRef]
  22. Ben Slimen, Y.; Balcerzak, J.; Pagès, A.; Agraz, F.; Spadaro, S.; Koutsopoulos, K.; Al-Bado, M.; Truong, T.; Giardina, P.G.; Bernini, G. Quality of Perception Prediction in 5G Slices for E-Health Services Using User-Perceived QoS. Comput. Commun. 2021, 178, 1–13. [Google Scholar] [CrossRef]
  23. Al-Azzeh, J.S.; Odarchenko, R.; Abakumova, A.; Bondar, S. Method for QOE Monitoring and Increasing in Cellular Networks Based on QOE-to-QOS Mapping Using Spline Approximation. Eurasip J. Wirel. Commun. Netw. 2022, 2022, 43. [Google Scholar] [CrossRef]
  24. Satka, Z.; Ashjaei, M.; Fotouhi, H.; Daneshtalab, M.; Sjodin, M.; Mubeen, S. QoS-MAN: A Novel QoS Mapping Algorithm for TSN-5G Flows. In Proceedings of the 2022 IEEE 28th International Conference on Embedded and Real-Time Computing Systems and Applications (RTCSA), Taipei, Taiwan, 23–25 August 2022; pp. 220–227. [Google Scholar] [CrossRef]
  25. Stafecka, A.; Lizunovs, A.; Bobrovs, V. Mobile LTE Network Signal and Quality of Service Parameter Evaluation from End-User Premises. In Proceedings of the 2018 Advances in Wireless and Optical Communications (RTUWO), Riga, Latvia, 15–16 November 2018; IEEE: Piscataway, NJ, USA, 2018. [Google Scholar]
  26. Bermudez, H.F.; Martinez-Caro, J.M.; Sanchez-Iborra, R.; Arciniegas, J.L.; Cano, M.D. Live Video-Streaming Evaluation Using the ITU-T P.1203 QoE Model in LTE Networks. Comput. Netw. 2019, 165, 106967. [Google Scholar] [CrossRef]
  27. Torres Vega, M.; Mocanu, D.C.; Stavrou, S.; Liotta, A. Predictive No-Reference Assessment of Video Quality. Signal Process. Image Commun. 2017, 52, 20–32. [Google Scholar] [CrossRef]
  28. García-Pineda, M.; Segura-García, J.; Felici-Castell, S. A Holistic Modeling for QoE Estimation in Live Video Streaming Applications over LTE Advanced Technologies with Full and Non Reference Approaches. Comput. Commun. 2018, 117, 13–23. [Google Scholar] [CrossRef]
  29. Vaser, M.; Forconi, S. QoS KPI and QoE KQI Relationship for LTE VIdeo Streaming and VoLTE Services. In Proceedings of the 2015 9th International Conference on Next Generation Mobile Applications, Services and Technologies, Cambridge, UK, 9–11 September 2015; pp. 318–323. [Google Scholar] [CrossRef]
  30. Ghalut, T.; Larijani, H.; Shahrabi, A. QoE-Aware Optimization of Video Stream Downlink Scheduling Over LTE Networks Using RNNs and Genetic Algorithm. Procedia Comput. Sci. 2016, 94, 232–239. [Google Scholar] [CrossRef]
  31. Ferdosian, N.; Othman, M.; Ali, B.M.; Lun, K.Y. Throughput-Aware Resource Allocation for QoS Classes in LTE Networks. Procedia Comput. Sci. 2015, 59, 115–122. [Google Scholar] [CrossRef]
  32. Uyan, O.G.; Gungor, V.C. QoS-Aware LTE-A Downlink Scheduling Algorithm: A Case Study on Edge Users. Int. J. Commun. Syst. 2019, 32, e4066. [Google Scholar] [CrossRef]
  33. Sánchez, P.A.; Luna-Ramírez, S.; Toril, M.; Gijón, C.; Bejarano-Luque, J.L. A Data-Driven Scheduler Performance Model for QoE Assessment in a LTE Radio Network Planning Tool. Comput. Netw. 2020, 173, 107186. [Google Scholar] [CrossRef]
  34. Paz-Arteaga, C.S.; Martínez-Gómez, E.J.; Quintero-Flórez, V.M.; Hernández, C.M. A LTE Basic System Level Simulator on Capacity. In Proceedings of the 2014 IEEE Colombian Conference on Communications and Computing (COLCOM), Bogota, Colombia, 4–6 June 2014; pp. 1–6. [Google Scholar]
  35. Kurda, R. Heterogeneous Networks: Fair Power Allocation in LTE-A Uplink Scenarios. PLoS ONE 2021, 16, e0252421. [Google Scholar] [CrossRef]
  36. Lai, L.; Feng, D.; Zheng, F.C.; Wang, X.; Yang, H.H.; Quek, T.Q.S. CQI-Based Interference Detection and Resource Allocation with QoS Provision in LTE-U Systems. IEEE Trans. Veh. Technol. 2021, 70, 1421–1433. [Google Scholar] [CrossRef]
  37. Lai, W.K.; Tang, C.L. QoS-Aware Downlink Packet Scheduling for LTE Networks. Comput. Netw. 2013, 57, 1689–1698. [Google Scholar] [CrossRef]
  38. Aboelezz, Z.A.; Nafea, H.B.; Zaki, F.W. Handover and QoS Control in LTE HetNet Based on Fuzzy Logic Design. In Proceedings of the 2019 7th International Japan-Africa Conference on Electronics, Communications, and Computations, (JAC-ECC), Alexandria, Egypt, 15–16 December 2019; pp. 178–183. [Google Scholar] [CrossRef]
  39. Nafea, H.B.; Aboelezz, Z.A.; Zaki, F.W. Quality of Service (QoS) for LTE Network Based on Adaptive Neuro Fuzzy Inference System. IET Commun. 2021, 15, 683–694. [Google Scholar] [CrossRef]
  40. MathWorks. Tuning Fuzzy Inference Systems—MATLAB & Simulink—MathWorks América Latina; MathWorks: Natick, MA, USA, 2024. [Google Scholar]
  41. Guillaume, S. Designing Fuzzy Inference Systems from Data: An Interpretability-Oriented Review. IEEE Trans. Fuzzy Syst. 2001, 9, 426–443. [Google Scholar] [CrossRef]
  42. Guillaume, S.; Magdalena, L. Expert Guided Integration of Induced Knowledge into a Fuzzy Knowledge Base. Soft Comput. 2006, 10, 773–784. [Google Scholar] [CrossRef]
  43. Geng, X.; Ma, H.; Jiao, L.; Zhou, Z.J. Data-and Knowledge-Driven Belief Rule Learning for Hybrid Classification. Inf. Sci. 2024, 681, 121201. [Google Scholar] [CrossRef]
  44. Saaty, T.L. Decision Making—The Analytic Hierarchy and Network Processes (AHP/ANP). J. Syst. Sci. Syst. Eng. 2004, 13, 1–35. [Google Scholar] [CrossRef]
  45. Chakraborty, S.; Dey, S. QFD-Based Expert System for Non-Traditional Machining Processes Selection. Expert Syst. Appl. 2007, 32, 1208–1217. [Google Scholar] [CrossRef]
  46. Liu, S.M.; Pan, S.; Mi, Z.K.; Meng, Q.M.; Xu, M.H. A Simple Additive Weighting Vertical Handoff Algorithm Based on SINR and AHP for Heterogeneous Wireless Networks. In Proceedings of the 2010 International Conference on Intelligent Computation Technology and Automation, Changsha, China, 11–12 May 2010; Volume 1, pp. 347–350. [Google Scholar] [CrossRef]
  47. Olvera-García, M.Á.; Carbajal-Hernández, J.J.; Sánchez-Fernández, L.P.; Hernández-Bautista, I. Air Quality Assessment Using a Weighted Fuzzy Inference System. Ecol. Inform. 2016, 33, 57–74. [Google Scholar] [CrossRef]
  48. Topuz, E.; van Gestel, C.A.M. An Approach for Environmental Risk Assessment of Engineered Nanomaterials Using Analytical Hierarchy Process (AHP) and Fuzzy Inference Rules. Environ. Int. 2016, 92–93, 334–347. [Google Scholar] [CrossRef] [PubMed]
  49. Vigueras-Velázquez, M.E.; Carbajal-Hernández, J.J.; Sánchez-Fernández, L.P.; Vázquez-Burgos, J.L.; Tello-Ballinas, J.A. Weighted Fuzzy Inference System for Water Quality Management of Chirostoma Estor Estor Culture. Aquac. Rep. 2020, 18, 100487. [Google Scholar] [CrossRef]
  50. Ocampo-Duque, W.; Ferré-Huguet, N.; Domingo, J.L.; Schuhmacher, M. Assessing Water Quality in Rivers with Fuzzy Inference Systems: A Case Study. Environ. Int. 2006, 32, 733–742. [Google Scholar] [CrossRef] [PubMed]
  51. Hoil Rosas, C.A.; Carbajal Hernández, J.J.; Sánchez Fernández, L.P.; Niebla Zatarain, V.B.; Dávila Lamas, A.D. Modelo Analítico Jerárquico Para La Evaluación de Factores Turísticos En Playas. Econ. Soc. Territ. 2020, 20, 865–898. [Google Scholar] [CrossRef]
  52. Dávila-Lamas, A.D.; Carbajal-Hernández, J.J.; Sánchez-Fernández, L.P.; Niebla-Zatarain, V.B.; Hoil-Rosas, C.A. Assessment of Coastal Locations Safety Using a Fuzzy Analytical Hierarchy Process-Based Model. Sustainability 2022, 14, 5972. [Google Scholar] [CrossRef]
  53. Kaur, R.; Mittal, S. Multi Criteria Based Handoff Using FAHP and Fuzzy Inference System. In Proceedings of the 2019 International Conference on Data Science and Communication (IconDSC), Bangalore, India, 1–2 March 2019. [Google Scholar] [CrossRef]
  54. Singh, U.; Dua, A.; Kumar, N.; Tanwar, S.; Iqbal, R.; Hijji, M.; Amin, S.; Sharma, R. Scalable Priority-Based Resource Allocation Scheme for M2M Communication in LTE/LTE-A Network. Comput. Electr. Eng. 2022, 103, 108321. [Google Scholar] [CrossRef]
  55. International Telecommunication Union Quality of Service Regulation Manual. Available online: https://www.itu.int/dms_pub/itu-d/opb/pref/D-PREF-BB.QOS_REG01-2017-PDF-E.pdf (accessed on 20 April 2023).
  56. Zaldivar-Herrera, J.E.; Sánchez-Fernández, L.P.; Rodríguez-Méndez, L.M.; Zagaceta-Álvarez, M.T. A Fuzzy Inference Model for Evaluating Data Transfer in LTE Mobile Networks via Crowdsourced Data. Comput. Sist. 2024, 28, 923–944. [Google Scholar] [CrossRef]
  57. Bhattacharyya, R.; Mukherjee, S. Fuzzy Membership Function Evaluation by Nonlinear Regression: An Algorithmic Approach. Fuzzy Inf. Eng. 2020, 12, 412–434. [Google Scholar] [CrossRef]
  58. Saxena, P.; Jain, R. Bector-Chandra Type Linear Programming Duality under Fuzzy Environment with Parabolic Concave Membership Functions. In Proceedings of the 3rd International Conference on Reliability, Infocom Technologies and Optimization, Noida, India, 8–10 October 2014. [Google Scholar] [CrossRef]
  59. Zadeh, L.A. A Rationale for Fuzzy Control. J. Dyn. Syst. Meas. Control 1972, 94, 3–4. [Google Scholar] [CrossRef]
  60. Saaty, T.L. Fundamentals of Decision Making and Priority Theory with the Analytic Hierarchy Process. Google Books. Available online: https://books.google.com.mx/books?hl=en&lr=&id=wct10TlbbIUC&oi=fnd&pg=PT1&ots=_E1uSR2Fy8&sig=HHEfWinzB4PsoL2AgkwyMdq6CzQ&redir_esc=y#v=onepage&q&f=false (accessed on 13 September 2024).
  61. Saaty, T.L. The Analytic Hierarchy Process: Planning, Priority Setting, Resource Allocation; McGraw-Hill: New York, NY, USA, 1980; ISBN 0-07-054371-2. [Google Scholar]
  62. Kelechi, A.H.; Samson, U.A.; Simeon, M.; Obinna, O.; Alex, A.; Aderemi, A.A. The Quality of Service of the Deployed LTE Technology by Mobile Network Operators in Abuja-Nigeria. Int. J. Electr. Comput. Eng. 2021, 11, 2191–2202. [Google Scholar] [CrossRef]
  63. Perron, O. Zur Theorie Der Matrices. Math. Ann. 1907, 64, 248–263. [Google Scholar] [CrossRef]
Figure 1. Block diagram of weighted fuzzy inference system.
Mathematics 12 03985 g001
Figure 2. Architecture of the weighted fuzzy inference system for evaluating the LTE mobile network’s quality of service (QoS) and data transfer effectiveness.
Mathematics 12 03985 g002
Figure 3. Membership functions, (a) Example of a sigmoid membership function, with its defining parameters. (b) Output membership functions used to obtain both the quality of service (QoS) and effectiveness (E) indices of the LTE mobile network.
Mathematics 12 03985 g003
Figure 4. Example of the operation of a fuzzy rule to obtain the effectiveness index. The assignment of weights w P L R and w R S R P is chosen according to the membership function determining the output rule. In this case, the packet loss rate membership function and w P L R define the maximum output rule.
Mathematics 12 03985 g004
Figure 5. Fuzzy inference architecture for 4G LTE network QoS assessment using rules 240 and 241. The output rule membership values are used to truncate the QoS membership function. Then, all the truncated functions ( μ Q o S ) are combined to create a final membership function ( μ g ). Subsequently, the centroid method ( C M ) is used to calculate the output score.
Mathematics 12 03985 g005
Figure 6. Analysis of each KPI of the repository of information collected with user equipment, (a) download speed, (b) upload speed, (c) latency, (d) jitter, (e) packet loss rate, (f) RSRP, and (g) RSRQ.
Mathematics 12 03985 g006aMathematics 12 03985 g006b
Figure 7. Comparison between the evaluations obtained from QoS-FIS and the proposed QoS-AHP.
Mathematics 12 03985 g007
Figure 8. Comparison between the evaluations obtained from Effectiveness-FIS and the proposed Effectiveness-AHP.
Mathematics 12 03985 g008
Figure 9. Correlation between index (a) assessment between the quality of service index obtained with the proposed Analytic Hierarchy Process (QoS-AHP) and the quality of service index obtained with the fuzzy inference system (QoS-FIS). (b) estimation between the effectiveness index obtained with the proposed Analytic Hierarchy Process (E-AHP) and the effectiveness index obtained with the fuzzy inference system (E-FIS).
Mathematics 12 03985 g009
Table 1. Key performance indicators dataset statistics.
KPI of QoSUnitsMeanVarianceStandard Deviation
Download speedMbps34.591006.3531.72
Upload speedMbps18.50188.2013.71
Latencyms29.40246.8315.71
Jitterms8.0523.344.83
Packet loss rate%180.06 × 10−61 × 10−61 × 10−3
RSRPdBm–96.68130.8911.4
RSRQdB–11.078.982.99
Table 2. Classification of KPI ranges with linear units for evaluating the quality of service and effectiveness of the LTE network. Each range is defined by the valid limits lower ( Q l ), upper ( Q u ), and the optimal value represented by Q m .
KPIClassificationRangesFuzzy Limits
QlQmQu
Download speedLow[0 to 21]438
Medium[21 to 55]43872
High[55 to 300]3872
Upload speedLow[0 to 7.5]114
Medium[7.5 to 20.5]11427
High[20.5 to 100]1427
LatencyLow[0 to 25.5]150
Medium[25.5 to 74.5]15099
High[74.5 to 100]5099
JitterLow[0 to 7.5]015
Medium[7.5 to 20.5]01530
High[20.5 to 100]1530
Packet loss rateLow[0 to 7.5]00.005
Medium[7.5 to 20.5]00.0050.01
High[20.5 to 100]0.0050.01
Table 3. Classification of KPI ranges with nonlinear units for evaluating LTE service quality and network effectiveness. Each range is defined by Q a n and Q c n boundaries, which determine the slope and the crossover point value, respectively.
KPIClassificationRangesFuzzy Limits
Q a 1 Q c 1 Q a 2 Q c 2
RSRPLow[–120 to –96]–25–101
Medium[–96 to –70]25–101–25–63
High[–70 to –44]25–63
RSRQLow[–19.5 to –14]–25–15.375
Medium[–14 to –8.5]25–15.375–25–7.125
High[–8.5 to –3]125–7.125
Table 4. Example of the fuzzy rules defined in the FIS according to the expert knowledge of the LTE network.
Fuzzy Rules
R1: If download speed is Low and upload speed is Low and latency is High and jitter is High and packet loss ratio is High then QoS is Very poor.
R18: If download speed is Low and upload speed is Low and latency is Medium and jitter is High and packet loss ratio is High and RSRQ is High then QoS is Poor.
R189: If download speed is Medium and upload speed is Low and latency is Low and jitter is Low and packet loss ratio is High then QoS is Acceptable.
R433: If download speed is High and upload speed is High and latency is Low and jitter is Low and packet loss ratio is Low then QoS is Very Good.
R435: If packet loss ratio is High and RSRP is Medium then Effectiveness is Poor.
R438: If packet loss ratio is Medium and RSRP is Medium then Effectiveness is Acceptable.
R441: If packet loss ratio is Low and RSRP is Medium then Effectiveness is Good.
Table 5. Fuzzy function parameters are used to determine the FIS output.
QoS or EffectivenessParameterValue
Very poor c −50
c 1 = c 2 0.125
Poor a 1 = a 2 50
c 1 0.125
c 2 0.375
Acceptable a 1 = a 2 50
c 1 0.375
c 2 0.625
Good a 1 = a 2 50
c 1 0.625
c 2 0.875
Very poor a 1 = a 2 50
c 1 = c 2 0.825
Table 6. Interpret the relative importance scale for obtaining the service quality and effectiveness indices according to [44].
Scale123456789
ImportanceEqualWeakModerateModerate+StrongStrong+VeryVery+Extreme
KPI to QoS *Download Speed/Upload Speed Packet Loss RateJitterLatencyRSRQ
KPI to E **Packet Loss RateRSRP
* Key performance indicators are used to obtain the quality of service index. ** Key performance indicators are used to obtain the effectiveness index.
Table 7. Random consistency index [44].
Matrix Size (n)12345678910
R I 000.520.891.111.251.351.41.451.49
Table 8. Numerical comparison between LTE network quality of service indices.
Key Performance IndicatorsQuality of Service
No.Download SpeedUpload SpeedLatencyJitterPacket Loss RateRSRQQoS-FISQoS-AHPDifference
QoS
(Mbps)(Mbps)(ms)(ms)×102 (%)(dB)×102 (%)×102 (%)×102 (%)
121.9226.436319.20−80.690754420.689549490.0012049
267.94327.148327.80−80.839074630.83940658–0.0003319
1742.25818.604537.10−60.686956120.78890377–0.1019476
4966.15738.405163.30−150.897101230.796832360.1002688
6370.72947.714121.90−70.930229360.92158990.0086394
6473.72840.81144.40−70.889477850.882421990.0070558
9971.40138.8482250−50.866347040.96546328–0.0991162
11615.57813.683142.30−160.68726450.589777280.0974872
2287.29.535153.10−180.601382470.466285290.1350971
30316.2392.3074213.10−120.544134380.54499786–0.0008634
3044.4744.2412119.30.003597122−170.337566520.339314450.0419891
30574.01745.95183.30−90.893562430.90416858–0.0106061
36570.88936.202166.50−30.869945190.96871253–0.098767
37826.1934.579178.70−120.61694460.62113169–0.004187
37956.694272115.10−130.847513760.8387010.008812
38022.1869.661913.90−90.658593320.66158947–0.002996
Table 9. Numerical comparison between indices of LTE network effectiveness.
Key Performance IndicatorsEffectiveness
No.Packet Loss RateRSRPEffectiveness-FISEffectiveness-AHPDifference Effectiveness
×102 (%)(mdB)×102 (%)×102 (%)×102 (%)
10−1040.815533270.81244950.00308377
20−1040.815533270.81244950.00308377
60−950.919444930.94246453−0.0230196
840.009950249−950.019345560.10958865−0.09024309
1570−810.999941550.998973330.00096821
2160−810.999941550.998973330.00096821
2170−810.999941550.998973330.00096821
2220−770.999759170.999542720.00021645
2540−770.999759170.999542720.00021645
3130.006711409−1100.212424740.200218290.01220645
3630.01−750.020588270.03952786−0.01893959
3720−770.999759170.999542720.00021645
Disclaimer/Publisher’s Note: The statements, opinions and data contained in all publications are solely those of the individual author(s) and contributor(s) and not of MDPI and/or the editor(s). MDPI and/or the editor(s) disclaim responsibility for any injury to people or property resulting from any ideas, methods, instructions or products referred to in the content.

