Article

How Do We Analyze the Accident Causation of Shield Construction of Water Conveyance Tunnels? A Method Based on the N-K Model and Complex Network

1
School of Management, Xi’an University of Architecture and Technology, Xi’an 710055, China
2
School of Economics and Management, Fuzhou University, Fuzhou 350116, China
3
Hanjiang-to-Weihe River Valley Water Diversion Project Construction Co., Ltd., Xi’an 710100, China
*
Author to whom correspondence should be addressed.
Mathematics 2024, 12(20), 3222; https://doi.org/10.3390/math12203222
Submission received: 19 September 2024 / Revised: 11 October 2024 / Accepted: 12 October 2024 / Published: 15 October 2024

Abstract

:
In the construction of water conveyance tunnels with the shield method, accidents have occurred from time to time, such as collapses and explosions, and it is of practical significance to explore the cause mechanism of the accident. However, previous research has not considered the effects of dependence between risks on the risk spread. In response, we propose a method based on the Natural Killing Model (the N-K Model) and complex network theory to analyze the cause of shield construction accidents in water conveyance tunnels. By deeply exploring the transmission mechanism and action intensity between system risks, this method can scientifically clarify the accident cause mechanism and provide support for engineering construction safety management. The method constructs a risk index system. Secondly, we introduce the N-K model to reveal the risk coupling mechanism. Then, based on complex network theory, we construct the incident causation model and revise the node’s centrality with the coupling value. Finally, the network topology parameters are calculated to quantitatively describe the causal characteristics of accidents, revealing the risk evolution process and critical causes. The research results indicate that the key causes of accidents are failure to construct according to regulations, inadequate emergency measures, poor ability of judgment and decision-making, and insufficient understanding of abnormal situations. The front end of critical links is subject to human or management risks and should be carefully controlled during construction.

1. Introduction

Long-distance water diversion projects are essential for addressing the uneven distribution of water resources in China [1]. As the key component of long-distance water diversion projects, water transmission tunnels have the characteristics of high engineering proportion, complex construction conditions, and high construction difficulty. The shield tunneling method is widely used for constructing water conveyance tunnels [2]. Due to uncertain factors such as environmental conditions, personnel, and equipment, along with the continuous coupling and mutual catalysis of risk factors, the construction safety of shield tunneling in water conveyance tunnels faces multiple risks and challenges. In recent years, accidents have sometimes occurred in the construction of large water conveyance tunnels with shield methods, and the situation of production safety is serious. Table 1 shows some typical cases. Those accidents are often accompanied by serious project delays, high economic losses, casualties, and other irreversible injuries, resulting in serious social impacts. According to the document “Guiding Opinions on Further Strengthening the Safety Management of Tunnel Projects” issued by the Security Commission Office of the Ministry of Emergency Management, PRC (2023) No. 2, relevant departments are required to adhere to advanced pre-control, dynamic management of the whole process, strengthen risk management and control, effectively prevent the occurrence of tunnel (cave) construction safety accidents, and ensure the high-quality construction of major projects. Therefore, it is essential to analyze the risk factors in the system for construction safety.
Given this, some scholars have conducted relevant research. For the first time, Einstein [3] applied risk analysis to the actual case of tunnel projects, but the main focus was on the construction of methods rather than a deep dive into risks. Afterward, some scholars focused on risk assessment of tunnel construction, most of which analyzed a particular project or engineering area through constructing models or methods, including Random Decision Theory [4], Combinatorial weighting-nonlinear [5], Two-dimensional cloud model [6], Fuzzy Fault Tree [7], Fuzzy evidence reasoning [8], TOPSIS Model (Technique for Order Preference by Similarity to an Ideal Solution) [9], Anti-entropy weight method [10], and D-S Evidence Theory (Dempster-Shafer) [11,12]. In addition, some scholars focused on the causes of accidents [13], risk assessment [14], and risk level prediction [15] in shield tunneling or tunnel construction. Moreover, researchers have also considered the dynamism and uncertainty of risks in tunnel projects, particularly with the introduction of dynamic risk assessment [16]. Although traditional risk assessment and prediction have achieved basic risk analysis, they fail to reveal the interaction between risks. To further analyze the causality of risks, some scholars have studied the interactive mechanisms of risks during construction, including tunnel construction [17], subway construction [18], shield tunneling [19], and other fields. Most researchers focus on proposing a certain model and then validating it through case studies [20]. The research enables relevant management personnel to concentrate on factors that significantly impact construction safety. However, the applicability of these models may be limited and not easily generalized to other construction projects. Geological and surrounding conditions vary among different projects, making it less compelling to apply research conclusions and management suggestions from one project to another.
The water conveyance tunnel is crucial for water supply and transportation, but it has a long construction period and high difficulty. Compared to other construction methods, shield tunneling increases the danger and difficulty of construction. Therefore, it is essential to analyze the relationship between risks to avoid negative impacts on the entire project, such as construction delays, economic losses, and even casualties. In the past, scholars have explored the risks of shield construction for water conveyance tunnels using quantitative and qualitative methods, mainly focusing on risk assessment methods and risk prediction. These two types of research usually concentrate on the probability of risk occurrence and the weight of indicators to determine the importance of each risk. They have not been able to reveal the internal risk coupling mechanisms and causality, nor have they delved into the root causes of these risks. Most shield construction accidents in this field are caused by the interaction of risk factors. There is a robust nonlinear coupling between risks, but relevant research is thin on the ground. Accidents are the result of multi-factor interaction; that is, the system is a coupling body. When a problem arises in one part, it may quickly affect the whole [21]. Therefore, it is necessary to describe the interaction and causality between risk factors quantitatively and identify the causes of accidents to reduce safety accidents.
Given that construction systems involve numerous risk factors, many scholars have started describing the risk interactions and evaluating coupling degrees quantitatively. Pan, H. [22] established a coupling degree model to examine the risk coupling in the construction of subway shield tunnels. Guo, D. [23] created both the coupling degree model and the N-K model to calculate the coupling degree between homogeneous and heterogeneous factors and analyzed the correlation mechanism between tunnel construction risks. Xue, Y. [24] established a risk coupling model based on system dynamics to evaluate the risk level of high-speed railway projects during the simulation period. Liu, J. [25] constructed the DEMATEL-ISM-NK model (Decision-making Trial and Evaluation Laboratory-Interpretative Structural Modeling-Natural Killing Model) to explore the risk coupling mechanism of subway operation accidents from single-factor, dual-factor, and multi-factor perspectives. Chen, D. [26] applied the Reason SHEL model to establish the factor index system and designed a multi-dimensional association rule algorithm combined with the association rule algorithm to explore the causal chain of ship accidents. There are several common methods for analyzing risk coupling, including the coupling degree model, N-K model, S-D (System dynamics), and SHEL model (Software-Hardware-Environment-Liveware model). To select a coupling model suitable for this study, we briefly introduced and compared some common risk coupling models, and comprehensively considered data sources, research content, and other aspects to select a coupling model for further research. Table 2 compares the advantages and disadvantages of common coupling models.
Through the comparison of common risk coupling models, we can see that most coupling models only support qualitative analysis, and the coupling degree model and the N-K model can quantify the coupling degree. In view of the authenticity and accuracy of the data collected in the accident cases in the early stage of this study and the fact that the N-K model requires a large number of historical sample data, we selected the N-K model to analyze the risk coupling strength of the shield construction safety system of the water transmission tunnel. Many models have been employed to examine risk coupling; among them, the N-K model stands out for its ability to avoid bias resulting from subjective judgments, although it does require complete historical information. Many scholars have applied the N-K model to security management in many fields. Wu, X. G. [27], Wang, H. X. [28], and Huang, W. C. [29] conducted risk coupling research on subway construction safety, maritime traffic safety, and railway dangerous goods transportation systems by utilizing the N-K model. Several research studies have investigated the evolution of risk coupling using the N-K model in combination with other methods. For example, Dai, S. W. [30] proposed a reverse analysis method based on the N-K model and system dynamics to examine the coupling mechanism induced by large-scale deformation accidents in soft rock tunnels, but it may not have considered the potential risk factors that did not lead to accidents. Hai, N. [31] simulated the evolution path of multi-risk coupling in public tunnels through the N-K model and system dynamics simulation. Shan, Z. [32] explored the risk coupling mechanism of bridge construction through the N-K model and further constructed a risk network using the SNA model (Social Network Analysis Model) to reveal the interaction between risks. Liu, J. [33] combined the N-K model and the ISM model (Interpretive Structural Model) to study the evolutionary game of multi-factor coupling in tunnel fires from micro and macro perspectives. Wu, B. J. [34] proposed a quantitative coupling method based on the N-K model and Bayesian network to analyze the risk coupling of crane accidents and calculated the failure probability through posterior probability and sensitivity analysis. However, it is worth noting that the construction of Bayesian networks requires accurate initial parameters and probability distributions, which may pose challenges in practical applications.
Previous scholars have yet to use the N-K model to analyze risk coupling during the shield construction stage of water conveyance tunnels. Moreover, the data and information concerning shield construction accidents of water conveyance tunnels are relatively authoritative, complete, and accessible to collect. Therefore, the N-K model is suitable for analyzing the heterogeneous risk coupling in the shield construction of water conveyance tunnels, aiming to systematically explore the coupling relationship and action strength between risk factors. However, the model cannot demonstrate the risk transmission; that is, how one factor affects the others and contributes to accidents. Thus, researchers have started focusing on the complexity and interdependence of risks to further discuss the characteristics of risk evolution. Liu, W. [35] proposed a systematic approach that integrates Exploratory Factor Analysis (EFA) and Structural Equation Modeling (SEM) to clarify the causality in complex engineering. However, it failed to identify the paths of risk propagation. Therefore, some scholars have introduced complex network theory to describe the causal relationships of risks and risk propagation in a networked manner.
Erdős, P. and Rényi, A. [36] proposed the theory of random graphs, laying a theoretical foundation for complex networks. Complex network theory has been widely applied in accident analysis, including analyzing accident risk characteristics, identifying key risk factors, and examining the interaction of factors. Wan, C. P. [37] constructed a risk evolution network model and identified the key causes of water traffic accidents from different stages. Using the association rule method and complex network, Chen, W. [38] revealed the critical nodes and cause mechanisms of tower crane accidents. Chen, W. [39] established a causal network model of security accidents in a specific district of Beijing and analyzed key factors by calculating node indicators. Based on the N-K model and complex network, Wang, H. Y. [40] identified the key causes and critical links that lead to bridge crane construction accidents. Yang, J. F. [41] constructed the causality network of chemical accidents in China by reviewing accident reports. Deng, J. [42] built a network model for maritime traffic accidents along the coast of China based on complex network theory, exploring the key factors of maritime accidents by analyzing feature indexes and network robustness. Guo, S. [43] established a behavioral risk chain network of accidents (BRCNA) based on construction accident cases in China and calculated the topological characteristics of the network. The research results demonstrated that BRCNA exhibits characteristics of scale-free and small-world networks. In the field of construction risk, some scholars have researched the overall risk and key causes of systems through complex networks. Zhou, Y. [44] proposed a risk analysis method that combines complex networks and association rule mining (ARM) to monitor risks in constructing deep foundation pits and developed an improved Apriori algorithm to mine abnormal monitoring types. Jiang, J. [45] established a dynamic risk assessment model based on complex networks, which can dynamically assess the overall risk of adjacent deep foundation pits of existing tunnels. Ma, X. [46] created a new model for causality analysis of railway accidents based on complex networks and analyzed the key causality relationships. Zhou, J. [47] proposed a new method for establishing a directed and weighted accident causal network (DWACN) based on complex networks.
In 1952, Harry Markowitz [48] proposed the Modern Portfolio Theory (MPT), the core idea of which is how to allocate a group of risky securities rationally to achieve an efficient portfolio. Multilateral interests and considerations, such as investment returns and portfolio risk levels, need to be taken into account in investment decision; actually, it is the grand theory of decision-making under uncertainties. This situation is also widespread in risk management, which requires managers to make effective decisions and analyses under multiple constraints, especially in the construction field, where risk factors are closely linked. In the stage of shield construction of water conveyance tunnels, there is the fact that one risk leads to another risk or even multiple factors. Although some studies have focused on risk analysis during construction, the interdependence between causes remains elusive. Therefore, measuring the connection between risks and clarifying the risk transmission mechanism is necessary. Inspired by the theory that Markowitz proposed, this study takes into account the two links between risk factors to analyze the safety situation of the system, providing a systematic and scientific method. At present, the model of shield construction risk research for water delivery tunnels is usually based on a certain project or a specific situation, and its results lack universality. The results cannot be applied to different projects. More critically, previous studies did not adequately consider the correlation of various risks in the system. The models in these studies could not capture the mechanisms of risk transfer and could not quantify risk coupling, which hindered the understanding of how multiple factors interact to cause accidents. These gaps motivate us to propose a systematic approach combining the N-K model and the complex network theory to solve these limitations and to reveal the cause mechanisms of shield construction accidents in water conveyance tunnels. This proposed method extracts the basic data needed for research through actual accident cases and then calculates the risk coupling value based on the N-K model. Then, based on the complex network theory, we construct the accident causative model of the shield construction of water transmission tunnels. Furthermore, we calculate and analyze the characteristic indicators of nodes to analyze the influence of risk factors in the network. To comprehensively consider the interdependence and coupling effect between risk factors, we take the coupling value as the parameter to revise the characteristic index of the risk nodes and finally obtain the key risk factors through analysis. This method provides a quantitative causal analysis of risk transmission, integrating coupling analysis and network analysis to explore critical causation. This method represents an innovative approach to safety engineering and fills the gap in previous studies that neglected the interaction between risks. Compared to traditional models, this method takes into account the dynamic nonlinear relationship between risks and provides a more comprehensive understanding of accident causation by integrating causal networks and coupled values.
The contributions of this paper are as follows:
(1)
Collect and organize the safety accident reports related to shield construction accidents of water transmission projects from major emergency websites in recent years and objectively construct a risk index system;
(2)
Define the risk coupling type according to the accident reports and quantify the coupling degree of each coupling form by introducing the N-K model, thus revealing the risk coupling situation and law of the safety system of shield construction of water transmission tunnels;
(3)
Construct a causal model of shield tunneling accidents in water conveyance tunnels based on the complex network theory. Then, the network topology parameters are calculated, and the impact and characteristics of nodes are described from different evaluation angles;
(4)
The influence of risk coupling on accident occurrence is further considered by integrating the N-K model and the complex network theory, and the centrality of nodes is revised with the coupling value to analyze the key causes comprehensively.
The structure of this study is as follows: Section 2 provides a summary and review of relevant literature from recent years. In Section 3, the study constructs a risk indicator system for shield construction of water conveyance tunnels based on official accident reports and relevant regulations. Section 4 presents the method proposed in this study, including the model structure and parameter definitions, and outlines the framework for causal analysis. In Section 5, the model is applied to the cause analysis of shield construction accidents in water conveyance tunnels, and the characteristic index of the node is analyzed. Section 6 is a discussion, and finally, Section 6 summarizes this article.

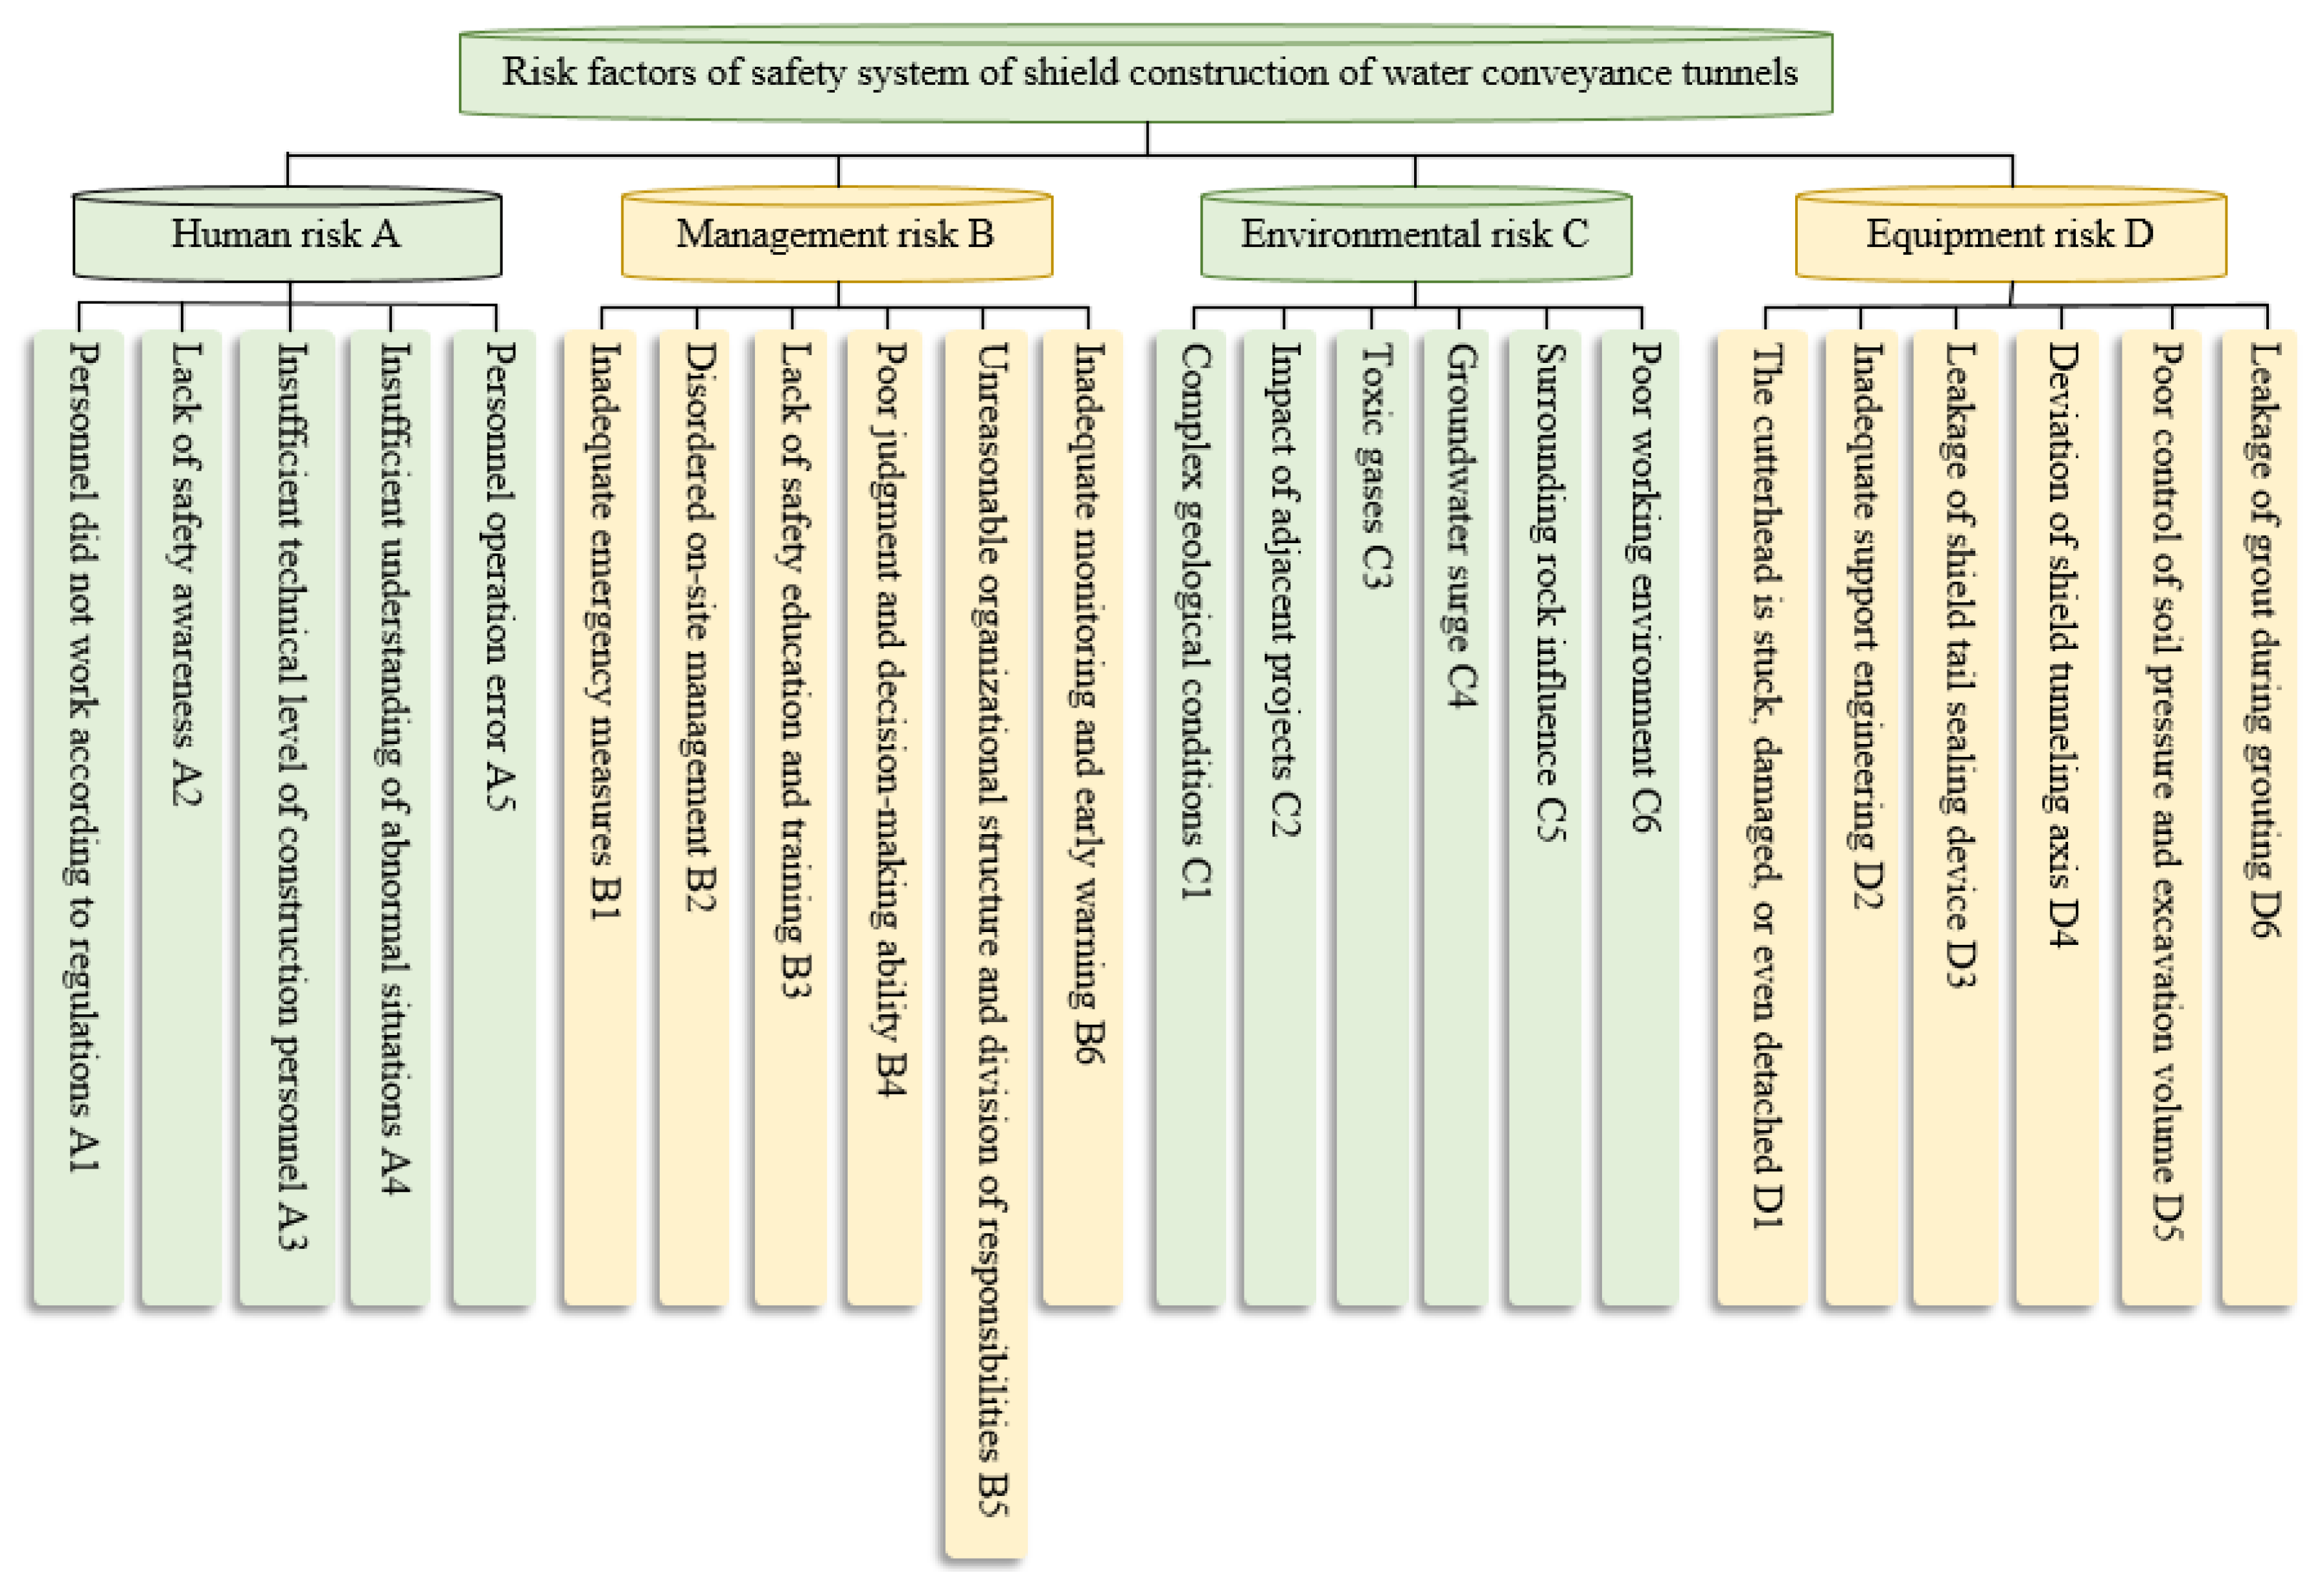
2. Construction of Risk Indicator System

To quantitatively analyze the coupling degree of risk factors and further clarify the causal relationship of risks, it is necessary to first identify the risk factors. The process of constructing the risk indicator system is shown in Figure 1. We gather information on shield tunneling accidents of water conveyance tunnels from official websites to serve as the research basis for the following text. Then, we analyze the accident reports and extract useful information, including but not limited to the accident overview, engineering overview, accident causes, casualties, etc., and organize risk factors initially. In addition, we preliminarily determine the risk indicators combined with the previous research results. Moreover, risk factors are screened and corrected in conjunction with expert advice. Finally, the risk indicator system is determined.
Firstly, this study conducts accident statistics based on the accident reports of shield construction of water conveyance tunnels. Through official websites such as the website of the Ministry of Housing and Urban-Rural Development of the People’s Republic of China, the website of the Ministry of Emergency Management of the People’s Republic of China, and the websites of emergency management departments of provinces, cities, and districts, we collected and sorted 61 accidents related to shield construction accidents of water transmission tunnels in recent years. To ensure the reliability and accuracy of the research, we evaluate the data of accidents and screen and exclude cases where the data are incomplete or unreliable. Ultimately, we gathered 53 typical and nonrepetitive investigation reports on shield construction accidents in water conveyance tunnels. The reports included details such as engineering overviews, participating units, the situation of the project management, the identification of the accident’s nature, the direct and indirect causes, and rectification measures. This study focuses on the basic facts, processes, and causes of accidents. After collecting incident reports, we analyze the accident data, and relevant statistical data are presented in Figure 2.
According to the statistics, 53 accidents have caused 76 deaths and 34 injuries. Based on the original information, these accidents are classified into seven different accident types: collapse (E1), deformation and destruction of surrounding rock (E2), nearby engineering damage (E3), toxic gases and explosion (E4), water and mud inflow (E5), shield tunneling machine instability (E6), and manual operation accidents (E7), as shown in Figure 2a. Simultaneously, the frequency and casualties of each type are counted as shown in Figure 2b. Among the seven types of accidents, tunnel collapse is the most common during the shield construction process of the water conveyance tunnel, with up to 20 incidents, accounting for 37.8% of all accidents and showing an apparent high incidence. The average number of casualties in the collapse is also the highest, at 2.95. Among other accident types, shield tunneling machine instability (E6), deformation and destruction of surrounding rock (E2), toxic gases and explosion (E4), and water and mud inflow (E5) are significantly prominent, accounting for 17%, 13.2%, 9.4%, and 9.4%, respectively. Combined with the consequences of accidents, the casualties caused by collapse (E1), deformation and destruction of surrounding rock (E2), manual operation accidents (E7), and water and mud inflow (E5) are relatively large, and the accident consequences are relatively severe.
The analysis above shows that construction accidents in water conveyance tunnels have resulted in heavy casualties and irreversible impacts on social stability. This study summarizes the key causal factors of shield tunneling accidents, including the unclear understanding of geological conditions, the construction soil not meeting construction requirements, inadequate monitoring, water and sand inrush on the excavation face, and insufficient risk awareness analysis. These high-frequency factors, along with other risks, contribute to the occurrence of construction accidents. To effectively mitigate these factors, it is necessary to clarify their relationships and take appropriate action. Our research is based on accident reports to ensure realistic identification of risk factors. We selected one of the typical accidents as an example, carried out a detailed analysis of its accident occurrence process, and extracted the risk factors affecting the accident occurrence. The analysis of the accident report is shown in Table 3.
Taking the accident report analysis as an example, we combed the collected accident reports one by one to extract the risk factors. At the same time, we preliminarily identified various risks by combining safety engineering specifications, accident characteristics, and previous studies. Based on the support of previous research results, four types of risks were identified for the safety system of shield construction of water conveyance tunnels, including human risk, management risk, environmental risk, and equipment risk. According to the systematic principle, we combined the same factors and integrated similar factors. Then, to ensure the accuracy and practicability of the risk indicators, we invited experts and scholars in the field to revise the initial risk indicators. All of them are familiar with the shield construction and operation of tunnel projects, and they are engaged in related industries. Table 4 shows the overall background information of the experts.
As can be seen from Table 4, the surveyed experts all have relevant knowledge, research foundations, certain project risk management experience, and good education levels. Therefore, their correction for risk indicators has high reliability and credibility. Based on expert opinions, we screened and revised the preliminary risk indicators list, and the revised results are shown in Table 5.
After sorting out the advice of experts, we rearranged and encoded the risk indicators. Finally, we established the risk index system for the shield construction of the water transmission tunnels, as shown in Figure 3.
Human risk, stemming from improper behaviors, operational errors, and non-compliance with regulations, is the primary risk affecting shield construction accidents of water conveyance tunnels. This risk is influenced by factors such as skill level, work experience, and adherence to operating procedures. Management risk refers to construction project management, typically arising from unreasonable resource allocation and inadequate supervision, as well as decision-making errors, such as inappropriate construction plans and negligence in risk assessment. Environmental risk refers to the potential threat posed by natural conditions such as uncertain geological conditions, climate change, and the actual construction environment. Equipment risks are related to the operation of shield tunneling machines and other equipment, and it may lead to construction interruption, project quality degradation, or accidents.

3. Methodology and Model Descriptions

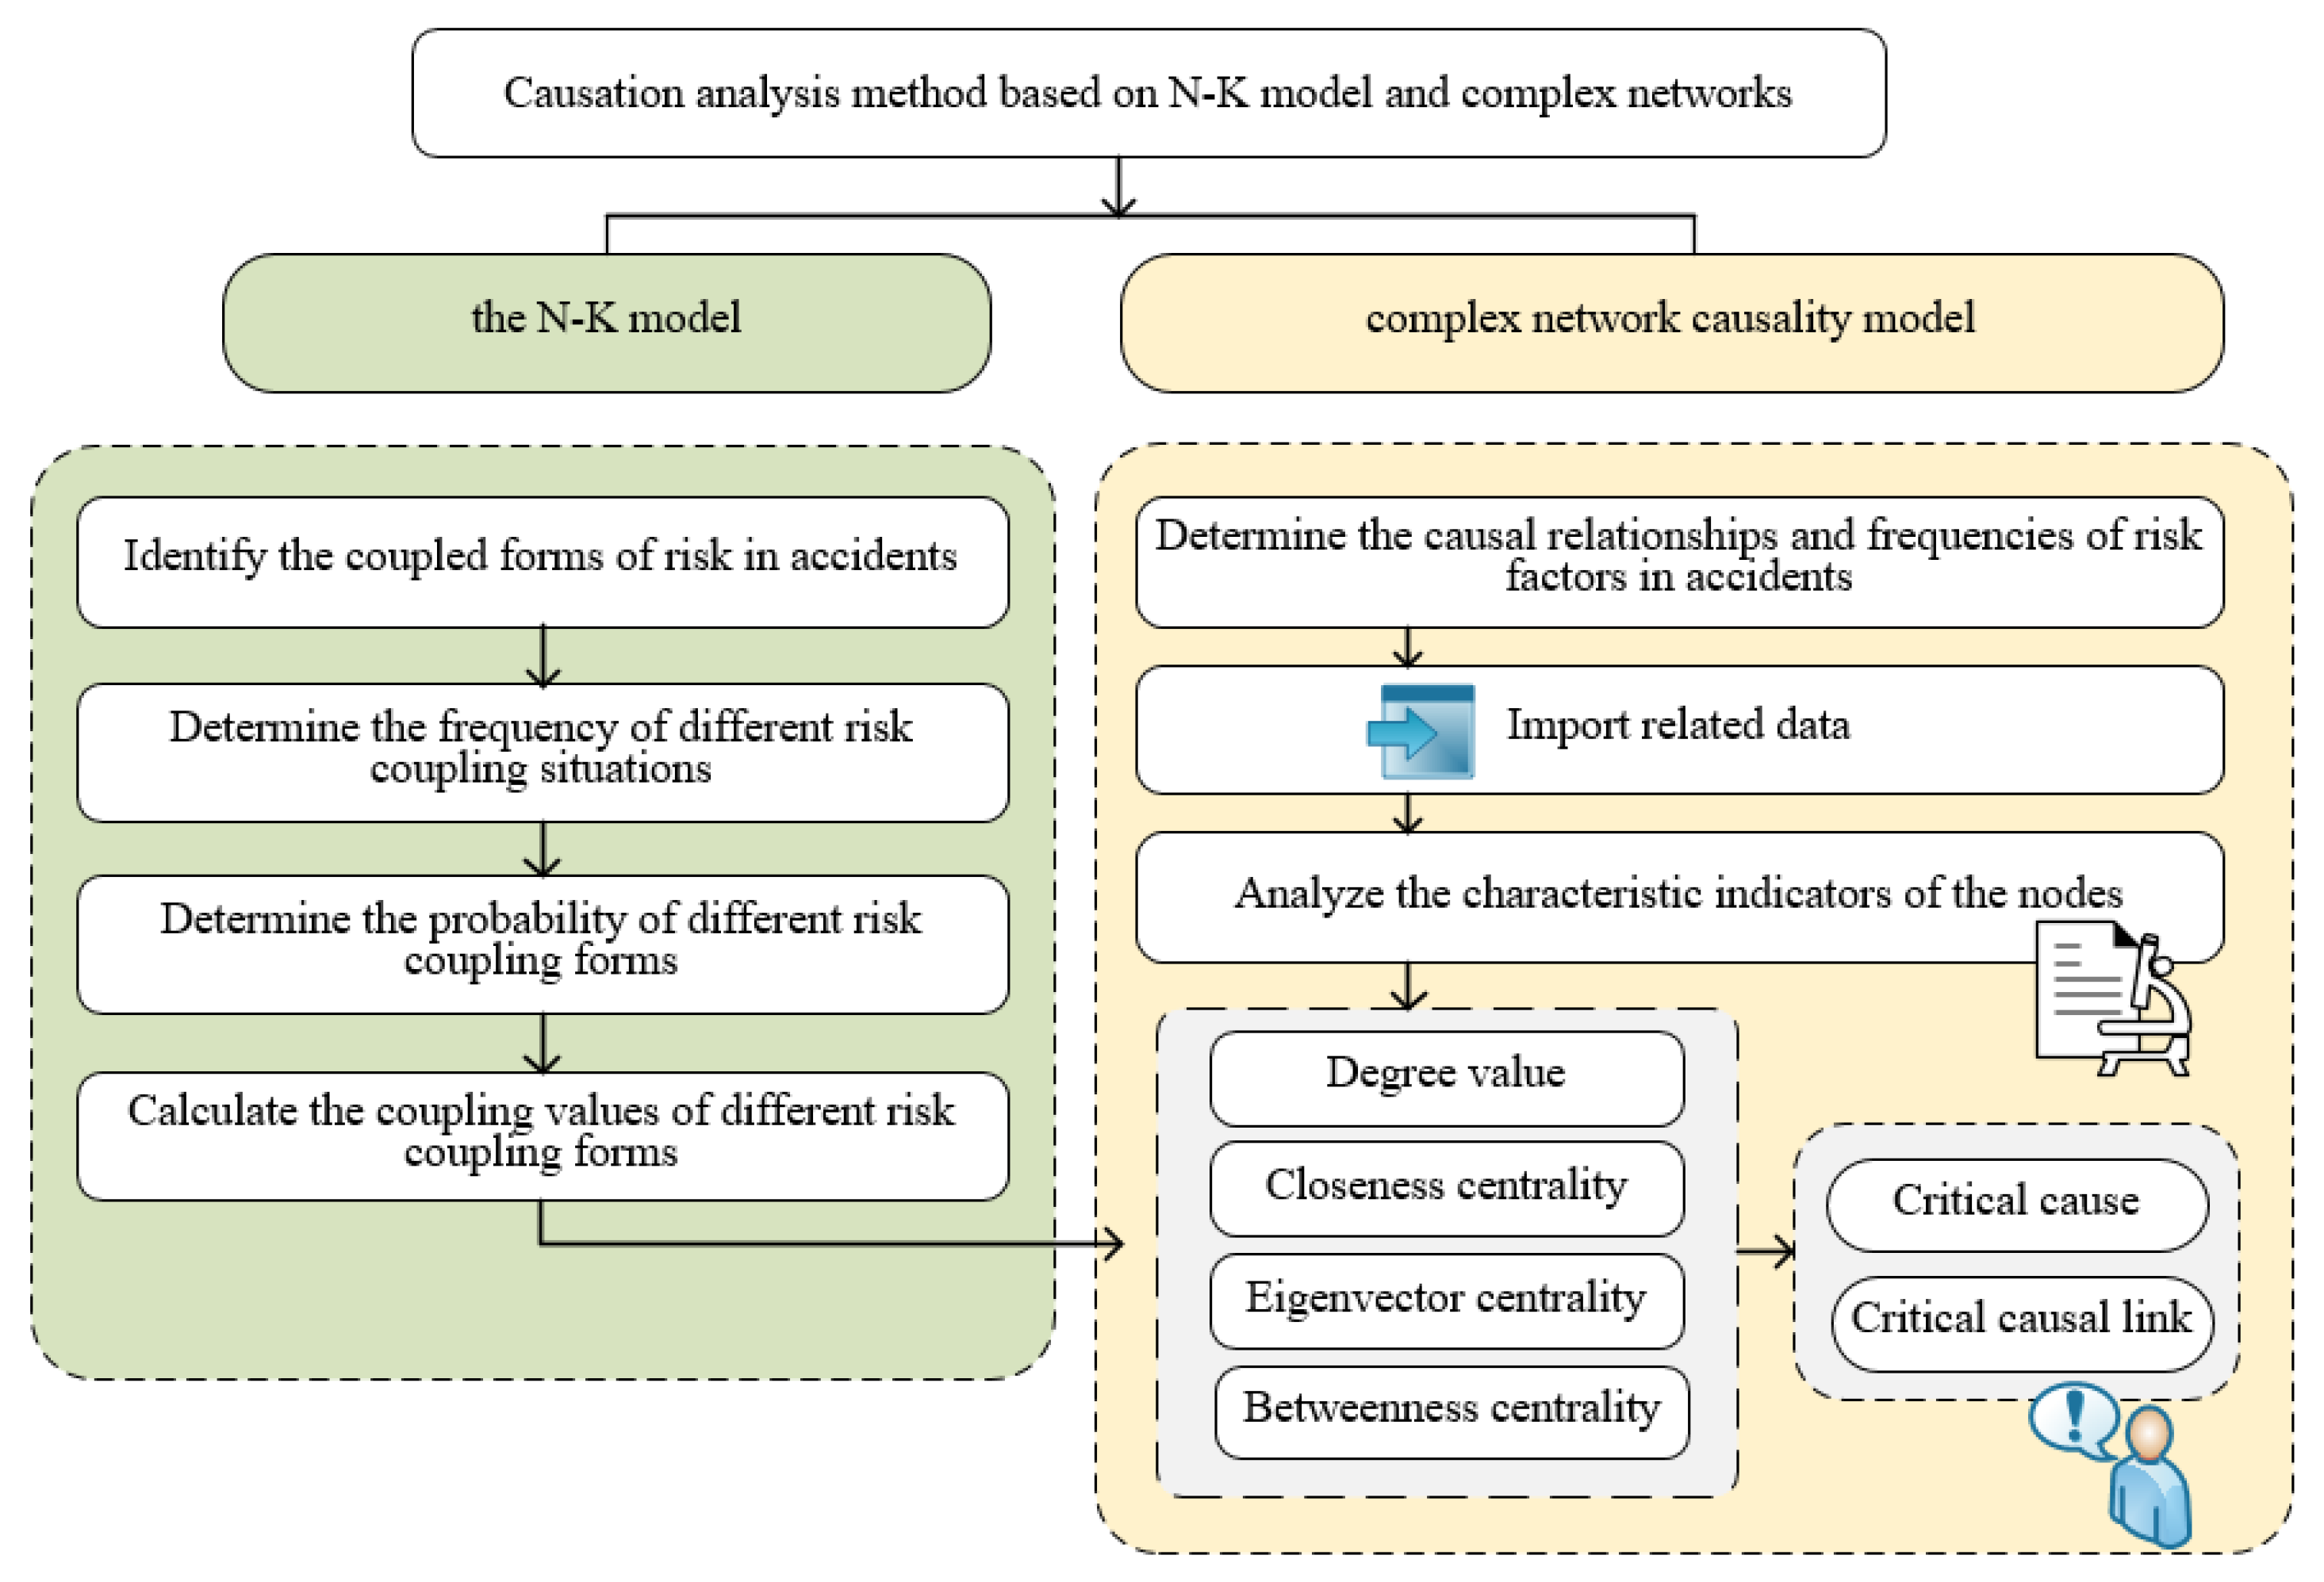
3.1. The Proposed Methods

This paper combines the N-K model and complex network to analyze the causes of shield tunneling accidents in water conveyance tunnels, and the methodology is shown in Figure 4. In this paper, the influence of risk coupling on accidents is introduced into the traditional causative analysis, and the coupling value is used to modify the characteristic index of the node. Firstly, the form of risk coupling is determined based on accident reports. Subsequently, the frequency and probability of occurrence for each coupling form are counted, and the coupling value for different scenarios is calculated using the N-K model. Meanwhile, the causal relationship between risks and their occurrence frequency is analyzed to construct a complex network causal model. The key point of this method is the integration of the N-K model and complex network to integrate the risk coupling into causal analysis, while also reflecting on node and network characteristics in the analysis. Finally, this study identifies key risk factors and causal links, providing insights into the risk coupling characteristics of shield tunneling construction in water conveyance tunnels and uncovering the critical causes of accidents and paths of risk propagation.

3.2. Complex Network Model

The complex network is a mathematical method used to create abstract models of practical problems, enabling in-depth research into the relationships, geometric properties, and evolutionary laws between the internal elements of a system. This method can abstract practical problems with high complexity into the form of network diagrams. Complex systems from various fields can be abstracted and modeled into specific complex networks, such as transportation, physics, biology, etc. Complex networks consist of nodes and edges, with nodes representing the elements in the complex system and the edges representing the interactions between these elements. In complex systems, the elements are interrelated and mutually influential. Therefore, analyzing the performance of a single element independently cannot fully describe its role in the system. To effectively mine complex system information, an overall risk analysis is necessary. The topology of nodes can be used to extract characterization from different perspectives. At present, commonly used topological structures mainly include degree and degree distribution, clustering coefficient, eigenvector centrality, betweenness centrality, proximity centrality, and others.
  • Degree of nodes
The degree of a node refers to the number of edges connected to it in a network, and it represents the importance of the node in the cause network. In a directed network, the input degree of a node refers to the number of edges pointing toward it, while the output degree represents the number of edges pointing away from it. The input degree and output degree together form the total degree of the node. The degree of the node is calculated as follows:
K i = j = 1 N a j i + i = 1 N a i j
In Equation (1), K i represents the number of connection lines of node i in the network, which is the total degree of node i ; a i j represents the number of edges that node i points to other nodes j , which is the output degree of node i ; and a j i is the number of edges that other node j points to node i , which is the input degree of node i ; the larger the value K i , the more important the node is and the greater its impact on surrounding nodes of the network.
2.
Closeness centrality of nodes
The closeness centrality of a node is an indicator used to describe the compactness of the node and other connected nodes, indicating how close a node is to all other nodes on the network. The closeness centrality of a node can be expressed as the average distance from a node to others or from all other nodes to the node, which is divided into input closeness centrality and output closeness centrality. The closeness centrality of the node is calculated as follows:
C c ( i ) 1 = j 1 n d i j ,   i j
In Equation (2), C c ( i ) 1 is the closeness centrality of nodes; n is the number of nodes in the complex network model; and d i j is the distance from node i to node j . The larger the value C C ( i ) 1 , the more convenient it is to connect with other nodes, and the more likely the node will be centered in space.
3.
Betweenness centrality of nodes
In a network, some nodes with low degrees play an essential role in information transmission, and the positions of these nodes in particular are equivalent to bridges in the network. We use the betweenness degree to measure the importance of these nodes in the network, reflecting the ability of a single node to transmit risks as a medium. Elements with a high betweenness degree serve as a bridging role in risk propagation [49], which is expressed as the ratio of the number of shortest paths passing through a node to the number of all shortest paths in the network. The calculation of the betweenness degree is as follows:
C B e = i = 1 n j = 1 n g i j ( e ) g i j
In Equation (3), C B ( e ) is the between degree of nodes; g i j is the number of shortest paths connecting node i to node j in the network; and g i j ( e ) is the number of shortest paths that pass through node e among the shortest paths connecting node i to node j ; the larger the value C B ( e ) , the greater the role and influence of the node in the whole network.
4.
Eigenvector centrality of nodes
In complex network analysis, the basic idea of eigenvector centrality is that the influence of a node not only depends on the number of nodes directly connected to it but also on how vital the nodes are that the node connects. This indicator can capture the indirect influence. Eigenvector centrality is calculated as follows:
E C i = λ 1 j = 1 n a i j x j
In Equation (4), a i j is the number of edges of node i pointing to other nodes; x j is a related feature vector; and λ is a constant.

3.3. N-K Model

The N-K model is a general model for studying complex systems [50], which is suitable for exploring the interactions, mutual influences, and coupling relationships among factors in complex systems, as well as the impact of different combination forms of factors on the overall stability of the system. The model consists of two parameters, N and K . The parameter N represents the type of risk factors in the system. If each factor has n states, then the security system has n N   states. The risk factors of the system can generate different forms of risk coupling in a certain way. The parameter K is the number of interdependent risk factors in the system, and the range of K is 0 , N 1 . K = 0 indicates that there is no coupling effect between this risk factor and any other risk, while K > 0 indicates that the risk factor is affected by the coupling effect of other factors. The larger the value T , the greater the possibility of safety accidents caused by this coupling form.
We have identified four primary risk factors based on collected accidents: human risk, management risk, environmental risk, and equipment risk. It is assumed that each factor has two states of occurrence or nonoccurrence. A value of 0 indicates that the risk factor does not occur, while 1 indicates that the risk factor does occur. There are 15 different forms of risk coupling, including four kinds of single-factor coupling, six kinds of dual-factor coupling, and five kinds of multi-factor coupling, i.e., 1000, 0100, 0010, 0001, 1100, 1010, 1001, 0110, 0101, 0011, 1110, 1101, 1011, 0111, and 1111. The N-K model is used to calculate the coupling value under different coupling forms in the shield construction stage of water conveyance tunnels. The steps are as follows:
  • Calculate the frequency of occurrence for different risk coupling forms.
P a , b , c , d = m a , b , c , d w
In Equation (5), w is the total number of safety accidents; m a , b , c , d   represents the number of accidents when human risk is in state a , management is in state b , environment is in state c , and equipment is in state d ; and P a , b , c , d represents the frequency of accidents when the four types of risk factors are in state a , b , c , and d , respectively. a , b , c , and d represent the four states of risk, and 0 or 1 represents whether a risk occurs or does not occur. In the single-factor coupled accident, 0010 represents that only environmental risks are defective, ultimately leading to the accident. There have been eight such events in history, m 0010 = 8 and p 0010 = 0.0755 . In dual-factor coupling accidents, 0110 represents defects in management risk and environmental risk, and the coupling effect between the two factors leads to accidents. There have been 24 such events in history, m 0110 = 24 and p 0110 = 0.2264 . In multi-factor coupling accidents, 1110 represents the simultaneous existence of defects in human risk, management risk, and environmental risk, which occur due to a coupling effect and cause the risk events together. There have been 20 incidents of this type of event, m 1110 = 20 and p 1110 = 0.1887 .
2.
Calculate the probability of occurrence for different forms of risk coupling.
According to the number of risks involved, the risk coupling of shield construction of water conveyance tunnels can be sorted into single-factor risk coupling, dual-factor risk coupling, and multi-factor risk coupling. The probability of occurrence for each coupling form P represents the sum of the coupling frequencies p of all risk factors related to accidents when a certain risk or several risks occur. Below are examples of probability calculations for three types of risk coupling forms.
(1) Single-factor coupling
The probability of human risk occurring only:
P 1 = p 1000 + p 1100 + p 1010 + p 1001 + p 0110 + p 0101 + p 0011 + p 1110 + p 1101 + p 1011 + p 0111 + p 1111
Similarly, P . 1 . . , P . . 1 . , and P 1 can be calculated.
(2) Dual-factor coupling
The probability of management-equipment risk dual-factor coupling:
P . 1.1 = p 0101 + p 0111 + p 1101 + p 1111
Similarly, P 11 . . , P 1.1 . , P 1 . . 1 , P . 11 . , and P . . 11 can be calculated.
(3) Multi-factor coupling
The probability of human-environmental-equipment risk multi-factor coupling:
P . 1.1 = p 1011 + p 1111
Similarly, P 111 . , P 1.11 , P . 111 , P 1.11 , and P 1111 can be calculated.
3.
Calculate the coupling values for different risk coupling forms.
(1) Coupling value of single-factor coupling
Single-factor coupling exists between secondary factors under a certain type of risk, while the N-K model discusses the coupling under different types of risks. Therefore, this study does not discuss the degree of single-factor coupling.
(2) Coupling value of dual-factor coupling
Dual-factor coupling includes human-management risk coupling, human-environmental risk coupling, human-equipment risk coupling, management-environmental risk coupling, management-equipment risk coupling, and environmental-equipment risk coupling, and their risk coupling values are respectively denoted as T 21 ( a , b ) , T 22 ( a , c ) , T 23 ( a , d ) , T 24 ( b , c ) , T 25 ( b , d ) , and T 26 ( c , d ) . The coupling value of human-management risk coupling can be calculated as follows:
T 21 a , b = a = 1 A b = 1 B P a , b · log 2 ( P a , b ( P a · P . b . . ) )
(3) Coupling value of multi-factor coupling
Multi-factor coupling includes human-management-environmental risk coupling, human-management-equipment risk coupling, management-environmental-equipment risk coupling, human-environmental-equipment risk coupling, and human-management-environmental-equipment risk coupling, and their risk coupling values are represented by T 31 ( a , b , c ) , T 32 ( a , b , d ) , T 33 ( a , c , d ) , T 34 ( b , c , d ) , and T 4 ( a , b , c , d ) , respectively. The coupling value of human-management-environmental risk coupling and human-management-environmental-equipment risk coupling can be calculated as follows:
T 31 a , b , c = a = 1 A b = 1 B c = 1 C P a , b , c · log 2 P a , b , c P a · P . b . . · P . . c .
T 4 a , b , c , d = a = 1 A b = 1 B c = 1 C d = 1 D P a , b , c , d · log 2 P a , b , c , d P a · P . b . . · P . . c . · P d

4. Implementation

The complex network is an important tool for visualizing the relationship among elements in a system and revealing its objective laws. Its superiority lies in its ability to depict the intricate internal relationships of the system in the form of nodes and edges, revealing the complex structure and achieving a clear and comprehensive causal analysis. In this section, we construct a causal network model for shield tunneling accidents in water conveyance tunnels based on the correlation between risks, achieving a precise mapping between the causal model and the accident mechanism. By calculating and analyzing the topological parameters and statistical characteristics of the causative network, we have quantified the interactions between risks in the construction process of the tunnel shield in water conveyance tunnels. This process allows us to identify the key causes, key causal paths, and causal mechanisms, ultimately guiding accident prevention and reducing accidents by addressing root causes.

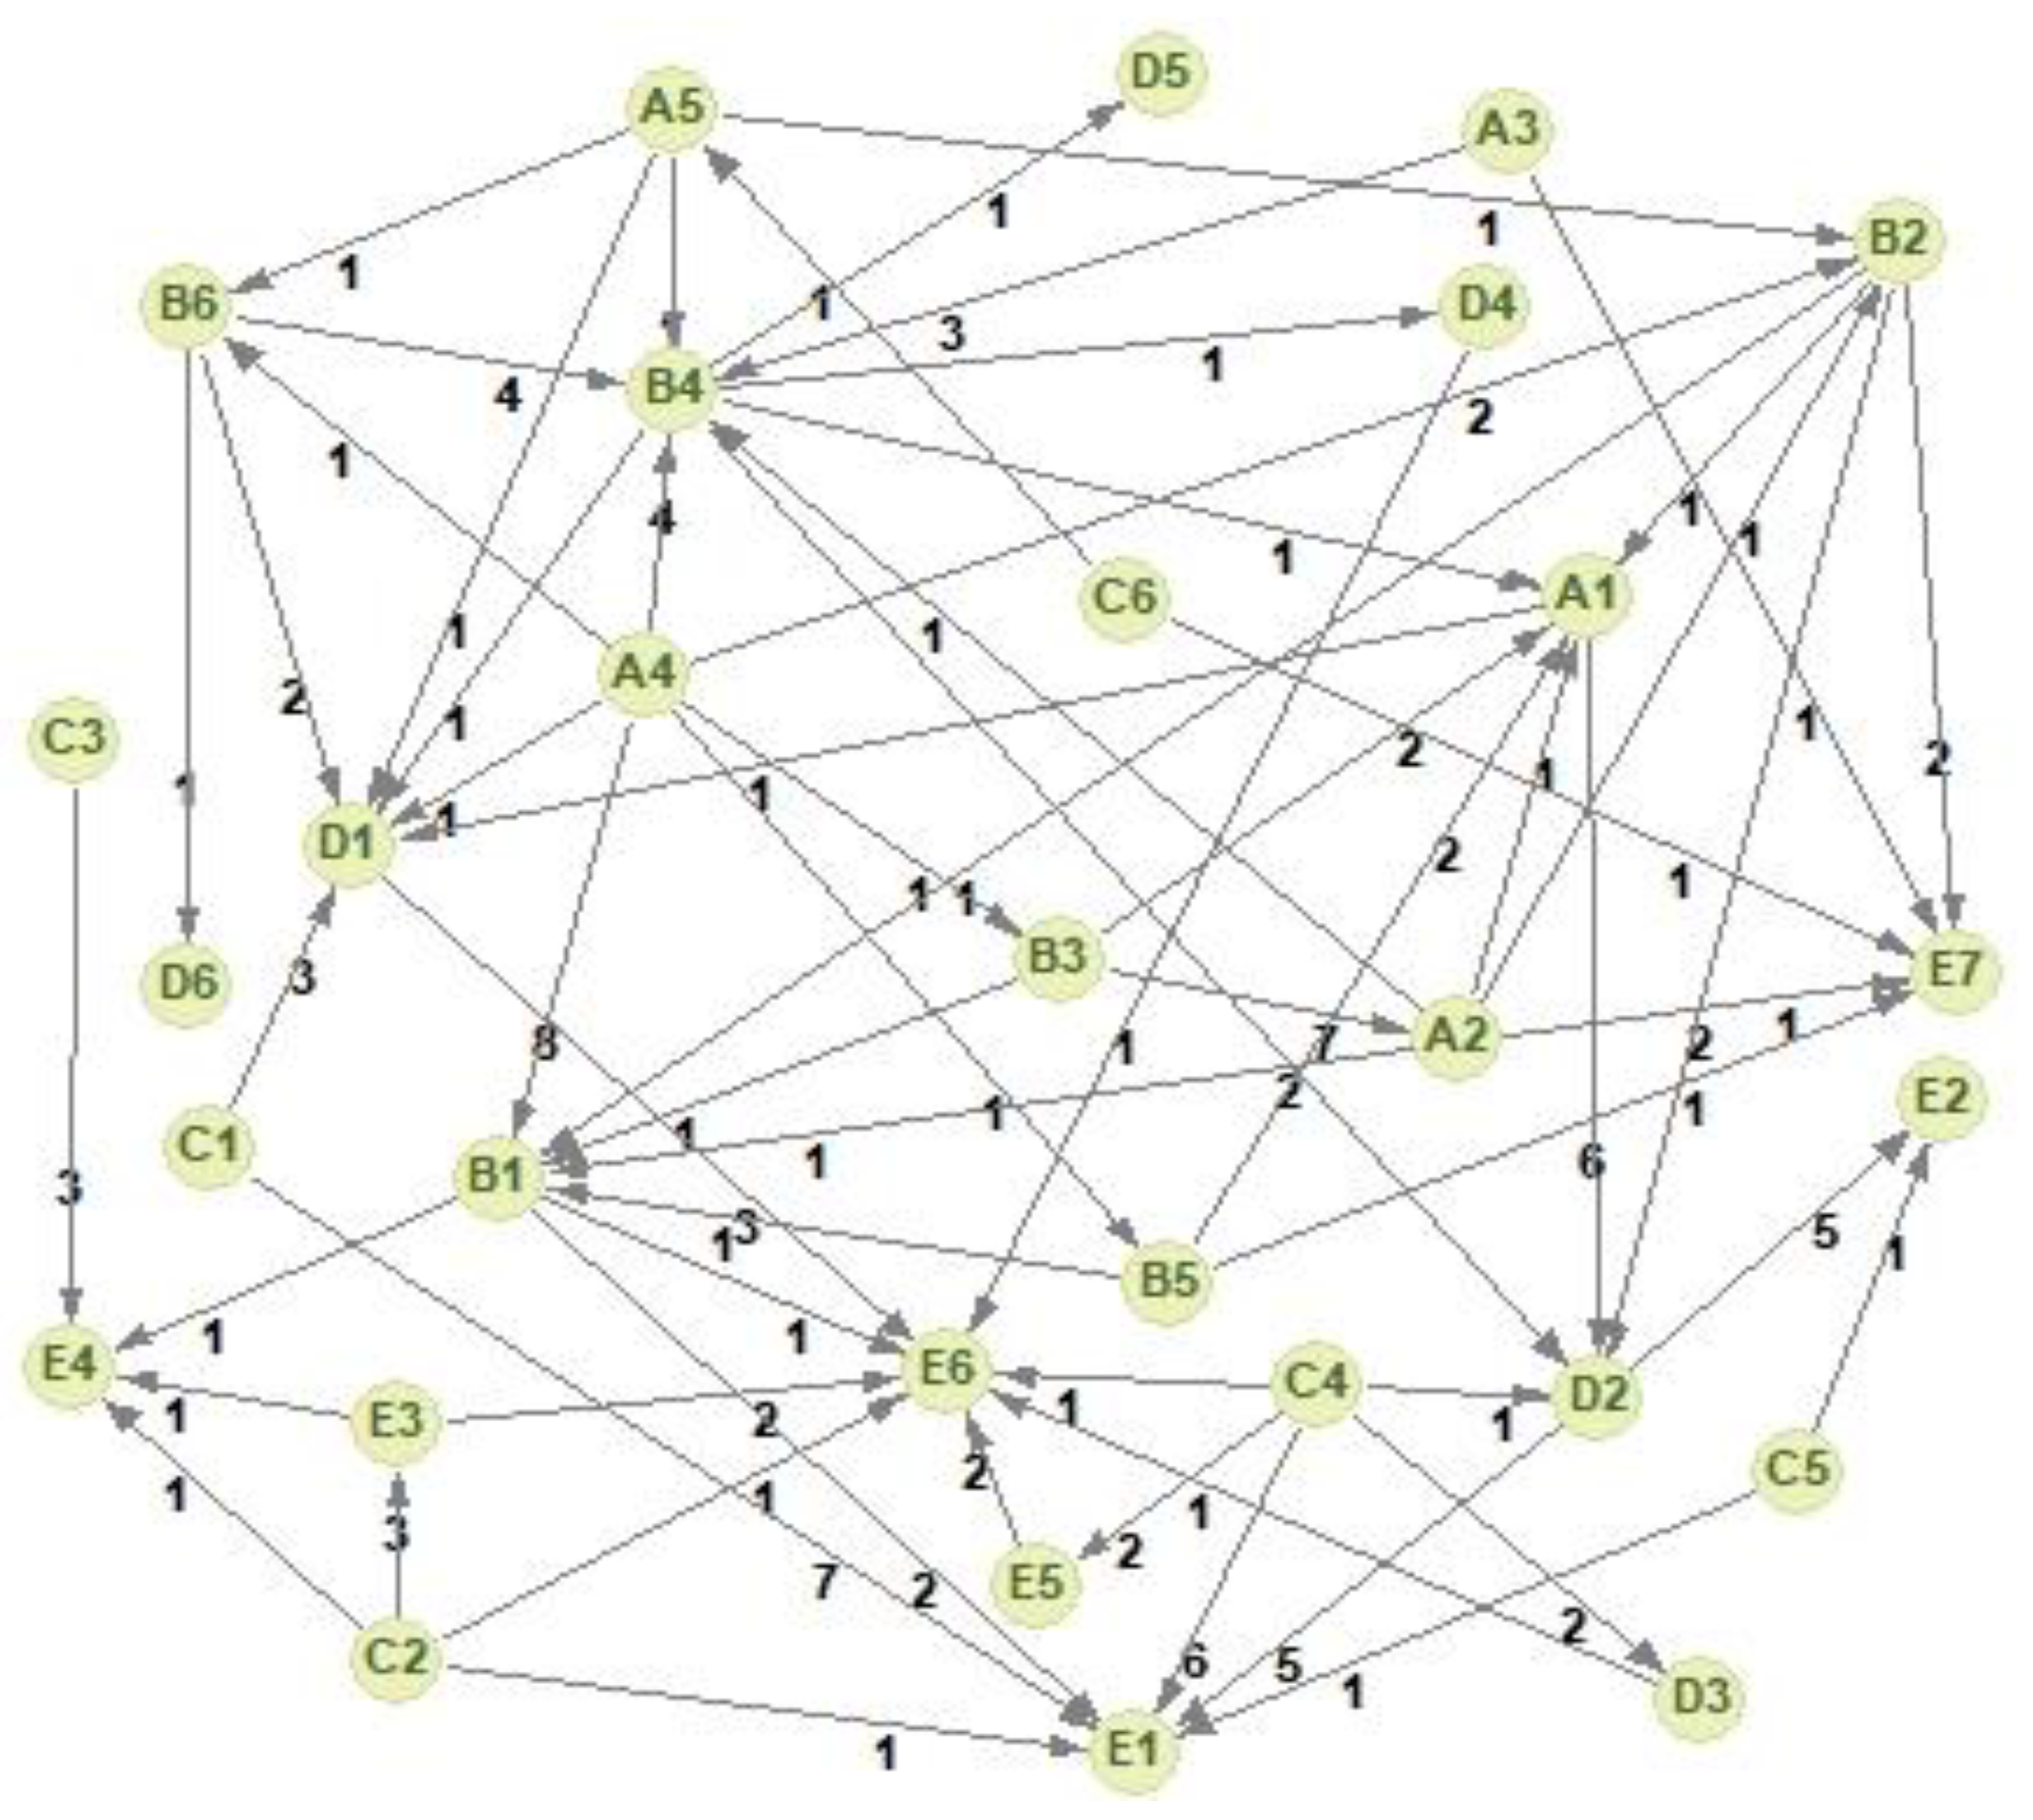
4.1. Accident Causative Model

4.1.1. Construction of Accident Causative Model

The complex network abstracts the complex relationships in a system into a whole network formed by multiple nodes and connected edges, which serves as the basis for causation analysis. We set the 23 secondary risk factors and seven types of accidents in the shield construction system of the water conveyance tunnels as network nodes of the causal model, and the dependency relationships between nodes are abstracted as edges. The directed network is well-suited for illustrating the interactions between unsafe behaviors and explaining the causal mechanisms of accidents. Considering this, to accurately explore the causal mechanisms among factors in shield tunneling accidents of water conveyance tunnels, this paper constructs a directed and weighted network using Pajek software based on the causal relationships and frequencies among the risk factors. Pajek software was developed by Andrej Mrvar and others using the Delphi(Pascal) language. The software provides users with a simulation platform for analyzing large and complex networks, and it can analyze the global structure of the network through the network graph model and data. Therefore, we use the software to visualize the risk network in the system. The software version used in this study is Pajek 64 Portable 5.19, and it runs on the Intel(R) Core(TM) i5-7200U CPU.
The causal model is shown in Figure 5, which visualizes the causal relationships between risk factors and accident types of the system. The causative network consists of 30 nodes and 97 directed edges, with the number on the side representing the frequency of causality between the two nodes. The direction of the edge signifies the causal relationship and risk propagation path among the nodes. The causal relationship of factors is reflected in that the former factor leads to the latter factor; that is to say, the causal relationship is one-way, and there is no mutual causal relationship between factors. The structure of the causative model is intricate; the nodes are dense, and the edges are interlocking. This shows that in the shield construction system of water conveyance tunnels, the causal relationship of risks has a particularly significant impact on the cause of accidents.

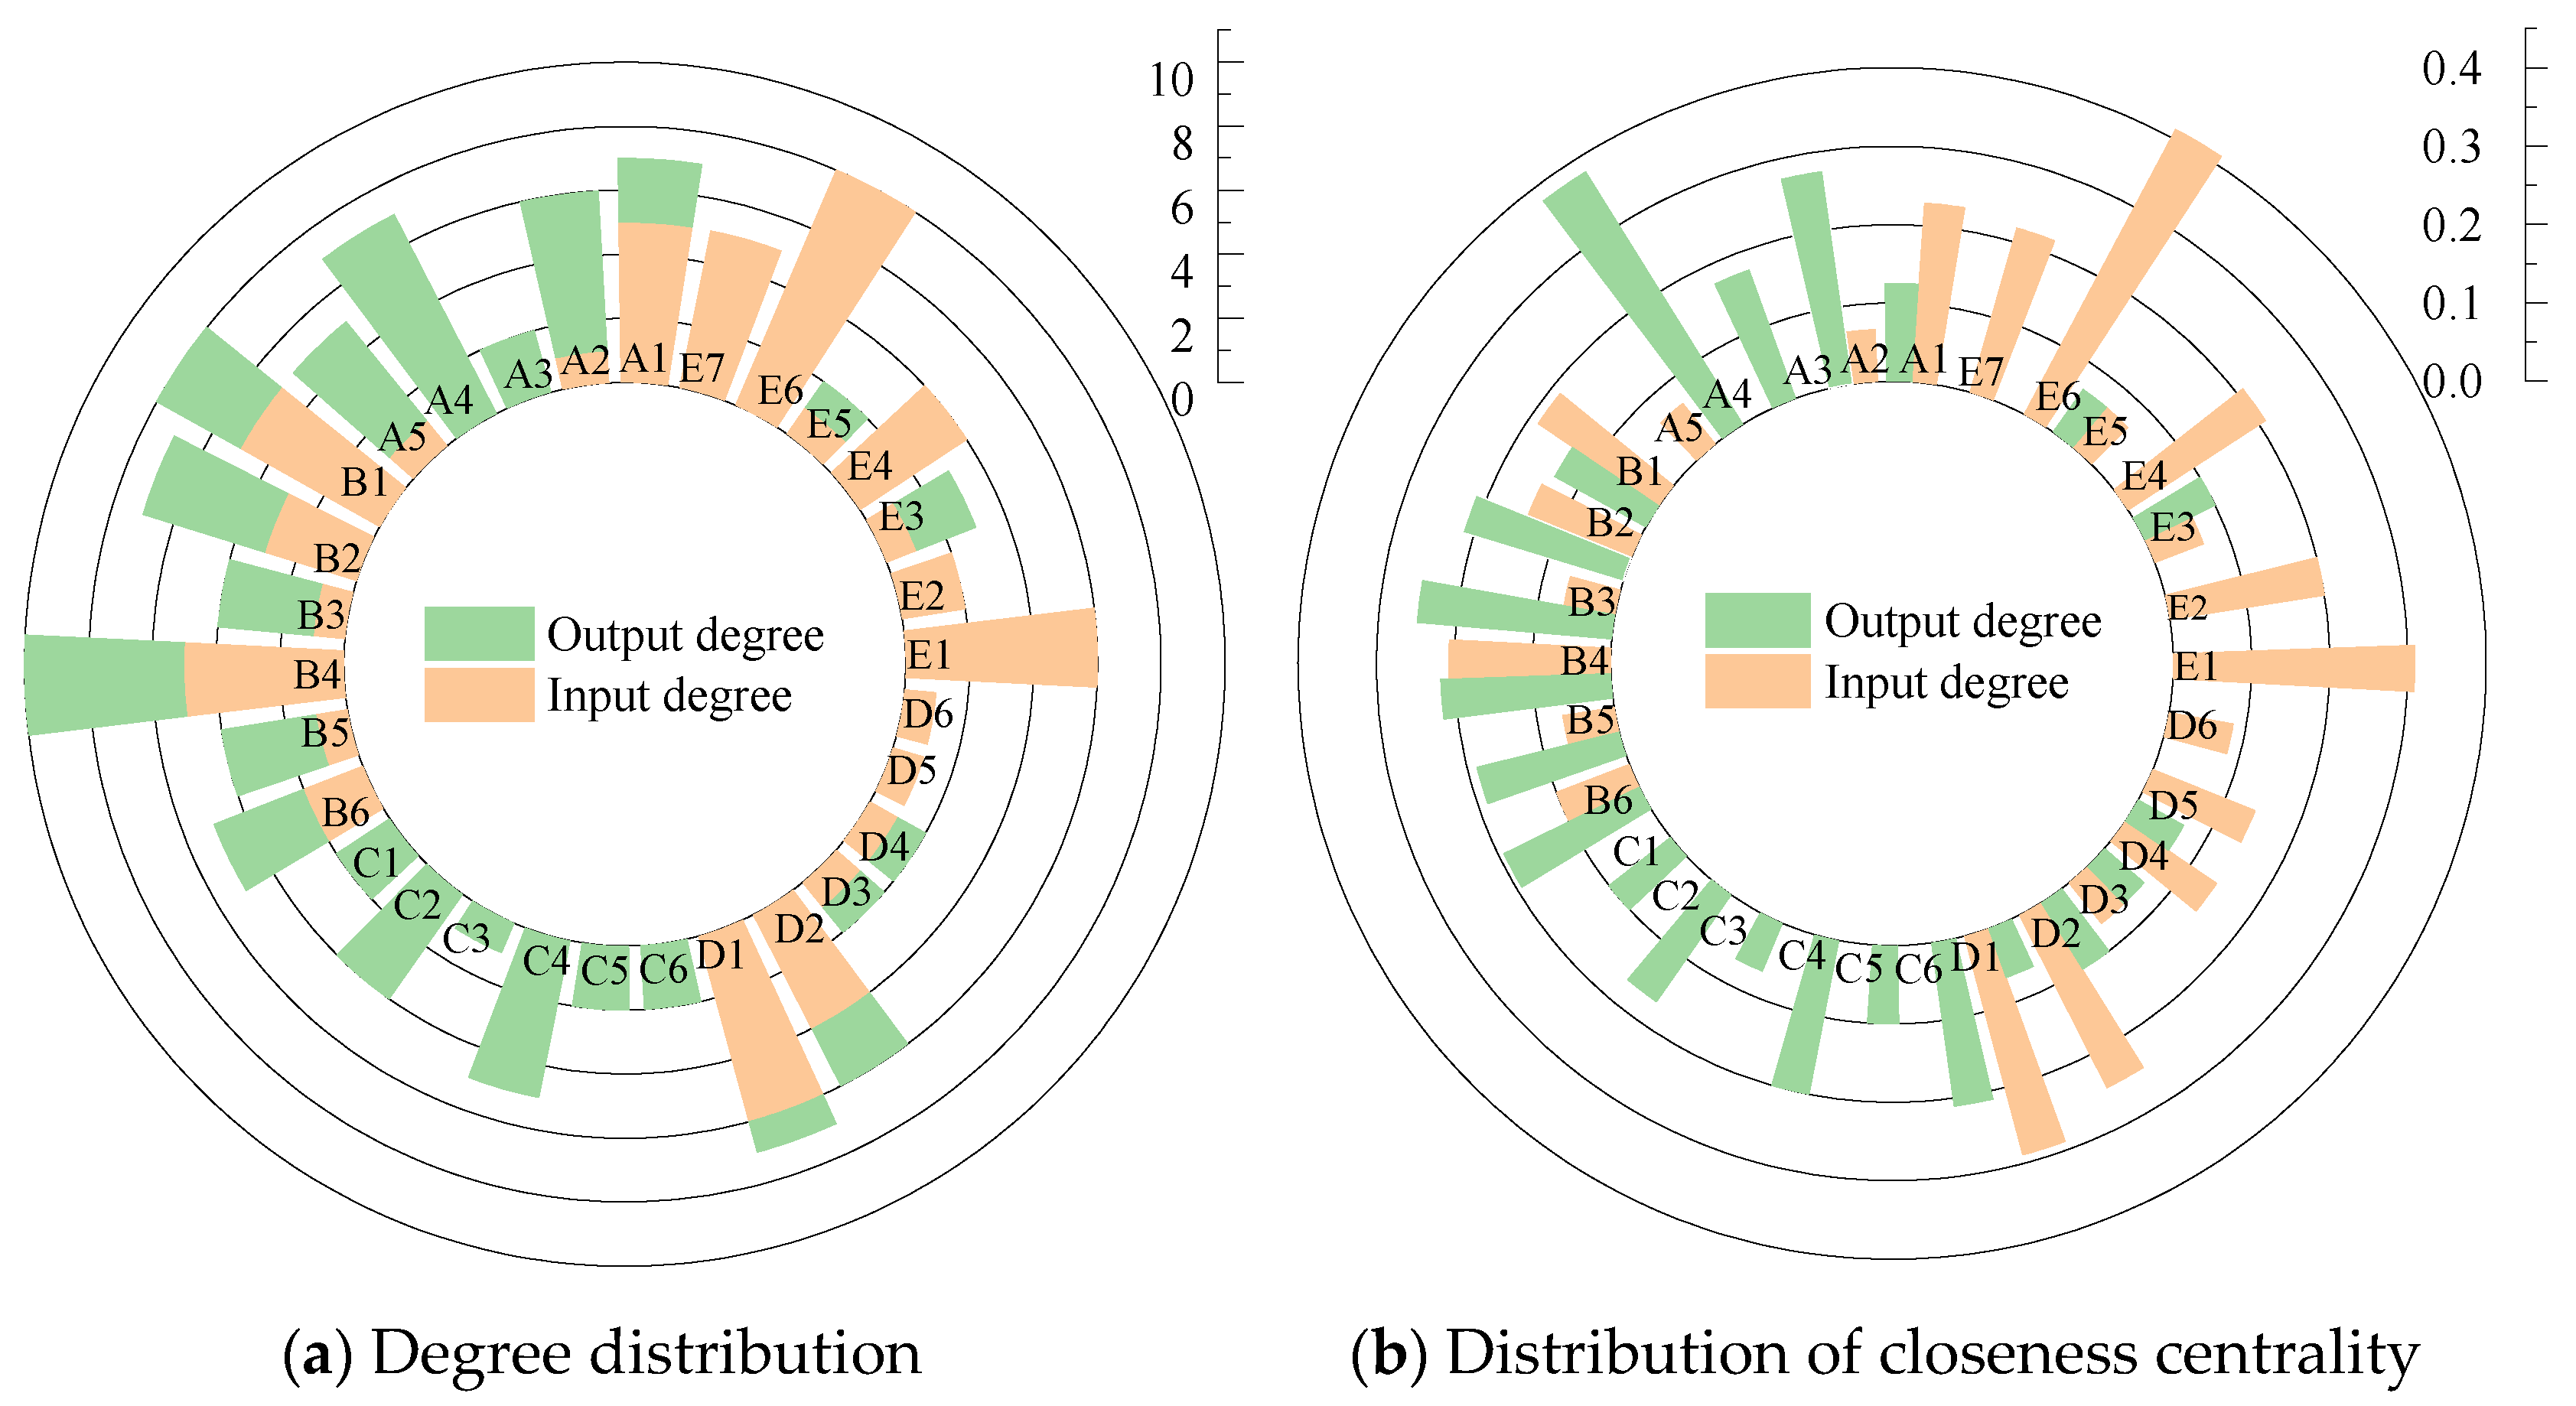
4.1.2. Analysis of Characteristic Indicators

Analyzing the topological parameters that describe the network structure and node characteristics is the main means of quantitatively evaluating complex network models. By calculating and analyzing the characteristic indicators of nodes in the network, it is helpful to clarify the importance of each causal factor and accident type in shield accidents of water conveyance tunnels and then to identify the key points that should be focused on in the subsequent control process. In this paper, the degree of nodes, closeness centrality, betweenness centrality, and eigenvector centrality are selected to describe the characteristics of nodes in the system. The numerical distribution of each index is obtained through software calculation.
  • Degree distribution of nodes
The degree of a node reflects the local characteristics of the network. The higher the node degree, the greater its impact on surrounding nodes within the local range. According to the definition and calculation method of node degree in the previous text, each node’s output degree and input degree are statistically analyzed, as shown in Figure 6a. The average degree of nodes is 4.33, which means that each node in the network is associated with 4.73 nodes on average. A total of 53.3% of nodes have degrees lower than the average, indicating that the distribution of node degrees is not uniform. Less than half of the nodes are associated with more nodes, and most have lower degree values. The two nodes with the highest input degree are shield tunneling machine instability (E6) and collapse (E1). Their actual attributes are accident types, reflecting the complex causation and easy triggering characteristics of these two types of accidents, which is also the essential reason for their frequent accidents. From the statistical data above, shield tunneling machine instability (E6) and collapse (E1) are the two types of accidents with the highest proportion, and the data analysis results are consistent with the actual construction accident situation.
The node with the highest output degree is the insufficient understanding of abnormal situations (A4), with a value of 7, indicating that this risk factor will lead to seven other types of unsafe behaviors. Ranked by the output degree, the following are the lack of safety awareness (A2), groundwater surge (C4), poor ability of judgment and decision-making (B4), personnel operational errors (A5), and disordered on-site management (B2). Risks with high output degrees are mainly related to human risk and management risk, showing that these subjective factors highly affect construction safety. These risks can affect more nodes and can spread along multiple paths once triggered. They are the inducing nodes in the network that lead to other risks or accidents. Therefore, it is essential to strengthen the monitoring of these causal nodes to cut off the propagation path quickly and prevent accidents when the causal factors take effect. The top five nodes of overall degree ranking are poor ability of judgment and decision-making (B4), shield tunneling machine instability (E6), inadequate emergency measures (B1), personnel not working according to regulations (A1), and insufficient understanding of abnormal situations (A4), indicating that these nodes have more connections in the network. Moreover, nodes with high total degrees mainly belong to human risk and management risk and have a relatively high impact on accident networks. They are susceptible to the influence of other nodes or are prone to associated effects with others, which is more likely to lead to the rapid spread of risks.
2.
The distribution of closeness centrality
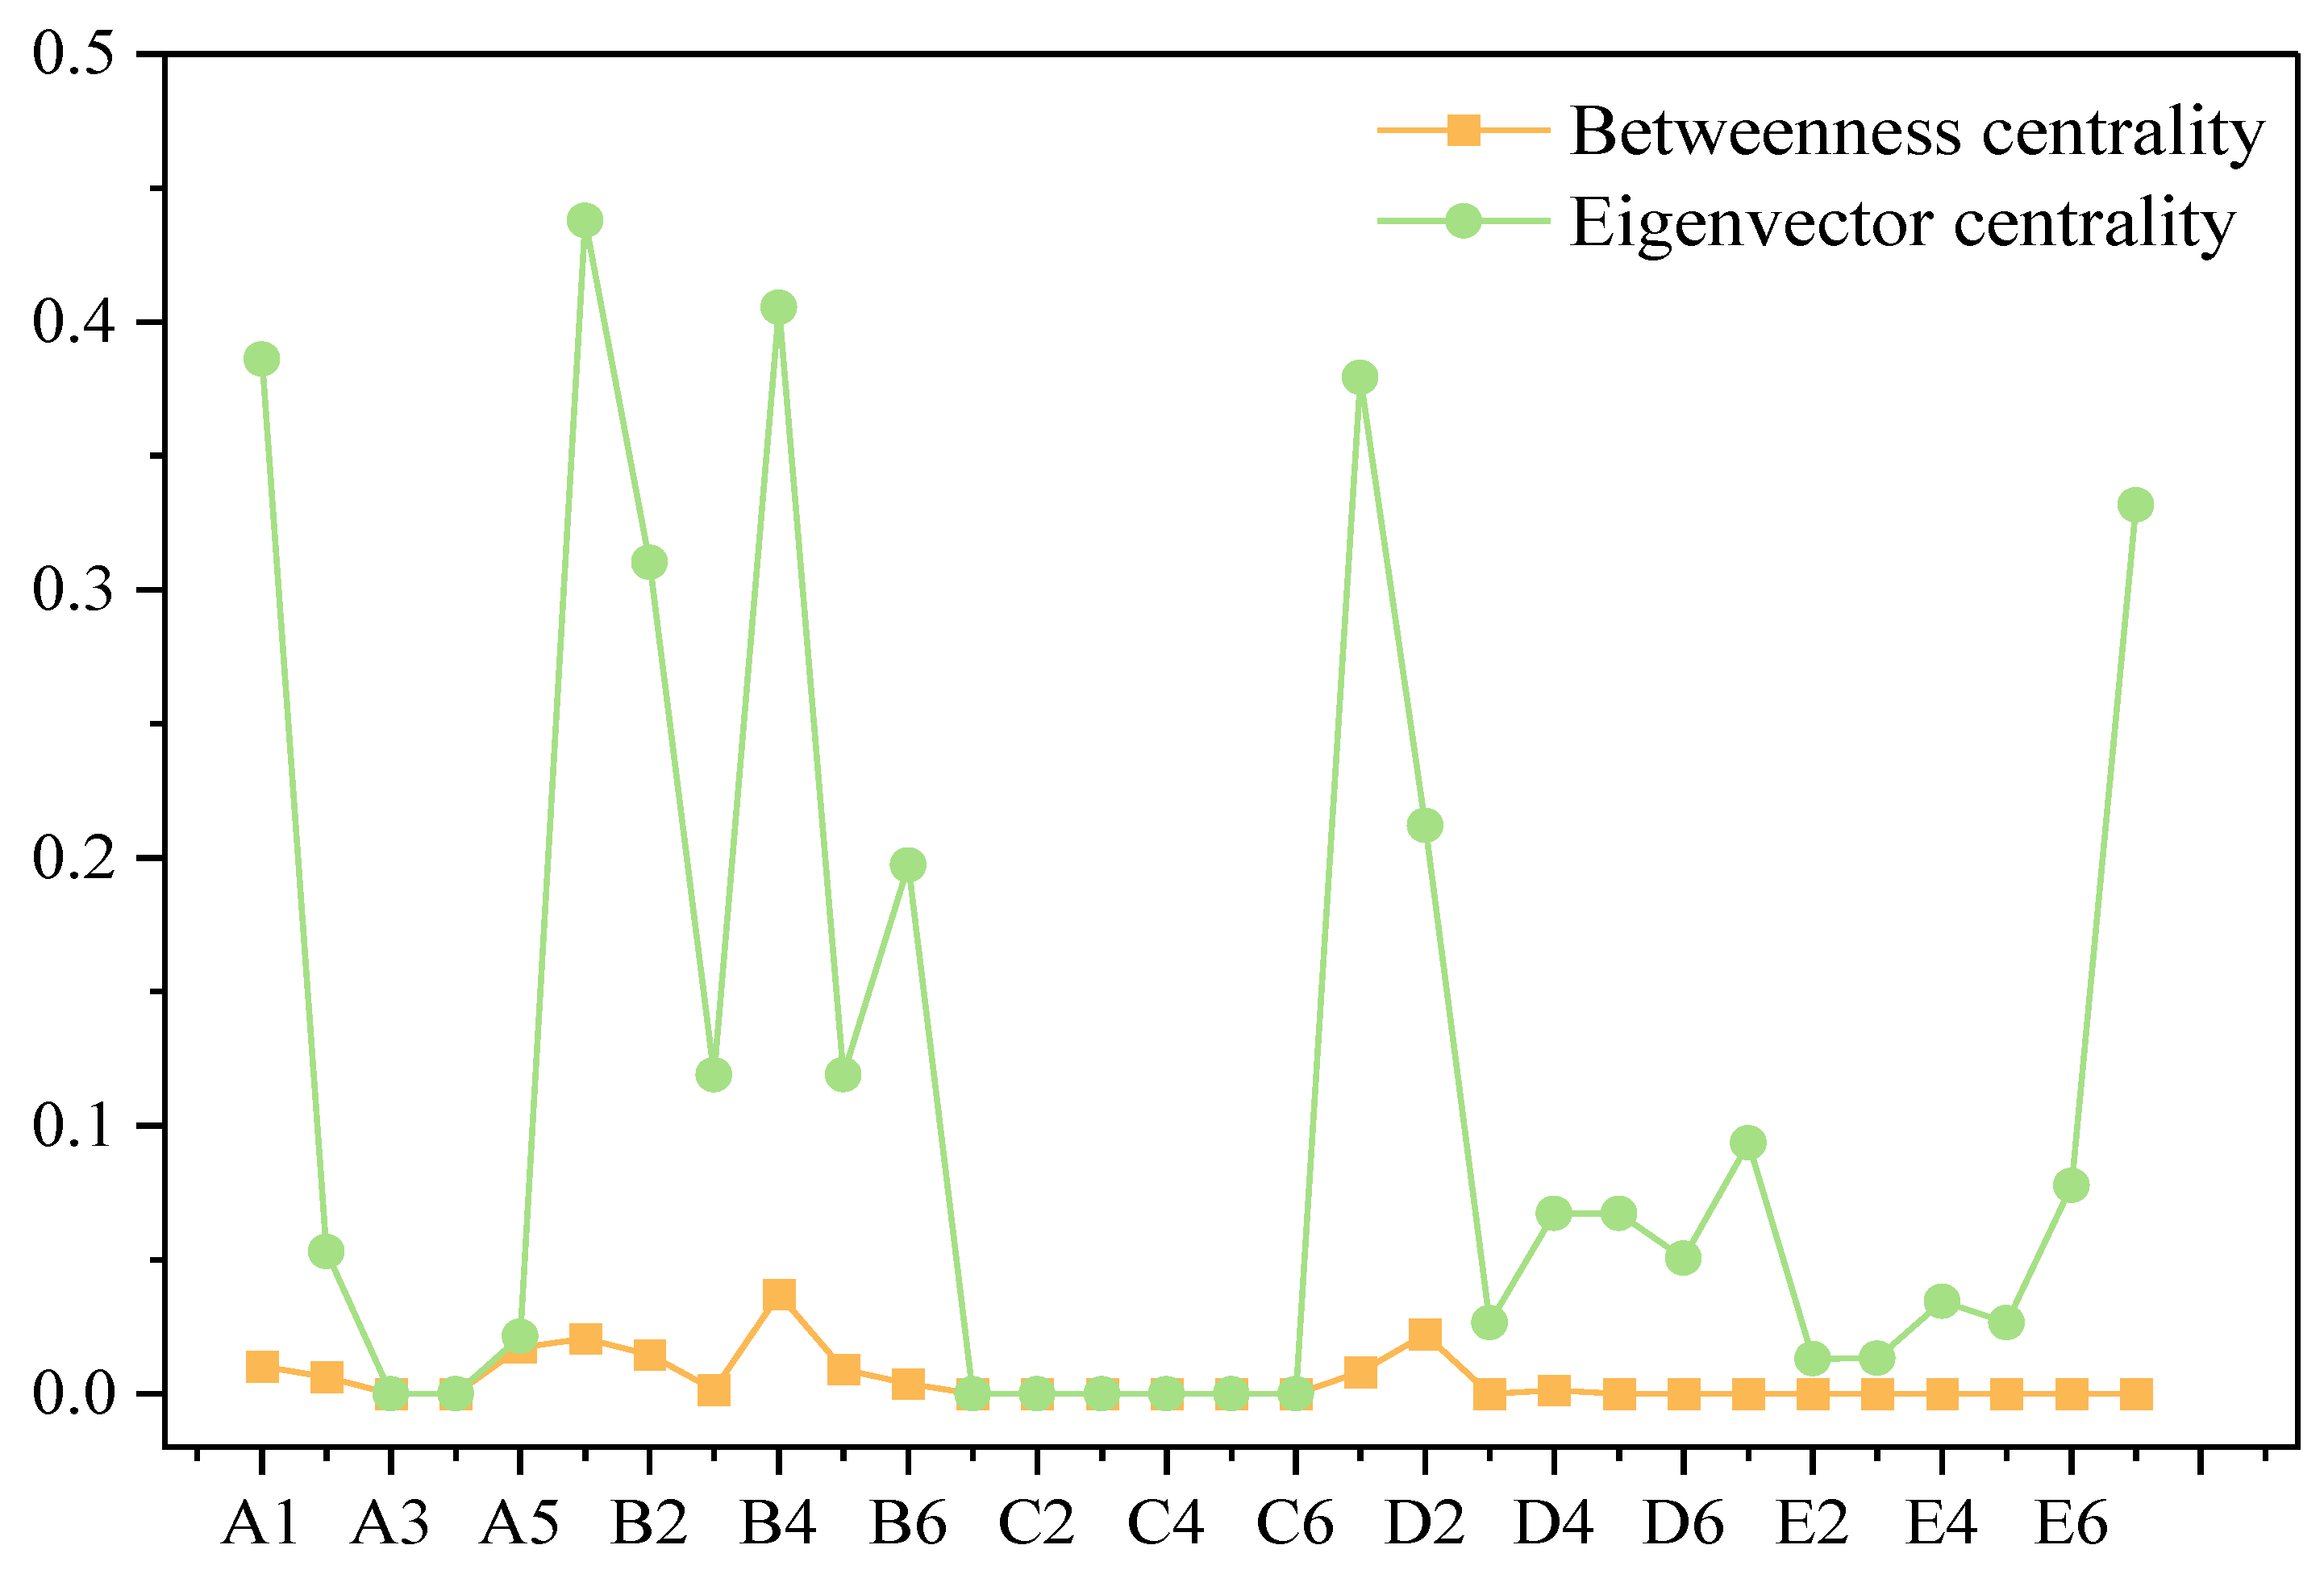
The closeness centrality of a node reflects how close it is to other nodes. The higher the closeness centrality of a node, the less the minimum distance between the node and any other node, and the more central position it holds in the network. The input degree of closeness centrality reflects the integration force of nodes, while the output degree of closeness centrality represents the radiating force of nodes. Both the input and output degree of closeness centrality for each node are shown in Figure 6b. In the causal network, the closeness centrality of shield tunneling machine instability (E6) and collapse (E1) is relatively high, which means that the path of other risk factors leading to these accident types is the shortest. Most nodes with high input degrees of closeness centrality are associated with human risk, such as the insufficient understanding of abnormal situations (A4), lack of safety awareness (A2), and personnel operational errors (A5). These nodes occupy a more central position in the causative network and propagate risk more quickly. Therefore, in actual construction, it is crucial to prioritize timely control of human risks to reduce the instability or failure of related risks and ensure the stable progress of construction.
3.
The distribution of betweenness centrality and eigenvector centrality.
The betweenness centrality of a node indicates the influence of a node’s state on the whole network. The larger the betweenness centrality of a node, the greater its ability to spread risk or hidden danger as a medium. The eigenvector centrality of a node reflects its overall position and influence in the network. The distribution of betweenness centrality and eigenvector centrality for each node is shown in Figure 7. Some nodes in the network have a betweenness centrality of 0, indicating that these nodes have not taken effects in the risk network, so they have yet to be discussed. The node “Poor ability of judgment and decision-making (B4)” has the highest betweenness centrality, suggesting that this node has been passed by the shortest path the most times and has significant adjustment and control ability between nodes. This node is also the primary intermediary point in the chain of shield tunneling construction accidents of water conveyance tunnels. Changes in the state of this node can easily affect other nodes, exposing them to risks and destabilizing the network’s stability. In the actual shield tunneling construction process of water conveyance tunnels, if managers or construction personnel make incorrect judgments and decision-making, it may cause non-standard construction and substandard engineering quality. In severe cases, it will lead to safety accidents. Additionally, inadequate support engineering (D2) and inadequate emergency measures (B1) have high betweenness centrality, which reflects the significant influence and dissemination of these two types of risk factors in the network. Proper control of these risk points can increase the average path length between nodes, thus reducing the evolutionary efficiency of the accident causative chain and the chain reaction of the causative network.
Figure 7 also shows the distribution of the eigenvector centrality of nodes. In the causal network, the node with the highest eigenvector centrality is inadequate emergency measures (B1), reaching 0.4378, followed by the poor ability of judgment and decision-making (B4) and personnel not working according to regulations (A1). This reflects that human risk and management risk are more likely to be associated with other vital nodes in the network. Among the accident types, manual operation accidents (E7) have the highest eigenvector centrality, indicating that this type of accident is greatly affected by essential nodes in the network and has high connectivity; that is to say, paying sufficient attention to the factors with high eigenvector centrality and taking measures to prevent their state changes can lead to significant improvements in other high-impact related nodes, thereby enhancing the stability of the entire causal network.

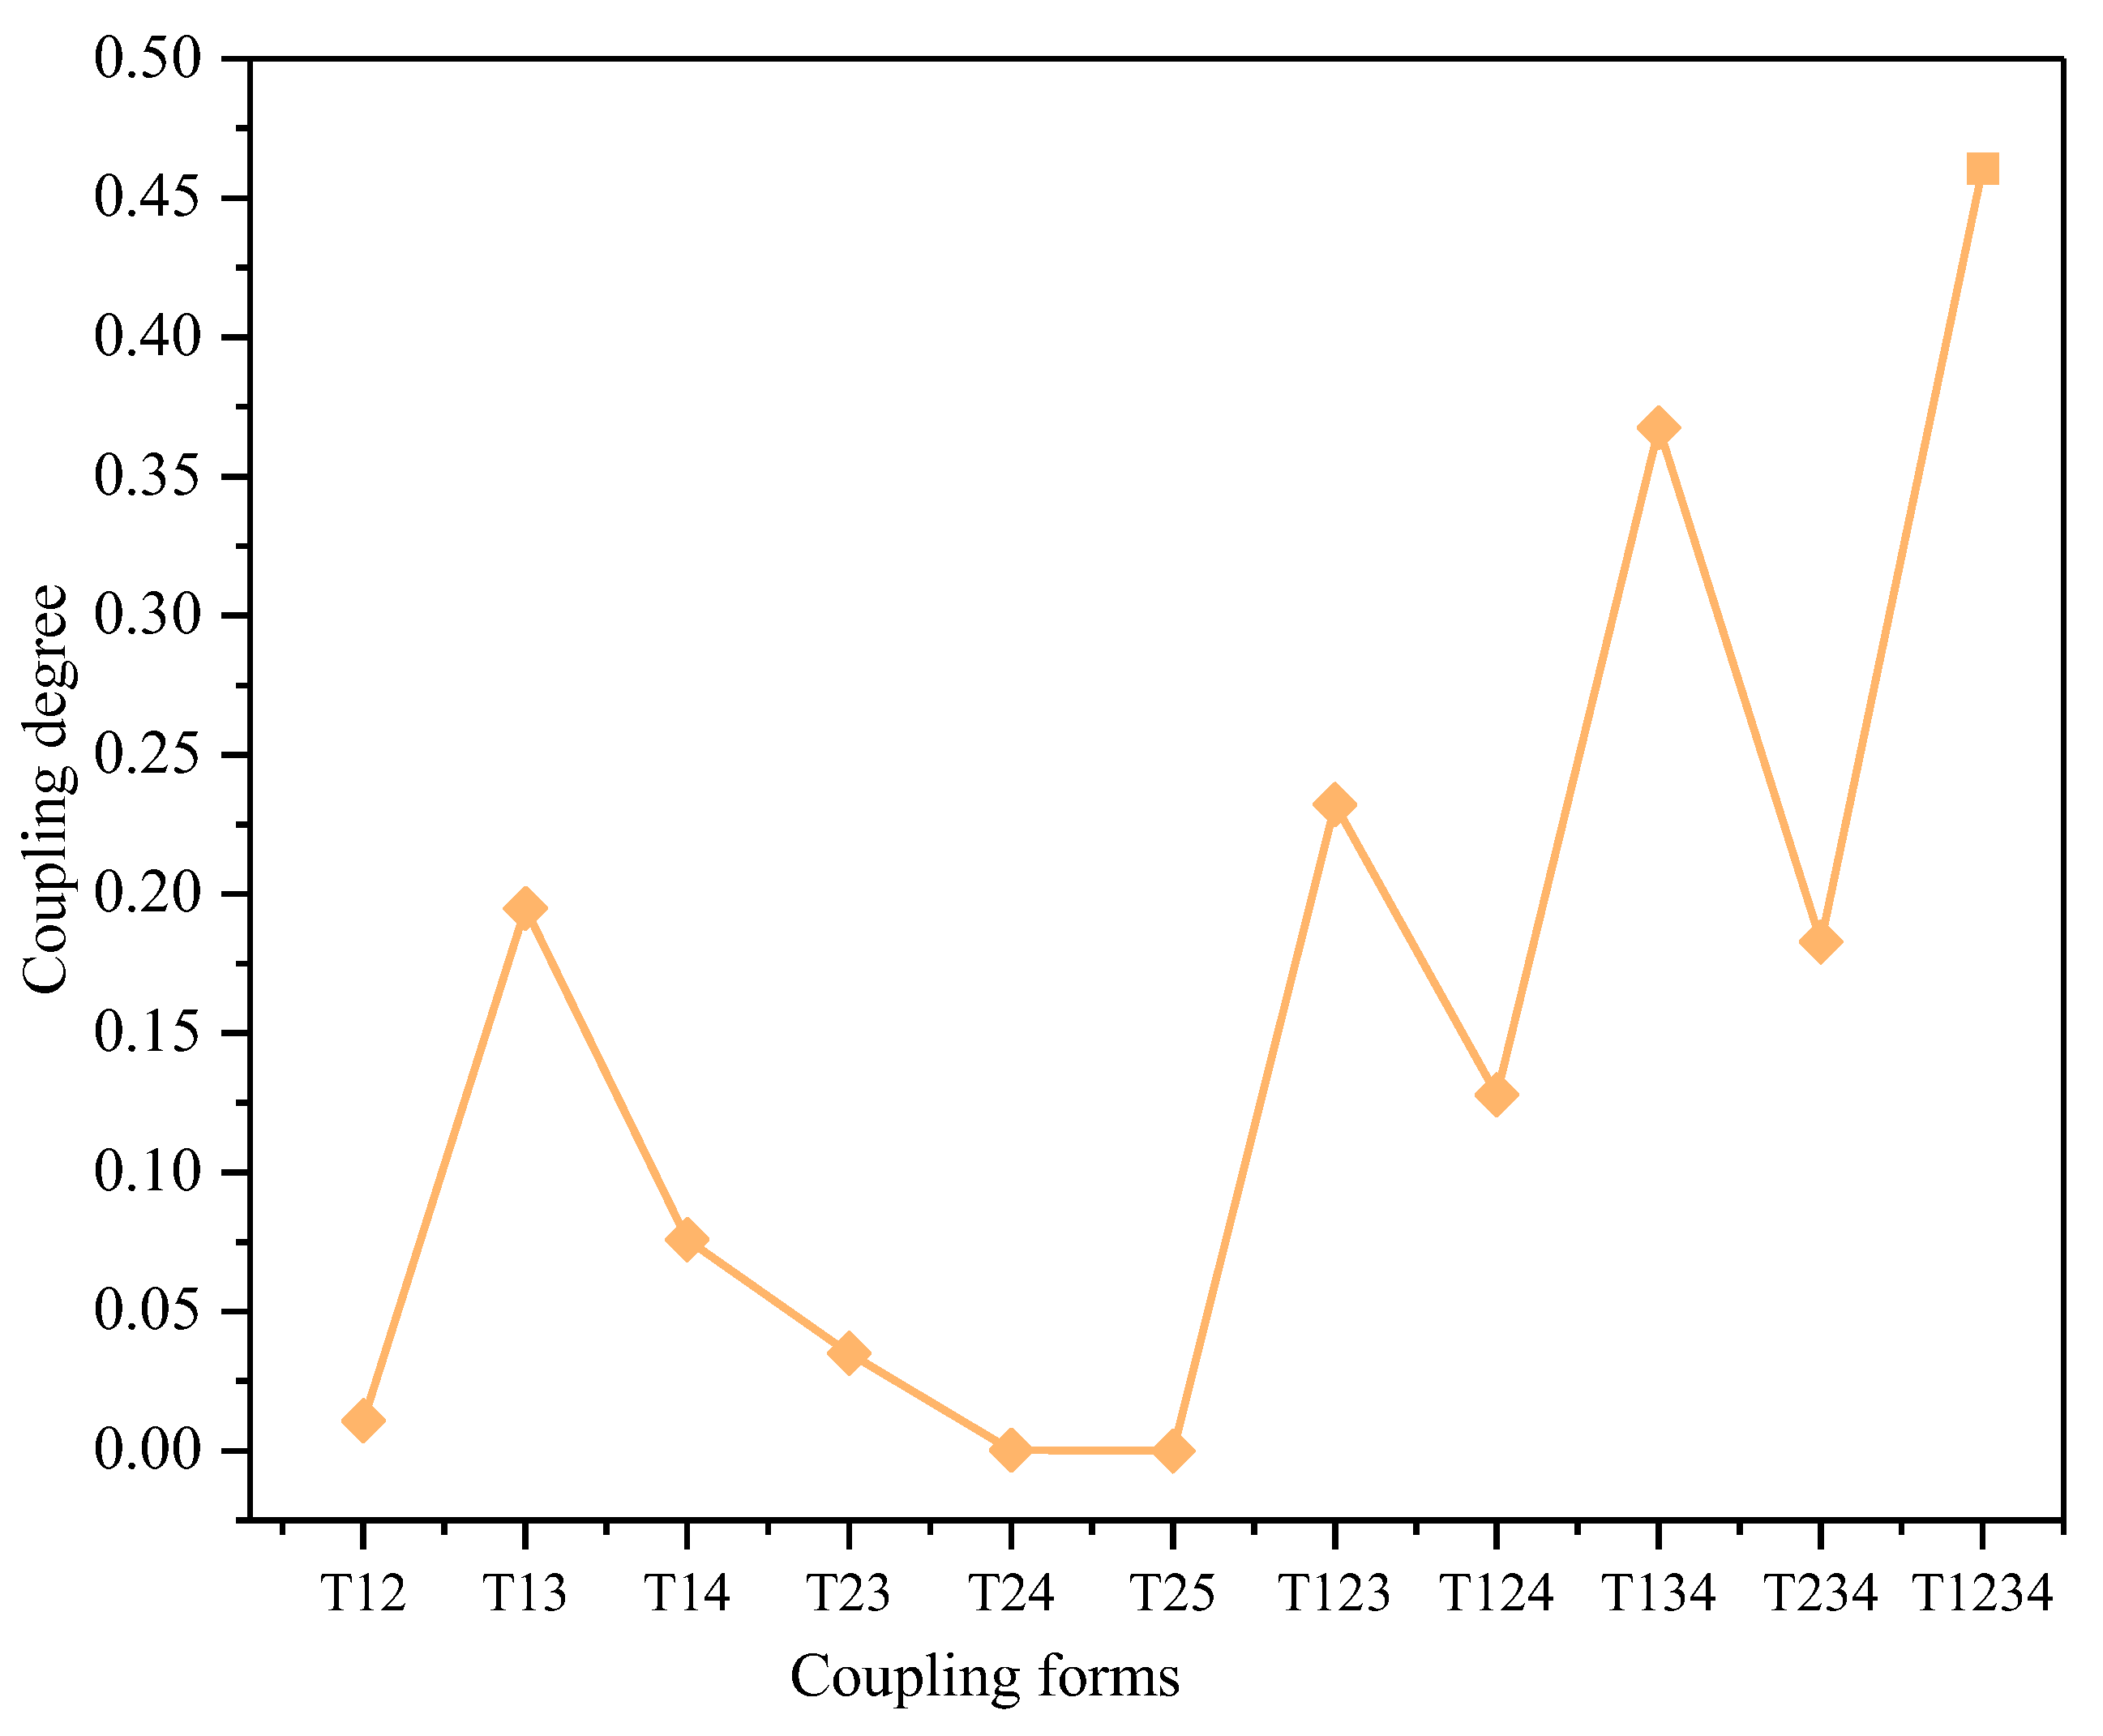
4.2. Risk Coupling Analysis Based on the N-K Model

The risk coupling of shield construction of water conveyance tunnels refers to the fact that different risk factors in the system are not independent but interact with each other. This interaction may lead to the transmission, superposition, and amplification of risks, ultimately threatening the safety status of the entire system. There are four types of risks in the system that interact with each other under different situations, resulting in 15 different forms of risk coupling (this paper does not discuss the situation where all four types of risks do not co-occur, i.e., there have been no accidents in the project). In this paper, dual-factor coupling and multi-factor coupling are considered, including 11 coupling forms. The specific classification is shown in Table 6.
Dual-factor coupling refers to the interaction between two types of risks that affect the system, eventually leading to accidents. For example, the interaction between inadequate emergency measures and insufficient support engineering may accelerate the evolution of accidents. Similarly, multi-factor coupling refers to the mutual catalysis of three or four types of risk factors in this system. We first analyze the coupling forms in each accident based on the official accident reports and classify them. Then, according to the introduced method, the accidents’ frequency p and the risks’ coupling probability P are counted. Finally, using Equations (5)–(10), the coupling value T under different coupling forms is further calculated, as shown in Figure 8.
The horizontal axis represents the different coupling forms in the system, while the vertical axis represents the corresponding coupling values. In different risk coupling forms, the higher the risk coupling value, the greater the probability of inducing accidents in this case, which increases the complexity of the system and makes it more difficult to control the risk level. The analysis shows that the top five risk coupling forms with the highest values all relate to human factors, illustrating that human factors are the leading cause of shield accidents in water conveyance tunnels. In the 53 accident cases, human-related risks account for 67.92%. In actual construction, human errors occur frequently, such as non-compliance with construction regulations, lack of safety awareness, inadequate technical skills, and insufficient understanding of abnormal situations, and these can even co-occur. Moreover, human risks are also prone to be catalyzed by environmental and management factors, leading to tunnel accidents. In summary, it is crucial to reinforce the control of human factors and minimize their interaction with other factors as much as possible in the construction process of shield tunneling of water conveyance tunnels. Effective measures should be implemented to mitigate the coupling effect.

4.3. Key Factor Analysis

The N-K model can describe the risk coupling mechanism quantitatively and identify the weak links prone to risk coupling in the system. However, it cannot reveal the process of risk transmission. Moreover, each factor has a distinct difference in their impact on the formation of accidents, and the N-K model neglects the independent analysis of each factor in the network feature. The complex network model can identify the evolution mechanism and the causative path of accidents fundamentally, but it does not reflect the intensity and probability of risk couplings occurring. When the two models are used separately to analyze the risk of tunnel shield construction, the risk characteristics and the overall risk evolution mechanism cannot be fully presented, resulting in the one-sidedness control recommendations. Therefore, this section combines the two models to further quantify the intrinsic relationship of risks and obtain the leading causes of accidents. In causal networks, the eigenvector centrality of a node reflects its relative position and significance based on the number and importance of its connections to other nodes. The closeness centrality measures the influence of nodes by the length of their paths to other nodes. These indicators highlight the interconnection of factors and their contribution to risk propagation. Therefore, the eigenvector centrality and closeness centrality are chosen as parameters for coupling value correction. By comparing the indicators of nodes before and after correction, we can visualize factors’ actual function and influence in the network structure and identify the critical nodes. This helps managers prioritize attention and management to specific factors, providing deeper insights and enabling more effective risk management decisions.

4.3.1. Node Connectivity Analysis

Connectivity analysis is the bridge between the N-K model and the complex network analysis. Connectivity refers to the fact that two nodes in a network are connected regardless of the number of steps required to reach them. Through connectivity analysis, we can find out the potential coupling form for each risk factor, and each coupling form corresponds to the coupling value T calculated by the N-K model above. Table 7 shows the connectivity analysis results. In the table, 1 means connected, and 0 means disconnected.

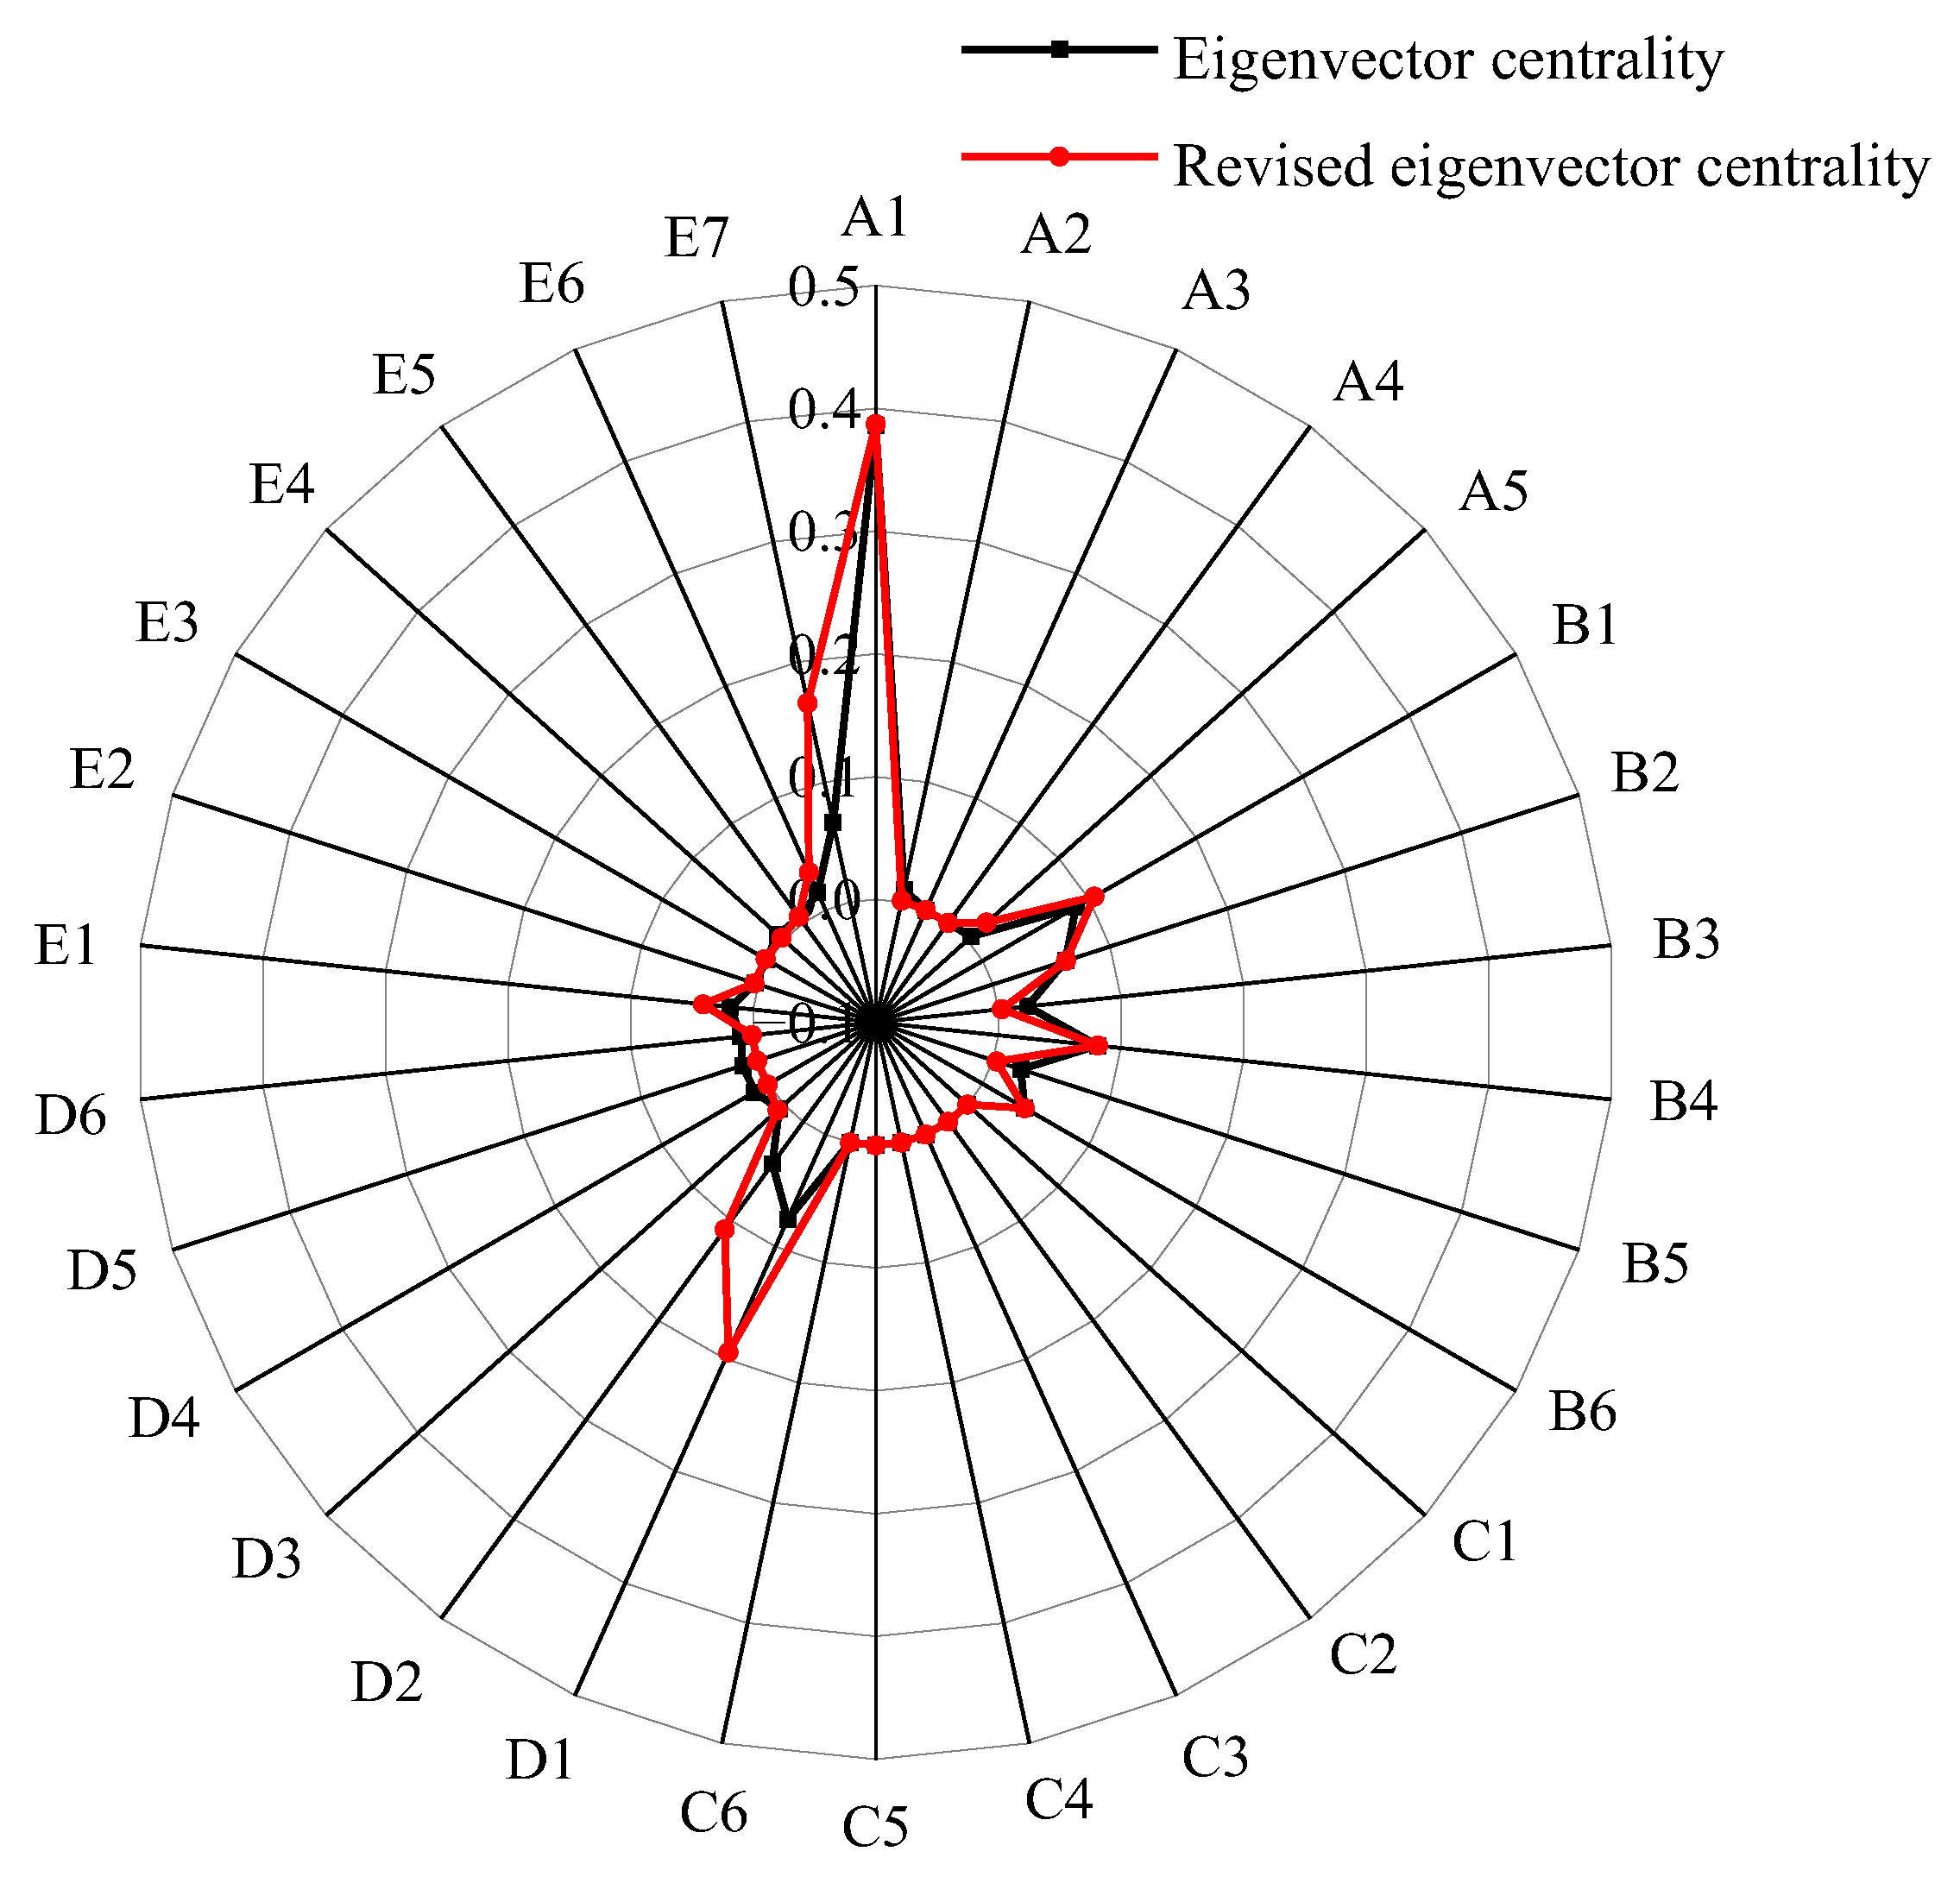
4.3.2. Revision of Eigenvector Centrality

According to the connectivity analysis above, each network node corresponds to its potential coupling form. The corresponding coupling value is taken as the coefficient and multiplied by the original eigenvector centrality after an appropriate expansion to achieve the correction of the eigenvector centrality, as depicted in Figure 9. From the figure, it can be seen that after considering risk coupling, 22 nodes have an eigenvector centrality higher than 0, accounting for 73.33%, indicating a significant interconnectedness of risks in the safety system of shield construction of water transmission tunnels.
In Figure 9, the black line and red line show the comparison of eigenvector centrality before and after revision. There are some missing nodes in the figure, which indicates that the eigenvector centrality of these nodes is 0. Before the revision, the top five factors of eigenvector centrality were inadequate emergency measures (B1), poor ability of judgment and decision-making (B4), personnel not working according to regulations (A1), the cutter head becoming stuck, damaged, or even detached (D1), and personnel operation accidents (E7). After correction, the top five are the cutter head becoming stuck, damaged, or even detached (D1), inadequate support engineering (D2), personnel operation accidents (E7), inadequate emergency measures (B1), and the poor ability of judgment and decision-making (B4). The overall ranking of eigenvector centrality before and after the revision is relatively similar. However, there are some differences in the data, with some values increasing or decreasing. After the revision, the order of eigenvector centrality of some risks has advanced, such as the cutter head becoming stuck, damaged, or even detached (D1), inadequate support engineering (D2), personnel operation accidents (E7), and collapse (E1). There is also a decrease in order, reflecting the impact of risk coupling on the eigenvector centrality. After the revision, the eigenvector centrality of the cutter head becoming stuck, damaged, or even detached (D1) and inadequate support engineering (D2) has significantly improved, reaching 156.09%. This shows that when coupling degree and causality are considered at the same time, whether the cutter head is in a safe state and whether the supporting project is sufficient are closely related to other high-risk factors, which tightly threatens the safety of shield construction, and the manager needs to make clear that this equipment factor is the focus of control. The increases in personnel operation accidents (E7), collapse (E1), shield tunneling machine instability (E6), and inadequate emergency measures (B1) are also notable, with rates of 150.59%, 84.20%, 59.26%, and 61.54%, respectively. In contrast, the eigenvector centrality of the accident type increased more. After integrating the coupling mechanism, we further evaluate the nodes’ influence based on their importance and the importance of their connecting nodes, which is more comprehensive and realistic than before.

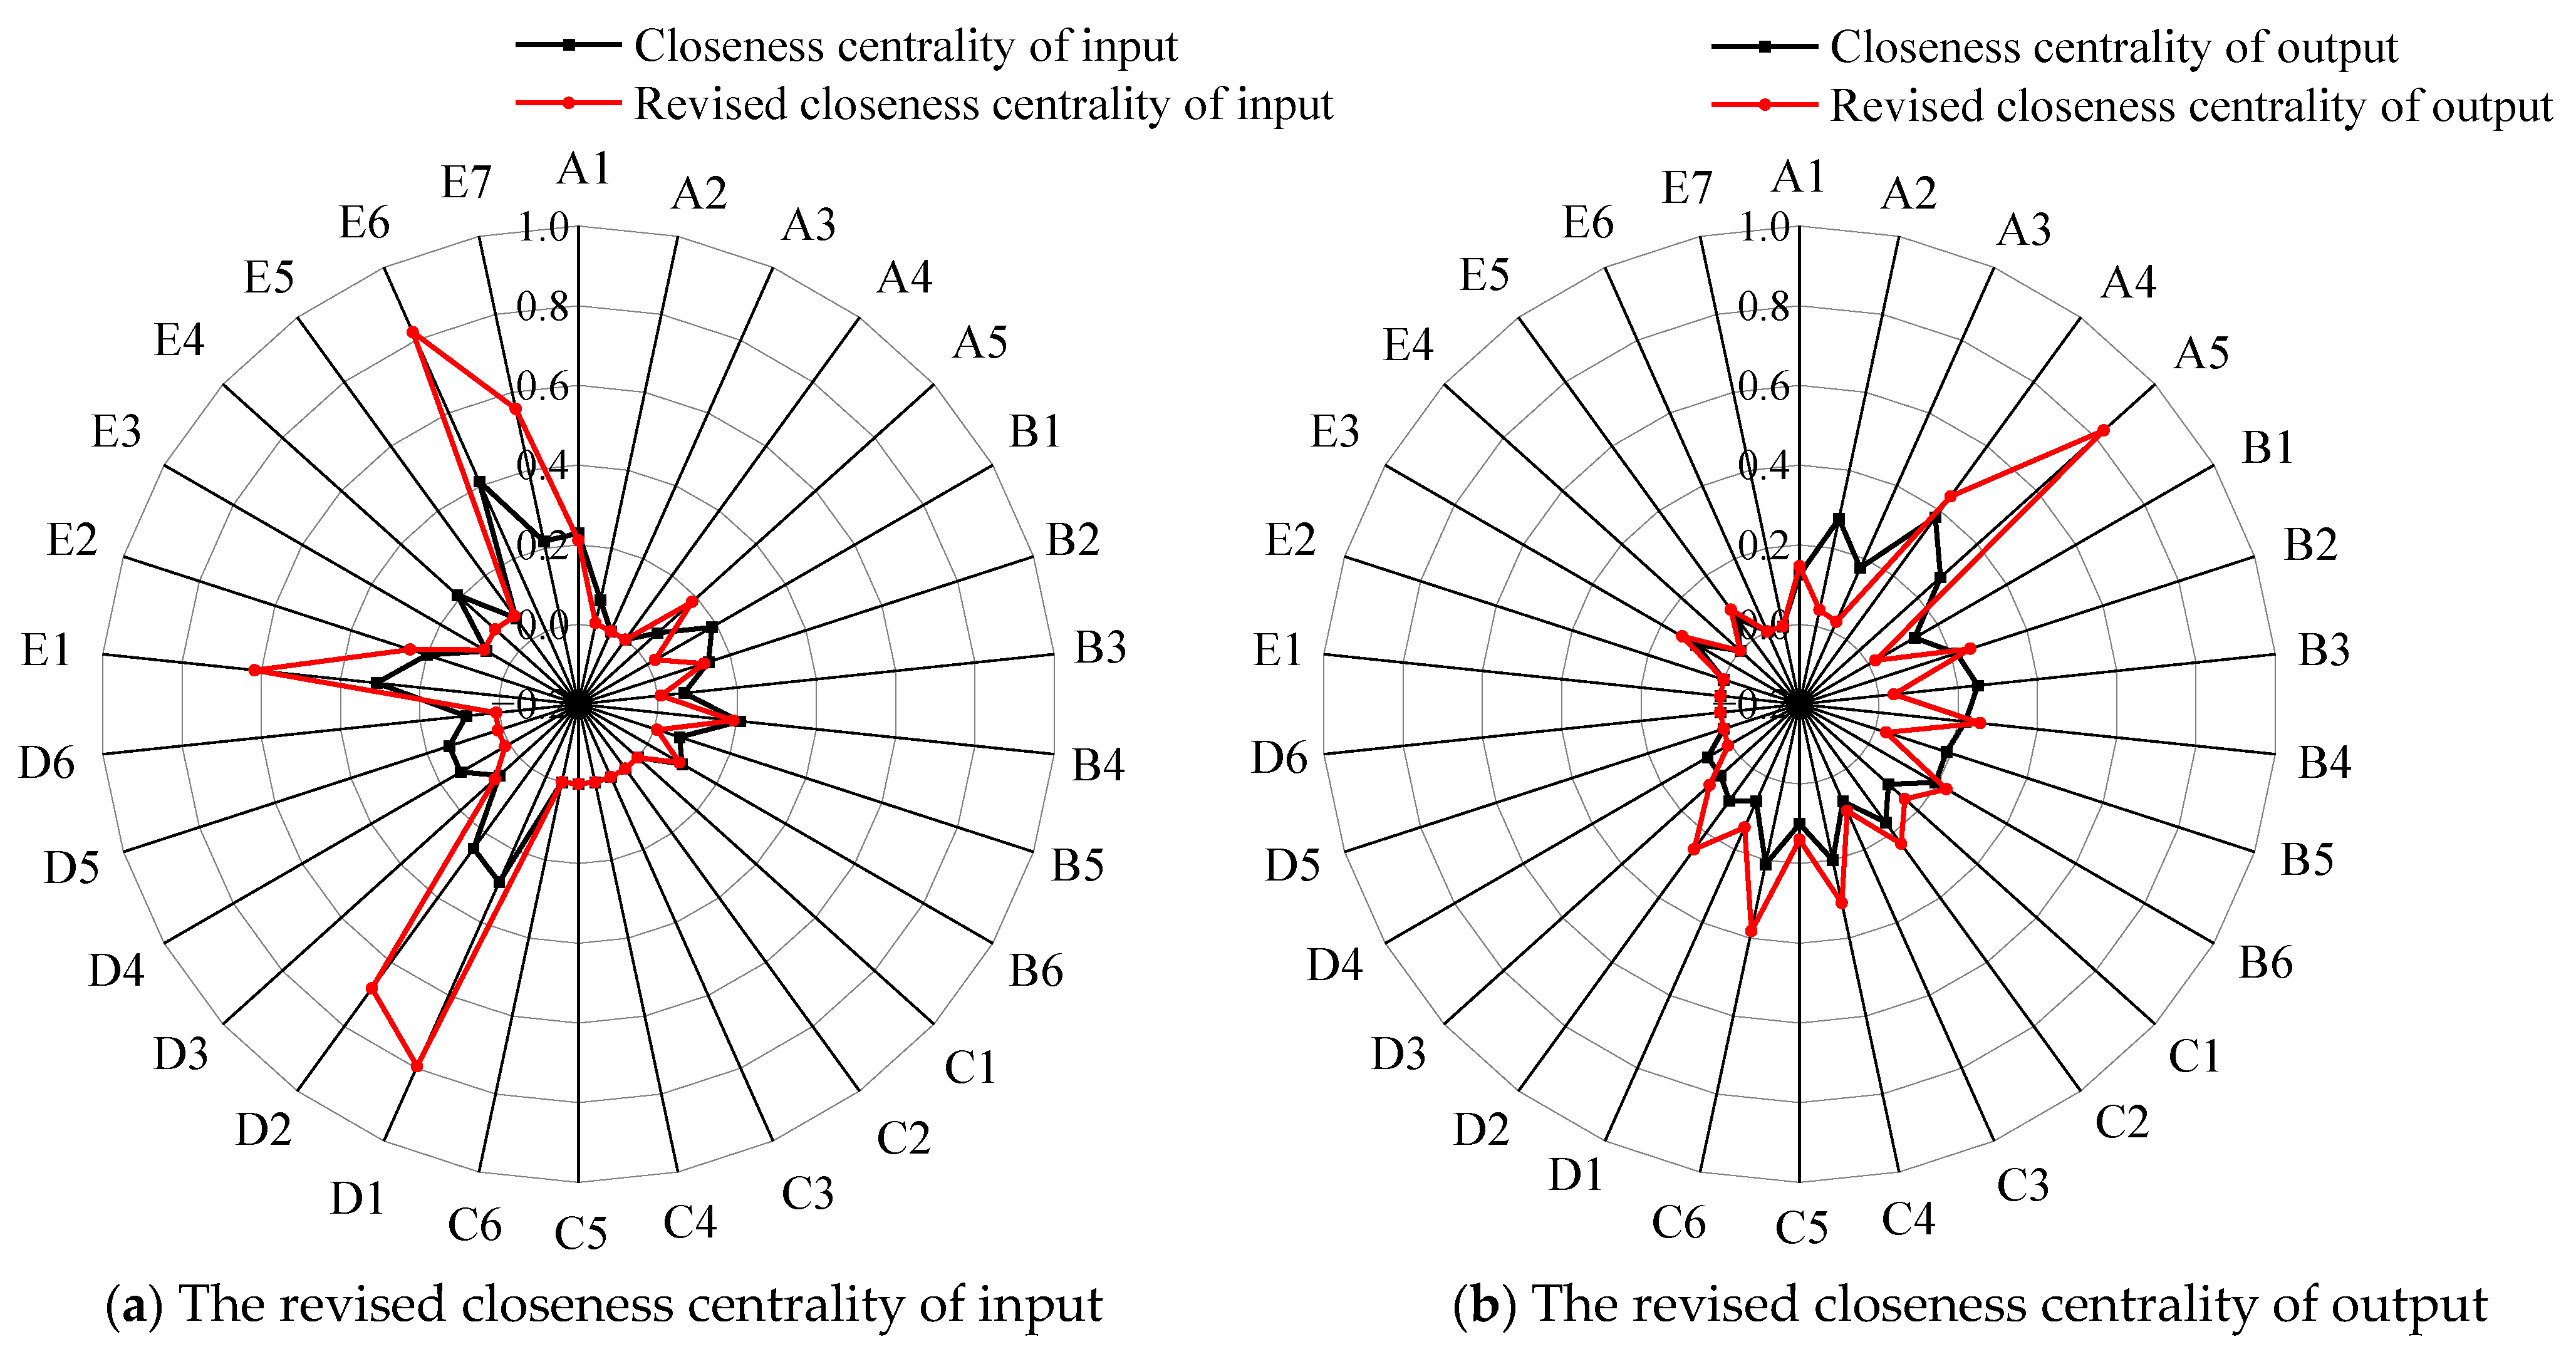
4.3.3. Revision of Closeness Centrality

Similarly, taking the potential coupling value corresponding to each node as a parameter, we multiplied it by the original closeness centrality and then adjusted it to complete the revision. The revised closeness centrality considers the direct connection between nodes and incorporates factors’ indirect connection and interaction. After considering the risk coupling, the input closeness centrality of the cutter head becoming stuck, damaged, or even detached (D1), inadequate support engineering (D2), shield tunneling machine instability (E6), and collapse (E1) still rank among the top nodes. The importance of these risk factors becomes more prominent, as shown in Figure 10a. The risks with the highest increase rate are the cutter head becoming stuck, damaged, or even detached (D1), personnel operation error (A5), and inadequate support engineering (D2), with 175.63%. Then, the increases in input closeness centrality of shield tunneling machine instability (E6) and collapse (E1) are also large, both of which are 99.57%. Some risk factors that were less important previously, such as personnel operational errors (A5), have become more important.
Figure 10 shows the change in input degree and output degree of closeness centrality after considering the coupling relationship. After revision, the nodes with high output closeness centrality are personnel operational errors (A5), inadequate support engineering (D2), insufficient understanding of abnormal situations (A4), and the cutter head becoming stuck, damaged, or even detached (D1), as shown in Figure 10b. There are minor changes in the revised rankings from the previous results. Lack of safety awareness (A2), personnel operation error (A5), and insufficient understanding of abnormal situations (A4) are ranked earlier, indicating that the risk coupling affects the average path length from these nodes to other nodes, making it more convenient to reach others. Among numerous nodes, the node with the highest increase in output closeness centrality is personnel operational errors (A5), which reaches 199.72%, indicating that the coupling relationship and coupling degree have a strong influence on it. In addition, inadequate support engineering (D2) and the cutter head becoming stuck, damaged, or even detached (D1) also increased significantly, with 149.90% and 108.20%. In the actual shield construction process of water conveyance tunnels, relevant personnel should manage the risks that have been mentioned above, prepare accident plans, and cut off the source of accidents.

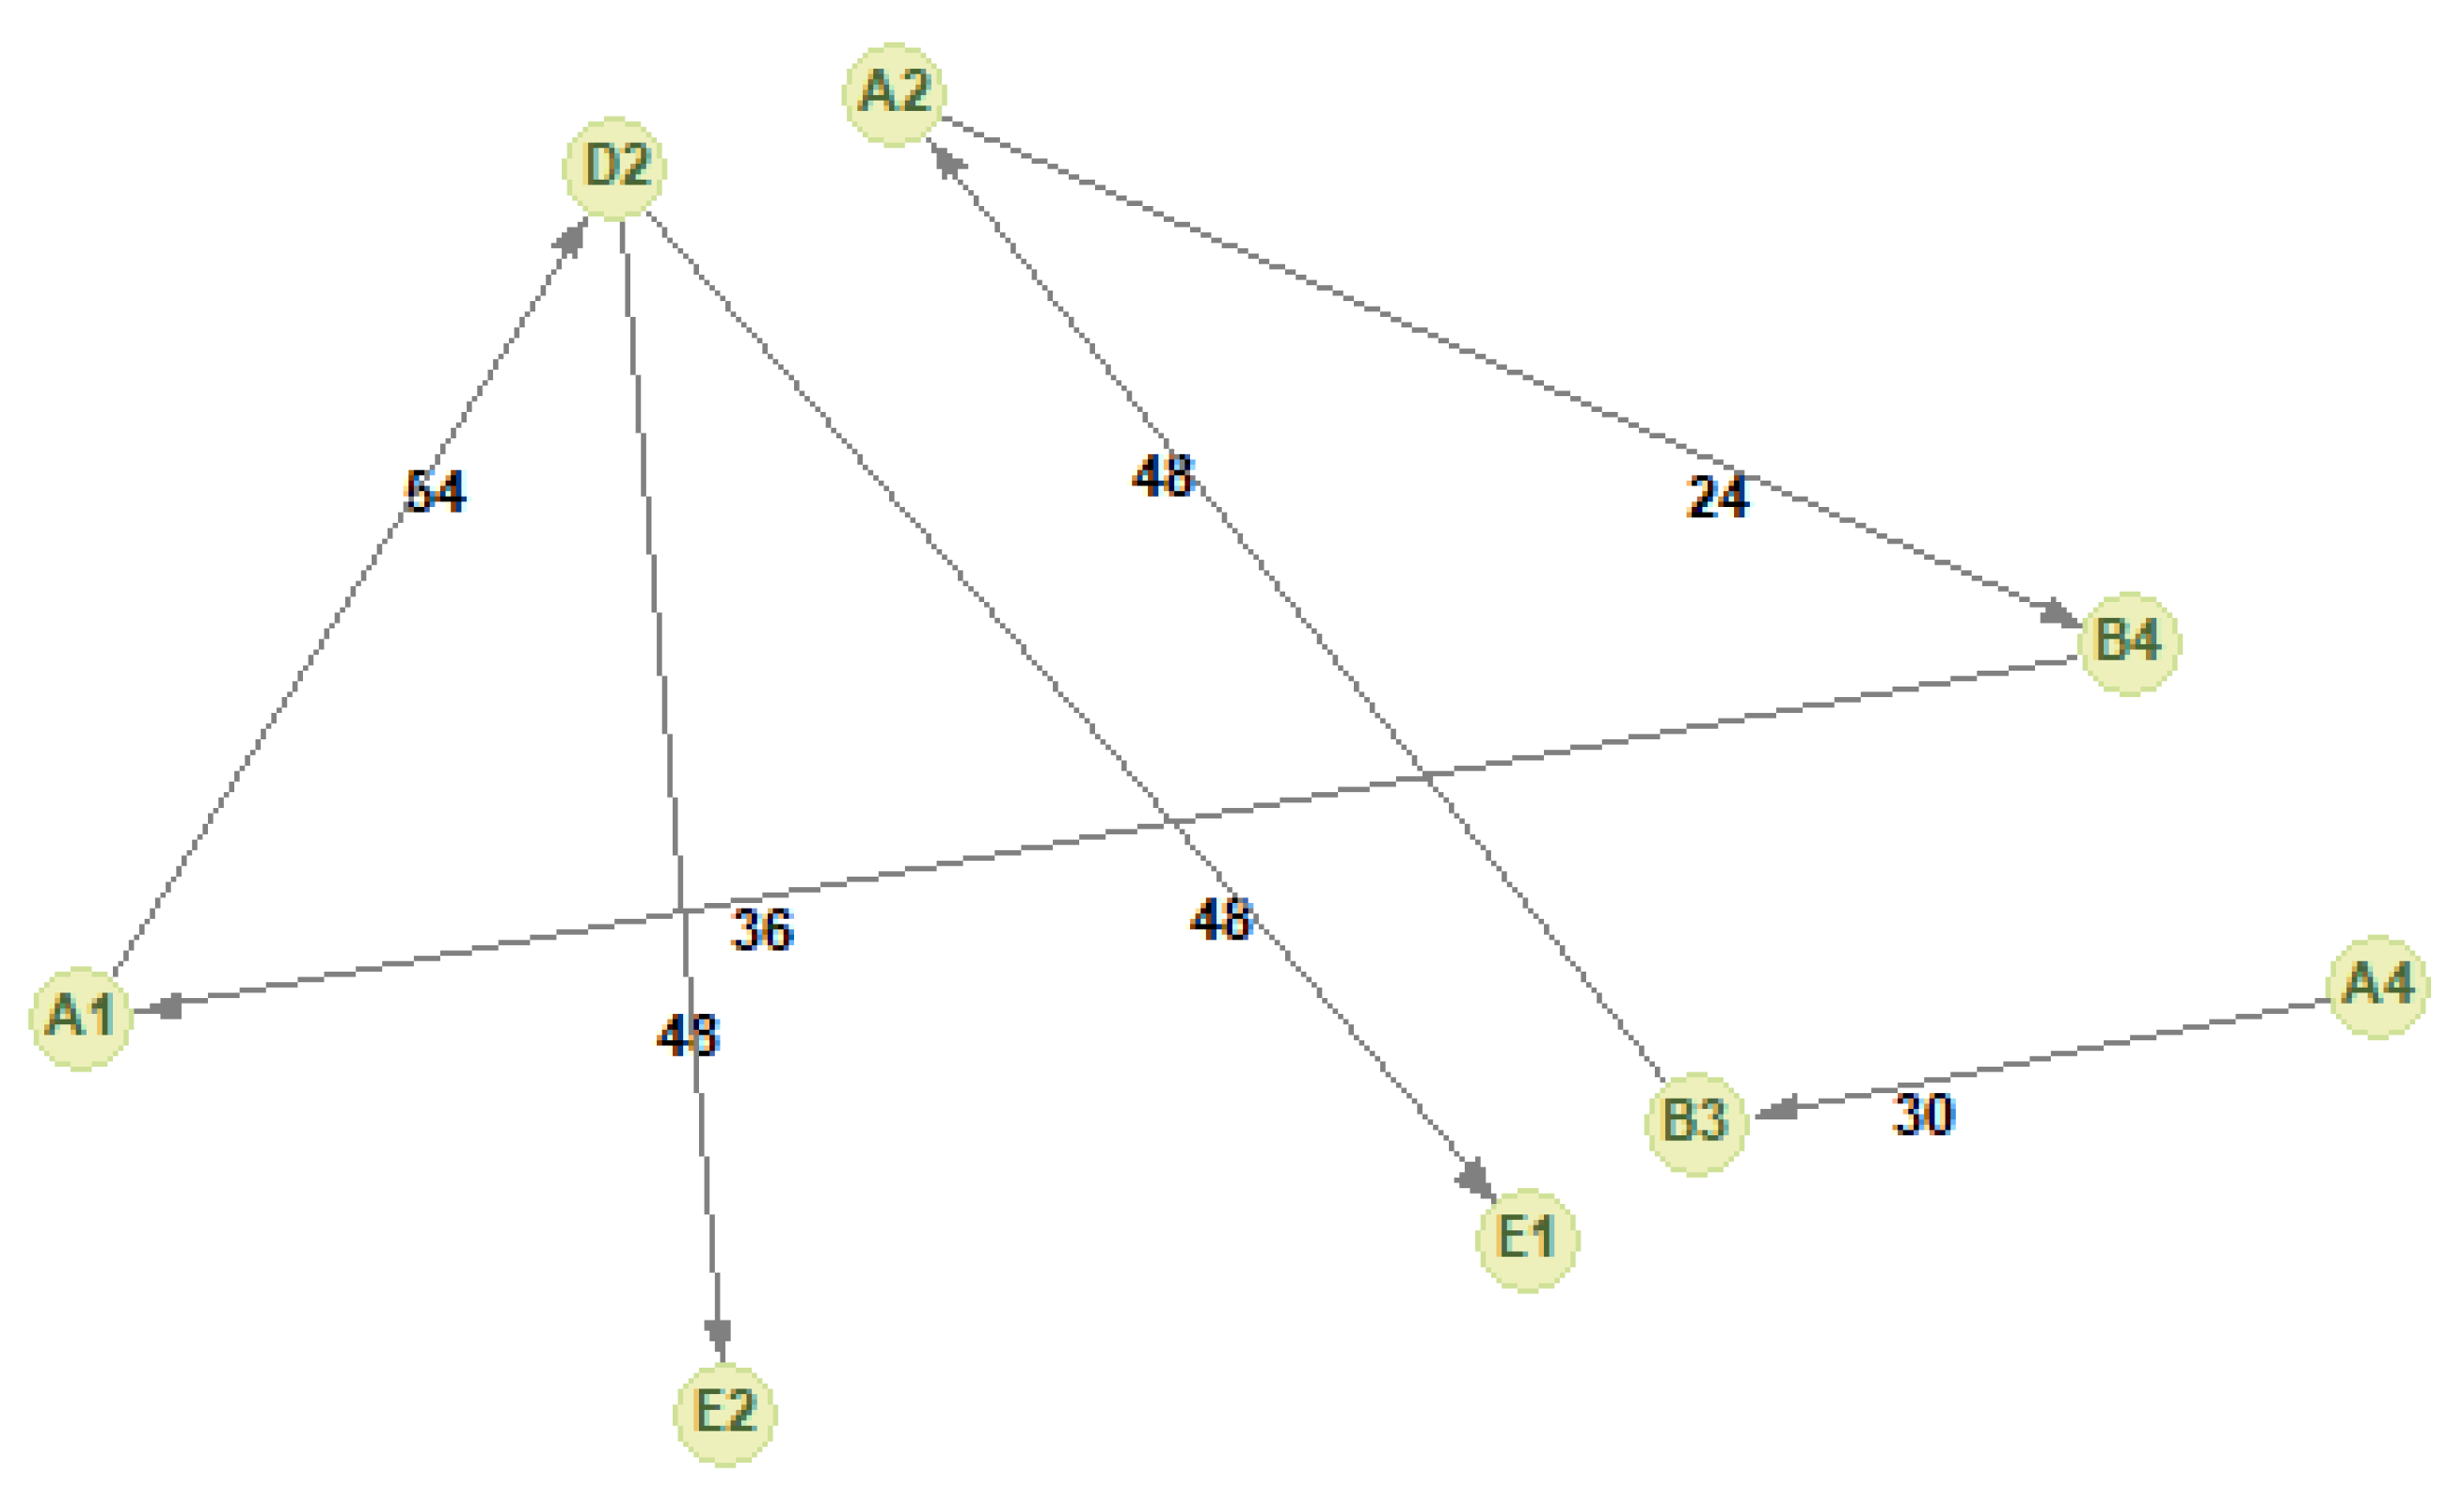
4.4. Key Causative Link Analysis

The analysis of the characteristic indicators of the nodes reveals the influence of each factor in the causal network. This section examines the primary causal path of accidents related to shield construction of water conveyance tunnels. Instead of isolating individual nodes, the main path analysis provides a systematic understanding of causality in complex systems from a holistic perspective. Therefore, managers can pinpoint the most likely path leading to accidents or negative outcomes, prioritize risk management, and direct resources and attention to the critical risk points in engineering projects. Pajek software is utilized to identify the key causal links of shield construction accidents of water conveyance tunnels, as depicted in Figure 11.
There are two critical paths in Figure 11, and several factors at the front of the two critical paths are completely consistent, resulting in two types of accidents, including collapse and surrounding rock damage and deformation. Figure 11 presents that in shield tunneling accidents in water conveyance tunnels, the factors at the forefront of the critical causal path all pertain to human risk and management risk. The two key causal links are as follows: ① insufficient understanding of abnormal situations (A4)→lack of safety education and training (B3)→lack of safety awareness (A2)→poor ability of judgment and decision-making (B4)→personnel did not work according to regulations (A1)→inadequate support engineering (D2)→collapse (E1); ② insufficient understanding of abnormal situations (A4)→lack of safety education and training (B3)→lack of safety awareness (A2)→poor ability of judgment and decision-making (B4)→personnel not working according to regulations (A1)→inadequate support engineering (D2)→deformation and destruction of surrounding rock (E2). It indicates that unsafe behaviors in the chain must be strictly controlled, and other related factors must be collaboratively controlled to reduce risk and ensure smooth construction. It is evident that insufficient understanding of abnormal situations (A4) is located at the beginning of the critical causal link, and it is identified as the primary factor in both causal paths. This signifies that the root cause of accidents requires stringent prevention and control. This result also reflects that project personnel have failed to fully or timely perceive abnormal situations in previous shield construction accidents, which is a fundamental safety management issue. Due to inadequate professional knowledge, limited experience, or poor information transmission, relevant workers may fail to identify the improper states of risks promptly. Additionally, influenced by cognitive biases, people tend to pay more attention to ordinary or familiar risks while ignoring rare situations that may lead to severe consequences.
Two nodes at the end of the critical path are accident types: collapse (E1) and deformation and destruction of surrounding rock (E2). The accident data also show that these two types of accidents account for the largest proportion of shield construction accidents in water transmission tunnels. The analysis aligns with the actual accident scenarios. Personnel not working according to regulations (A1)→inadequate support engineering (D2) is the directed edge with the highest value in the entire critical cause chain, followed by two aforementioned types of accidents. This implies that non-compliance with regulations and inadequate support engineering directly result in serious consequences such as collapse and surrounding rock deformation. The findings also highlight the necessity of adhering to regulations and maintaining quality control in construction management. Furthermore, high-risk transmission paths include lack of safety education and training (B3)→lack of safety awareness (A2), inadequate support engineering (D2)→collapse (E1), inadequate support engineering (D2)→deformation and destruction of surrounding rock (E2). These paths highlight potential risk areas during the construction process, and measures should be implemented to address these risk factors and prevent accidents promptly.

5. Discussion

This study examines the causal and coupling relationships of risk factors, aiming to uncover the independent contributions of each factor to accidents. It also describes how factors interact and how they promote the development of accident situations jointly. This study integrates the N-K model and complex network to provide a more comprehensive and in-depth risk analysis, making up for the shortcomings of using a single model alone. This approach helps us better understand the internal causes and assess the degree of harm caused by risks. Ultimately, it assists managers in formulating targeted prevention and control measures for more effective management in practical applications.
Similar to this study, Li, Q. [51] also noted the impact of the causal relationship between risks. However, Li, Q. did not provide a precise analysis of the causal relationship. The interpretive structure model was used to examine the transmission of risk events and the relationship between secondary factors and risk events under the same type of risk. For example, the paper mentioned a causal chain, which is the risk event of personnel training caused by the replacement of management personnel. The damaged sealing at the tail of the shield tunneling machine led to mechanical equipment failure, which affected the construction progress. However, there are also causal links between different types of risk factors and risk events. For instance, in a practical engineering accident, the construction site of a particular project has abundant groundwater and poor self-stability of the tunnel arch strata, which served as existing environmental risks. Under the premise that the managers did not implement the main responsibility of safety production and did not perform well in risk assessment and judgment, they still decided to continue construction, resulting in water and sand gushing on the excavation face, which finally caused a ground collapse. In this accident, from the first level of risk, environmental risk and human risk contributed to water and mud surges and further led to another kind of accident—collapse. In other words, the risk analysis of the tunnel shield construction stage of water conveyance tunnels should not be limited to the subsystems within the same type of risks but should be extended to deeper factors and different kinds of risks. In accident causation, primary risks usually represent a more abstract and systematic source of risk. Our research considers the causal relationships of factors and the connection between risks and accidents under different types of risks, providing a more macro and comprehensive risk perspective. Compared to previous research, our study is more in line with the risk evolution laws in actual construction and comprehensively maps the actual situation of the risk evolution mechanism. In this way, the risk management strategy proposed based on the overall relationship of risks is more persuasive and has a higher reference value for risk management in actual engineering construction.
In contrast, the causal analysis in this paper further considers the coupling of risks. By analyzing the causal links among risk events that impact the progress of tunnel shield tunneling construction, Li, Q. predicted the subsequent risks and their development trends, providing specific support for the construction management of water diversion tunnel construction. Besides causality, there are coupling relations among risk factors in shield construction accidents, and the combined impact of risks can aggravate the severity of factors or accidents. Our research on collected accidents revealed that risk coupling is the leading cause of accidents. For example, in an actual accident, the soil at the construction site was soft, and the workers did not set up the supporting structures as required. In addition, the project site manager had a lucky mentality and disregarded the high level of danger, choosing to take risks. Among them, the impact of geology or soil is an objective environmental risk. Inadequate support engineering is an equipment risk, and the on-site leaders lack safety awareness and awareness, as well as risky operations, which belong to human risk. In this situation, there is no direct causal relationship between factors or a risk transmission chain, but there is a coupling relationship between the three types of risks. Under the joint catalytic effect, a collapse accident was caused. If the three risks had occurred separately, or if only two had existed simultaneously, there might not be an accident. In other words, the risk may be suppressed during the evolution process if the soil condition did not affect the construction, if the site management personnel had high safety awareness, or if the support engineering met the specifications. However, the coupling effect of the three factors increased the likelihood of an accident.
From the analysis of the causes, it can be seen that certain safety accidents are influenced by risk coupling. Li, Q. did not capture the impact of risk coupling, and its risk path prediction research did not fully present the mutual influence of risks in actual construction. Moreover, in addition to the coupling relationship, it also involves coupling intensity. In this study, we also considered the numerical relationship of risk factors involved in the coupling, quantified the coupling strength with the help of the N-K model, and integrated it into the quantitative causality results. Compared to previous research, this study quantifies the intrinsic connections of risks and the impact of risk on accidents more accurately.
Finally, this study identifies the key risk factors and critical links. While Li, Q. also obtained critical links, their main focus was on constructing risk prediction models to predict the maximum possible path leading to accidents. Li, Q. obtained the risk path based on probability prediction. However, if the probability prediction model is not accurate enough or if the data used are biased, the predicted risk path may differ from the actual situation. Therefore, further parameter adjustment and case verification may be required for application in actual projects. Meanwhile, this paper obtained risk identification results consistent with the accident investigation conclusion, verifying its reliability. This indicates that the conclusions and recommendations have high practical value in risk management and can provide a scientific basis for construction safety management.
In the causal analysis of similar engineering accidents, Zhao, Z. [52] discussed the possibility of risk occurrence under single-factor, dual-factor, and multi-factor coupling. The N-K model is used to calculate the coupling values among risks, and coupling analysis is conducted on the risks that affect engineering accidents. This paper comprehensively analyzes the risk coupling mechanism and overall risk evolution characteristics. Additionally, this study utilizes the N-K model to describe the risk coupling mechanism and quantify the coupling degree of the shield construction stage of water conveyance tunnels. In the process of inducing engineering accidents, there is a common fact that one factor leads to another or even to several factors. Under the continuous causal effect of risk, ultimately, an accident occurs. In other words, clarifying the causal relationship between risks and between risks and accidents is crucial to analyzing accident causation mechanisms. However, Zhao, Z. failed to consider the contribution of causality among factors to risk propagation and ignored the complex interaction of factors, thereby failing to capture the complexity of accidents and multi-factor interactions in the real world. In contrast, based on coupling research, we introduce complex networks to present the causal relationships and causal chains. This helps engineering managers understand the connections of risk factors intuitively, leading to more valid risk management and decision-making. In their research, Zhao, Z. conducted a risk coupling analysis on four dimensions: human risk, equipment risk, environmental risk, and management risk, emphasizing the criticality of human and management factors in accidents from the perspective of risk coupling. However, it has not been further refined into specific secondary risks like our study, lacking in-depth discussion on the specificity and diversity of risks. Their broad classification of risks might not accurately capture the dynamics generated by the interaction of secondary risk factors. In contrast, we identify 4 primary risk factors for coupling analysis and subdivide 23 secondary factors for causation research, ultimately identifying key causes and critical links. This helps us accurately identify and determine the leading causes and control specific risk points.
This study comprehensively considers the effects of causality and the coupling effect of risk factors on risk transmission and accident catalysis and proposes an accident causation analysis method based on the N-K model and the complex network for shield construction of water conveyance tunnels. This study comprehensively and scientifically analyzes the key risk factors and internal risk profile of the system. The result is verified by the experts mentioned above. However, the study still has some limitations.
  • Due to the dynamic nature of time and industry development, there may be new risk factors in this field. Therefore, the causative factors in the safety system of shield construction of water conveyance tunnels need to be perfected. In the following research, we will continue to mine data, expand the scale of the network, and integrate the set of risk factors constantly to achieve a more comprehensive study. Since our research data and conclusions are from China, we will carry out an international investigation of relevant engineering accidents in the future to improve the applicability of this method.
  • Due to the limitations of the data, this study fails to consider the effect of time on risk status. Therefore, we plan to predict the risk state and the possibility of risk transmission under different time nodes through statistical methods, such as machine learning, in the future to achieve real-time assessment of the risk situation and system security state. Looking ahead, the causal analysis methods can be further extended to other related construction projects, such as water conservancy engineering and shield construction, which provides a reference for strengthening the risk management of engineering construction.

6. Conclusions and Advice

6.1. Conclusions

Compared to regular tunnels, the construction sites of water conveyance tunnels are notably harsh, and the shield technology is quite difficult, triggering accidents frequently and posing significant threats to public safety, economic stability, and the well-being of construction personnel. Therefore, it is essential to clarify and control the critical factors of shield construction of water conveyance tunnels as soon as possible. This paper proposes a hybrid model combining the N-K and complex network theory. Through an analysis of causality and interactions among risk factors, it systematically and comprehensively explores the underlying causes and draws the following conclusions.
  • Based on historical accident cases, this paper identifies risk indicators affecting shield construction accidents of water conveyance tunnels from four dimensions, providing theoretical support for risk research in this field. We collect official accident reports, initially screen and sort out the risk indicators, and revise them using expert opinions. Ultimately, the risk indicator system of shield construction of water conveyance tunnels is constructed, addressing human, management, environment, and equipment risks, including 23 secondary factors. The indicator system, based on historical case analysis, is deemed more objective and adaptable to engineering practices and technological development compared to questionnaire surveys and literature analysis. Moreover, analysis based on authoritative accident investigation reports is considered more accurate and convincing. The systematic and structured identification, evaluation, and control of risks based on the risk indicator system provides a management foundation for the actual shield construction project of water conveyance tunnels, enabling managers to make scientific and reasonable decisions to improve safety management practices.
  • This paper introduces risk coupling theory into the study of shield construction of water conveyance tunnels and discusses the coupling mechanism of shield construction accidents in water conveyance tunnels. This paper uses the N-K model to analyze risk coupling and defines 15 risk coupling forms, including single-factor coupling, dual-factor coupling, and multi-factor coupling. The quantitative analysis indicates that the number of risks involved in coupling shows a positive correlation with the coupling value overall. However, the coupling value of human-environmental coupling is higher than partial multi-factor coupling, and the multi-factor coupling value including these two types of risks is high. This indicates that human and environmental risks are prone to coupling with other risks in the safety system, greatly impacting construction safety. Due to the objectivity of environmental risks, the relevant department should focus on controlling human risks, reducing the probability of human risks and environmental risks coupling with other factors and ensuring construction safety. The coupling analysis provides a valid basis for early warning and risk control and has important engineering significance for controlling risk diffusion, enabling it to better resist uncertainty and change.
  • This paper examines the impact of risk coupling and causality on accidents, focusing on the causes of shield tunnel construction accidents in water conveyance tunnels, which helps to optimize the allocation of risk management resources in practical engineering. Unlike previous causal analyses that only considered the causal relationships of risks, this study also takes into account the impact of risk coupling, using coupling values to modify the characteristic indicators of nodes. From a theoretical perspective, this research reduces the influence of subjective judgment, clarifies the causal and coupling relationships among unsafe behaviors, and further improves the theoretical research framework on accident causes. The identification of key causes through the interaction and causality of risks can help managers deliver more appropriate safety management strategies, thus reducing additional costs, rework, and production defects. This practical assistance can ensure construction safety, improve construction quality, control costs, and enhance efficiency.

6.2. Advice

This paper combines the N-K model and complex network theory to analyze the risk factors involved in shield construction of water conveyance tunnels. It discusses the risk coupling mechanism, describes the critical links of risk propagation, and identifies key factors and causal chains. Based on the research results, the following suggestions are proposed.

6.2.1. Key Causal Aspects

After analyzing the characteristic indicators of nodes, we have concluded that the key causes of shield accidents in water conveyance tunnels include personnel not working according to regulations, inadequate emergency measures, poor judgment and decision-making ability, and insufficient understanding of abnormal situations. The administrative section should establish and improve the construction rules and regulations, enhance the supervision and management of construction sites, strengthen safety constraints, and ensure that construction is carried out under regulations. Additionally, it is necessary to develop a long-term training and assessment plan for staff, including safety operation, professional skills, emergency response, and decision-making to improve workers’ risk awareness, bottom-line thinking, and ability to handle accidents. Furthermore, managers can conduct case analysis and experience sharing to strengthen the staff’s understanding of abnormal conditions during construction and improve the identification and prevention of potential risks.

6.2.2. Key Causal Chain Aspect

The risks at the front of the causal path are human risk or management risk, indicating that these two risks are the starting points of risk propagation in the safety system of shield construction of water conveyance tunnels. Specifically, the inadequate understanding of abnormal situations is the beginning of the key causal link. Furthermore, the node has a high output degree and high output closeness centrality, showing that it has a strong influence and control over other risks or accidents. The relevant management departments should arrange for workers and on-site management personnel to receive emergency education and training, including identifying and handling abnormal situations, improving risk awareness, and enhancing emergency response capabilities. Furthermore, the managers should summarize the characteristics and lessons of historical accidents. Based on this, the historical accident database can be established to identify similar cases and analyze the causes of accidents, which can provide management reference for future construction in the field. Meanwhile, managers should develop detailed and feasible emergency plans and countermeasures and conduct regular emergency simulation exercises to enhance staff’s ability to respond to emergencies.

Author Contributions

Conceptualization, Q.Z.; methodology, Q.Z. and M.L.; software, Q.Z.; validation, X.Z., Y.Z., and M.L.; formal analysis, Y.Z.; investigation, G.Q.; resources, G.Q.; data curation, M.L.; writing—original draft preparation, Q.Z.; writing—review and editing, X.Z.; visualization, Y.Z.; supervision, Y.Z.; project administration, G.Q. All authors have read and agreed to the published version of the manuscript.

Funding

This research was supported by the Shanxi Province Natural Science Basic Research program—Joint fund project (Grant No. 2021JLM-52).

Data Availability Statement

Data are contained within the article.

Acknowledgments

The authors thank the department of science and technology of Shanxi Province and Shanxi Province Hanjiang-to-Weihe River Valley Water Diversion Project Construction Co., Ltd. for their support.

Conflicts of Interest

The authors declare no competing interests, or other interests that might influence the results or discussion reported in this paper.

References

  1. Li, Y.Y.; Li, Y.L.; He, J. Strategic countermeasures for China’s water resources security in the new development stage. J. Hydraul. Eng. 2021, 52, 1340–1346. [Google Scholar]
  2. Chen, X.S.; Fu, Y.B.; Chen, X.; Xiao, H.; Bao, X.; Pang, X.; Wang, X. Progress in underground space construction technology and technical challenges of digital intelligence. China J. Highw. Transp 2022, 35, 1–12. [Google Scholar]
  3. Einstein, H.H. Risk and risk analysis in rock engineering. Tunn. Undergr. Space Technol. 1996, 11, 141–155. [Google Scholar] [CrossRef]
  4. Sturk, R.; Olsson, L.; Johansson, J. Risk and decision analysis for large underground projects, as applied to the Stockholm ring road tunnels. Tunn. Undergr. Space Technol. 1996, 11, 157–164. [Google Scholar] [CrossRef]
  5. Hongbin, G.; Zhanping, S.; Chen, M.; Junbao, W.; Naifei, L.; Desai, G. Shield tunneling risk assessment based on nonlinear fuzzy analytic hierarchy method. Tunn. Constr. 2023, 43, 1862–1871. [Google Scholar]
  6. Zhang, Y.; Liu, C.; Mou, Y.X. Risk assessment of shield construction of water conveyance tunnels in collapsible loess areas. Yangtze River 2023, 16, 1–10. [Google Scholar]
  7. Ardeshir, A.; Amiri, M.; Ghasemi, Y.; Errington, M. Risk assessment of construction projects for water conveyance tunnels using fuzzy fault tree analysis. Int. J. Civ. Eng. 2014, 12, 396–412. [Google Scholar]
  8. Zhang, Z.; Wang, B.; Wang, X.; He, Y.; Wang, H.; Zhao, S. Safety-risk assessment for TBM construction of hydraulic tunnel based on fuzzy evidence reasoning. Processes 2022, 10, 2597. [Google Scholar] [CrossRef]
  9. Gu, X.B.; Wu, Q.H.; Ma, Y. Risk assessment of the Rockburst intensity in a hydraulic tunnel using an intuitionistic fuzzy sets-TOPSIS model. Adv. Mater. Sci. Eng. 2022, 2022, 4774978. [Google Scholar] [CrossRef]
  10. Liu, W.L.; Yin, H.; Su, Y. Safety risk evaluation and diagnosis of hydraulic tunnel construction based on G2-AEM-UMT Model. J. Water Resour. Water Eng. 2023, 34, 184–192. [Google Scholar]
  11. Zhang, Y.L.; Liu, D.H.; Hu, D.J. DS evidence theory-based multi-criteria fuzzy comprehensive evaluation of safety of water conveyance structure. Water Resour. Hydropower Eng. 2019, 50, 104–109. [Google Scholar]
  12. Zhang, S.; Liu, T.; Wang, C. Multi-source data fusion method for structural safety assessment of water diversion structures. J. Hydroinform. 2021, 23, 249–266. [Google Scholar] [CrossRef]
  13. Cárdenas, I.C.; Al-jibouri, S.S.; Halman, J.I.; van Tol, F.A. Capturing and integrating knowledge for managing risks in tunnel works. Risk Anal. Int. J. 2013, 33, 92–108. [Google Scholar] [CrossRef] [PubMed]
  14. Hyun, K.C.; Min, S.; Choi, H.; Park, J.; Lee, I.M. Risk analysis using fault-tree analysis (FTA) and analytic hierarchy process (AHP) applicable to shield TBM tunnels. Tunn. Undergr. Space Technol. 2015, 49, 121–129. [Google Scholar] [CrossRef]
  15. Huang, Z.; Zhang, W.; Sun, H.; Pan, Q.; Zhang, J.; Li, Y. Risk uncertainty analysis in shield tunnel projects. Tunn. Undergr. Space Technol. 2023, 132, 104899. [Google Scholar] [CrossRef]
  16. Wang, Y.; Su, J.; Zhang, S.; Guo, S.; Zhang, P.; Du, M. A Dynamic Risk Assessment Method for Deep-Buried Tunnels Based on a Bayesian Network. Geofluids 2020, 1, 8848860. [Google Scholar] [CrossRef]
  17. Yang, Y.; Wang, Y.; Easa, S.M.; Yan, X. Risk factors influencing tunnel construction safety: Structural equation model approach. Heliyon 2023, 9, e12924. [Google Scholar] [CrossRef]
  18. Qie, Z.; Yan, H. A causation analysis of Chinese subway construction accidents based on fault tree analysis-Bayesian network. Front. Psychol. 2022, 13, 887073. [Google Scholar] [CrossRef]
  19. Chung, H.; Park, J.; Kim, B.K.; Kwon, K.; Lee, I.M.; Choi, H. A causal network-based risk matrix model applicable to shield TBM tunneling projects. Sustainability 2021, 13, 4846. [Google Scholar] [CrossRef]
  20. Wang, F.; Li, H.; Dong, C.; Ding, L. Knowledge representation using non-parametric Bayesian networks for tunneling risk analysis. Reliab. Eng. Syst. Saf. 2019, 191, 106529. [Google Scholar] [CrossRef]
  21. Perrow, C. Normal Accidents: Living with High Risk Technologies; Princeton University Press: Princeton, NJ, USA, 1999. [Google Scholar]
  22. Pan, H.; Gou, J.; Wan, Z.; Ren, C.; Chen, M.; Gou, T.; Luo, Z. Research on coupling degree model of safety risk system for tunnel construction in subway shield zone. Math. Probl. Eng. 2019, 1, 5783938. [Google Scholar] [CrossRef]
  23. Guo, D.; Song, Z.; Xu, T.; Zhang, Y.; Ding, L. Coupling analysis of tunnel construction risk in complex geology and construction factors. J. Constr. Eng. Manag. 2022, 148, 04022097. [Google Scholar] [CrossRef]
  24. Xue, Y.; Xiang, P.; Jia, F.; Liu, Z. Risk assessment of high-speed rail projects: A risk coupling model based on system dynamics. Int. J. Environ. Res. Public Health 2020, 17, 5307. [Google Scholar] [CrossRef] [PubMed]
  25. Liu, J.; Wan, L.; Wang, W.; Yang, G.; Ma, Q.; Zhou, H.; Lu, F. Integrated fuzzy DEMATEL-ISM-NK for metro operation safety risk factor analysis and multi-factor risk coupling study. Sustainability 2023, 15, 5898. [Google Scholar] [CrossRef]
  26. Chen, D.; Pei, Y.; Xia, Q. Research on human factors cause chain of ship accidents based on multidimensional association rules. Ocean Eng. 2020, 218, 107717. [Google Scholar] [CrossRef]
  27. Wu, X.G.; Wu, K.B.; Shen, M.F.; Chen, Y.Q.; Zhang, L.M. Research on coupling of safety risks in metro construction based on NK model. China Saf. Sci. J. 2016, 26, 96–101. [Google Scholar]
  28. Wang, H.X.; Liu, Z.J. Coupling analysis of the risk factors for the maritime transportation safety based on the NK model. J. Saf. Environ. 2021, 21, 56–61. [Google Scholar]
  29. Huang, W.C.; Shuai, B.; Sun, Y. Study on coupling risk formation mechanism of railway dangerous goods transportation system based on NK model. J. China Railw. Soc. 2019, 41, 1–9. [Google Scholar]
  30. Dai, S.W.; Liu, X.X.; Wan, F. Coupling analysis on disaster-inducing factors for large deformation accidents in soft rock tunnels. China Saf. Sci. J. 2021, 31, 119–124. [Google Scholar]
  31. Hai, N.; Gong, D.; Liu, S.; Dai, Z. Dynamic coupling risk assessment model of utility tunnels based on multimethod fusion. Reliab. Eng. Syst. Saf. 2022, 228, 108773. [Google Scholar] [CrossRef]
  32. Shan, Z.; Qiu, L.; Chen, H.; Zhou, J. Coupled analysis of safety risks in bridge construction based on NK model and SNA. Buildings 2023, 13, 2178. [Google Scholar] [CrossRef]
  33. Liu, J.; Yang, G.; Wang, W.; Zhou, H.; Hu, X.; Ma, Q. Based on ISM—NK Tunnel Fire Multi-Factor Coupling Evolution Game Research. Sustainability 2022, 14, 7034. [Google Scholar] [CrossRef]
  34. Wu, B.J.; Jin, L.H.; Zheng, X.Z.; Chen, S. Coupling analysis of crane accident risks based on Bayesian network and the NK model. Sci. Rep. 2024, 14, 1133. [Google Scholar]
  35. Liu, W.; Zhao, T.; Zhou, W.; Tang, J. Safety risk factors of metro tunnel construction in China: An integrated study with EFA and SEM. Saf. Sci. 2018, 105, 98–113. [Google Scholar] [CrossRef]
  36. Erdős, P.; Rényi, A. On the evolution of random graphs. Publ. Math. Inst. Hung. Acad. Sci 1960, 5, 17–60. [Google Scholar]
  37. Wan, C.P.; Liu, Y.F.; Wu, B. Study on risk identification and accident evolution mechanism of maritime traffic accidents based on complex network. J. Saf. Sci. Technol. 2023, 19, 165–171. [Google Scholar]
  38. Chen, W.; Wang, L.Y.; Yang, J.; Zhou, H.D.; Yang, D.H. Research on the network model of tower crane accidents based on association rules. China Saf. Sci. J. 2023, 23, 1161–1168. [Google Scholar]
  39. Chen, W.Y.; Li, Y.T.; Song, Z.G. Research on causes of work safety accidents based on complex network theory: A case study of a district in Beijing. China Saf. Sci. J. 2020, 30, 7–12. [Google Scholar]
  40. Wang, H.Y.; Chu, L.; Xu, J. Construction safety risk analysis of bridge girder-erecting machine based on complex network integrating NK model. China Saf. Sci. J. 2023, 33, 10–17. [Google Scholar]
  41. Yang, J.F.; Wang, P.C.; Liu, X.Y.; Bian, M.C.; Chen, L.C.; Lv, S.Y.; Tao, J.F.; Suo, G.Y.; Xuan, S.Q.; Li, R.; et al. Analysis on causes of chemical industry accident from 2015 to 2020 in Chinese mainland: A complex network theory approach. J. Loss Prev. Process Ind. 2023, 83, 105061. [Google Scholar] [CrossRef]
  42. Deng, J.; Liu, S.; Shu, Y.; Hu, Y.; Xie, C.; Zeng, X. Risk evolution and prevention and control strategies of maritime accidents in China’s coastal areas based on complex network models. Ocean Coast. Manag. 2023, 237, 106527. [Google Scholar] [CrossRef]
  43. Guo, S.; Zhou, X.; Tang, B.; Gong, P. Exploring the behavioral risk chains of accidents using complex network theory in the construction industry. Phys. A Stat. Mech. Appl. 2020, 560, 125012. [Google Scholar] [CrossRef]
  44. Zhou, Y.; Li, C.; Ding, L.; Sekula, P.; Love, P.E.; Zhou, C. Combining association rules mining with complex networks to monitor coupled risks. Reliab. Eng. Syst. Saf. 2019, 186, 194–208. [Google Scholar] [CrossRef]
  45. Jiang, J.; Liu, G.; Huang, X.; Ou, X. The Research on Risk Distribution and Evolution of Deep Foundation Pit Construction Adjacent to Existing Tunnels Based on Complex Network. Shock. Vib. 2022, 2022, 1685761. [Google Scholar] [CrossRef]
  46. Ma, X.; Li, K.P.; Luo, Z.Y.; Zhou, J. Analyzing the causation of a railway accident based on a complex network. Chin. Phys. B 2012, 23, 028904. [Google Scholar] [CrossRef]
  47. Zhou, J.; Xu, W.; Guo, X.; Ding, J. A method for modeling and analysis of directed weighted accident causation network (DWACN). Phys. A Stat. Mech. Appl. 2015, 437, 263–277. [Google Scholar] [CrossRef]
  48. Markowitz, H. Portfolio selection. J. Financ. Res. 1952, 7, 77–91. [Google Scholar]
  49. Brandes, U.; Pich, C. Centrality estimation in large networks. Int. J. Bifurc. Chaos 2007, 17, 2303–2318. [Google Scholar] [CrossRef]
  50. Kauffman, S.; Levin, S. Towards a general theory of adaptive walks on rugged landscapes. J. Theor. Biol. 1987, 128, 11–45. [Google Scholar] [CrossRef]
  51. Li, Q.; Li, Z.Y.; Wang, C.S. Prediction of risk event path for shield tunneling of long-distance water conveyance tunnel. South-to-North Water Transf. Water Sci. Technol. 2022, 20, 999–1009. [Google Scholar]
  52. Zhao, Z.; Yan, H.; Wang, Y.; Guo, D. A Coupled Analysis of Risk Factors of Tower Crane Collapse Accident in Extreme Winds Conditions Based on NK Model. In Proceedings of the International Conference on Construction and Real Estate Management 2023, ICCREM 2023, Xi’an, China, 23–24 September 2023; pp. 973–981. [Google Scholar]
Figure 1. Construction of risk indicator system.
Mathematics 12 03222 g001
Figure 2. Relevant statistical data of shield construction of water conveyance tunnels. (a) shows the types of accidents and the proportion of each type of accident; (b) shows the number of accidents and the number of deaths and injuries caused by each type of accident.
Mathematics 12 03222 g002
Figure 3. Risk factor system of shield construction of water conveyance tunnels.
Mathematics 12 03222 g003
Figure 4. Causation analysis of accidents based on the N-K and complex networks.
Mathematics 12 03222 g004
Figure 5. Complex network causation model of shield construction of water conveyance tunnel.
Mathematics 12 03222 g005
Figure 6. The distribution of degree and closeness centrality.
Mathematics 12 03222 g006
Figure 7. Distribution of betweenness centrality and eigenvector centrality.
Mathematics 12 03222 g007
Figure 8. Coupling degree of different coupling forms.
Mathematics 12 03222 g008
Figure 9. Comparison of eigenvector centrality before and after revision.
Mathematics 12 03222 g009
Figure 10. Comparison of closeness centrality before and after revision.
Mathematics 12 03222 g010
Figure 11. Key causative path of shield construction accidents of water conveyance tunnels.
Mathematics 12 03222 g011
Table 1. Typical safety accidents of shield construction of water conveyance tunnel projects in China.
TimeAccident LocationGeneral Situation of AccidentAccident
Consequence
May 2022Yunnan ProvinceIn the construction of a water diversion project, the surface water permeates for a long time, and the support strength is insufficient, which leads to sudden mud gushing.Three died, and the direct property damage was CNY 7.98 million.
April 2023Hainan ProvinceIn a water supply project, groundwater develops and the weathered rock is saturated with water; the soil strength decreases and the cohesion is lost, resulting in collapse.One died, and the direct property damage was CNY 1.9 million.
August 2021Beijing ProvinceDuring the construction of the south-to-north water diversion project, the toxic and harmful gases on site exceeded the standard, and the management personnel illegally commanded, resulting in poisoning and suffocation accidents.Two died, and the economic damage is unknown.
July 2018Hubei ProvinceDuring the construction of a water resource allocation project, the rock fracture caused by water inrush on the tunnel’s palm surface was finally induced by mud inrush.Six died, and the cost of rescue and disaster disposal was CNY 10.990 and 34.279 million.
Table 2. Comparison of common coupling models.
Coupling ModelConceptAdvantageDisadvantage
SHEL modelSHEL model analyzes the relationship between personnel and other risks to obtain the factors that affect the whole system. The components of this model include software, hardware, environment, and Liveware.This method can classify the coupling factors scientifically and focus on exploring the interaction between human factors and other risks.This method cannot analyze the coupling mechanisms of other factors and cannot quantify coupling degree.
Risk conduction coupling modelThe risk conduction coupling model holds that the small risks in the system are transferred and diffused through the carrier. Once the coupling degree of the system reaches a threshold, a risk mutation occurs.This method can systematically summarize and analyze different coupling forms between risks and qualitatively describe the nature and conduction process of coupling.This method makes it difficult to determine the degree of coupling between risk factors.
System dynamics modelThe system dynamics model is a method to explore the causal relationship between the elements in a system, which is usually used to deal with dynamic and nonlinear complex problems.This method can conduct a comprehensive and qualitative analysis of the interaction between risks and provide scientific and reasonable results for further research.This method cannot quantify the degree of interaction between factors.
N-K modelThe N-K model is a general method for solving complex network problems. This method relies on a large number of historical data and cases to analyze the risk coupling in the system.This method can calculate the degree of risk coupling by using the interaction formula through the probability of different risk combinations.This method requires a large number of sample data and high data accuracy.
Coupling degree modelThe coupling degree model believes that the coupling degree of each risk factor determines the development of the system from disorder to order, so the coupling degree is used to measure the degree of coordination.This method does not require a large number of data and samples and can simply and intuitively calculate the degree of risk coupling for analysis.This method may involve the questionnaire method, so it is subject to slight subjective influence.
Table 3. Accident report analysis.
Accident Report
Number
1
TimeMay 2022
Accident locationYunnan Province
Accident consequenceThree people were killed, and the economic loss was CNY 7.98 million.
Accident profileA water diversion project in Yunnan province suddenly had an irresistible geological disaster of mud gushing, which is extremely destructive.
Accident causeDue to the long-term rainfall, the continuous infiltration of surface water causes the surrounding rock to be soaked and softened. In addition to the permeable characteristics of basalt, when surface water enters the water-rich fracture zone or weathering sac, the tunnel surrounding the rock and support engineering is not enough to resist the high-intensity potential energy release. The result is that the groundwater, with sediment, gravel, stone, and other solid materials, bursts instantly in the weak part, forming many sudden tunnel mud-gushing geological disasters.
Risk factors1. Insufficient risk prediction;
2. Complex geological conditions;
3. Inadequate support engineering;
4. Surrounding rock influence
Table 4. The background information of experts.
Expert’s Work
Organization
Research InstituteEngineering
Design Department
Engineering
Construction
Department
Engineering
Management
Department
Proportion (%)25%12.5%50%12.5%
Years of working0–3 years3–6 years6–9 yearsMore than 10 years
Proportion (%)12.5%25%25%37.5%
Age20–30 years old30–40 years old40–50 years oldAge 50 and older
Proportion (%)12.5%25%50%12.5%
Educational statusDoctor’s degree
or above
Master’s degreeBachelor’s degreeCollege degree
or below
Proportion (%)12.5%25%37.5%25%
Professional titleEngineerSenior engineerProfessorProfessor-level
senior engineer
Proportion (%)25%37.5%25%12.5%
Table 5. Correction of the risk indicators.
Risk Indicators That Need to Be RevisedReason for RevisionRevised Result
1. Underground pipeline damage;
2. Impact of adjacent engineering and buildings
There are intersection and inclusion relations between the two, which can simplify the merger.Merge:
Impact of adjacent projects.
1. Segment transportation problem;
2. The supply of construction materials is not timely;
3. Dust impact on the construction site
These three factors have a low impact on the safety of the construction process of the tunnel, so it is suggested to delete them.Delete these three risk factors.
1. Combustible gas;
2. Toxic gas
These two risk factors have overlapping and inclusive relationships, and the latter has a large range, so it is recommended to delete the former.Delete:
Combustible gas.
1. The supporting form of the cavern is unreasonable;
2. The support project does not meet the requirements
The meanings of the two are similar, and it is suggested to integrate them into one indicator.Merge:
Inadequate support engineering.
Table 6. Risk coupling forms in safety system of shield construction of water conveyance tunnel.
Coupling TypesCoupling Forms
Dual-factor couplinghuman-management risk coupling (T12)
human-environmental risk coupling (T13)
human-equipment risk coupling (T14)
management-environmental risk coupling (T23)
management-equipment risk coupling (T24)
environmental-equipment risk coupling (T34)
Three-factor couplinghuman-management-environmental risk coupling (T123)
human-management-equipment risk coupling (T124)
human-environmental-equipment risk coupling (T134)
management-environmental-equipment risk coupling (T234)
Four-factor couplinghuman-management-environmental-equipment risk coupling (T1234)
Table 7. The connectivity analysis results.
Risk FactorHuman
Risk
Management
Risk
Environmental
Risk
Equipment
Risks
Potential Coupling Forms
A11101T124
A21100T12
A30100T12
A41101T124
A50111T1234
B11100T12
B21101T124
B31100T12
B41101T124
B51000T12
B61101T124
C10001T34
C20000/
C30000/
C40001T34
C50000/
C61000T13
D11110T1234
D21110T1234
D30010T34
D40100T24
D50100T24
D60100T24
E10111T234
E20011T34
E30010/
E40110T23
E50010/
E60111T234
Disclaimer/Publisher’s Note: The statements, opinions and data contained in all publications are solely those of the individual author(s) and contributor(s) and not of MDPI and/or the editor(s). MDPI and/or the editor(s) disclaim responsibility for any injury to people or property resulting from any ideas, methods, instructions or products referred to in the content.

