Review

Combining Differential Equations with Stochastic for Economic Growth Models in Indonesia: A Comprehensive Literature Review

by
Muhamad Deni Johansyah
1,*,
Endang Rusyaman
1,
Bob Foster
2,
Khoirunnisa Rohadatul Aisy Muslihin
1 and
Asep K. Supriatna
1
1
Department of Mathematics, Faculty of Mathematics and Natural Sciences, Universitas Padjadjaran, Jalan Raya Bandung-Sumedang, Km. 21, Jatinangor, Sumedang 45363, Jawa Barat, Indonesia
2
Faculty of Economics and Business, Universitas Informatika dan Bisnis Indonesia, Jalan Soekarno-Hatta No. 643, Bandung 40285, Jawa Barat, Indonesia
*
Author to whom correspondence should be addressed.
Mathematics 2024, 12(20), 3219; https://doi.org/10.3390/math12203219
Submission received: 5 September 2024 / Revised: 3 October 2024 / Accepted: 10 October 2024 / Published: 14 October 2024

Abstract

:
Economic growth modeling is one of the methods a government can use to formulate appropriate economic policies to improve the prosperity of its people. Differential equations and stochastic models play a major role in studying economic growth. This article aims to conduct a literature review on the use of differential equations in relation to stochastics to model economic growth. In addition, this article also discusses the use of differential and stochastic equations in economic growth models in Indonesia. This study involves searching for and selecting articles to obtain a collection of research works relevant to the application of differential and stochastic equations to economic growth models, supported by bibliometric analysis. The results of this literature review show that there is still little research discussing economic growth models using differential equations combined with stochastic models, especially those applied in Indonesia. While the application of these models remains relatively limited, their potential to offer deeper insights into the complex dynamics of economic growth is undeniable. By further developing and refining these models, we can gain a more comprehensive understanding of the factors driving growth and the potential implications of various economic policies. This will ultimately equip policy-makers with a more powerful analytical tool for making informed decisions.

1. Introduction

Economic growth is one of the most important factors determining the welfare of a country’s people. Economic growth essentially refers to the increase in the production of goods and services in a country within a certain period of time [1]. The impact of economic growth can spread to various sectors, ranging from employment and income to people’s standard of living [2]. Economic growth is influenced by several factors, including production factors in the form of labor, capital, and natural resources [1,3]. The quality of production factors, technological progress, and education can determine the level of output and productivity of a country, which ultimately determines the rate of its economic growth. The use of information and communication technology and quality education can increase business efficiency, increase productivity, and expand market reach [4,5]. Political stability and government policies also have an impact on a country’s economic growth [6].
The importance of economic growth is also reflected in its ability to increase investment. When a country experiences positive economic growth, investors tend to see better opportunities to allocate their capital in investment projects [7]. High economic growth in a country can increase a company’s revenue and profit. This allows the company to have greater internal funds to make investments [1]. However, high economic growth can have negative impacts such as increasing interest rates and increasing investment risk. High economic growth can cause inflation. To control inflation, central banks usually raise interest rates. This can make investment more expensive and reduce investor interest. Therefore, the analysis and modeling of economic growth play an important role in examining the complexity of this phenomenon and helping to formulate the right strategy.
One approach that can be used to analyze economic growth is using a differential equation model. A differential equation model is a mathematical model used to describe changes in a variable over time. In the context of economic growth, a differential equation model can be used to describe changes in a country’s output (production) over time by visualizing trends and patterns of economic growth, as well as predicting possible future scenarios [4]. This differential equation model can be used to analyze factors that influence economic growth, such as investment levels, savings rates, and population growth rates [6]. By providing an understanding of the factors that play a role in economic growth, differential equation models can help policy-makers to formulate effective policies to encourage growth and achieve national development goals [8].
In finance, stochastic models are commonly used because they incorporate uncertainty and provide a more realistic representation of economic dynamics. For example, these models are used to describe changes in asset values, with one component representing deterministic factors and the other component representing stochastic factors such as stock prices [9]. Furthermore, stochastic models can explain the diverse growth trajectories of developing countries by incorporating technological diffusion and improvements in social infrastructure, thus accounting for conditional and absolute convergence in economic growth [10].
The combined method of using differential and stochastic equations, namely stochastic differential equations, leverages the power of deterministic and probabilistic approaches to solve complex problems, especially in high-dimensional diffusion and anomalous scenarios [11]. These stochastic differential equations combine differential equations, probability theory, and stochastic processes to capture random dynamic phenomena in various domains [12]. These models are used in economics and finance to model the unpredictable behavior of continuous systems [13].
This approach incorporates randomness into financial modeling, which is essential for capturing the unpredictable nature of markets and the dynamics of stock prices and interest rates [14]. The Black–Scholes model utilizes stochastic differential equations to price options, considering market uncertainty [15]. The analytical solutions of these equations enable us to calculate the expected value and variance of option prices, which are key metrics in risk assessment. Moreover, numerical solutions offer greater flexibility in handling various types of stochastic differential equations, allowing us to achieve high accuracy and gain deeper insights into stochastic systems [16]. Therefore, the use of stochastic differential equations to model economic growth can be a novelty for further research.
In this article, we perform a systematic literature review (SLR) regarding the use of mathematical models involving differential equations in modeling economic growth problems. Furthermore, this article discusses economic growth models that combine differential and stochastic equations. This SLR is used to identify and analyze previous studies that are relevant to the topic being studied [17]. In addition, this article also employs bibliometric analysis to study research trends and help to find gaps in existing studies.
To support the objectives of this research, we compiled the following research questions (RQs):
  • What is the state of research on economic growth models using differential equations combined with stochastics?
  • What is the state of research on economic growth models in Indonesia?
  • What are the gaps in existing economic growth research?
This article is structured as follows: Section 2 presents the methods used in compiling this SLR, particularly for how to collect articles for analysis. Section 3 presents the results of the bibliometric analysis and literature review related to the topic discussed. Section 4 contains a discussion of the research results. Finally, conclusions are presented in Section 5.

2. Methods

As part of our method, we referred to the Preferred Reporting Items for Systematic Reviews and Meta-Analyses (PRISMA) [18]. PRISMA provides a standard checklist that guides authors in systematic reporting, ensuring that important aspects of the review process are not understated [19]. Then, a bibliometric analysis was carried out on the data obtained from the PRISMA process with the help of R version 4.4.0 software.

2.1. Article Collection

In this study, article data were obtained through searching international databases, namely Scopus, Science Direct, and Dimensions, using certain keywords. Searches in the Scopus and Science Direct databases were limited to the “title, abstract, and keywords” sections, while in the Dimensions database, they were applied to the “title and abstract” sections, because Dimensions cannot search through the “keywords”. Article searches were limited by year of publication, namely to articles published from 2018 to 2024. In this study, we considered articles published in open access journals.
The keywords used in the article search are presented in Table 1. The combinations of keywords presented in Table 2 were established based on the proposed topic, namely differential equations and economic growth. Combinations B, C, and D were established to obtain a more specific search for the type of differential equation used. In addition, keyword E was used to search for articles that combine differential equations and stochastic models. F represented a combination of A with “Indonesia”, and was intended to observe the development of this topic specifically in Indonesia. The results of this search are given in Table 2.

2.2. Selection Method

The selection method used in this study was divided into several stages, as shown in Figure 1. The first stage was the identification stage, containing the data search process explained in the previous sub-section. At this stage, 163 articles were obtained from three databases and using six keyword combinations. These articles were then examined during the second stage, namely the screening stage.
The screening stage consisted of two checks, the first of which was the duplication check. At this stage, the articles were checked for duplication—that is, checking whether there were articles contained in two or more databases with the same title and author. Duplication checks were carried out with the help of the Jabref reference manager. Through this check, 92 duplicate articles were identified and removed, and the other articles went to the next check, namely the title and abstract checks. At this stage, all articles were checked for their suitability to the research topic based on their titles and abstracts. From this check, 39 articles were obtained which were declared relevant to the research topic. The articles selected at this stage are hereinafter referred to as Dataset 1 and were used in the bibliometric analysis.
The next stage was the eligibility selection. At this stage, the articles in Dataset 1 were thoroughly examined by reading the full text to further evaluate the relevance of each article. From this selection process, 19 articles were obtained that met the criteria. The articles that went through this stage are referred to as Dataset 2 and were analyzed further. The results of the selection process are shown in Table 3.

2.3. Bibliometric Analysis

In this article, bibliometric analysis for Dataset 1 was first performed using the R-bibliometrix program. Bibliometrix is a bibliometric analysis package written in the R language and is open-source software [20]. The R-bibliometrix package is equipped with the “biblioshiny” command, which allows for the combination of bibliometrix’s functionalities in a web-based interface [21]. This command is used to obtain scientific data mapping and perform a comprehensive analysis of the bibliographic information available from Dataset 1.

3. Results

3.1. Results of Bibliometric Analysis

This section presents the results of the bibliometric analysis based on Dataset 1. The analysis was performed using R version 4.4.0 with bibliometrix package. Dataset 1 consists of 39 articles selected according to the title and abstract, published from 2018 to 2024 and written by 87 authors from 23 countries.

3.1.1. Co-Occurrence Network

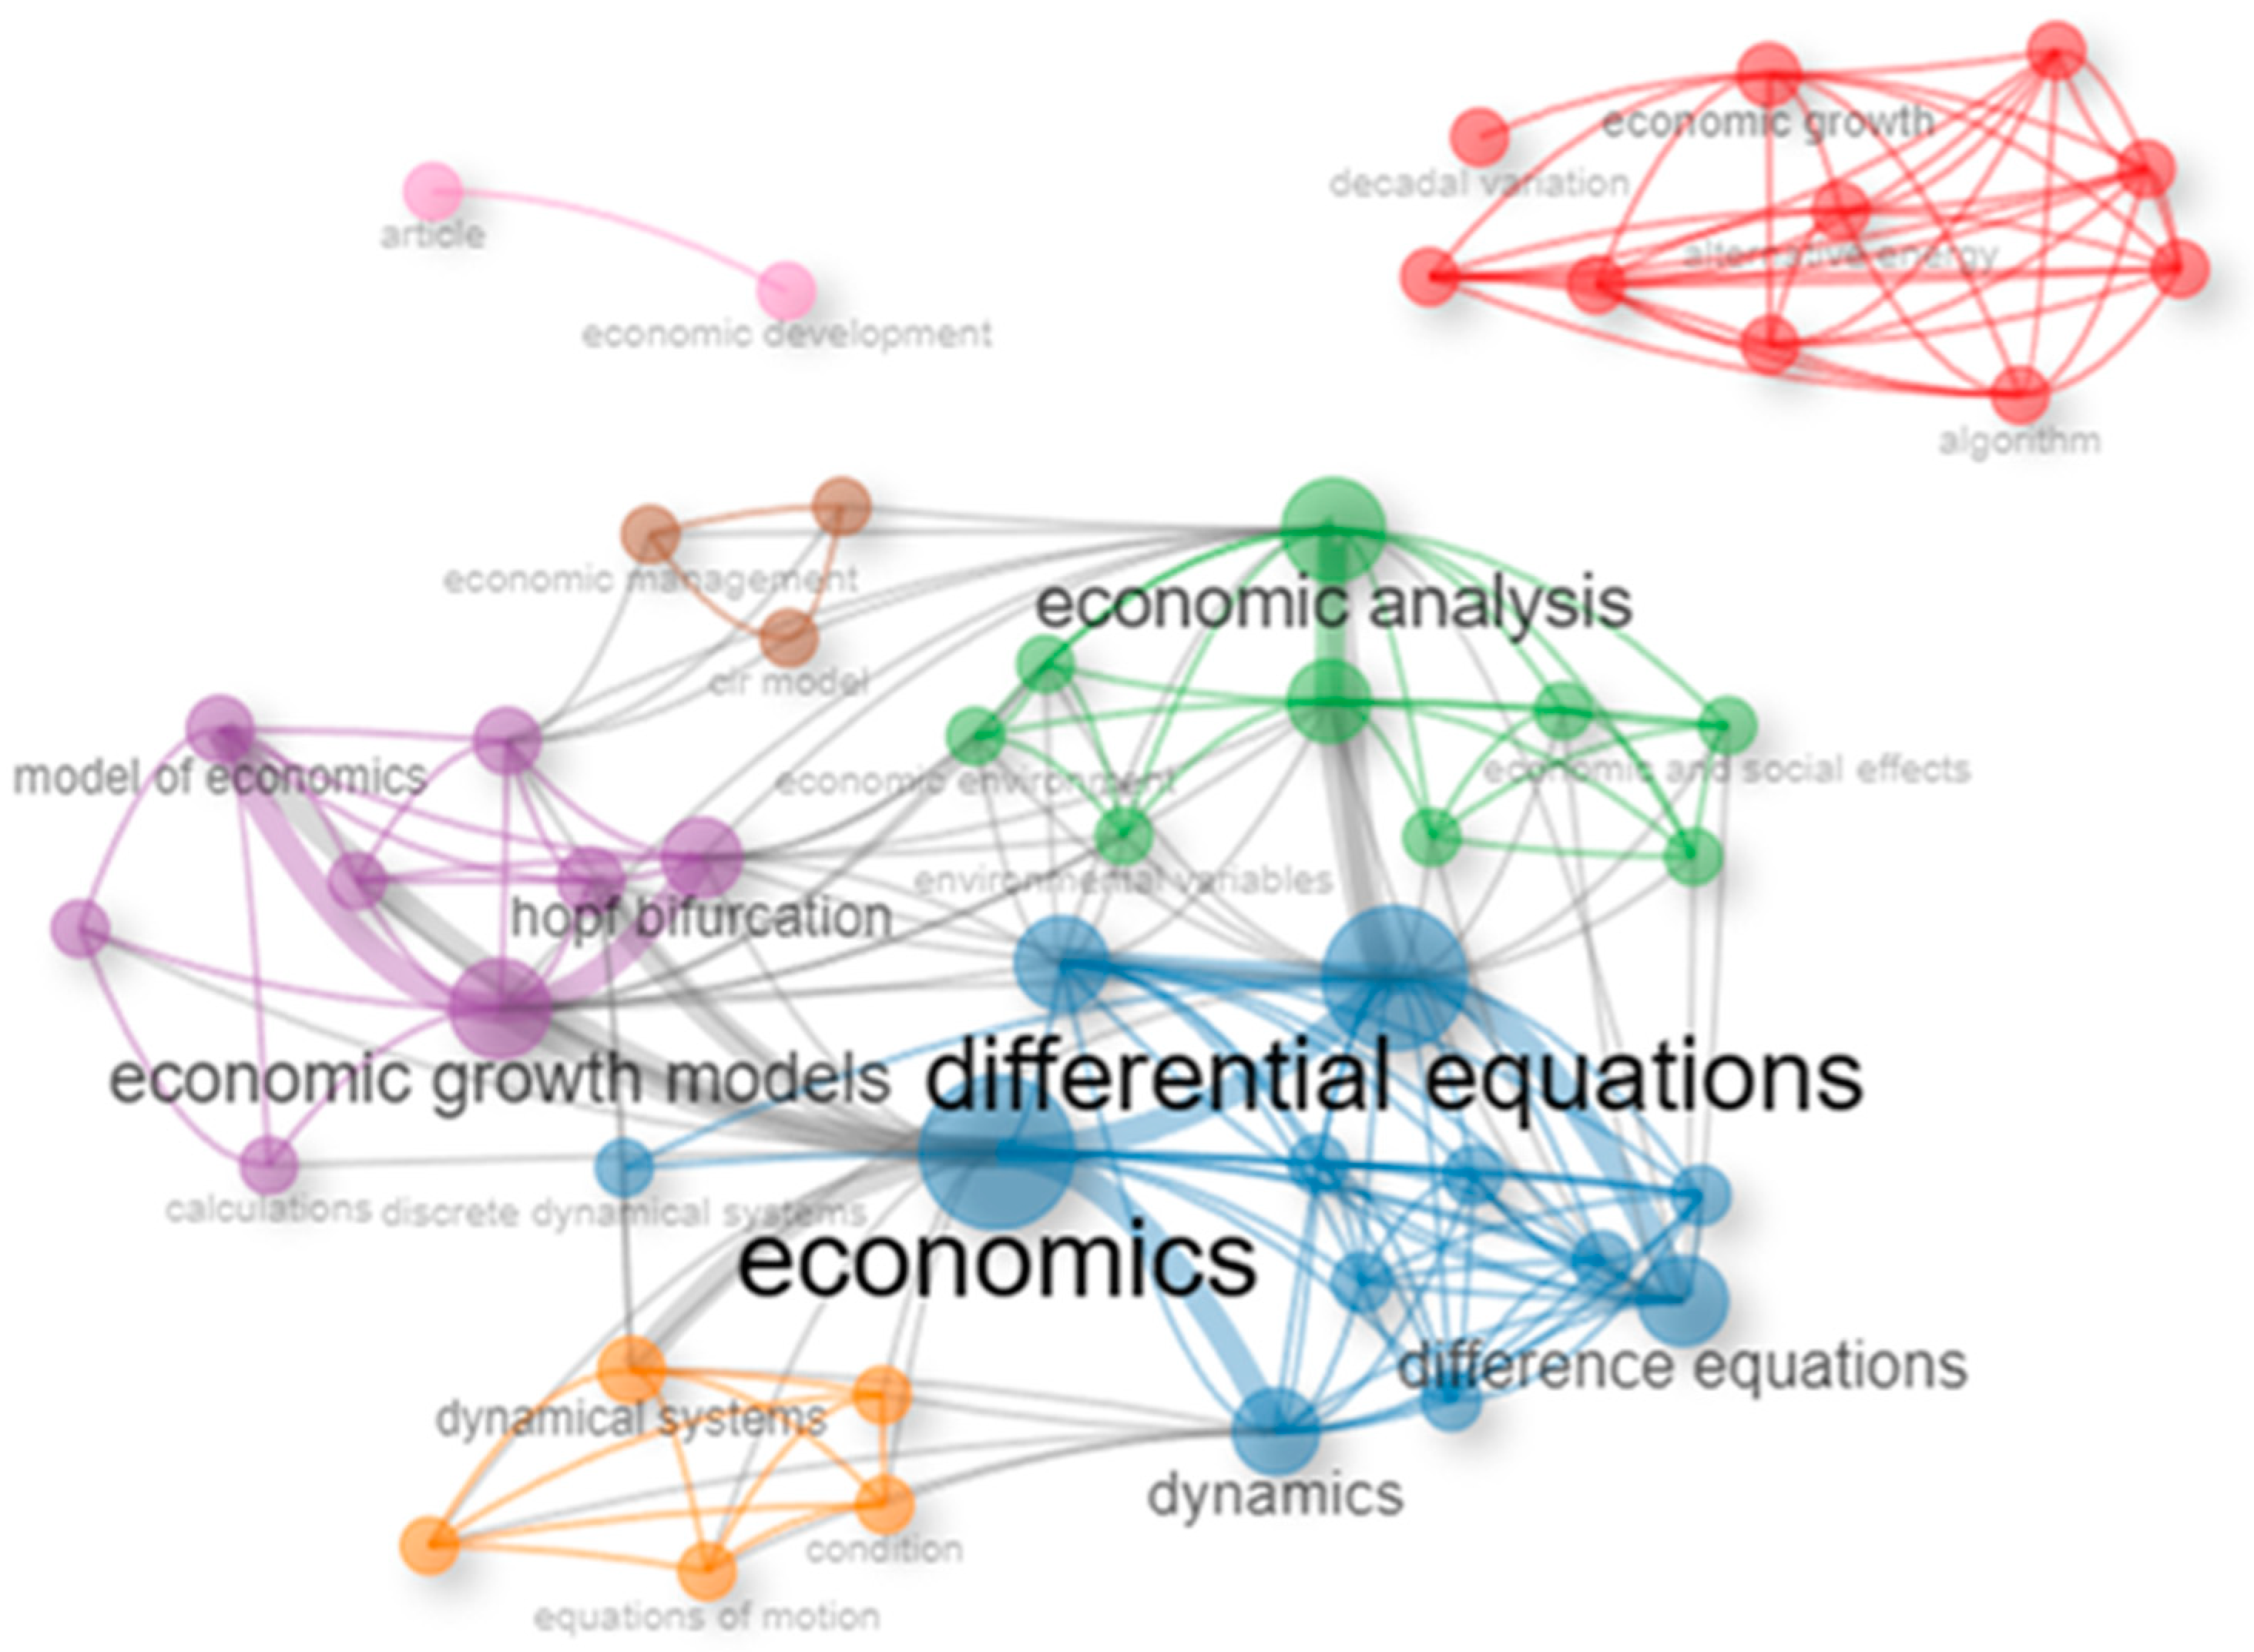
The most important result of the bibliometric analysis is the co-occurrence network. We present the co-occurrence network using Keyword Plus, representing words or phrases that frequently appear in the titles of article references and not necessarily in the article title or authors’ keywords [22]. The use of Keyword Plus allows us to cover broader terms that are not included in the authors’ keywords [23]. The co-occurrence network for Dataset 1 is given in Figure 2.
The size of the circle of each term indicates how important the term is in the context of the retrieved articles. The presence of a line connecting each term to another indicates that there is a relationship between the terms—in this case, the existence of articles discussing both terms. Based on Figure 2, “differential equations” and “economics” have the largest circles, so both are the most relevant terms in all articles in Dataset 1. In addition, the relationship between the two terms indicates that both are often studied together as a research topic. The presence of the terms “dynamical systems” and “dynamics” indicates an interest in the dynamics of economic systems, i.e., how economic variables change over time.
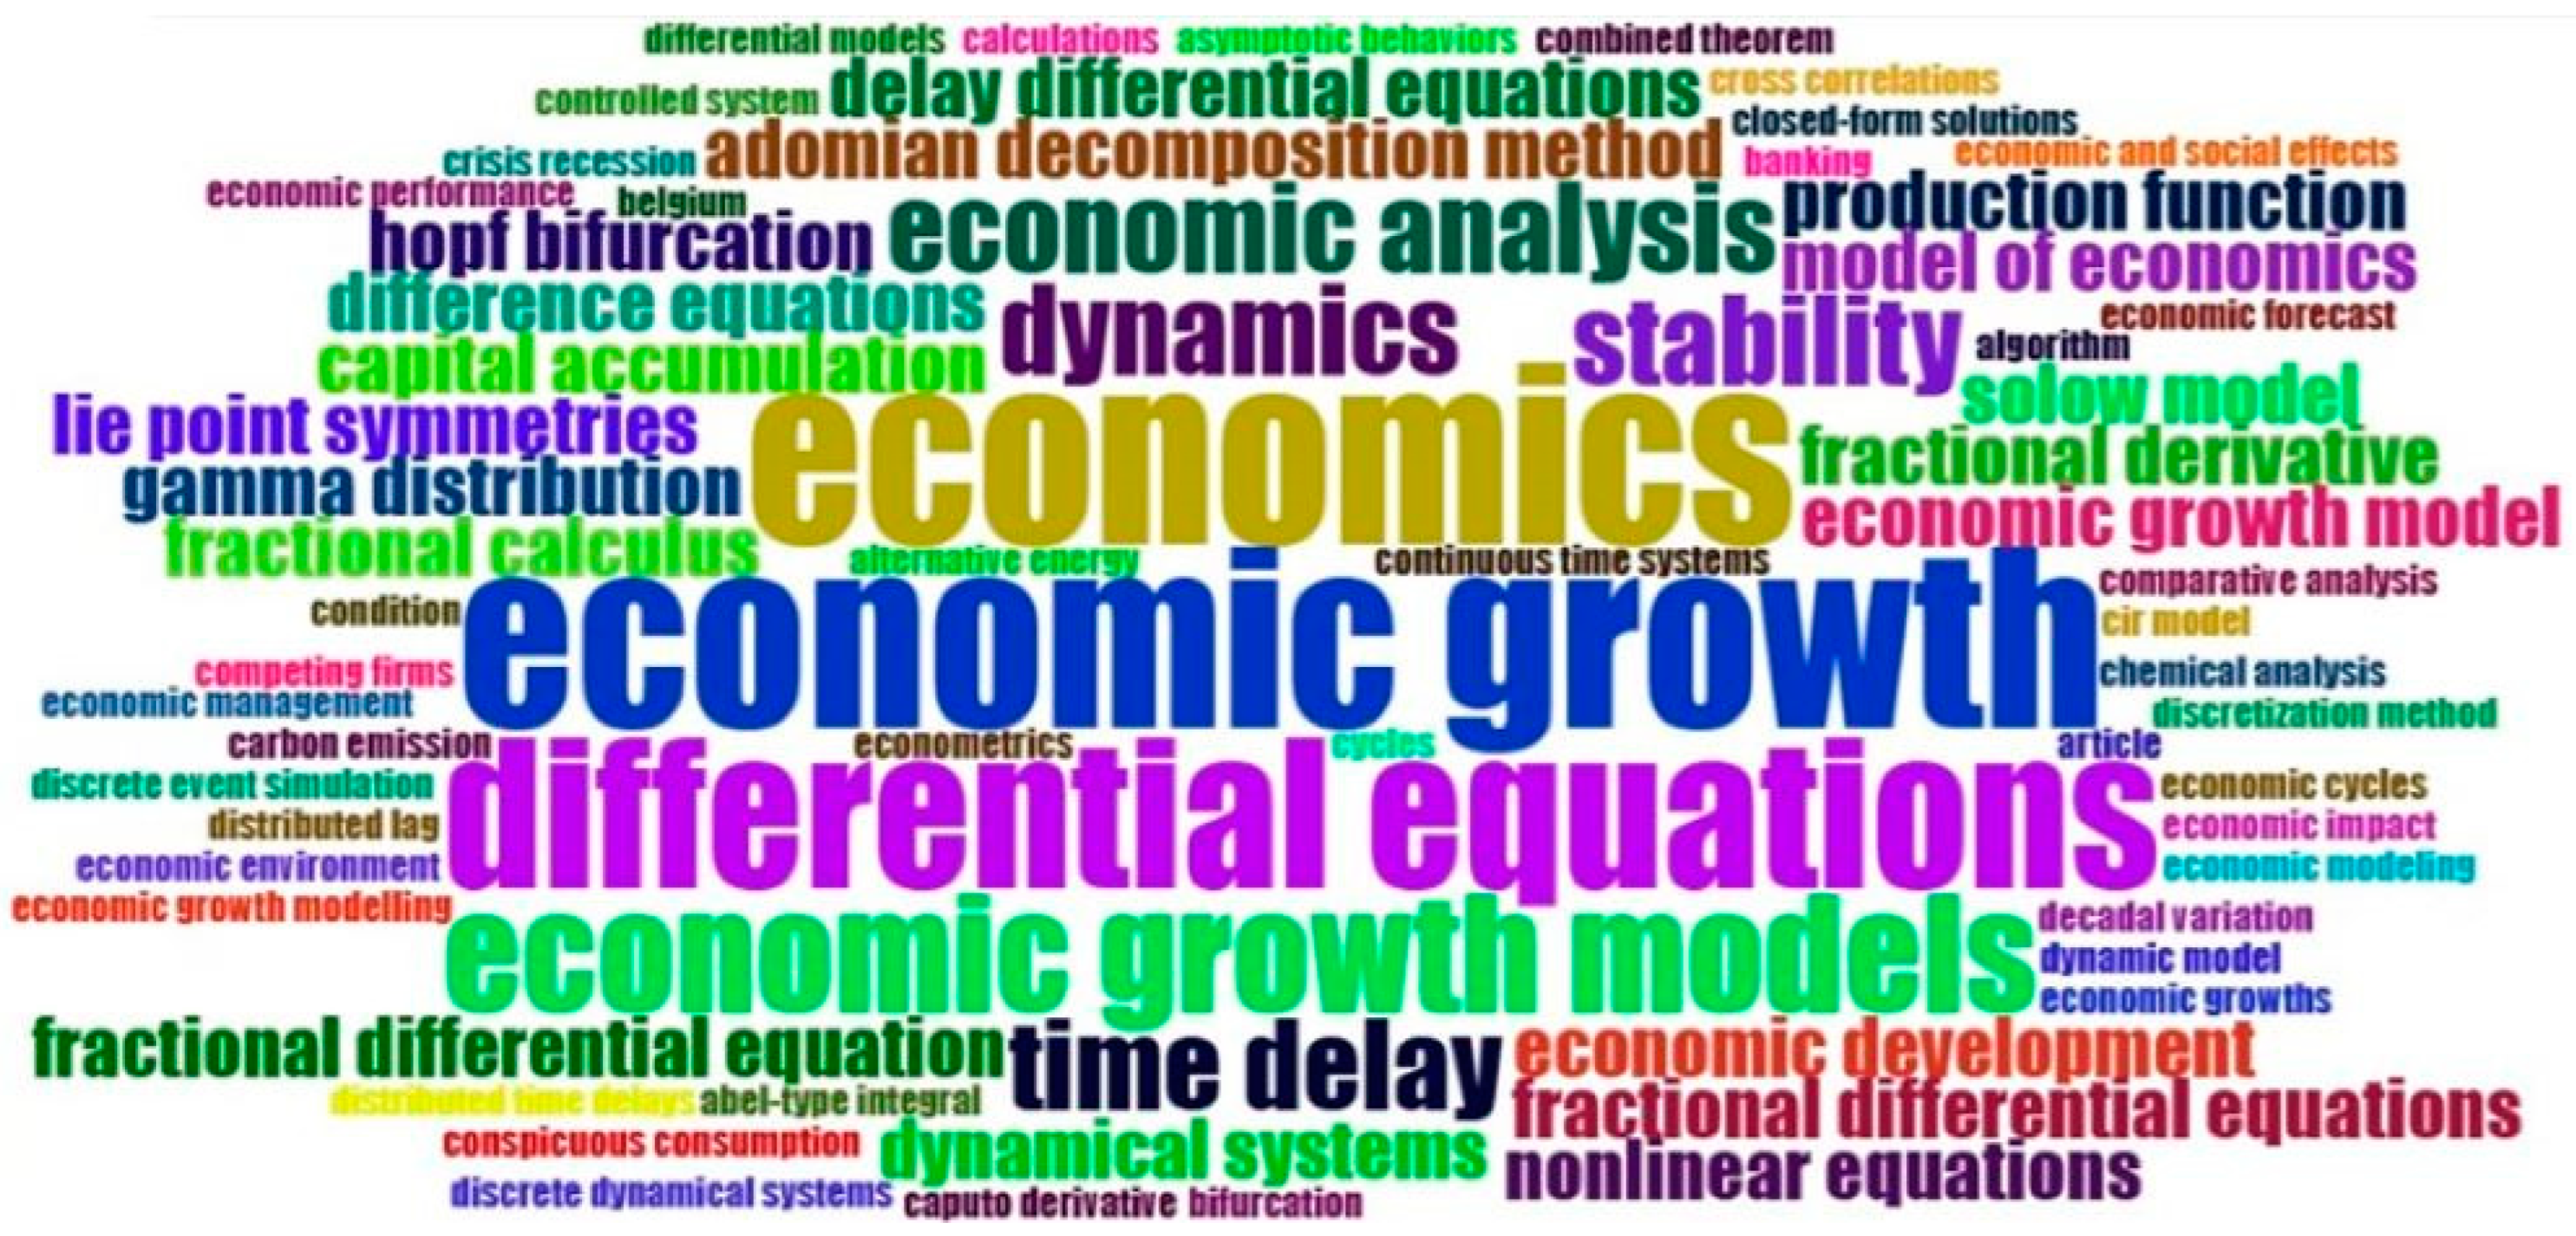
Furthermore, the terms from Figure 2 are displayed in Figure 3 via the Wordcloud feature of R-bibliometrix. This feature can be used to display keyword data in a visual form that is easy to read and understand, so that it is easier to find the most important or frequently appearing words in the articles being analyzed.
In Figure 3, we can see the terms “ordinary differential equation”, “fractional differential equation”, “fractional calculus”, and “fractional derivative”. This shows the complexity of research that examines economic growth models. However, in Figure 2 and Figure 3, the term “partial differential equation” is not found. This shows that the topic of partial differential equations in economic growth modeling has not been the focus of research. In addition, the terms “stochastic” or “stochastic differential equation” do not appear directly in Figure 2 and Figure 3. This also implies that most of the research represented by Dataset 1 focuses more on deterministic models, where the variables that affect the system are clearly defined and do not contain significant elements of chance or uncertainty.

3.1.2. Thematic Mapping

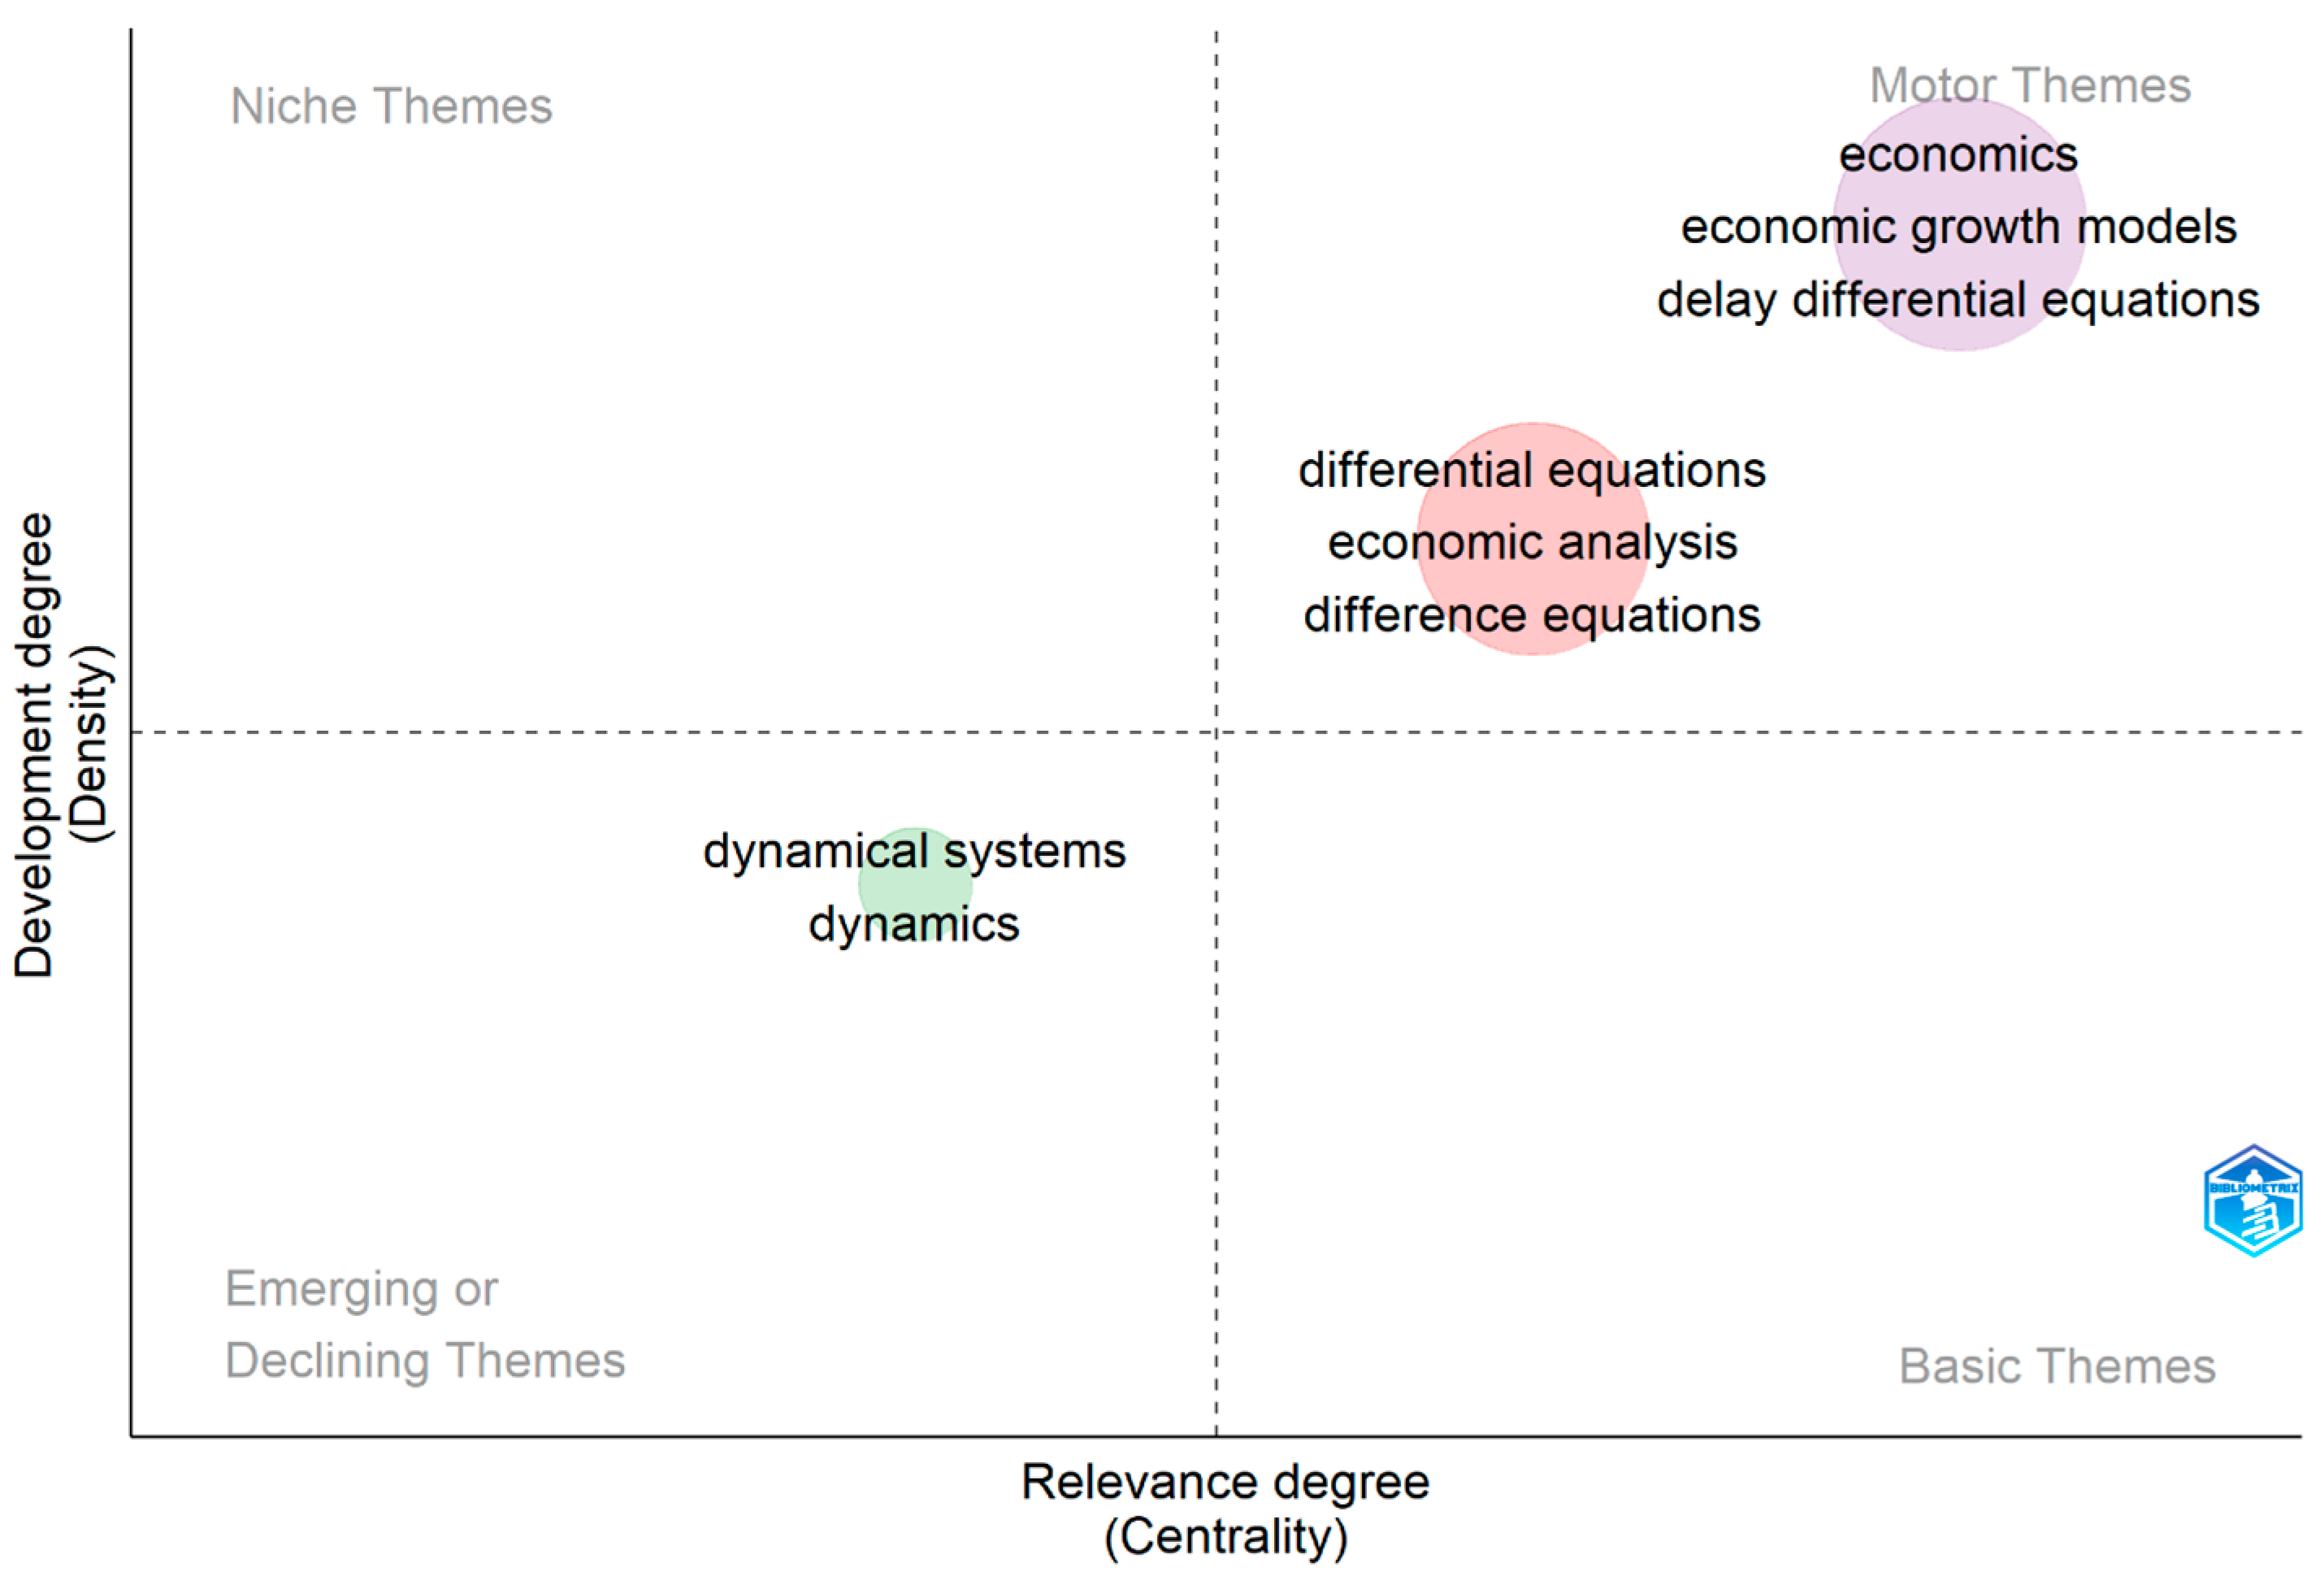
Another form of analysis that can be carried out using R-bibliometrix is thematic mapping, which groups terms based on their level of development and relevance. In this form of mapping, terms derived from bibliometric data are grouped into groups of words, each of which represents a frequently discussed theme. These groups of words are arranged into four quadrants. The first quadrant is the Motor Theme quadrant. In this quadrant, groups show high centrality and density, indicating a strong connection between terms and their relevance to other groups. The second quadrant is the Niche Theme quadrant, characterized by high density but low centrality. Groups in this quadrant have strong internal cohesion but limited connection to other groups. Furthermore, the third quadrant is the Emerging or Declining Theme quadrant. Groups in this quadrant show low density and centrality, indicating the development of new topics or topics that are declining. The fourth quadrant, Basic Theme, displays a strong connection to other groups while having weak internal cohesion.
As shown in Figure 4, Dataset 1 produces three clusters of words in thematic mapping. Cluster 1 is represented by “economics”, “economic growth models”, and “delay differential equation”, while Cluster 2 is represented by “differential equations”, “economic analysis”, and “difference equations”. Both clusters are in the Motor Themes group, where centrality and density are high. Each term included in Cluster 1 and 2 has a high affinity with other terms and with other clusters. Meanwhile, Cluster 3, represented by “dynamical systems” and “dynamics”, is in the Emerging or Declining Themes group. This means that this cluster has a tendency to have low development and relevance.

3.2. Results of the Systematic Literature Review

This section provides the results of the analysis based on the development of research on economic growth models that use differential equations. We identify the purpose of the study, the models used, and check whether the article involves a stochastic process. In addition, we also identify the applications of the model in real-life problems from the articles in Dataset 2. The results of this study are given in Table 4, Table 5 and Table 6.

4. Discussion

4.1. Development

Based on Table 4, Table 5 and Table 6, the research in Dataset 1 can be identified based on its research objectives. Several articles aim to build economic growth models, including [29,32,33,36,42]. Other articles aim to build models which are accompanied by their applications to real-life problems, including Burges et al. [39], who used nonlinear differential equations to build economic growth models which were then used to calculate the IMF’s growth rate in GDP and population. González-Parra et al. [40] built an economic growth model in Venezuela based on the Spatial Solow Model that considers smuggling. Tejado et al. [42] discussed the Keynesian model of the dynamics of the economy applied to countries in the Group of Twenty (G20). Akaev [37] implemented the RBC model to predict the dynamics of the US economy for 2018–2050. The model obtained is a nonlinear differential equation model with the form
d 2 Y d t 2 + λ + æ æ λ v 1 χ 4 3 v d Y d t 2 d Y d t λ 1 s d Y e d t + æ λ Y æ λ 1 s Y e = λ d A d t + æ λ A ,
where Y = C + I + A , C represents the level of consumption, I is the actual induced investment, and A is the total output. λ states the rate of the supply reaction, and χ is equal to 0 or 1.
Furthermore, Ming et al. [41] discussed an economic growth model for China using fractional differential equations. This model has the following variables:
  • x 1 : land area k m 2 ;
  • x 2 : cultivation area k m 2 ;
  • x 3 : population (millions of people);
  • x 4 : total capital formation (billion);
  • x 5 : exports of goods and services (billion);
  • x 6 : general government final consumer spending (billions);
  • y : GDP (billion).
The fractional calculus model is given by
y t = k = 1 7 c k D t 0 , t α k x k t ,
where t 0 and α k represent the initial year and the derived order, respectively. In addition, the Caputo derivative D t 0 , t α k x k for x k defined as
D t 0 , t α k x k ( t ) = 1 Γ 1 α k t 0 t d x k s d s ( t s ) α k d s , t > t 0 , 0 < α k < 1 .
Furthermore, Tejado et al. [42] discussed the fractional differential equation model applied to countries in the Group of Twenty (G20). Of the nine variables identified, the final model used five variables and was generalized using fractional derivatives to obtain
y t = k = 1 , 2 C k x k t + k = 3 , 4 , 5 C k D α k x k t ,
with
  • y ( t ) : GDP in 2010 in USD;
  • C k : weight, constant over time, for each input variable x k ;
  • x 1 : land area, measuring available natural resources;
  • x 2 : population, measuring available human resources;
  • x 3 : gross capital formation (GCF) in 2010 in USD, which measures the resources produced (this model takes into account the accumulation of resources produced);
  • x 4 : exports of goods and services in 2010 in USD, which measures the external impact on the economy;
  • x 5 : general government final consumption expenditure in 2010 in USD, which measures the impact of the budget on the economy.
Ming et al. [41] and Tejado et al. [42] used the average absolute deviation (MAD) and coefficient of determination R 2 to evaluate the economic growth model with the following formula:
M A D = i = 1 n y i y ^ i n ,
R 2 = 1 i = 1 n y i y ^ i 2 i = 1 n y i y ^ 2 .
Tejado et al. [42] using the Akaike Information Criterion (AIC) to select variables in the model with the following formula:
A I C = N log j = 1 N y j y ^ j 2 N + 2 K + 2 K K + 1 N K 1 ,
w i = exp A I C i m i n M A I C 2 j = 1 M exp A I C j m i n M A I C 2 .
Meanwhile, Ming et al. [41] used the Bayesian Information Criterion (BIC) for variable selection with the following formula:
B I C = log 1 n j = 1 n y j y ^ j 2 + plog n n ,
w j = exp B I C i B I C m i n 2 j = 1 p exp B I C j B I C m i n 2 .
Several articles focus their research on model analysis, such as that of Buedo-Fernández and Liz [38], who conducted an analysis of the global stability condition for a positive equilibrium of the Solow–Swan economic growth model with variable delay. This study also considers applications to several possible conditions, such as a constant saving ratio and no pollution effects, a variable saving ratio and no pollution effects, and a constant saving ratio and pollution effects. Hu [26] discussed finding non-negative classical solutions of the spatial AK growth model. Johansyah et al. [27,28] investigated the existence and uniqueness of solutions to nonlinear fractional Riccati differential equations with constant coefficients, and then found their numerical solutions using the Adomian Decomposition Method (ADM) and Kamal’s Integral Transform (KIT) as well as the Combined Theorem of Adomian Decomposition Methods and Kashuri–Fundo Transformation Methods. Moreover, Polat and Özer [30,31] presented the optimal control problem in economic growth models with differential equations used as constraint functions. Model analysis was conducted by utilizing Lie group theory. Zhang [35] explained the relationship between economic growth and inflation using the Taylor rule. Chen et al. [24] introduced a new mathematical model using the Caputo operator to analyze the dynamic interaction between supply and demand, focusing on accumulation in economic growth.
Most of the models used are nonlinear models that utilize numerical simulations. The differential equations involved are dominated by fractional PD forms, as seen in [27,28,29,30,32,33,34,36,41,42]. In addition, only two articles involve partial differential equations, namely González-Parra et al. [40] and Hu [26]. Both studies use spatial economic growth models, namely the Spatial Solow Model and the spatial AK growth model. Spatial economic growth models can be associated with partial differential equations because they often involve spatial elements that can be described using mathematical equations. Partial differential equations used in spatial economic growth models can detail how various economic variables change over time and space [43]. In addition, Buedo-Fernández and Liz [38] and Chen et al. [36] used a delay differential equation model, where there is a delay in the system’s response to changes. This means that the rate of change in a variable at a particular time can depend on its value at a previous time.
Furthermore, stochastic differential equations were used by Mariani et al. [24] and Ewald and Nolan [25]. Mariani et al. [24] discussed a numerical approach to estimate the parameters and level weights of the Ornstein–Uhlenbeck (OU) model. In this model, the Gaussian OU process is defined as the solution of the stochastic differential equation:
d X t = λ m X t d t + α d B t , t > 0 ,
where λ , m , and α are real constants and B t is the standard Brownian motion on R . Initial value X 0 is a random variable that is independent of B t t 0 .
Meanwhile, in the article by Ewald and Nolan [25], stochastic differential equations are used to model the dynamics of a system with uncertainty in optimal control problems. The optimal control model used is stochastic optimal control, which involves stochastic differential equations in the problem constraints, namely
m a x α t A E 0 T f t , X t , α t d t + g X t , s . t .   d X t = b t , X t , α t d t + σ t , X t , α t d W t ,
assuming that the state variables X t and Brownian motion W t are one-dimensional but can be adapted to the multidimensional case using vector–matrix notation. The admissible control set A is the set of progressively measurable stochastic processes that take values in the set A. In addition, the functions f , b , σ : [ 0 , T ] × R × A R and g : R R are continuously differentiable with bounded derivatives.

4.2. Economic Growth Modeling in Indonesia

As shown in Table 6, differential equations are used to model the economic growth of several locations around the world, such as the US [24], Venezuela [40], China [41], and the countries in the Group of Twenty [42]. However, differential equation models have not been used to model economic growth in Indonesia.
Articles discussing economic growth models in Indonesia mostly use stochastic models, especially time series models, including vector autoregressive (VAR) models [44,45,46,47], autoregressive distributed lag (ARDL) [48,49,50,51,52,53], error correction models (ECMs) [54,55,56,57,58], and vector error correction models (VECMs) [59,60,61,62,63]. Time series models are usually chosen because economic data include observations of variables at certain time intervals. In addition, economic variables often depend on previous values. Through time series models, this dependency can be easily expressed in the concept of autoregression and can be used to analyze the economic fluctuation cycle that occurs periodically [64,65].
Other models that are widely used are panel data models, such as the fixed effect model (FEM), common effect model (CEM), and random effect model [65,66,67,68,69,70]. Panel data models provide more accurate estimates of the effects of independent variables on economic growth [71]. In addition, panel data analysis can capture both long-term and short-term relationships between macroeconomic variables and economic development, thus providing insight into the dynamics of economic growth [72]. Panel data analysis also allows for the examination of cross-sectional and time series data, thus allowing for a more comprehensive understanding of the determinants of economic growth [73].
Several studies also use a combination of time series models with panel data models, namely the Panel Vector Error Correction Model (PVECM) [74] and Panel Vector Autoregression (PVAR) [75]. These models allow researchers to use information from both cross-sectional and time series dimensions, thereby increasing the efficiency of parameter estimation compared to traditional time series and panel data models. This framework allows the interactions of different time series behaviors to coexist, making it useful for estimating shifts in the predictability of non-stationary variables and testing the periodic validity of economic theories [76].

4.3. Research Gaps and Future Work

In addition to being used directly to model economic growth, differential equations can also be used in dynamic system modeling or control theory. The topic of dynamic systems appears in the results of the bibliometric analysis (see Figure 2 and Figure 3). Dynamic systems describe changes in variables over time. Differential equations play a role in describing these changes mathematically and predicting future system behavior. Models that have been used previously include the Solow–Swan model [38,39], the Ramsey model [34], and the Keynesian model [42]. Differential equations also play a role in control theory, such as in the research of Polat and Özer [30,31] and Ewald and Nolan [25], who present an optimal control theory model with differential equations used as constraint functions.
From the results of the bibliometric analysis in Figure 2 and Figure 3, there are no terms regarding “partial differential equation” and “stochastic differential equation”. This shows that both topics are still rarely studied in relation to economic growth. In addition, our literature review also shows that there are only two articles that use partial differential equation models and two articles that use stochastic differential equations.
Although the use of stochastic differential equations in economic growth studies is still rare, the potential of this method to offer deeper insights should not be overlooked. Incorporating uncertainty and variation in economic variables allows stochastic differential equations to present a more authentic and dynamic framework. Thus, it is imperative for future studies to further investigate the application of stochastic differential equations in economic growth modeling. This effort will not only enhance the current body of literature but also provide a more powerful analytical instrument for economic decision makers.
Furthermore, although differential equation models have been used to model economic growth in several other countries, such as the US, Venezuela, China, and the G20 countries, these models have not been used in Indonesia. This highlights the opportunity for new research to develop a model of Indonesian economic growth using differential equations. In addition, the use of stochastic models combined with differential equation models is still rare. Stochastic differential equation models can also be used to obtain more accurate and comprehensive results in modeling economic growth in Indonesia. Therefore, differential equations can also be utilized in modeling economic growth to study the effects of economic policies on economic growth in Indonesia.

5. Conclusions

This paper presents a comprehensive overview of the literature on the subject of modeling economic growth with differential equations, supplemented by bibliometric analysis. The results of this study indicate that differential equations have been used to determine models and calculate economic growth values. Current research on growth models has used differential equation models of both integer and fractional orders. The lack of research using stochastic differential equations also represents an opportunity for further study.
Several studies have discussed economic growth models and applied them to real-world problems, such as in the US, Venezuela, China, and the G20 countries. In Indonesia, the models used to calculate economic growth values are still predominantly stochastic models, such as time series and panel data models. The use of ordinary and partial differential equation models with a fractional order and combining them with stochastic models can be a novelty method in determining models and calculating economic growth values in a country. Thus, this review article has the potential to help contribute to the work of policy-makers in formulating a better economic direction with a more accurate economic growth model using a combination of differential and stochastic equations, especially for Indonesia.
Although this study offers valuable insights, it is important to acknowledge some of its limitations. The data used in this study were obtained through searches of international databases, namely Scopus, Science Direct, and Dimensions, using specific keywords. Limited access to paid journals is a challenge in obtaining comprehensive data. For more complete and in-depth results, further researchers can use more specific keywords in article searches and utilize access to a wider range of journals.

Author Contributions

Conceptualization, M.D.J.; methodology, E.R.; software, K.R.A.M.; validation, B.F. and A.K.S.; writing—original draft preparation, M.D.J.; writing—review and editing, K.R.A.M.; supervision, E.R., B.F. and A.K.S.; funding acquisition, M.D.J. All authors have read and agreed to the published version of the manuscript.

Funding

This research was funded by the Ministry of Education, Culture, Research and Technology of the Republic of Indonesia through Fundamental Research with the contract number 3953/UN6.3.1/PT.00/2024. The author also thanks the Chancellor of Universitas Padjadjaran and the Director of the Directorate Research and Community Service at Universitas Padjadjaran who provided funds for outreach. The authors of this study received the Universitas Padjadjaran Academic Leadership Grant (ALG) with the contract number 1446/UN6.3.1/PT.00/2024.

Data Availability Statement

No new data were created or analyzed in this study.

Conflicts of Interest

The authors declare no conflict of interest.

References

  1. Mankiw, N.G. Principles of Microeconomics; Cengage Learning: Boston, MA, USA, 2020. [Google Scholar]
  2. Todaro, M.P.; Smith, S.C. Economic Development; Pearson: Harlow, UK, 2020. [Google Scholar]
  3. Barro, R.; Sala-i-Martin, X. Economic Growth, 2nd ed.; The MIT Press: Cambridge, MA, UK, 2024. [Google Scholar]
  4. Acemoglu, D. Introduction to Modern Economic Growth; Princeton University Press: Princeton, NJ, USA, 2008. [Google Scholar]
  5. Romer, P.M. Advanced Macroeconomics; Worth Publishers: Belper, UK, 2018. [Google Scholar]
  6. Solow, R.M. A contribution to the theory of economic growth. Q. J. Econ. 1956, 70, 65–94. [Google Scholar] [CrossRef]
  7. Wan, X. A literature review on the relationship between foreign direct investment and economic growth. Int. Bus. Res. 2010, 3, 52. [Google Scholar] [CrossRef]
  8. Johnston, L.D. Lectures on Economic Growth. By Robert E. Lucas Jr. Cambridge, MA: Harvard University Press, 2002. pp. xi, 204. $49.95. J. Econ. Hist. 2022, 62, 915–916. [Google Scholar] [CrossRef]
  9. Yang, X.; Liu, Y.; Park, G.K. Parameter estimation of uncertain differential equation with application to financial market. Chaos Solitons Fractals 2020, 139, 110026. [Google Scholar] [CrossRef]
  10. Sng, H.Y.; Rahman, S.; Chia, W.M. Economic Growth and Transition: A Stochastic Technological Diffusion Model. J. Econ. Dev. 2009, 34, 1. [Google Scholar] [CrossRef]
  11. Craigmile, P.; Herbei, R.; Liu, G.; Schneider, G. Statistical inference for stochastic differential equations. Wiley Interdiscip. Rev. Comput. Stat. 2023, 15, e1585. [Google Scholar] [CrossRef]
  12. Breda, D.; Canci, J.K.; D’Ambrosio, R. An Invitation to Stochastic Differential Equations in Healthcare. In Quantitative Models in Life Science Business: From Value Creation to Business Processes; Springer International Publishing: Cham, Switzerland, 2022; pp. 97–110. [Google Scholar]
  13. Hagenimana, E.; Uwiliniyimana, C.; Umuraza, C. A study on7 stochastic differential equation using fractional power of operator in the semigroup theory. J. Appl. Math. Phys. 2023, 11, 1634–1655. [Google Scholar] [CrossRef]
  14. Merton, R.C. Theory of rational option pricing. Bell J. Econ. Manag. Sci. 1973, 4, 141–183. [Google Scholar] [CrossRef]
  15. Black, F.; Scholes, M. The pricing of options and corporate liabilities. J. Political Econ. 1973, 81, 637–654. [Google Scholar] [CrossRef]
  16. Kloeden, P.E.; Platen, E. Numerical Solution of Stochastic Differential Equations; Springer: Berlin/Heidelberg, Germany, 1992. [Google Scholar]
  17. Tranfield, D.; Denyer, D.; Smart, P. Towards a methodology for developing evidence-informed management knowledge by means of systematic review. Br. J. Manag. 2003, 14, 207–222. [Google Scholar] [CrossRef]
  18. Page, M.J.; Moher, D.; McKenzie, J.E. Introduction to PRISMA 2020 and implications for research synthesis methodologists. Res. Synth. Methods 2022, 13, 156–163. [Google Scholar] [CrossRef] [PubMed]
  19. Rethlefsen, M.L.; Kirtley, S.; Waffenschmidt, S.; Ayala, A.P.; Moher, D.; Page, M.J.; Koffel, J.B. PRISMA-S: An extension to the PRISMA statement for reporting literature searches in systematic reviews. Syst. Rev. 2021, 10, 39. [Google Scholar] [CrossRef] [PubMed]
  20. Derviş, H. Bibliometric analysis using bibliometrix an R package. J. Scientometr. Res. 2019, 8, 156–160. [Google Scholar] [CrossRef]
  21. Rusliana, N.; Komaludin, A.; Firmansyah, M.F. A scientometric analysis of urban economic development: R bibliometrix biblioshiny application. J. Ekon. Pembang. 2022, 11, 80–94. [Google Scholar] [CrossRef]
  22. Garfield, E.; Sher, I.H. Brief Communication Keywords PlusAlgorithmic Derivative Indexing. J. Am. Soc. Inf. Sci. 1993, 44, 298. [Google Scholar] [CrossRef]
  23. Zhang, J.; Yu, Q.; Zheng, F.; Long, C.; Lu, Z.; Duan, Z. Comparing keywords plus of WOS and author keywords: A case study of patient adherence research. J. Assoc. Inf. Sci. Technol. 2016, 67, 967–972. [Google Scholar] [CrossRef]
  24. Mariani, M.C.; Asante, P.K.; Tweneboah, O.K.; Kubin, W. A 3-component superposed Ornstein-Uhlenbeck model applied to financial stock markets. Res. Math. 2022, 9, 2024339. [Google Scholar] [CrossRef]
  25. Ewald, C.O.; Nolan, C. On the adaptation of the Lagrange formalism to continuous time stochastic optimal control: A Lagrange-Chow redux. J. Econ. Dyn. Control 2024, 162, 104855. [Google Scholar] [CrossRef]
  26. Hu, H. Asymptotic Behaviors Analysis of the Spatial AK Model with Trade Costs. Theor. Econ. Lett. 2021, 11, 603–614. [Google Scholar] [CrossRef]
  27. Johansyah, M.D.; Supriatna, A.K.; Rusyaman, E.; Saputra, J. Solving the economic growth acceleration model with memory effects: An application of combined theorem of Adomian decomposition methods and Kashuri–Fundo transformation methods. Symmetry 2022, 14, 192. [Google Scholar] [CrossRef]
  28. Johansyah, M.D.; Supriatna, A.K.; Rusyaman, E.; Saputra, J. The Existence and Uniqueness of Riccati Fractional Differential Equation Solution and Its Approximation Applied to an Economic Growth Model. Mathematics 2022, 10, 3029. [Google Scholar] [CrossRef]
  29. Khan, N.A.; Razzaq, O.A.; Riaz, F.; Ahmadian, A.; Senu, N. Dynamics of fractional order nonlinear system: A realistic perception with neutrosophic fuzzy number and Allee effect. J. Adv. Res. 2021, 32, 109–118. [Google Scholar] [CrossRef] [PubMed]
  30. Polat, G.G.; Özer, T. On group analysis of optimal control problems in economic growth models. Discret. Contin. Dyn. Syst.-Ser. S 2020, 13, 2853–2876. [Google Scholar]
  31. Polat, G.; Özer, T. On Ramsey Dynamical Model and Closed-Form Solutions. J. Nonlinear Math. Phys. 2021, 28, 209–218. [Google Scholar] [CrossRef]
  32. Tarasov, V.E.; Tarasova, V.V. Dynamic Keynesian model of economic growth with memory and lag. Mathematics 2019, 7, 178. [Google Scholar] [CrossRef]
  33. Tarasov, V.E. Non-linear macroeconomic models of growth with memory. Mathematics 2020, 8, 2078. [Google Scholar] [CrossRef]
  34. Traore, A.; Sene, N. Model of economic growth in the context of fractional derivative. Alex. Eng. J. 2020, 59, 4843–4850. [Google Scholar] [CrossRef]
  35. Zhang, W.B. Banking and Money in an Extended Solow-Uzawa’s Neoclassical Growth Model. Stud. Bus. Econ. 2021, 16, 221–243. [Google Scholar] [CrossRef]
  36. Chen, Q.; Kumar, P.; Baskonus, H.M. Modeling and analysis of demand-supply dynamics with a collectability factor using delay differential equations in economic growth via the Caputo operator. AIMS Math. 2024, 9, 7471–7491. [Google Scholar] [CrossRef]
  37. Akaev, A. Nonlinear differential equation of macroeconomic dynamics for long-term forecasting of economic development. Appl. Math. 2018, 9, 512–535. [Google Scholar] [CrossRef]
  38. Buedo-Fernández, S.; Liz, E. On the stability properties of a delay differential neoclassical model of economic growth. Electron. J. Qual. Theory Differ. Equ. 2018, 2018, 1–14. [Google Scholar] [CrossRef]
  39. Burgess, M.G.; Langendorf, R.E.; Moyer, J.D.; Dancer, A.; Hughes, B.B.; Tilman, D. Multidecadal dynamics project slow 21st-century economic growth and income convergence. Commun. Earth Environ. 2023, 4, 220. [Google Scholar] [CrossRef]
  40. González-Parra, G.; Chen-Charpentier, B.; Arenas, A.J.; Díaz-Rodríguez, M. Mathematical modeling of physical capital diffusion using a spatial solow model: Application to smuggling in Venezuela. Economies 2022, 10, 164. [Google Scholar] [CrossRef]
  41. Ming, H.; Wang, J.; Fečkan, M. The application of fractional calculus in Chinese economic growth models. Mathematics 2019, 7, 665. [Google Scholar] [CrossRef]
  42. Tejado, I.; Pérez, E.; Valério, D. Fractional derivatives for economic growth modelling of the group of twenty: Application to prediction. Mathematics 2020, 8, 50. [Google Scholar] [CrossRef]
  43. Combes, P.P.; Mayer, T.; Thisse, J.F.E.G. The integration of Regions and Nations. Econ. Geogr. 2010, 10, 255–275. [Google Scholar]
  44. Annannab, H.; Surajo, A.Z.; Ahmad, F. Coal consumption and economic growth in Indonesia: An analysis of restricted structural var. Econ. Bus. Account. Soc. Rev. 2022, 1, 96–103. [Google Scholar]
  45. Alim, M.B. Impact of Taxes and Technological Improvement for Economic Growth: English. Tamansiswa Account. J. Int. 2022, 4, 72–77. [Google Scholar] [CrossRef]
  46. Chandra, K.; Sari, W.R.; Sriwulan, D.Y.; Adhimukti, M.R. Effect of Yield Spreads (State Bonds) on Economic Growth Performance in Indonesia. J. Risk Financ. Manag. 2023, 16, 175. [Google Scholar] [CrossRef]
  47. Harnani, S.; Widarni, E.L.; Bawono, S. The The Role of Human Capital in Natural Sustainability and Economic Growth in Indonesia a Dynamic ARDL Approach: English. Tamansiswa Account. J. Int. 2022, 5, 28–35. [Google Scholar] [CrossRef]
  48. Abdillah, K. Optimum government size and economic growth in Indonesia: ARDL model approach. Ekuilibrium J. Ilm. Bid. Ilmu Ekon. 2023, 18, 37–47. [Google Scholar] [CrossRef]
  49. Ajnura, U.; Juliansyah, H. The Effect of Fluctuation World Oil Prices and the Rupiah Exchange Rate on Economic Growth in Indonesia. J. Malikussaleh Public Econ. 2021, 4, 38–44. [Google Scholar] [CrossRef]
  50. Pertiwi, A.B.; Juwita, A.H.; Suryanto, S. Effects of Poverty, Income Inequality and Economic Growth to Environmental Quality Index (EQI) in 33 Province in Indonesia 2014–2019. Ekuilibrium J. Ilm. Bid. Ilmu Ekon. 2021, 16, 154–163. [Google Scholar] [CrossRef]
  51. Elfaki, K.E.; Handoyo, R.D.; Ibrahim, K.H. The impact of industrialization, trade openness, financial development, and energy consumption on economic growth in Indonesia. Economies 2021, 9, 174. [Google Scholar] [CrossRef]
  52. Rhamadhani, R.F.; Fanani, A. Optimizing the Role of Indonesia’s Islamic Financial Industry: Empirical Analysis of Its Impact on Economic Growth. JEKSYAH Islam. Econ. J. 2023, 3, 11–22. [Google Scholar] [CrossRef]
  53. Elfaki, K.E.; Heriqbaldi, U. Analyzing the Moderating Role of Industrialization on the Environmental Kuznets Curve (EKC) in Indonesia: What Are the Contributions of Financial Development, Energy Consumption, and Economic Growth? Sustainability 2023, 15, 4270. [Google Scholar] [CrossRef]
  54. Djulius, H. Foreign Direct Investment or External Debt and Domestic Saving: Which has Greater Impacts on Growth. Etikonomi 2018, 17, 37–44. [Google Scholar] [CrossRef]
  55. Duja, B.; Supriyanto, H. The influence of GDP, interest rate, wage, inflation and exchange rate on residential property price in Indonesia. Plan. Malays. 2019, 17, 389–400. [Google Scholar] [CrossRef]
  56. Fadli, F.; Hongbing, O.; Liu, Y. Earmarking Tax for Indonesia’s Economic Growth through the Education and Health Sector in the Long and Short Term Period. Bus. Econ. Res. 2020, 10, 1–39. [Google Scholar] [CrossRef]
  57. Fitriami, R.; Masbar, R.; Miksalmina, M. The Impact of Foreign Trade Policy on Economic Growth of Aceh Province, Indonesia. Int. J. Financ. Econ. Bus. 2020, 1, 109–117. [Google Scholar] [CrossRef]
  58. Prabowo, B.H.; Drean, B. Green Finance and Green Economic Trade Off Economic and Environtment in Indonesia: English. ASIAN Econ. Bus. Dev. 2022, 4, 7–13. [Google Scholar] [CrossRef]
  59. Adzimatinur, F.; Gloriman Manalu, V. The Effect of islamic financial inclusion on economic growth: A case study of islamic banking in indonesia. Bp. Int. Res. Crit. Inst.-J. 2021, 4, 976–985. [Google Scholar] [CrossRef]
  60. Agusalim, L.; Pohan, F.S. Trade openness effect on income inequality: Empirical evidence from Indonesia. Signifikan 2018, 7, 1–14. [Google Scholar] [CrossRef]
  61. Anggoro, A.C.P. Effect of Exports, Imports of Oil and Gas Products, Inflation, on Economic Growth. Curr. Adv. Res. Sharia Financ. Econ. Worldw. 2022, 2, 148–163. [Google Scholar] [CrossRef]
  62. Bashir, A.; Thamrin, K.M.; Farhan, M.; Atiyatna, D.P. The causality between human capital, energy consumption, CO2 emissions, and economic growth: Empirical evidence from Indonesia. Int. J. Energy Econ. Policy 2019, 9, 98–104. [Google Scholar]
  63. Firdaus, E.N.; Septiani, Y. Effect analysis of inflation, exports and imports on economic growth in Indonesia. J. Humanit. Soc. Sci. Bus. 2022, 2, 32–46. [Google Scholar] [CrossRef]
  64. Rao, T.S.; Rao, S.S.; Rao, C.R. (Eds.) Time Series Analysis: Methods and Applications; Elsevier: Amsterdam, The Netherlands, 2012; Volume 30. [Google Scholar]
  65. Mills, T.C. Time Series Econometrics: A Concise Introduction; Springer: Berlin/Heidelberg, Germany, 2015. [Google Scholar]
  66. Afandi, M.A.; Amin, M. Islamic bank financing and its effects on economic growth: A cross province analysis. Signifikan J. Ilmu Ekon. 2019, 8, 243–250. [Google Scholar] [CrossRef]
  67. Asmarani, T.E.; Ningsih, E.A. Domestic credit and stock market impact on economic growth: A new evidence in Five asean countries. Winners 2022, 23, 95–102. [Google Scholar] [CrossRef]
  68. Azizurrohman, M.; Hartarto, R.B.; Lin, Y.M.; Nahar, F.H. The Role of Foreign Tourists in Economic Growth: Evidence from Indonesia. J. Ekon. Studi Pembang. 2021, 22, 313–322. [Google Scholar] [CrossRef]
  69. Gati, S.A. The Effect of Telecommunications Infrastructure on Inclusive Economic Growth in Indonesia 2011−2021. Int. J. Innov. Technol. Soc. Sci. 2023, 2, 1–12. [Google Scholar]
  70. Asnawi, A.; Irfan, I.; Ramadhani, M.F.C. The Gap in Economic Growth from Foreign Investment and Domestic Investment across Provinces in Indonesia. Electron. J. Educ. Soc. Econ. Technol. 2020, 1, 34–38. [Google Scholar] [CrossRef]
  71. Bechtel, G.G. Panel regression of arbitrarily distributed responses. J. Data Sci. 2009, 7, 255–266. [Google Scholar] [CrossRef]
  72. Gonzales, J.T. Implications of AI innovation on economic growth: A panel data study. J. Econ. Struct. 2023, 12, 13. [Google Scholar] [CrossRef]
  73. Al Shams, T.M.; Ashraf, A. Macroeconomic Indicators of Economic Growth using Panel Data: A Study from South Asian Countries. ABC Res. Alert 2023, 11, 9–20. [Google Scholar] [CrossRef]
  74. Amaluddin, A. THE The Nexus Between Poverty, Education and Economic Growth in Indonesia. Econ. Dev. Anal. J. 2019, 8, 345–354. [Google Scholar] [CrossRef]
  75. Erlando, A.; Riyanto, F.D.; Masakazu, S. Financial inclusion, economic growth, and poverty alleviation: Evidence from eastern Indonesia. Heliyon 2020, 6, e05235. [Google Scholar] [CrossRef]
  76. Gao, J.; Peng, B.; Yan, Y. Time-Varying Vector Error-Correction Models: Estimation and Inference. arXiv 2023, arXiv:2305.17829. [Google Scholar] [CrossRef]
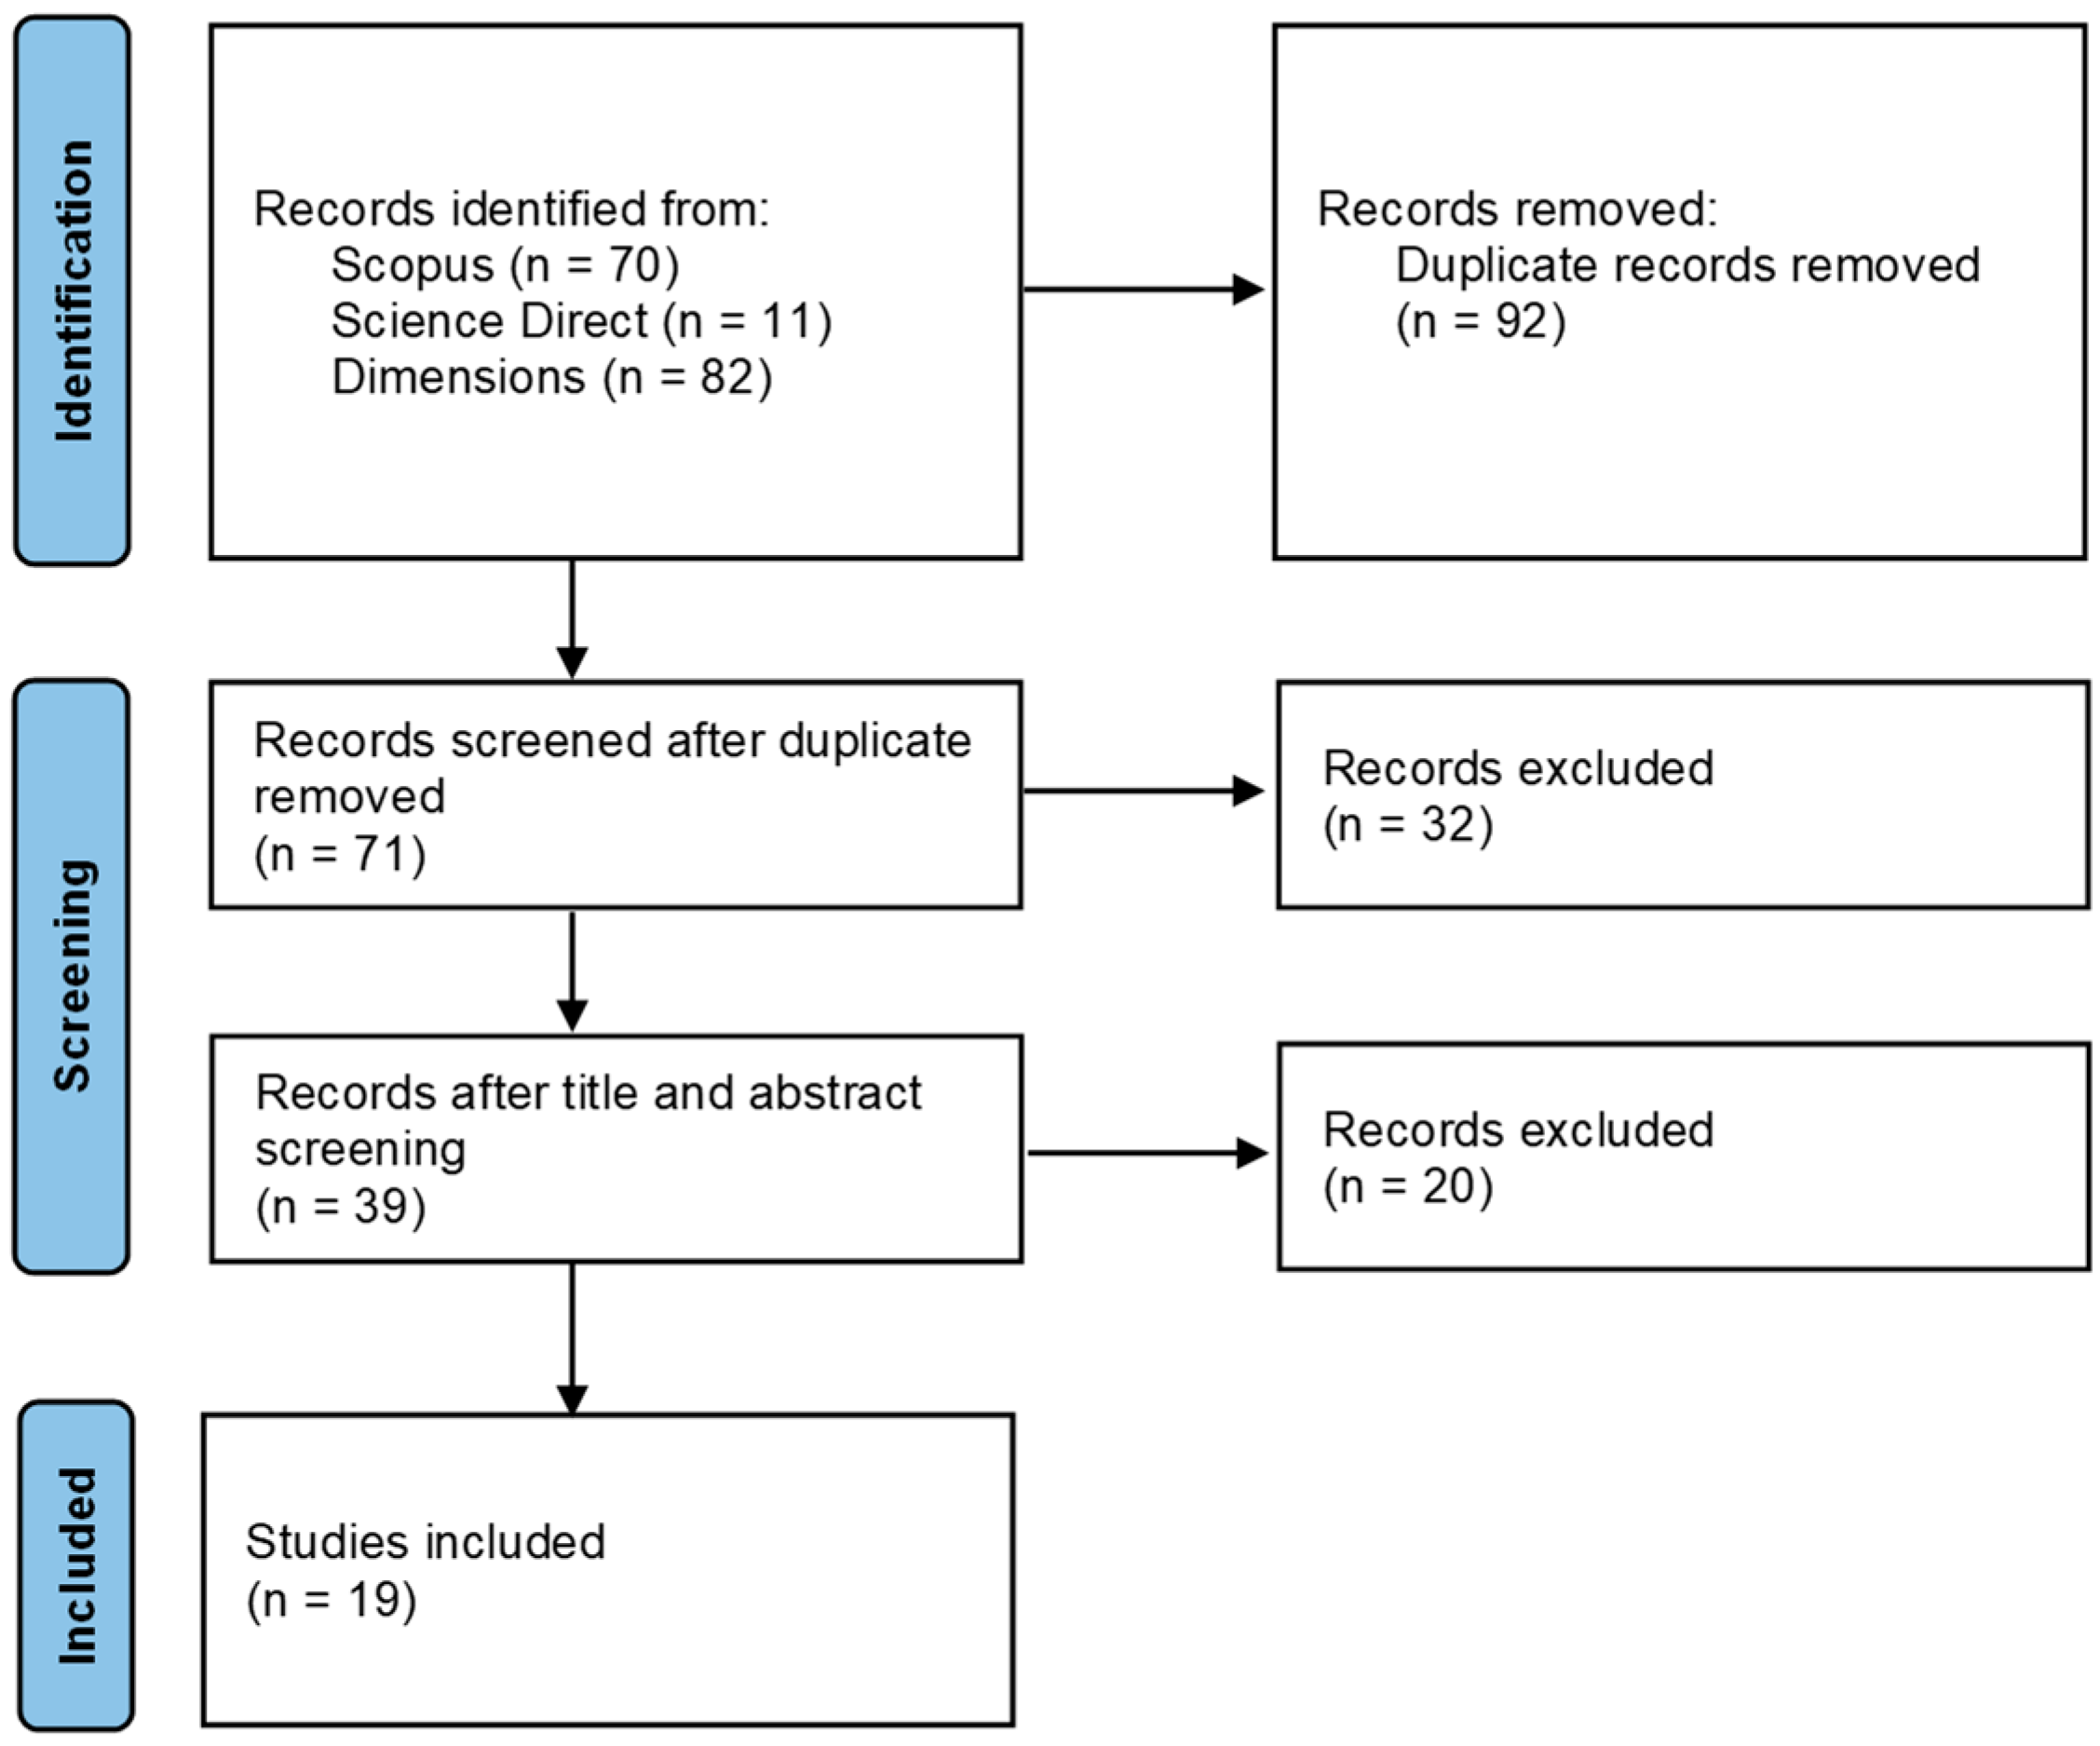
Figure 1. Data selection process diagram.
Mathematics 12 03219 g001
Figure 2. Co-occurrence network of Dataset 1.
Mathematics 12 03219 g002
Figure 3. Wordcloud of Dataset 1.
Mathematics 12 03219 g003
Figure 4. Thematic mapping of Dataset 1.
Mathematics 12 03219 g004
Table 1. Keyword combinations in article searches.
CodeKeyword Combination
A“differential equation” AND “economic growth”
B“ordinary differential equation” AND “economic growth”
C“partial differential equation” AND “economic growth”
D(“fractional differential” OR “fractional calculus”) AND “economic growth”
E“differential equation” AND “stochastic” AND “economic growth”
F“differential equation” AND “economic growth” AND “Indonesia”
Table 2. Number of publications with six keyword combinations.
CodeScopusScience DirectDimensionsTotal
A4245298
B61714
C71917
D1341330
E2114
F0000
Total701182163
Table 3. Results of the article selection process.
CodeTotalDuplicationAbstract and TitleFull Text
ExcludedIncludedExcludedIncludedExcludedIncluded
A9861371720119
B141131220
C172157844
D3017137624
E4130312
F0000000
Total16392713239 12019 2
1 Dataset 1 used for bibliometric analysis; 2 Dataset 2 used for literature review.
Table 4. Objectives and relevant topics of the articles in Dataset 2 that involve a stochastic process but do not include applications.
Author(s)Research ObjectivesModel
[24]Developing a complete numerical approach to estimate parameters and level weights for the OU Superposed modelSuperposed Ornstein–Uhlenbeck model
[25]Extending the classical Lagrangian approach to solving continuous-time stochastic optimal control problemsContinuous stochastic optimal control model
Table 5. Objectives and relevant topics of the articles in Dataset 2 that do not involve a stochastic process and do not include applications.
Author(s)Research ObjectivesModel
[26]Finding non-negative classical solutions of partial differential equations describing the dynamics of the capital stock.Spatial AK growth model
[27]Developing quadratic nonlinear cost functions in economic growth models and analyzing appropriate solutions.Riccati fractional differential equation
[28]Investigating nonlinear RFDE solutions with constant coefficients in economic growth models.Riccati fractional differential equation
[29]Measuring the dynamics of uncertainty in an economy by restructuring the Cobb–Douglas paradigm of the Solow–Swan model.Cobb–Douglas paradigm of the Solow–Swan model
[30]Building a Lie group-based approach to analyze optimal control problems in economic growth models.Nonlinear fractional order single-valued triangular neutrosophic fuzzy differential equations
[31]Analyzing the Ramsey dynamic model with a Hamiltonian optimal control problem in neoclassical growth models by utilizing Lie group theory.Ramsey dynamical model with Hamiltonian
[32]Building a mathematical model of economic growth influenced by memory and lag.Fractional differential equation of a Keynesian model with memory and lag
[33]Studying the influence of memory effects on economic growth rates.Solow model of long-run growth with memory and Solow–Lucas model of a closed economy with memory
[34]Revisiting the Ramsey economic model with fractional order.Ramsey model represented by the fractional Caputo–Liouville derivative
[35]Studying the relationship between growth and inflation using Taylor’s rule.Solow–Tobin Model with Taylor rule
[36]Investigating the dynamic interaction between supply and demand, with a focus on aggregation, through the introduction of a new mathematical model using the Caputo operator.Demand–Supply Dynamic with a collectability factor using delay differential equations
Table 6. Objectives and relevant topics of the articles in Dataset 2 with their applications.
Author(s)Research ObjectivesModelApplication
[37]Construct a general differential equation that describes long-run economic growth in terms of cyclical and trend components.Continuous RBC (real business cycles) model based on the nonlinear acceleration of induced investment modelPredictions of the dynamics of the United States economy.
[38]Establish sharp global stability conditions to achieve positive equilibrium of the well-known economic growth model when production function delays are considered.Solow–Swan model with variable delayConstant saving ratio and no pollution effect; variable saving ratio and no pollution effect; constant saving ratio and pollution effect.
[39]Describe a multidecadal pattern of per capita gross domestic product (GDP) growth that increases and then decreases as a region becomes richer.Nonlinear differential equation model (DEM)Calculate the IMF’s projected GDP and population growth rates, and calculate the projected GDP per capita growth rate.
[40]Build an approach model for the diffusion of physical capital across national borders that explains the impact of smuggling on the economic growth of Venezuela or other countries facing similar conditions.Spatial Solow ModelEconomic growth of Venezuela.
[41]Apply Caputo derivatives to simulate China’s gross domestic product (GDP) growth.Integer Order Model (IOM) and Caputo Fractional Order Model (CFOM)Forecasting China’s GDP.
[42]Build an economic model for the Group of Twenty (G20) countries in the period of 1970–2018.Keynesian models of the dynamics of economiesEconomic growth model for the Group of Twenty (G20) countries.
Disclaimer/Publisher’s Note: The statements, opinions and data contained in all publications are solely those of the individual author(s) and contributor(s) and not of MDPI and/or the editor(s). MDPI and/or the editor(s) disclaim responsibility for any injury to people or property resulting from any ideas, methods, instructions or products referred to in the content.