
Generalized Weighted Mahalanobis Distance Improved VIKOR Model for Rockburst Classification Evaluation


Abstract
1. Introduction
2. Materials and Methods
2.1. Weighting Calculation Method
2.1.1. Subjective Weights Method
2.1.2. Objective Weights Method
2.1.3. Game Theory to Determine Combination Weights
2.2. Improved VIKOR Method
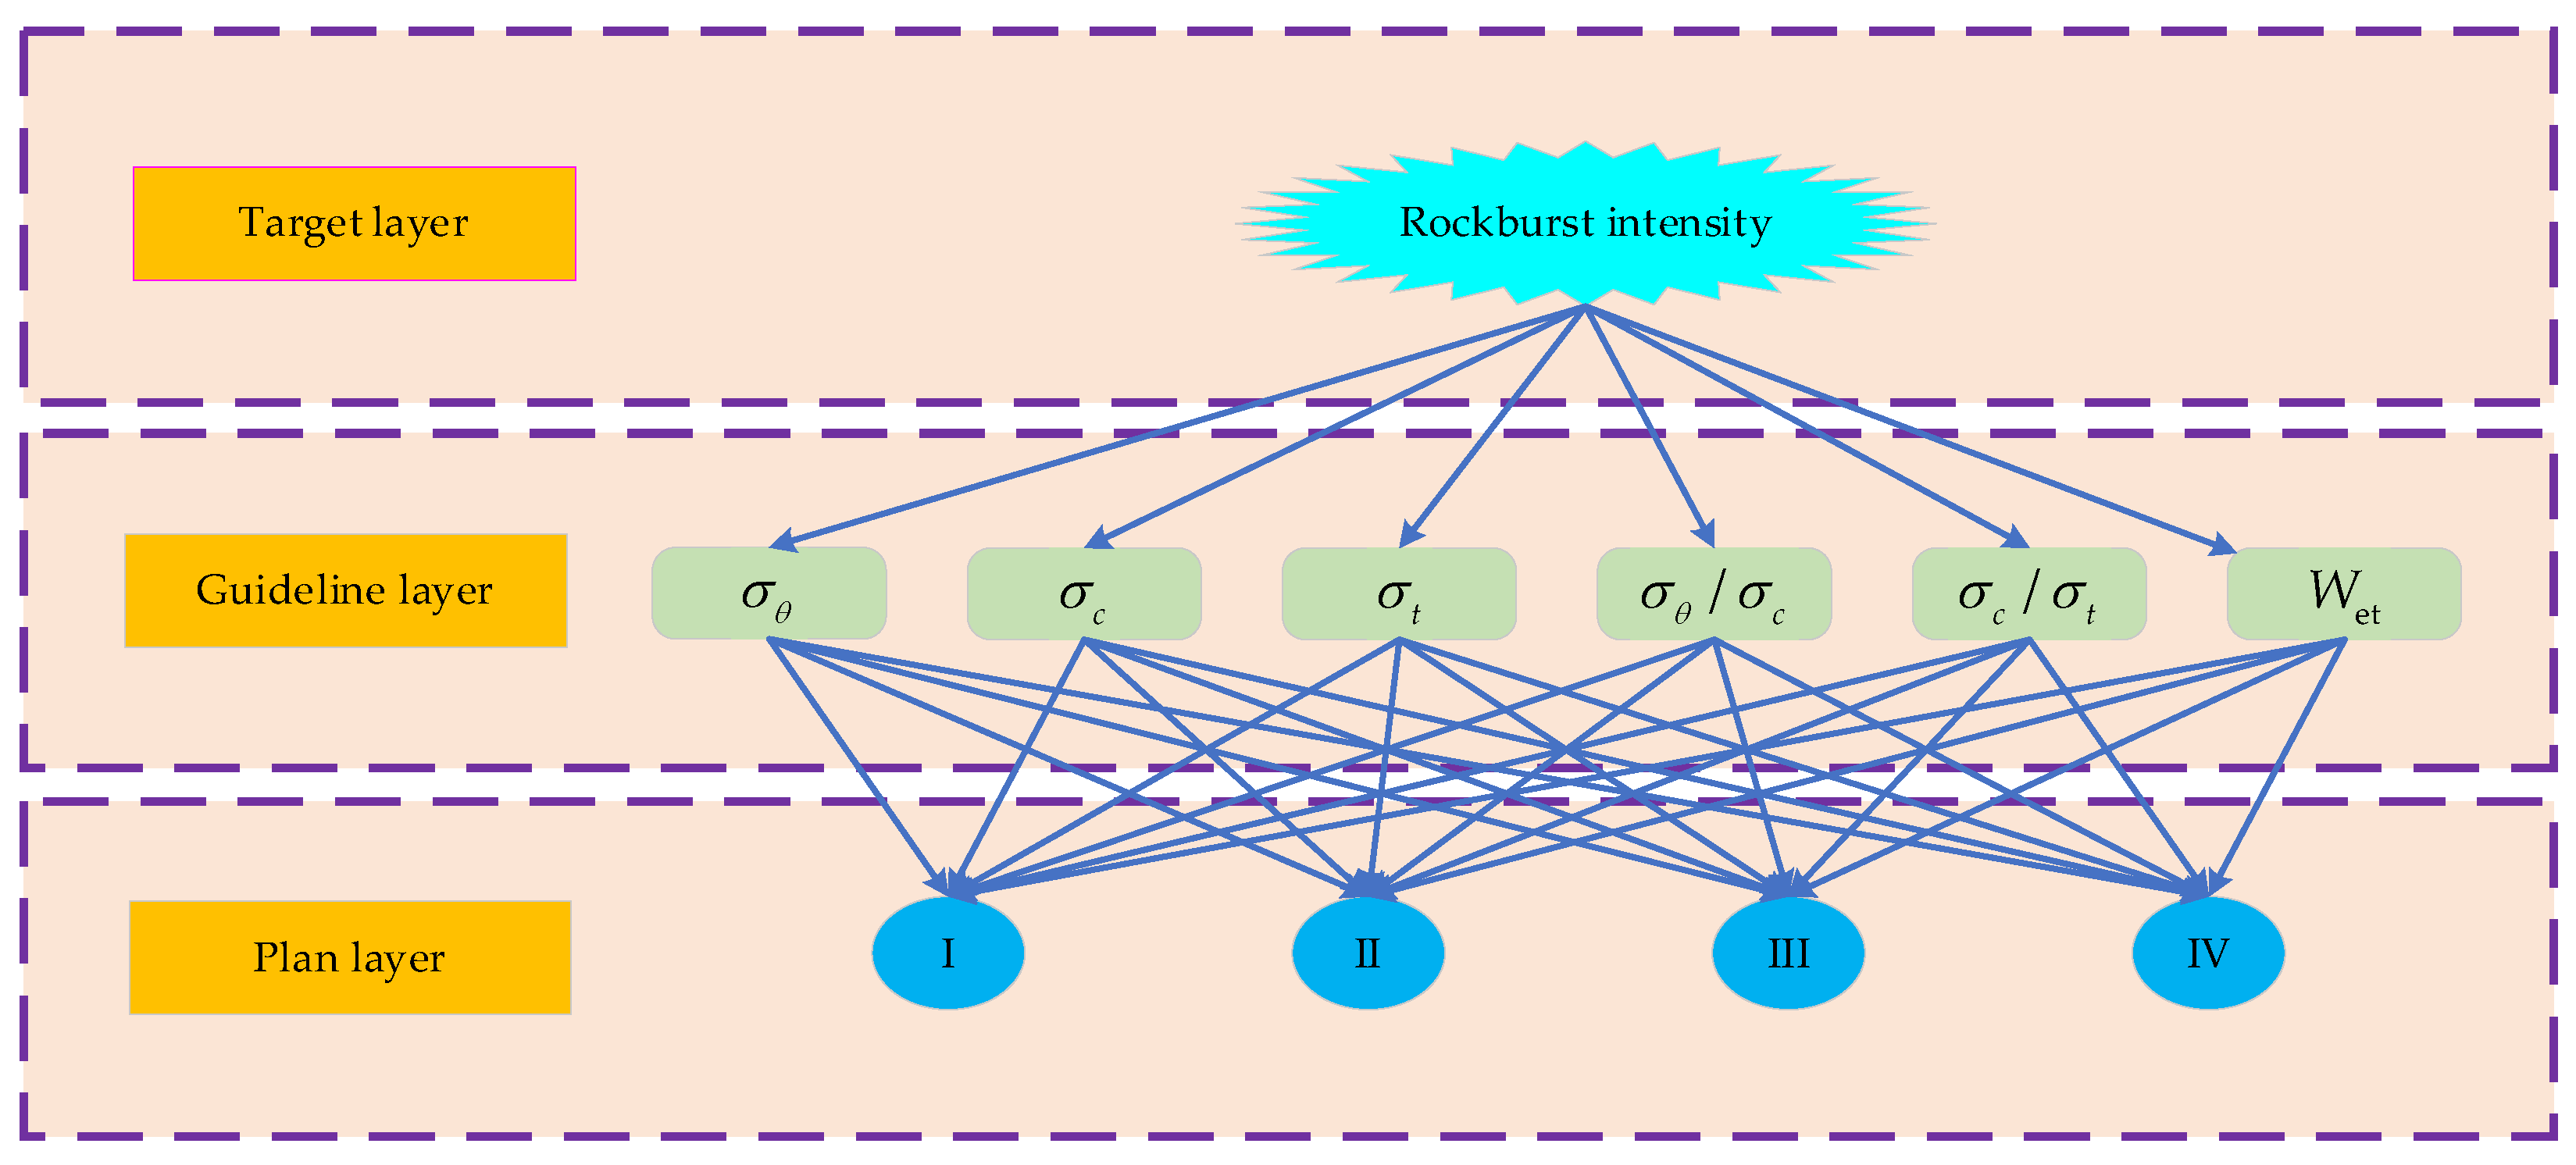
3. Application
- (1)
- The maximum tangential stress of rock mass (): This parameter reflects the stress condition of the rock mass around the excavation boundary;
- (2)
- The uniaxial compressive strength of rock mass (): This parameter reflects the geological condition of the rock mass. It is a main rock characteristic that affects its resistance to failure under compression;
- (3)
- The tensile strength of rock mass (): This parameter reflects another mechanical property of the rock mass. It is defined as the maximum tensile stress that a rock can withstand before failure. It is related to the occurrence of tensile fracture instabilities, which are also a cause of rockbursts;
- (4)
- The stress coefficient (): This parameter reflects the ratio of the maximum tangential stress to the uniaxial compressive strength. It indicates how close or far a rock is from failure under shear stress;
- (5)
- The rock brittleness coefficient (): The uniaxial tensile strength is the other main rock characteristic, and the rock brittleness coefficient has often been applied to such engineering problems. It indicates how easily a rock can break under tension or shear stress;
- (6)
- The elastic energy index (): This parameter reflects the energy condition of the rock mass. is defined as the proportion of retained strain energy to that dissipated, which can reflect the rock’s ability to store elastic energy [12].
4. Discussion
4.1. Model Selection
4.2. Distance Formula Comparison
- (1)
- It is sensitive to outliers or extreme values in parameters. If some parameters have much larger or smaller values than others, they may dominate the distance calculation and overshadow the effects of other parameters. Therefore, using ED may require normalization or standardization of parameters to avoid scale effects;
- (2)
- It is linear and symmetric, which means that it does not consider any nonlinearities or asymmetries in the relationship between parameters and rockburst levels. For example, a small increase in a parameter may have a larger impact on rockburst intensity than a large decrease, or vice versa. Therefore, using ED may not capture the complexity and diversity of rockburst phenomena;
- (3)
- It assumes that all parameters have equal importance and are independent of each other. However, this assumption may not be valid in reality, as some parameters may have more influence or correlation than others on rockbursts. Therefore, using equal weights or ignoring correlations may lead to inaccurate or biased results.
- (1)
- It still assumes that all parameters have equal importance and are independent of each other. Therefore, using CD may still lead to inaccurate or biased results if some parameters have more influence or correlation than others on rockbursts;
- (2)
- It is linear and symmetric, which means that it does not consider any nonlinearities or asymmetries in the relationship between parameters and rockburst levels. Therefore, using CD may not capture the complexity and diversity of rockburst phenomena.
- (1)
- It is invariant to linear transformations of parameters, such as scaling or shifting. This means that it does not depend on the units or ranges of parameters and does not require normalization or standardization of parameters to avoid scale effects;
- (2)
- It is a metric that satisfies the four axioms of distance: non-negativity, identity, symmetry, and triangle inequality. This means that it has a clear geometric interpretation and can be used to measure the actual distance between alternatives and reference values.
5. Conclusions
- (1)
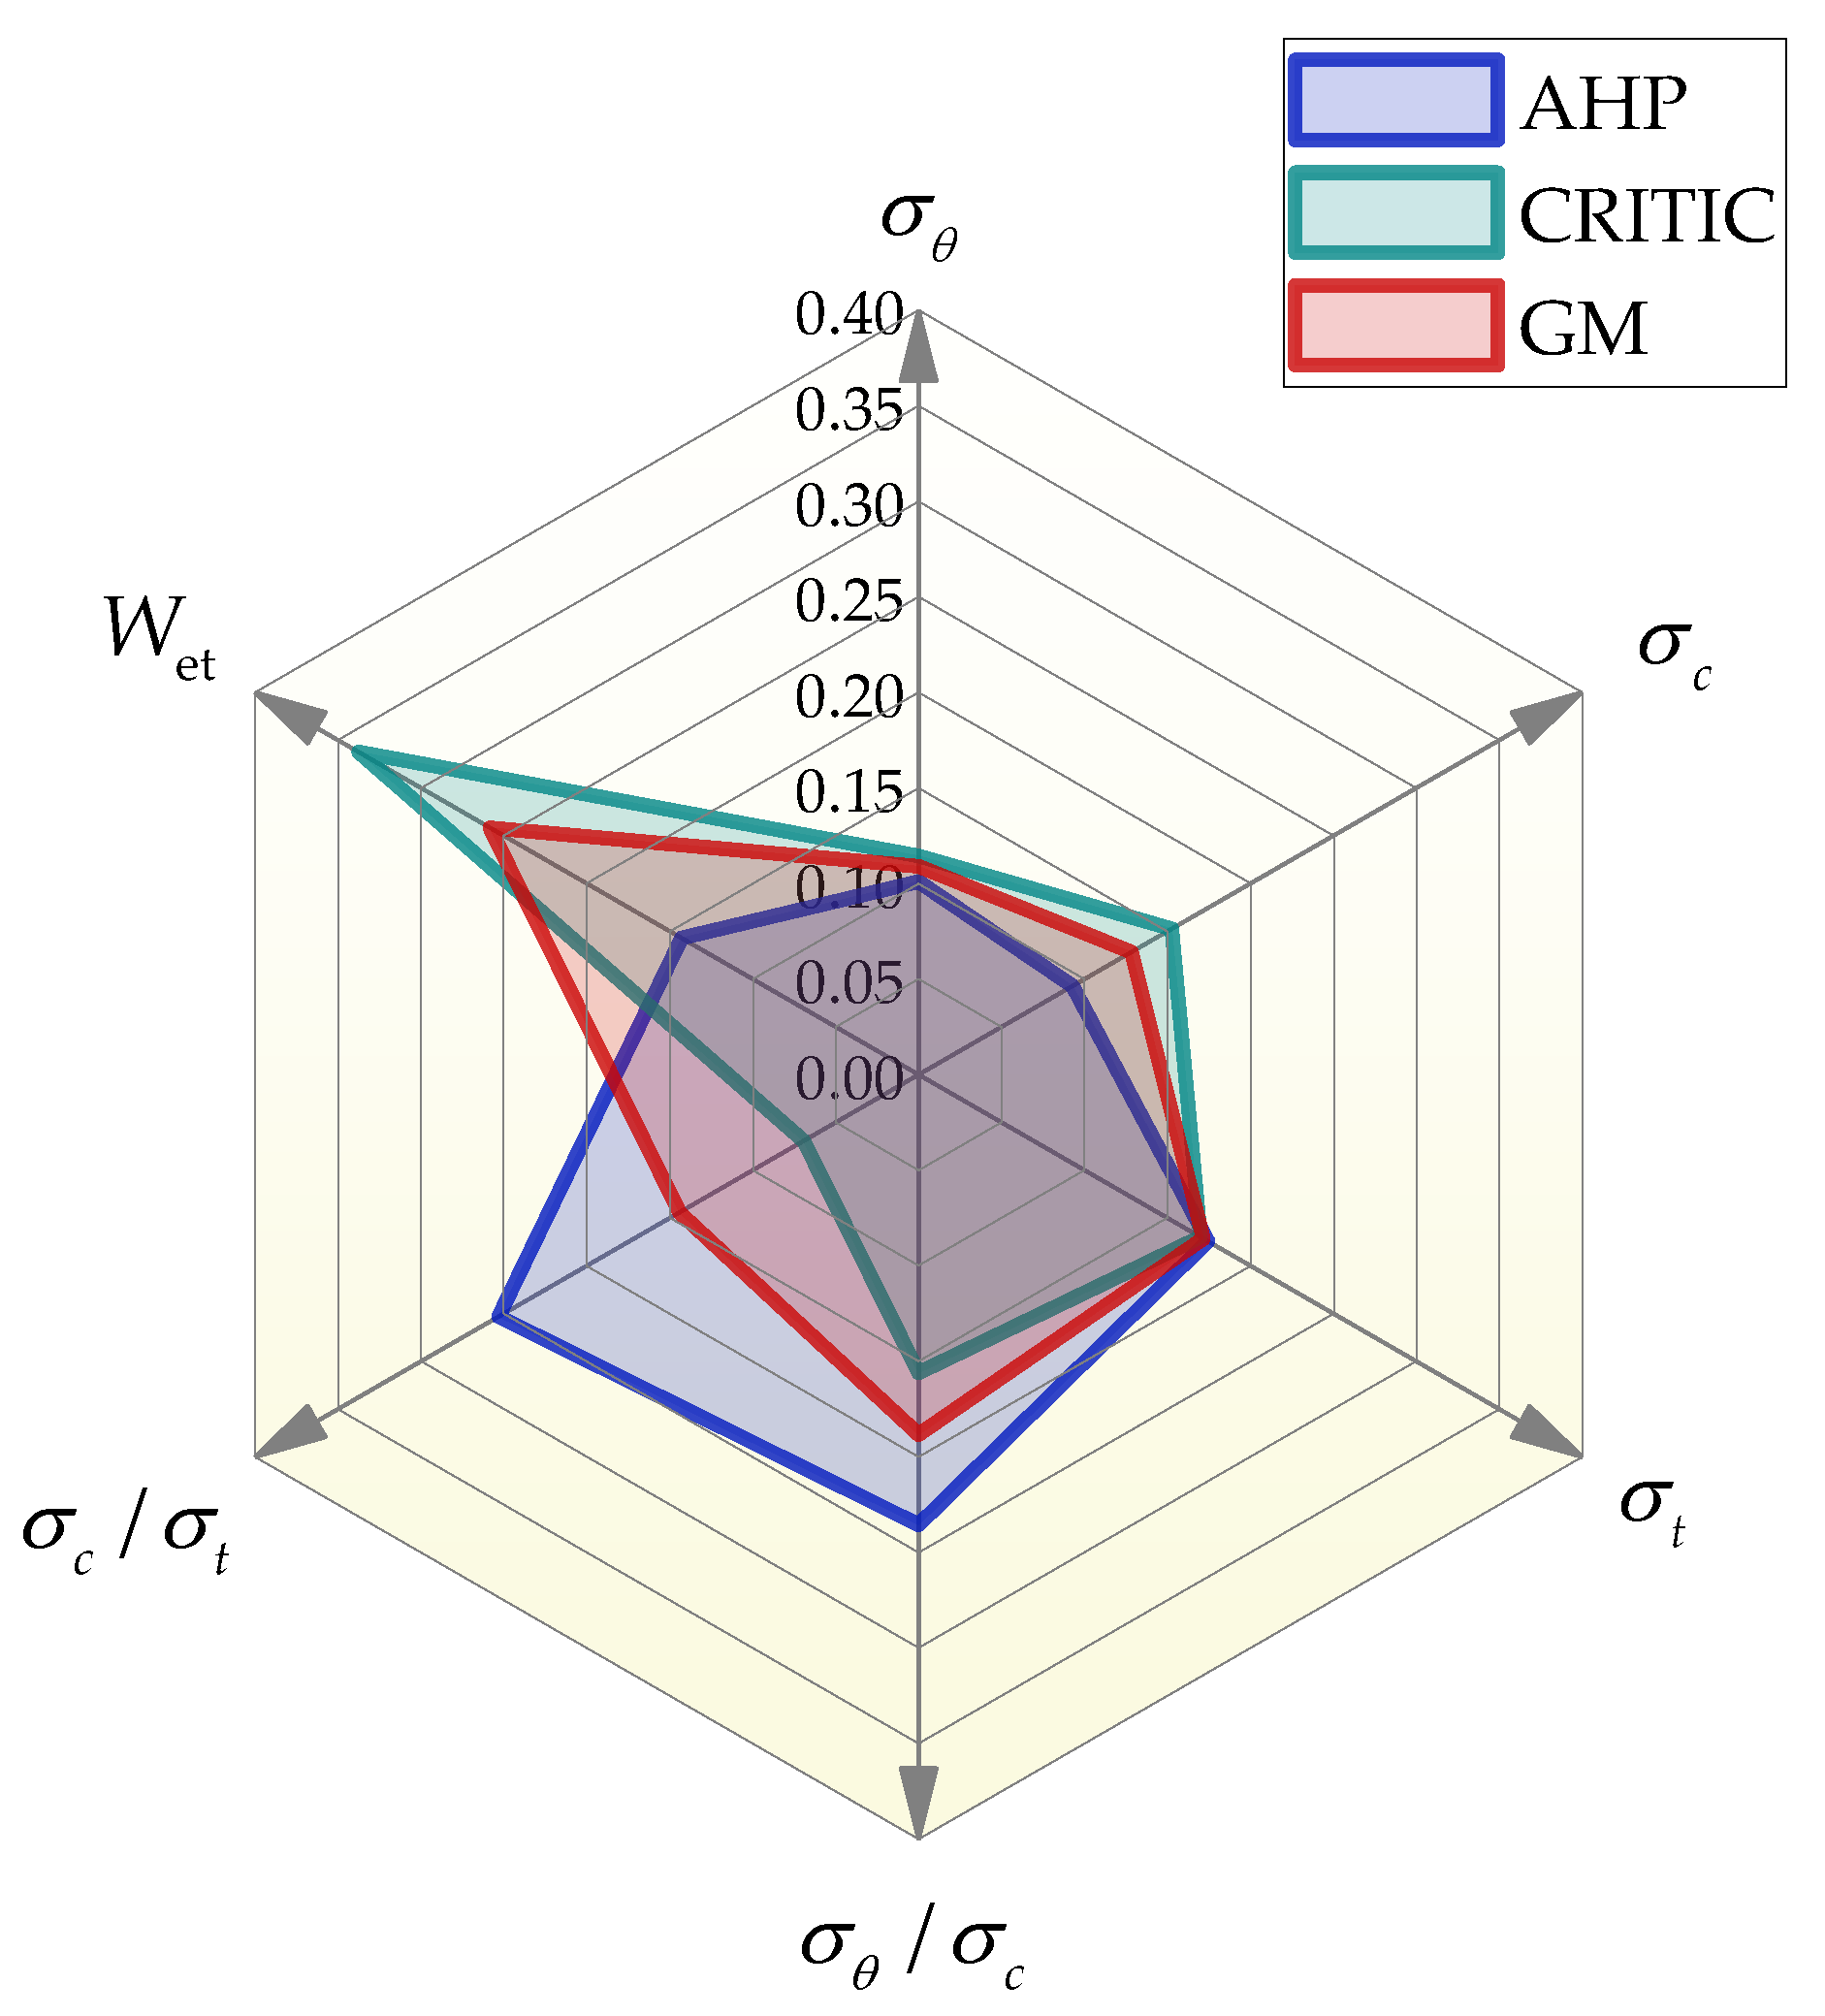
- The combined weights of the evaluation indicators were obtained by calculating the combined weights of the hierarchical analysis method subjective assignment method and CRITIC objective assignment method through the game theory combined assignment method;
- (2)
- The generalized weighted Mahalanobis distance was introduced to improve the VIKOR algorithm, which overcame some limitations of other distance formulas or methods, such as inconsistent indicator dimensions, variations in indicator importance, correlations between indicators;
- (3)
- The method was applied to 60 examples of rock blasting projects worldwide, and the accuracy of the VIKOR method improved by the distance formula was 88.3–91.77%, which was higher than the accuracy of the unimproved VIKOR method of 51.3%. Some samples are not consistent with expectations, but the security levels are all improved. This indicates that it is feasible to improve the distance formula for the traditional VIKOR method;
- (4)
- The comparison of the method proposed in this paper with the commonly used Euclidean and Canberra distances shows that the accuracy of the improved VIKOR method using the Mahalanobis distances is 91.7%, which is higher than that of the 88.33% using the Euclidean and Canberra distances distance improvement. This indicates that the accuracy of VIKOR method improved using Ma distances is higher than that of VIKOR method improved using Euclidean and Canberra distances;
- (5)
- The method proposed in this work is an effective tool for rockburst evaluation. It assists operating system practitioners in detecting and preventing potential rockburst hazards. Moreover, it ensures the safety of the practitioners and reduces the losses by taking appropriate precautions in advance.
Author Contributions
Funding
Data Availability Statement
Acknowledgments
Conflicts of Interest
List of Symbols
| the maximum tangential stress of rock mass | |
| the uniaxial compressive strength of rock mass | |
| the tensile strength of rock mass | |
| the stress coefficient | |
| the rock brittleness coefficient | |
| the elastic energy index | |
| AHP | analytic hierarchy process |
| CRITIC | criteria importance though intercriteria correlation |
| GM | Game Theory |
| VIKOR | VlseKriterijumska Optimizacijia IKompromisno Resenje |
| ED | Euclidean distance |
| CD | Canberra distance |
| GWMD | generalized weighted Mahalanobis distance |
Appendix A

| Samples | Actual Grade | ||||||
|---|---|---|---|---|---|---|---|
| 1 | 75.00 | 180.00 | 8.30 | 0.42 | 21.69 | 5.00 | III |
| 2 | 89.00 | 236.00 | 8.30 | 0.38 | 28.43 | 5.00 | III |
| 3 | 98.60 | 120.00 | 6.50 | 0.82 | 18.46 | 3.80 | III |
| 4 | 18.32 | 96.41 | 2.01 | 0.19 | 47.93 | 1.87 | I |
| 5 | 110.30 | 167.19 | 12.67 | 0.66 | 13.20 | 6.83 | IV |
| 6 | 32.40 | 140.88 | 11.96 | 0.23 | 11.78 | 2.86 | II |
| 7 | 34.89 | 151.70 | 10.66 | 0.23 | 14.23 | 3.17 | II |
| 8 | 9.74 | 88.51 | 2.98 | 0.11 | 29.70 | 1.77 | I |
| 9 | 46.22 | 140.07 | 2.01 | 0.33 | 69.69 | 3.29 | II |
| 10 | 30.95 | 123.79 | 12.67 | 0.25 | 9.77 | 2.57 | II |
| 11 | 7.28 | 52.00 | 3.70 | 0.14 | 14.05 | 1.30 | I |
| 12 | 60.00 | 86.03 | 7.14 | 0.70 | 12.05 | 2.85 | II |
| 13 | 60.00 | 136.79 | 10.42 | 0.44 | 13.13 | 2.12 | II |
| 14 | 2.60 | 20.00 | 3.00 | 0.13 | 6.67 | 1.39 | I |
| 15 | 70.40 | 110.00 | 4.50 | 0.64 | 24.40 | 6.31 | III |
| 16 | 3.80 | 20.00 | 3.00 | 0.19 | 6.67 | 1.39 | I |
| 17 | 4.60 | 20.00 | 3.00 | 0.23 | 6.67 | 1.39 | I |
| 18 | 73.20 | 120.00 | 5.00 | 0.61 | 24.00 | 5.10 | III |
| 19 | 46.40 | 100.00 | 4.90 | 0.46 | 20.40 | 2.00 | II |
| 20 | 46.20 | 105.00 | 5.30 | 0.44 | 19.70 | 2.30 | II |
| 21 | 35.00 | 133.40 | 9.30 | 0.26 | 14.34 | 2.90 | II |
| 22 | 29.80 | 132.20 | 7.80 | 0.23 | 16.95 | 4.60 | I |
| 23 | 109.90 | 128.50 | 9.63 | 0.86 | 13.34 | 8.10 | IV |
| 24 | 59.90 | 96.50 | 8.00 | 0.62 | 12.06 | 1.80 | II |
| 25 | 50.60 | 63.83 | 5.06 | 0.79 | 12.61 | 2.23 | II |
| 26 | 120.80 | 151.60 | 10.10 | 0.80 | 15.01 | 20.00 | IV |
| 27 | 119.32 | 138.60 | 7.74 | 0.86 | 17.91 | 30.00 | IV |
| 28 | 95.67 | 127.37 | 10.51 | 0.75 | 12.12 | 30.00 | IV |
| 29 | 114.44 | 174.71 | 14.42 | 0.66 | 12.12 | 10.00 | IV |
| 30 | 127.60 | 145.42 | 13.70 | 0.88 | 10.61 | 10.00 | IV |
| 31 | 126.41 | 158.03 | 14.32 | 0.80 | 11.04 | 10.00 | IV |
| 32 | 108.53 | 113.37 | 10.43 | 0.96 | 10.87 | 10.00 | IV |
| 33 | 47.50 | 86.30 | 15.60 | 0.55 | 5.53 | 6.30 | III |
| 34 | 77.00 | 86.30 | 15.60 | 0.89 | 5.53 | 6.30 | IV |
| 35 | 77.00 | 91.30 | 14.50 | 0.84 | 6.30 | 21.00 | IV |
| 36 | 67.18 | 132.20 | 16.40 | 0.51 | 8.06 | 3.97 | III |
| 37 | 80.04 | 171.30 | 22.60 | 0.47 | 7.58 | 7.27 | IV |
| 38 | 72.56 | 304.20 | 20.90 | 0.24 | 14.56 | 10.57 | IV |
| 39 | 52.00 | 117.00 | 4.80 | 0.44 | 24.38 | 3.20 | II |
| 40 | 42.00 | 117.00 | 4.80 | 0.36 | 24.38 | 3.20 | II |
| 41 | 57.97 | 96.16 | 3.77 | 0.46 | 16.20 | 2.53 | II |
| 42 | 57.97 | 70.68 | 4.19 | 0.60 | 25.51 | 2.87 | II |
| 43 | 98.02 | 148.52 | 6.66 | 0.66 | 22.30 | 3.23 | III |
| 44 | 43.21 | 116.78 | 3.93 | 0.37 | 29.73 | 3.52 | II |
| 45 | 45.92 | 109.33 | 3.34 | 0.42 | 32.77 | 2.97 | II |
| 46 | 38.12 | 100.32 | 3.49 | 0.38 | 28.77 | 3.02 | II |
| 47 | 102.38 | 142.20 | 5.17 | 0.72 | 27.52 | 4.30 | III |
| 48 | 110.62 | 160.32 | 9.69 | 0.69 | 16.55 | 5.72 | IV |
| 49 | 40.99 | 97.60 | 6.30 | 0.42 | 15.50 | 3.20 | II |
| 50 | 81.75 | 125.77 | 12.14 | 0.65 | 10.36 | 5.75 | III |
| 51 | 90.99 | 146.75 | 7.58 | 0.62 | 19.35 | 4.50 | III |
| 52 | 30.90 | 238.00 | 7.60 | 0.13 | 31.20 | 7.40 | I |
| 53 | 75.50 | 151.00 | 18.20 | 0.50 | 8.30 | 3.10 | II |
| 54 | 75.60 | 194.00 | 8.90 | 0.39 | 21.70 | 5.00 | III |
| 55 | 57.90 | 181.00 | 7.50 | 0.32 | 24.10 | 9.30 | III |
| 56 | 72.60 | 173.00 | 8.00 | 0.42 | 21.70 | 5.20 | III |
| 57 | 54.90 | 183.00 | 9.00 | 0.30 | 20.40 | 5.10 | II |
| 58 | 62.70 | 196.00 | 9.00 | 0.32 | 21.70 | 5.00 | III |
| 59 | 61.60 | 162.00 | 9.20 | 0.38 | 17.60 | 9.00 | III |
| 60 | 132.40 | 172.00 | 9.80 | 0.77 | 17.50 | 5.50 | IV |
References
- Zhou, J.; Li, X.; Mitri, H.S. Evaluation Method of Rockburst: State-of-the-Art Literature Review. Tunn. Undergr. Space Technol. 2018, 81, 632–659. [Google Scholar] [CrossRef]
- Zhao, T.; Guo, W.; Tan, Y.; Yin, Y.; Cai, L.; Pan, J. Case Studies of Rock Bursts Under Complicated Geological Conditions during Multi-Seam Mining at a Depth of 800 m. Rock Mech. Rock Eng. 2018, 51, 1539–1564. [Google Scholar] [CrossRef]
- Wang, S.; Zhou, J.; Li, C.; Armaghani, D.J.; Li, X.; Mitri, H.S. Rockburst Prediction in Hard Rock Mines Developing Bagging and Boosting Tree-Based Ensemble Techniques. J. Cent. South Univ. 2021, 28, 527–542. [Google Scholar] [CrossRef]
- Zhou, J.; Chen, C.; Wei, C.; Du, K. An Improved Connection Cloud Model of an Updated Database: A Multicriteria Uncertainty Model for Coal Burst Liability Evaluation. Nat. Resour. Res. 2022, 31, 1687–1704. [Google Scholar] [CrossRef]
- Guo, D.; Chen, H.; Tang, L.; Chen, Z.; Samui, P. Assessment of Rockburst Risk Using Multivariate Adaptive Regression Splines and Deep Forest Model. Acta Geotech. 2022, 17, 1183–1205. [Google Scholar] [CrossRef]
- Manouchehrian, A.; Cai, M. Numerical Modeling of Rockburst near Fault Zones in Deep Tunnels. Tunn. Undergr. Space Technol. 2018, 80, 164–180. [Google Scholar] [CrossRef]
- Zhou, H.; Chen, S.; Li, H.; Liu, T.; Wang, H. Rockburst Prediction for Hard Rock and Deep-Lying Long Tunnels Based on the Entropy Weight Ideal Point Method and Geostress Field Inversion: A Case Study of the Sangzhuling Tunnel. Bull. Eng. Geol. Environ. 2021, 80, 3885–3902. [Google Scholar] [CrossRef]
- Turchaninov, I.A.; Markov, G.A.; Gzovsky, M.V.; Kazikayev, D.M.; Frenze, U.K.; Batugin, S.A.; Chabdarova, U.I. State of Stress in the Upper Part of the Earth’s Crust Based on Direct Measurements in Mines and on Tectonophysical and Seismological Studies. Phys. Earth Planet. Int. 1972, 6, 229–234. [Google Scholar] [CrossRef]
- Barton, N.; Lien, R.; Lunde, J. Engineering Classification of Rock Masses for the Design of Tunnel Support. Rock Mech. 1974, 6, 189–236. [Google Scholar] [CrossRef]
- Russenes, B.F. Analysis of Rock Spalling for Tunnels in Steep Valley Sides. Nor. Inst. Technol. 1974. (In Norwegian) [Google Scholar]
- Hoek, E.; Brown, E.T. Practical Estimates of Rock Mass Strength. Int. J. Rock Mech. Min. Sci. 1997, 34, 1165–1186. [Google Scholar] [CrossRef]
- Kidybiński, A. Bursting Liability Indices of Coal. Int. J. Rock Mech. Min. Sci. Geomech. Abstr. 1981, 18, 295–304. [Google Scholar] [CrossRef]
- Mitri, H.S. Assessment of Horizontal Pillar Burst in Deep Hard Rock Mines. Int. J. Risk Assess. Manag. 2007, 7, 695. [Google Scholar] [CrossRef]
- Wang, C.; Wu, A.; Lu, H.; Bao, T.; Liu, X. Predicting Rockburst Tendency Based on Fuzzy Matter–Element Model. Int. J. Rock Mech. Min. Sci. 2015, 75, 224–232. [Google Scholar] [CrossRef]
- Zhou, J.; Li, X.; Mitri, H.S. Classification of Rockburst in Underground Projects: Comparison of Ten Supervised Learning Methods. J. Comput. Civ. Eng. 2016, 30, 04016003. [Google Scholar] [CrossRef]
- Wang, Y.; Li, W.; Li, Q.; Xu, Y.; Tan, G. Method of Fuzzy Comprehensive Evaluations for Rockburst Prediction. Chin. J. Rock Mech. Eng. 1998, 17, 15–23. (In Chinese) [Google Scholar]
- He, S.; Song, D.; Mitri, H.; He, X.; Chen, J.; Li, Z.; Xue, Y.; Chen, T. Integrated Rockburst Early Warning Model Based on Fuzzy Comprehensive Evaluation Method. Int. J. Rock Mech. Min. Sci. 2021, 142, 104767. [Google Scholar] [CrossRef]
- Yu, H.; Liu, H.; Lu, X.; Liu, H. Prediction Method of Rock Burst Proneness Based on Rough Set and Genetic Algorithm. J. Coal Sci. Eng. China 2009, 15, 367–373. [Google Scholar] [CrossRef]
- Liu, R.; Ye, Y.; Hu, N.; Chen, H.; Wang, X. Classified Prediction Model of Rockburst Using Rough Sets-Normal Cloud. Neural Comput. Appl. 2019, 31, 8185–8193. [Google Scholar] [CrossRef]
- Zhou, K.; Lin, Y.; Deng, H.; Li, J.; Liu, C. Prediction of Rock Burst Classification Using Cloud Model with Entropy Weight. Trans. Nonferr. Met. Soc. China 2016, 26, 1995–2002. [Google Scholar] [CrossRef]
- Qu, H.; Yang, L.; Zhu, J.; Chen, S.; Li, B.; Li, B. A Multi-Index Evaluation Method for Rockburst Proneness of Deep Underground Rock Openings with Attribute Recognition Model and Its Application. Int. J. Rock Mech. Min. Sci. 2022, 159, 105225. [Google Scholar] [CrossRef]
- Li, S.; Kuang, Z.; Xiao, Y.; Qiao, Z.; Yang, W. Rockburst Tendency Prediction Based on an Integrating Method of Combination Weighting and Matter-Element Extension Theory: A Case Study in the Bayu Tunnel of the Sichuan-Tibet Railway. Eng. Geol. 2022, 308, 106796. [Google Scholar] [CrossRef]
- Wang, M.; Liu, Q.; Wang, X.; Shen, F.; Jin, J. Prediction of Rockburst Based on Multidimensional Connection Cloud Model and Set Pair Analysis. Int. J. Geomech. 2020, 20, 04019147. [Google Scholar] [CrossRef]
- Jia, Q.; Wu, L.; Li, B.; Chen, C.; Peng, Y. The Comprehensive Prediction Model of Rockburst Tendency in Tunnel Based on Optimized Unascertained Measure Theory. Geotech. Geol. Eng. 2019, 37, 3399–3411. [Google Scholar] [CrossRef]
- Liu, Z.; Chen, J.; Zhao, Y.; Yang, S. A Novel Method for Predicting Rockburst Intensity Based on an Improved Unascertained Measurement and an Improved Game Theory. Mathematics 2023, 11, 1862. [Google Scholar] [CrossRef]
- Gong, F.; Li, X. A Distance Discriminant Analysis Method for Prediction of Possibility and Classification of Rockburst and Its Application. Chin. J. Rock Mech. Eng. 2007, 26, 1012–1018. (In Chinese) [Google Scholar]
- Gong, F.; Li, X.; Zhang, W. Rockburst prediction of underground engineering based on Bayes discriminant analysis method. Rock Soil Mech. 2010, 31, 370–377+387. [Google Scholar]
- Zhou, J.; Li, X.; Shi, X. Long-Term Prediction Model of Rockburst in Underground Openings Using Heuristic Algorithms and Support Vector Machines. Saf. Sci. 2012, 50, 629–644. [Google Scholar] [CrossRef]
- Ullah, B.; Kamran, M.; Rui, Y. Predictive Modeling of Short-Term Rockburst for the Stability of Subsurface Structures Using Machine Learning Approaches: T-SNE, K-Means Clustering and XGBoost. Mathematics 2022, 10, 449. [Google Scholar] [CrossRef]
- Zhou, J.; Guo, H.; Koopialipoor, M.; Jahed Armaghani, D.; Tahir, M.M. Investigating the Effective Parameters on the Risk Levels of Rockburst Phenomena by Developing a Hybrid Heuristic Algorithm. Eng. Comput. 2021, 37, 1679–1694. [Google Scholar] [CrossRef]
- Wojtecki, Ł.; Iwaszenko, S.; Apel, D.B.; Cichy, T. An Attempt to Use Machine Learning Algorithms to Estimate the Rockburst Hazard in Underground Excavations of Hard Coal Mine. Energies 2021, 14, 6928. [Google Scholar] [CrossRef]
- Xue, Y.; Bai, C.; Qiu, D.; Kong, F.; Li, Z. Predicting Rockburst with Database Using Particle Swarm Optimization and Extreme Learning Machine. Tunn. Undergr. Space Technol. 2020, 98, 103287. [Google Scholar] [CrossRef]
- Lin, Y.; Zhou, K.; Li, J. Application of Cloud Model in Rock Burst Prediction and Performance Comparison with Three Machine Learning Algorithms. IEEE Access 2018, 6, 30958–30968. [Google Scholar] [CrossRef]
- Ghasemi, E.; Gholizadeh, H.; Adoko, A.C. Evaluation of Rockburst Occurrence and Intensity in Underground Structures Using Decision Tree Approach. Eng. Comput. 2020, 36, 213–225. [Google Scholar] [CrossRef]
- Li, N.; Feng, X.; Jimenez, R. Predicting Rock Burst Hazard with Incomplete Data Using Bayesian Networks. Tunn. Undergr. Space Technol. 2017, 61, 61–70. [Google Scholar] [CrossRef]
- Dong, L.; Li, X.; Peng, K. Prediction of Rockburst Classification Using Random Forest. Trans. Nonfer. Met. Soc. China 2013, 23, 472–477. [Google Scholar] [CrossRef]
- Li, D.; Liu, Z.; Armaghani, D.J.; Xiao, P.; Zhou, J. Novel Ensemble Tree Solution for Rockburst Prediction Using Deep Forest. Mathematics 2022, 10, 787. [Google Scholar] [CrossRef]
- Li, Y.; Liu, Y. Extended VIKOR-QUALIFLEX Method Based on Trapezoidal Fuzzy Two-Dimensional Linguistic Information for Multiple Attribute Decision-Making with Unknown Attribute Weight. Mathematics 2020, 9, 37. [Google Scholar] [CrossRef]
- Sakthivel, G.; Sivakumar, R.; Saravanan, N.; Ikua, B.W. A Decision Support System to Evaluate the Optimum Fuel Blend in an IC Engine to Enhance the Energy Efficiency and Energy Management. Energy 2017, 140, 566–583. [Google Scholar] [CrossRef]
- Rostamzadeh, R.; Govindan, K.; Esmaeili, A.; Sabaghi, M. Application of Fuzzy VIKOR for Evaluation of Green Supply Chain Management Practices. Ecol. Indic. 2015, 49, 188–203. [Google Scholar] [CrossRef]
- Arabameri, A.; Lee, S.; Tiefenbacher, J.P.; Ngo, P.T.T. Novel Ensemble of MCDM-Artificial Intelligence Techniques for Groundwater-Potential Mapping in Arid and Semi-Arid Regions (Iran). Remote Sens. 2020, 12, 490. [Google Scholar] [CrossRef]
- Manupati, V.K.; Ramkumar, M.; Baba, V.; Agarwal, A. Selection of the Best Healthcare Waste Disposal Techniques during and Post COVID-19 Pandemic Era. J. Clean. Prod. 2021, 281, 125175. [Google Scholar] [CrossRef] [PubMed]
- Mahmoudi, A.; Sadeghi, M.; Naeni, L.M. Blockchain and Supply Chain Finance for Sustainable Construction Industry: Ensemble Ranking Using Ordinal Priority Approach. Oper. Manag. Res. 2023. [Google Scholar] [CrossRef]
- Saaty, T.L. A Scaling Method for Priorities in Hierarchical Structures. J. Math. Psychol. 1977, 15, 234–281. [Google Scholar] [CrossRef]
- Saaty, T.L. What Is the Analytic Hierarchy Process? In Mathematical Models for Decision Support; Mitra, G., Greenberg, H.J., Lootsma, F.A., Rijkaert, M.J., Zimmermann, H.J., Eds.; Springer: Berlin/Heidelberg, Germany, 1988; pp. 109–121. ISBN 978-3-642-83557-5. [Google Scholar]
- Panchal, S.; Shrivastava, A.K. Landslide Hazard Assessment Using Analytic Hierarchy Process (AHP): A Case Study of National Highway 5 in India. Ain Shams Eng. J. 2022, 13, 101626. [Google Scholar] [CrossRef]
- Hsueh, J.-T.; Lin, C.-Y. Integrating the AHP and TOPSIS Decision Processes for Evaluating the Optimal Collection Strategy in Reverse Logistic for the TPI. Int. J. Green Energy 2017, 14, 1209–1220. [Google Scholar] [CrossRef]
- Fan, W.; Xu, Z.; Wu, B.; He, Y.; Zhang, Z. Structural Multi-Objective Topology Optimization and Application Based on the Criteria Importance through Intercriteria Correlation Method. Eng. Optim. 2022, 54, 830–846. [Google Scholar] [CrossRef]
- Diakoulaki, D.; Mavrotas, G.; Papayannakis, L. Determining Objective Weights in Multiple Criteria Problems: The Critic Method. Comput. Oper. Res. 1995, 22, 763–770. [Google Scholar] [CrossRef]
- Huang, S.-W.; Liou, J.J.H.; Chuang, H.-H.; Tzeng, G.-H. Using a Modified VIKOR Technique for Evaluating and Improving the National Healthcare System Quality. Mathematics 2021, 9, 1349. [Google Scholar] [CrossRef]
- Geng, S.; Hou, H.; Zhou, Z. A Hybrid Approach of VIKOR and Bi-Objective Decision Model for Emergency Shelter Location–Allocation to Respond to Earthquakes. Mathematics 2021, 9, 1897. [Google Scholar] [CrossRef]
- Wang, C.-N.; Nguyen, N.-A.-T.; Dang, T.-T.; Lu, C.-M. A Compromised Decision-Making Approach to Third-Party Logistics Selection in Sustainable Supply Chain Using Fuzzy AHP and Fuzzy VIKOR Methods. Mathematics 2021, 9, 886. [Google Scholar] [CrossRef]
- Chen, T.-Y. An Evolved VIKOR Method for Multiple-Criteria Compromise Ranking Modeling under T-Spherical Fuzzy Uncertainty. Adv. Eng. Inform. 2022, 54, 101802. [Google Scholar] [CrossRef]
- Chen, H.; Huang, D. Missing Data Imputation Based on Generalized Mahalanobis Distance. Comput. Sci. 2011, 38, 149–153. (In Chinese) [Google Scholar]
- Kaya, T.; Kahraman, C. Multicriteria Renewable Energy Planning Using an Integrated Fuzzy VIKOR & AHP Methodology: The Case of Istanbul. Energy 2010, 35, 2517–2527. [Google Scholar] [CrossRef]
- Soner, O.; Celik, E.; Akyuz, E. Application of AHP and VIKOR Methods under Interval Type 2 Fuzzy Environment in Maritime Transportation. Ocean Eng. 2017, 129, 107–116. [Google Scholar] [CrossRef]
- Adoko, A.C.; Gokceoglu, C.; Wu, L.; Zuo, Q.J. Knowledge-Based and Data-Driven Fuzzy Modeling for Rockburst Prediction. Int. J. Rock Mech. Min. Sci. 2013, 61, 86–95. [Google Scholar] [CrossRef]
- Wu, S.; Wu, Z.; Zhang, C. Rock Burst Prediction Probability Model Based on Case Analysis. Tunn. Undergr. Space Technol. 2019, 93, 103069. [Google Scholar] [CrossRef]
- Li, D.; Liu, Z.; Xiao, P.; Zhou, J.; Jahed Armaghani, D. Intelligent Rockburst Prediction Model with Sample Category Balance Using Feedforward Neural Network and Bayesian Optimization. Undergr. Space 2022, 7, 833–846. [Google Scholar] [CrossRef]
- Li, G.; Xue, Y.; Qu, C.; Qiu, D.; Wang, P.; Liu, Q. Intelligent Prediction of Rockburst in Tunnels Based on Back Propagation Neural Network Integrated Beetle Antennae Search Algorithm. Environ. Sci. Pollut. Res. 2022, 30, 33960–33973. [Google Scholar] [CrossRef]
- Xu, C.; Liu, X.; Wang, E.; Zheng, Y.; Wang, S. Rockburst Prediction and Classification Based on the Ideal-Point Method of Information Theory. Tunn. Undergr. Space Technol. 2018, 81, 382–390. [Google Scholar] [CrossRef]
- Qi, J.; Hu, J.; Peng, Y. Modified Rough VIKOR Based Design Concept Evaluation Method Compatible with Objective Design and Subjective Preference Factors. Appl. Soft Comput. 2021, 107, 107414. [Google Scholar] [CrossRef]
- Sekar, K.R.; Raju, M.N.; AnulHaq, M.; Kumar, A.; Shalini, R.; Poojalaxmi, S. An Improved Ranking Methodology for Malignant Carcinoma in Multicriterian Decision Making Using Hesitant VIKOR Fuzzy. Theor. Comput. Sci. 2022, 929, 81–94. [Google Scholar] [CrossRef]


| Value | Definition | Explanation |
|---|---|---|
| 1 | Equally Important | Both criteria are equally important or both the indicators have same effect on occurrence of landslides |
| 3 | Moderately Important | One indicator is more effective as compared to the other indicator |
| 5 | Highly Important | One indicator affects highly as compared to the other indicator |
| 7 | Very Highly Important | One indicator is highly dominated over the other indicator |
| 9 | Extremely Important | One indicator has highest possibility of affecting the occurrence of landslide over the other indicator |
| 2, 4, 6, 8 | Intermediate Values | If a compromise between two indicators is required, intermediate values can be used |
| Number of Criteria | 1 | 2 | 3 | 4 | 5 | 6 | 7 | 8 | 9 | 10 |
|---|---|---|---|---|---|---|---|---|---|---|
| RI | 0 | 0 | 0.58 | 0.9 | 1.12 | 1.24 | 1.32 | 1.41 | 1.45 | 1.49 |
| Rockburst Level | Evaluation Index of Rockburst | |||||
|---|---|---|---|---|---|---|
| No rockburst (I) | 0–24 | 0–80 | 0–5 | 0–0.3 | >40 | 0–2.0 |
| Weak rockburst (II) | 24–60 | 80–120 | 5–7 | 0.3–0.5 | 26.7–40 | 2.0–3.5 |
| Mediate rockburst (III) | 60–126 | 120–180 | 7–9 | 0.5–0.7 | 14.5–26.7 | 3.5–5.0 |
| Strong rockburst (IV) | ≥126 | ≥180 | ≥9 | 0.7–1.0 | 0–14.5 | ≥5.0 |
| Methods | ||||||
|---|---|---|---|---|---|---|
| AHP | 0.1010 | 0.0929 | 0.1744 | 0.2355 | 0.2533 | 0.1429 |
| CRITIC | 0.1145 | 0.1527 | 0.1699 | 0.1561 | 0.0693 | 0.3375 |
| GM | 0.1090 | 0.1284 | 0.1717 | 0.1884 | 0.1441 | 0.2584 |
| Samples | VIKOR-GWMD | VIKOR-ED | VIKOR-CD | VIKOR | Actual Grade |
|---|---|---|---|---|---|
| 1 | III | III | III | III | III |
| 2 | III | III | III | IV• | III |
| 3 | III | III | III | III | III |
| 4 | I | I | I | II• | I |
| 5 | IV | IV | IV | III• | IV |
| 6 | II | II | II | II | II |
| 7 | II | II | II | III• | II |
| 8 | I | I | I | II• | I |
| 9 | II | II | II | II | II |
| 10 | II | II | II | III• | II |
| 11 | I | I | I | II• | I |
| 12 | II | III• | III• | III• | II |
| 13 | II | II | II | III• | II |
| 14 | I | I | I | II• | I |
| 15 | III | III | III | III | III |
| 16 | I | I | I | I | I |
| 17 | I | I | I | II• | I |
| 18 | III | III | III | III | III |
| 19 | II | II | II | II | II |
| 20 | II | II | II | III• | II |
| 21 | II | II | II | II | II |
| 22 | II• | II• | II• | II• | I |
| 23 | IV | IV | IV | IV | IV |
| 24 | II | II | II | III• | II |
| 25 | II | II | II | III• | II |
| 26 | IV | IV | IV | IV | IV |
| 27 | IV | IV | IV | IV | IV |
| 28 | IV | IV | IV | IV | IV |
| 29 | IV | IV | IV | IV | IV |
| 30 | IV | IV | IV | IV | IV |
| 31 | IV | IV | IV | IV | IV |
| 32 | IV | IV | IV | IV | IV |
| 33 | III | III | III | III | III |
| 34 | IV | IV | IV | IV | IV |
| 35 | IV | IV | IV | IV | IV |
| 36 | III | III | III | III | III |
| 37 | IV | IV | IV | IV | IV |
| 38 | IV | IV | IV | IV | IV |
| 39 | II | II | II | III• | II |
| 40 | II | II | II | III• | II |
| 41 | II | II | II | III• | II |
| 42 | II | II | II | III• | II |
| 43 | III | III | III | III | III |
| 44 | II | II | II | III• | II |
| 45 | II | II | II | III• | II |
| 46 | II | II | II | II | II |
| 47 | III | III | III | III | III |
| 48 | IV | IV | IV | III• | IV |
| 49 | II | II | II | III• | II |
| 50 | IV• | III | III | III | III |
| 51 | III | III | III | III | III |
| 52 | I | II• | III• | II• | I |
| 53 | III• | III• | III• | III• | II |
| 54 | III | III | III | III | III |
| 55 | III | IV• | IV• | III | III |
| 56 | III | III | III | III | III |
| 57 | III• | III• | III• | II | II |
| 58 | III | III | III | III | III |
| 59 | IV• | IV• | IV• | III | III |
| 60 | IV | IV | IV | IV | IV |
| Methods | VIKOR-GWMD | VIKOR-ED | VIKOR-CD | VIKOR |
|---|---|---|---|---|
| Accurate | 55 | 53 | 53 | 35 |
| Misjudge | 5 | 7 | 7 | 25 |
| Accuracy (%) | 91.67 | 88.33 | 88.33 | 58.33 |
Disclaimer/Publisher’s Note: The statements, opinions and data contained in all publications are solely those of the individual author(s) and contributor(s) and not of MDPI and/or the editor(s). MDPI and/or the editor(s) disclaim responsibility for any injury to people or property resulting from any ideas, methods, instructions or products referred to in the content. |
© 2024 by the authors. Licensee MDPI, Basel, Switzerland. This article is an open access article distributed under the terms and conditions of the Creative Commons Attribution (CC BY) license (https://creativecommons.org/licenses/by/4.0/).
Share and Cite
Chen, J.; Liu, Z.; Zhao, Y.; Yang, S.; Zhou, Z. Generalized Weighted Mahalanobis Distance Improved VIKOR Model for Rockburst Classification Evaluation. Mathematics 2024, 12, 181. https://doi.org/10.3390/math12020181
Chen J, Liu Z, Zhao Y, Yang S, Zhou Z. Generalized Weighted Mahalanobis Distance Improved VIKOR Model for Rockburst Classification Evaluation. Mathematics. 2024; 12(2):181. https://doi.org/10.3390/math12020181
Chicago/Turabian StyleChen, Jianhong, Zhe Liu, Yakun Zhao, Shan Yang, and Zhiyong Zhou. 2024. "Generalized Weighted Mahalanobis Distance Improved VIKOR Model for Rockburst Classification Evaluation" Mathematics 12, no. 2: 181. https://doi.org/10.3390/math12020181
APA StyleChen, J., Liu, Z., Zhao, Y., Yang, S., & Zhou, Z. (2024). Generalized Weighted Mahalanobis Distance Improved VIKOR Model for Rockburst Classification Evaluation. Mathematics, 12(2), 181. https://doi.org/10.3390/math12020181