1. Introduction
The investigation of several life distribution classes was introduced in reliability by Barlow and Proschan (1963) [
1], Siddiqui and Bryson (1969) [
2], Barlow and Proschan (1981) [
3], Lee (1990) [
4], and Serfling (1980) [
5]. These kinds of life distributions are currently used in biometrics, engineering, maintenance, and the social and biological sciences. Consequently, there has been an increasing interest from statisticians and reliability analysts in modeling survival data with life distributions classified according to certain features of aging.
The NBRUmgf class is particularly significant in this context because it generalizes and encompasses a variety of other well-known classes of life distributions, such as new better than used (NBU), New Better than Used in Expectation (NBUE), and Increasing Failure Rate (IFR). This makes the NBRUmgf class a versatile and powerful tool for reliability modeling and life data analysis.
Everestus et al. (2022) [
6] examined 91 distinct exponentiality tests. It was claimed that, while some tests were against specific kinds of alternative distributions, others were universally consistent. Their simulation study’s outcomes revealed that some tests that performed well under one set of shape alternatives would not do as well under another set of shape alternatives. Conversely, some tests that seemed less potent at small sample numbers also seemed more potent at large sample sizes. Ultimately, there was total concurrence between the outcomes of the simulated studies and the real-life implementations.
In more recent times, several classes of aging distributions of life have been further established within documented texts. For instance, using the goodness of fit and U-statistic approaches, respectively, Abu-Yousef et al. (2020, 2022) [
7,
8] introduced two novel test statistics for comparing the new is preferred over the used convex ordering function which generates moments (
NBUCmgf) life class distribution to the exponential distribution. In regard to a goodness of fit methodology, Abu Yousef and El-toony (2022) [
9] suggested a new test statistic for comparing the better average increasing concave in Laplace transform order (UBAC (2)L) class of life distribution to exponentiality.
A new nonparametric class of life distribution known as new better than renewal used in moment-generating function (
NBRUmgf) was proposed by Hassan and Said (2021) [
10,
11]. The
NBRUmgf class extends the concepts of
NBU and
NBUE by incorporating moment-generating functions, thus providing a more comprehensive framework for analyzing life distributions with various aging properties. Subsequently, two new test statistics were developed based on moment inequalities and the U-statistic, respectively, for testing exponentiality versus (
NBRUmgf). El-Arishy et al. (2019) have identified several classes, among which are renewal new better than used in moment-generating function (
RNBUmgf) [
12]; renewal new superior to that utilized in the Laplace transform order (RNBUL), as noted by Mahmoud et al. (2019) [
13]; new superior to that utilized in the Laplace transform (
), as noted by Mahmoud et al. (2018) [
14]; El-Arishy et al. (2017) discuss the application of “new better than renewal” (
) in the RP order [
15]; Al-Zahrani and Stoyanov (2010) [
16] discuss harmonic new better than renewal used in expectation (
); Elbatal (2009) discusses renewal new better than renewal used (
) [
17]; Mahmoud et al. (2008) [
18] discuss the new better-than-average failure rate (
) and the new better-than-used failure rate (
); Abdel-Aziz (2007) [
19] discusses renewal new better than renewal used in expectation (
); Mahmoud et al. (2004) [
20] discuss renewal new better than used; and Abouammoh et al. (1994) [
21] discusses renewal new better than renewal used classes (
).
The following is the paper’s composition: A novel category of life distributions known as new better than renewal is defined, and its relationships are used in the moment-generating function (
NBRUmgf) in
Section 2. In
Section 2, a test statistic computed using the Laplace transform technique is provided for evaluating exponentiality against
NBRUmgf. As a specific example, a test based on the goodness of fit approach is also suggested, and its properties are examined.
Section 3 calculates PAE and PARE for a few widely used reliability distributions. In
Section 4, we simulate the critical points of the Monte Carlo null distribution and tabulate the critical values of our two-test statistic.
For sample sizes
The power of two tests is also computed for a few widely used reliability distributions in
Section 5. In
Section 6, applications for full data are covered. In
Section 7, we finally provide a conclusion for our work.
3. Testing Exponentiality Versus NBRUmgf Class for Complete Data
This section tests the null hypothesis. Hypothesis
is exponential with mean
against an alternative hypothesis that
belongs to
and is not exponential. We draw a sample
from a population with distribution
F and use the symbol
as a measure of departure from exponentiality. According to Equation (7), the measure of departure from exponentiality based on the Laplace transform technique is defined by the following equation:
In the theorem below, the measure of departure from exponentiality for the NBRUmgf class is derived and assumed that every moment is temporary and exists.
Theorem 1. If X is a random variable with distribution function and relates to the NBRUmgf class, thenwhere Proof. Since
is
, then by multiplying Equation (7) by
and integrating both sides with respect to
over [0, ∞), we find
Let
, then
, and
, and then
;
Substituting from Equations (15) and (16) into Equation (9), we obtain Equation (10).
Note that under , while under . □
Corollary 1. If we set in Equation (10), then the following equation becomes the measure of departure from exponentiality based on the goodness of fit approach:and note that under , while under . 3.1. Test Statistic Empirical for NBRUmgf
To estimate
, let
be a sample selected at random from a distributed population
F. To make the test statistic
scale invariant, we set
Suppose that
denote the empirical distribution of the survival function
and the empirical estimate of
, respectively. We find
Note that
is not symmetric, and we define the symmetric kernel as
where the summation is over all arrangements of
; this leads to
corresponding to the U-statistic provided by the next equation (see Lee [
4]).
The asymptotic normality of may be summed up by the upcoming theorem.
Theorem 2. - (1)
is asymptotically normal with zero mean and variance where is given by - (2)
Under , the variance iswhere
Proof. First, as
, we have
and
Using the results of Serfling [
5], we note that as
has an asymptotically normal with a mean of zero and a variance of
which is given by
Recall the definition of
in Equation (19); then, it is easy shown that
From Equations (26) and (27), Equation (22) can be proved.
Under
, where
it is easy to prove that
and the variance
reduces to Equation (23). □
Corollary 2. If we option to in Equation (23), we obtain the variance in the case of goodness of fit approach as 3.2. Pitman’s Asymptotic Efficiency
In order to assess this procedure’s quality, Pitman asymptotic efficiencies (PAEs) of our test are computed for the alternative distributions below in the class (since they are in the ). Then, we perform comparison testing of various famous classes of life distribution with our suggested test based on PAEs.
- (i)
Linear failure rate distribution (LFR):
- (ii)
- (iii)
Note that, for
1,
decreases the exponential distribution, but in the case of
and
reduce to exponential distribution. The
is defined by
where
The
can be written as
Upon using Equations (28) and (29), we obtain the of these above three alternative distributions of our procedure, which are, respectively,
- (i)
Linear failure rate distribution (
:
- (ii)
Makeham distribution (
:
- (iii)
Weibull distribution (
:
By using Equations (30)–(32) and the Mathematica program 12.3, we obtain
Table 1 below, which shows our suggested test’s Pitman asymptotic efficiencies
for LFR, Makeham, and Weibull distributions at different values of
From
Table 1, it is shown that these alternative distributions have maximum values of
at
and minimum values at
In
Table 2, we display Pittman’s asymptotic efficiencies for the proposed test statistics
and other test statistics.
Using Equation (33), we obtain
Table 3 below, which illustrates our test statistics’ Pitman’s asymptotic efficiency (
) with respect to other test statistics (
T).
From
Table 2 and
Table 3, it is obvious that our test statistic is more efficient than other tests because
.
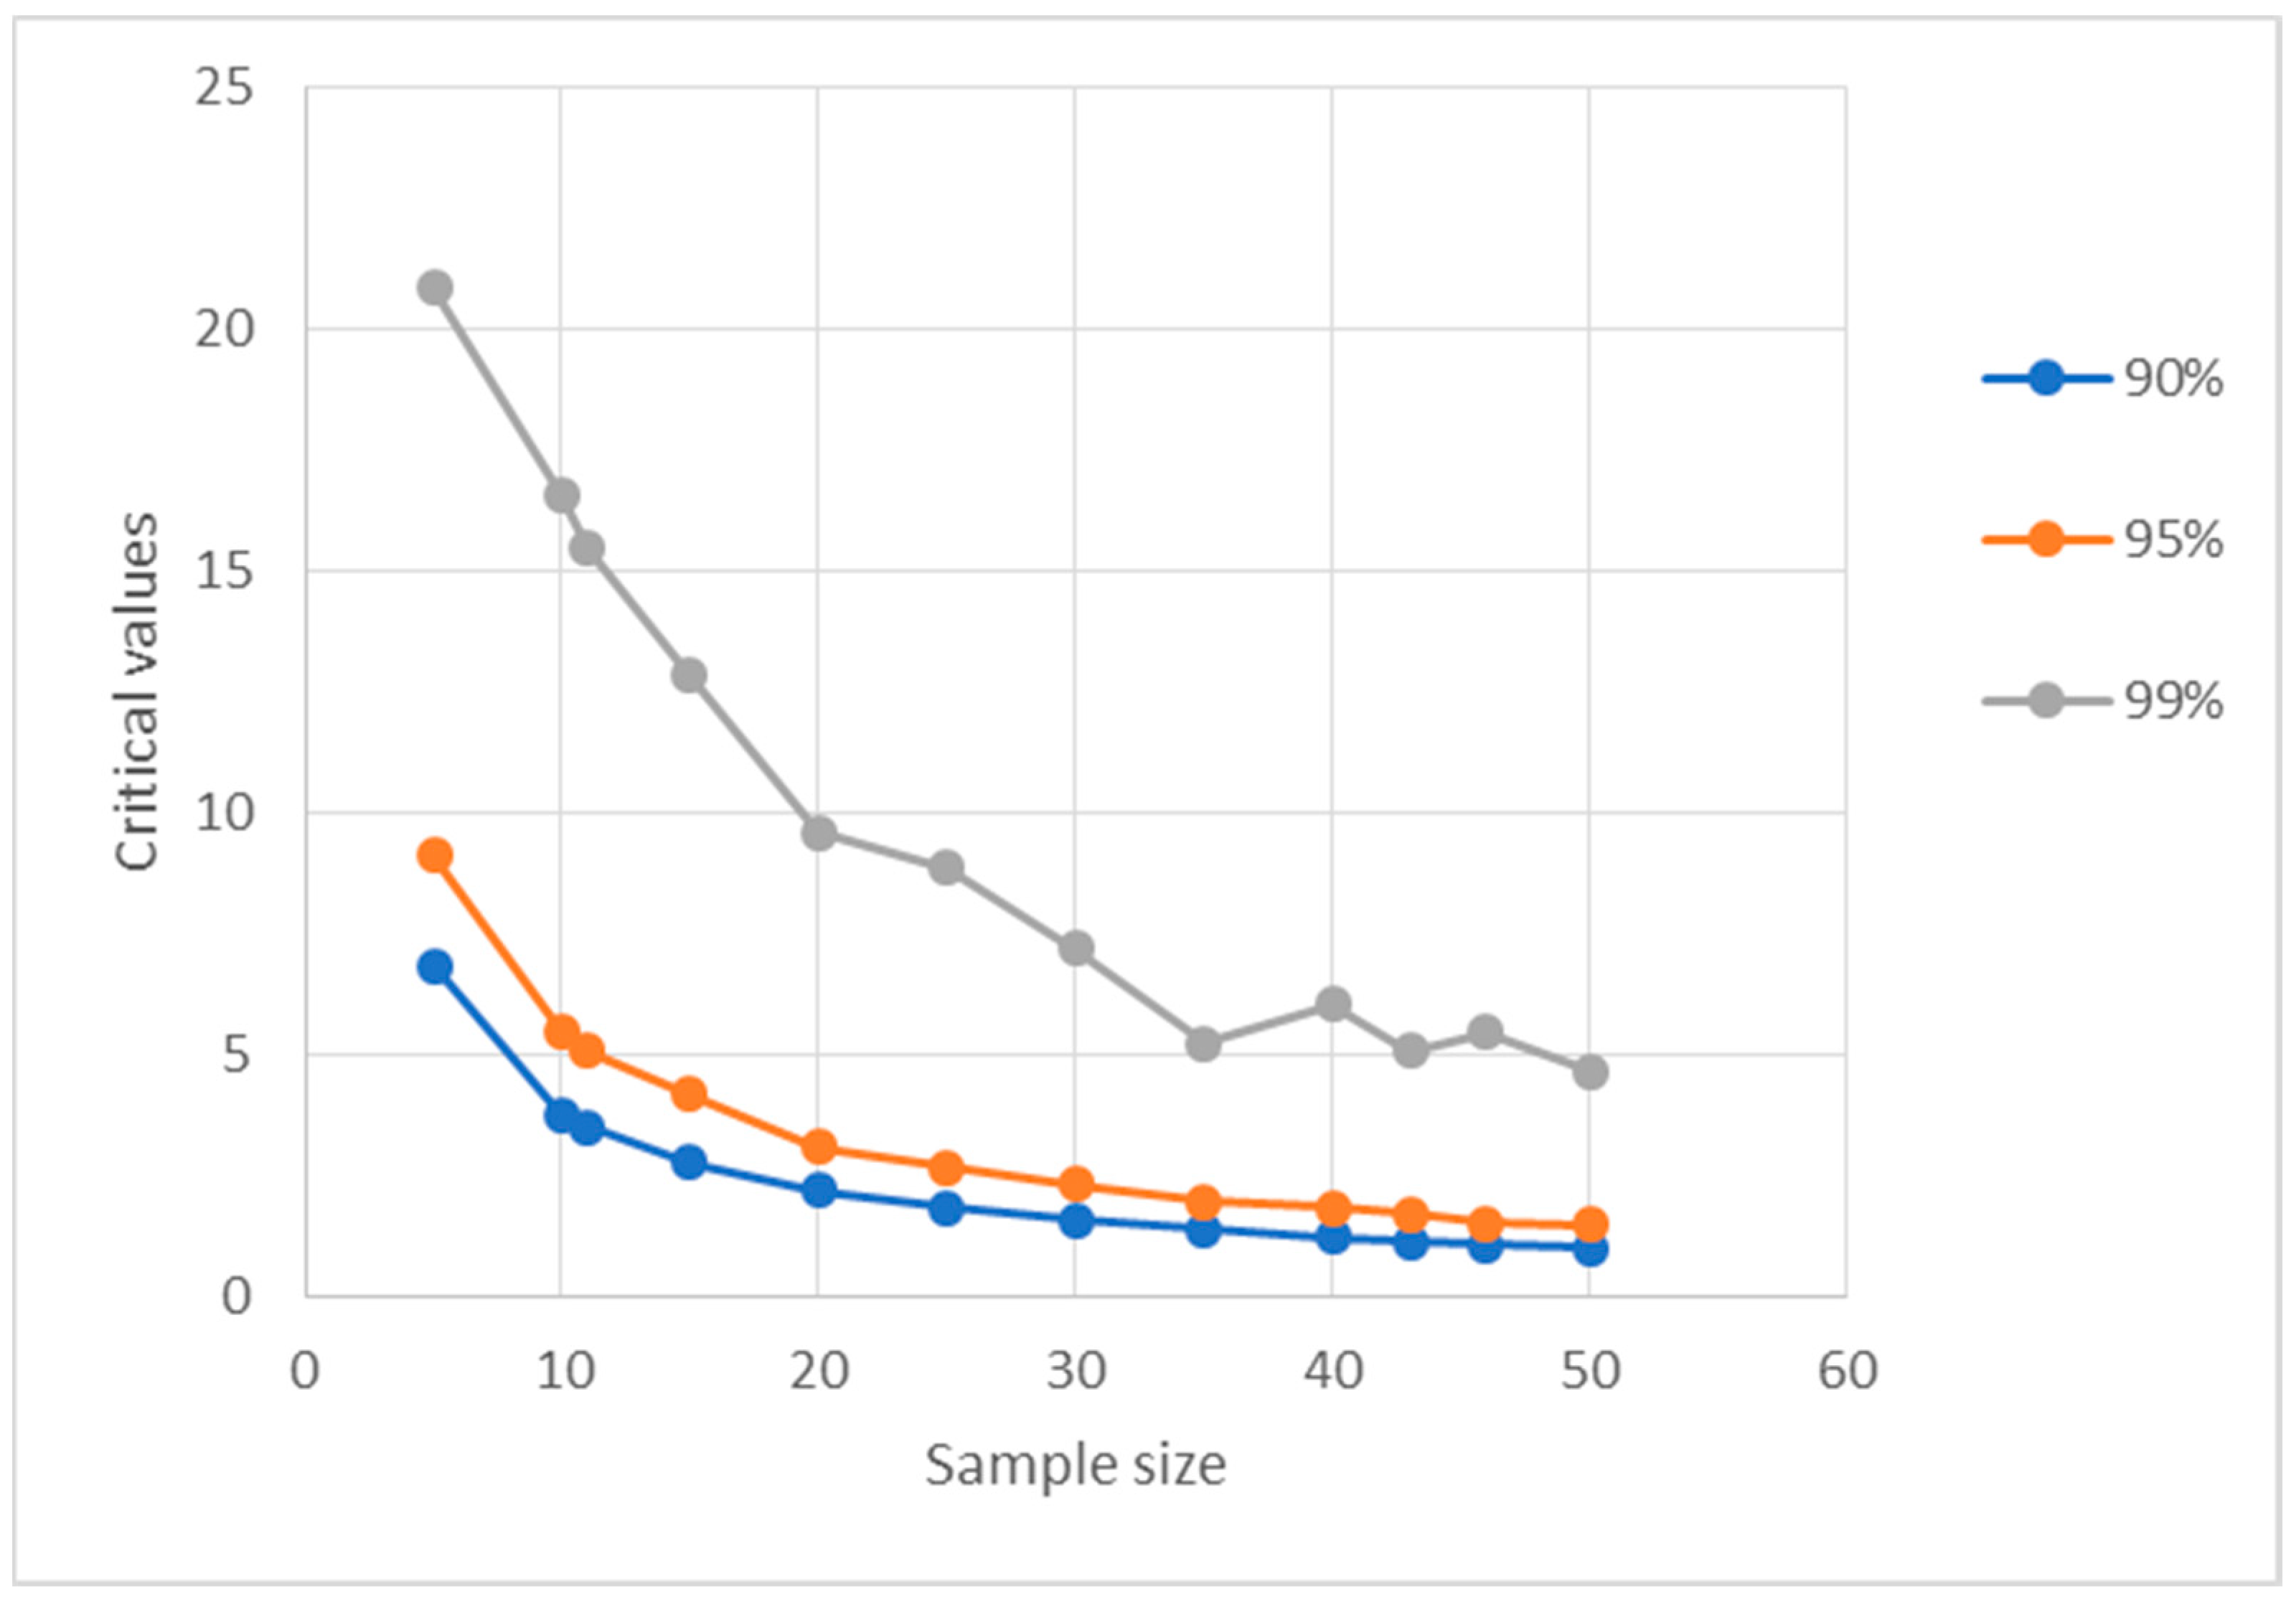
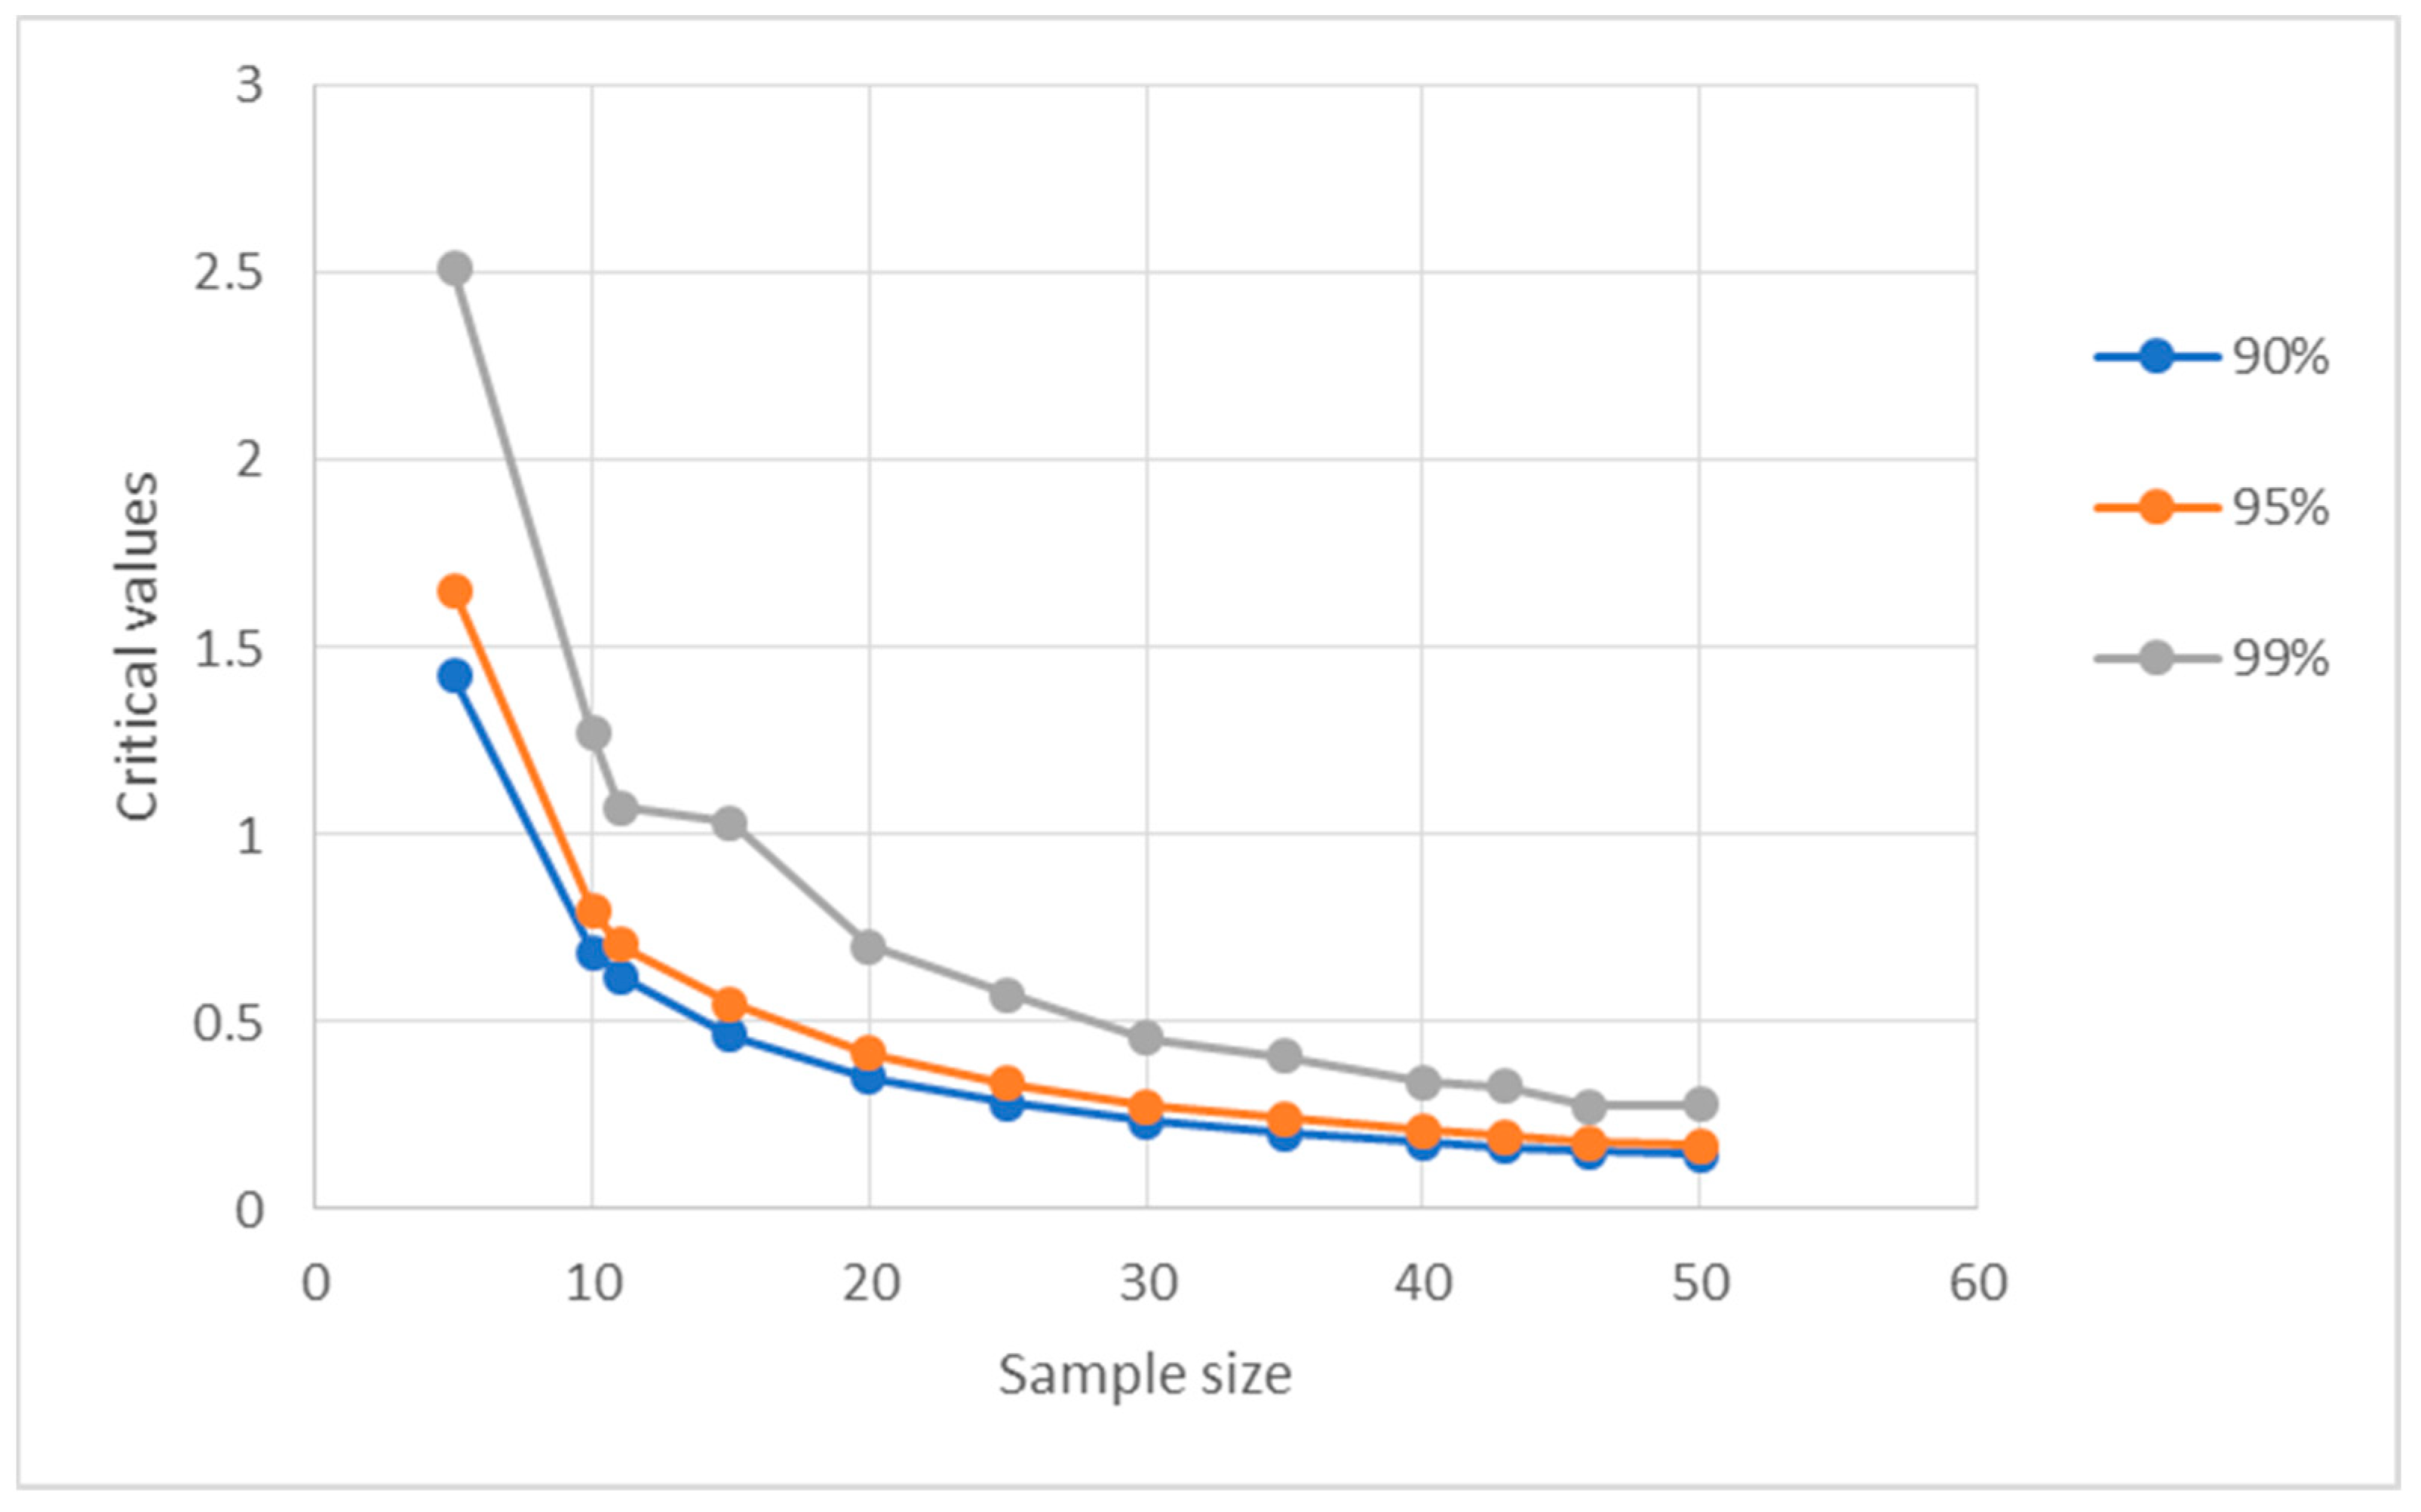
4. Critical Points of the Monte Carlo Null Distribution
The present part presents the Monte Carlo critical points for the null distribution for
in Equation (18), which are simulated based on 10,000 samples of sizes
from the standard exponential distributions using the Mathematica software 12.3.
Table 4 and
Table 5 provide the statistic’s upper percentile points.
with 10,000 replications at
and
respectively.
Observations reveal that the critical values in
Table 4 and
Table 5 increase as the confidence level rises and falls with the growing sample size, with the exception of
n = 40, 46 for a confidence level of 99% at
in
Table 4.
It is clear that the critical values in
Figure 1 and
Figure 2 rise with increasing confidence levels and fall with increasing sample sizes, with the exception of
n = 40, 46 for a confidence level of 99% at
in
Figure 1.
5. The Estimated Power
The power of a test is defined as the probability of rejecting when it is false. In the calculation of the power from simulated samples, we calculate the proportion of times is rejected when it is false. The power of is estimated at a confidence level of with suitable parameters of at . This is in regard to the three selections: failure rate in a linear approach and Makeham and Weibull distributions based on 10,000 replications.
From
Table 6 and
Table 7, it is clear that the power estimate of our test is good, and it increases when the value of the parameter
increases and the sample size
n increases for LFR, Makeham, and Weibull distributions. Note that the critical values in
Table 4 and
Table 5 increase as the sample size decreases. This means that the critical values increase when the value of the parameter
decreases. Therefore, the power shown in
Table 6 and
Table 7 decreases as the
approaches the exponential distribution, because the proportion of times
is rejected when it is false decreases with the decrease in sample size and the value of the parameter
.
6. Applications for Complete Data
In this section, we apply the test on some real data sets to elucidate the applications of the NBRUmgf at a 95% confidence level.
Data Set 1
Consider the data set below in Abouammoh et al. [
21], these statistics pertain to a group of forty Saudi Arabian Ministry of Health hospital patients with leukemia, a kind of blood cancer. In this case, we find
and
which is more than the critical values of 1.811924 of
Table 4 and 0.213249 of
Table 5, respectively, at the 95% upper percentile. Then, we accept
, the alternative hypotheses, which states that the data set has
NBRUmgfproperty and that it is not exponential.
| 0.315 | 0.496 | 0.616 | 1.135 | 1.208 | 1.263 | 1.414 | 2.025 | 2.036 |
| 2.162 | 2.211 | 2.370 | 2.532 | 2.693 | 2.805 | 2.910 | 2.912 | 3.192 |
| 3.263 | 3.348 | 3.348 | 3.427 | 3.499 | 3.534 | 3.767 | 3.751 | 3.858 |
| 3.986 | 4.049 | 4.244 | 4.323 | 4.381 | 4.392 | 4.397 | 4.647 | 4.753 |
| 4.929 | 4.973 | 5.074 | 4.381 | | | | | |
Data Set 2
Consider the following data set given in Grubbs [
22]. This data set provides the times between the arrivals of 25 customers at a facility. In this case, we find
and
which are greater than the critical values of 2.661309 from
Table 4 and 0.337393 from
Table 5, respectively, at the 95% upper percentile. Hence, we accept
which states that the data set has
NBRUmgf property, and it is not exponential.
| 1.80 | 2.89 | 2.93 | 3.03 | 3.15 | 3.43 | 3.48 | 3.57 |
| 3.85 | 3.92 | 3.98 | 4.06 | 4.11 | 4.13 | 4.16 | 4.23 |
| 4.34 | 4.37 | 4.53 | 4.62 | 4.65 | 4.84 | 4.91 | 4.99 |
| 5.17 | | | | | | | |
Data Set 3
Consider the following data set which has been given in Lawless [
23]. This data set shows the failure times, expressed in hours, for a particular kind of electrical insulation under continually rising voltage stress in an experiment. Here, we find
and
, which are less than the critical values of 5.054081 from
Table 4 and 0.708224 from
Table 5, respectively, at the 95% upper percentile. Hence, we accept the null hypothesis, which states that the data set has exponential property.
| 0.205 | 0.363 | 0.407 | 0.770 | 0.720 | 0.782 | 1.178 | 1.255 | 1.592 |
| 1.635 | 2.310 | | | | | | | |
Data Set 4
Consider the data set which has been given by Kots and Johnson [
24], which represents the survival times (in years) after the diagnosis of 43 patients with a certain kind of leukemia. In this case, we find
and
which are greater than the critical values of 1.700669 from
Table 4 and 0.195653 from
Table 5, respectively, at the 95% upper percentile. Hence, we accept
which states that the data set has
NBRUmgf property and is not exponential.
| 0.019 | 0.129 | 0.159 | 0.203 | 0.485 | 0.636 | 0.748 | 0.781 |
| 0.869 | 1.175 | 1.206 | 1.219 | 1.219 | 1.282 | 1.356 | 1.362 |
| 1.458 | 1.564 | 1.586 | 1.592 | 1.781 | 1.923 | 1.959 | 2.134 |
| 2.413 | 2.466 | 2.548 | 2.652 | 2.951 | 3.038 | 3.600 | 3.655 |
| 3.745 | 4.203 | 4.690 | 4.888 | 5.143 | 5.167 | 5.603 | 5.633 |
| 6.192 | 6.655 | 6.874 | | | | | |
The present paper deals with a hypothesis testing problem for testing exponentiality against the
class. Two empirical measures of departure from exponentiality
where
has been obtained by applying the Laplace transform technique and goodness of fit approach, respectively.
Authors in [
10,
11] dealt with a hypothesis testing problem for testing exponentiality against the
class. Two empirical measures of departure from exponentiality
and
were obtained by applying moment inequalities and the U-statistic, respectively.
All authors in the present paper [
10,
11] obtained the same result (they reject the null hypothesis) which states that data sets 1, 2, and 4 have the
NBRUmgf property and are not exponential (Large Data).
All authors in the present papers, refs. [
8,
10,
11,
13,
25], obtained the same result (they accept the null hypothesis) which states that data set 3 has the exponential property (Small Data). Also, all authors in [
7,
8,
9,
13,
25,
26,
27] obtained the same result (they reject the null hypothesis), which states that at least one of data set 1, data set 2, or data set 4 has the
UBAC(2)L,
NBUCmgf,
RNBUL,
NBUL,
ODL, and
NBURL properties, and are not exponential (Large Data), respectively.
All authors in [
14] obtained a different result (they accept the null hypothesis), which states that data set 2 has exponential property (Large Data), and also in [
28], they obtained a different result (they accept the null hypothesis), which states that data set 1 has the exponential property (Large Data.)
So, our test does not perform equally well in small and large samples.


