Next Article in Journal
The Generalized Fox–Wright Function: The Laplace Transform, the Erdélyi–Kober Fractional Integral and Its Role in Fractional Calculus
Next Article in Special Issue
A New Hybrid Improved Arithmetic Optimization Algorithm for Solving Global and Engineering Optimization Problems
Previous Article in Journal
A Note on the Convergence of Multigrid Methods for the Riesz–Space Equation and an Application to Image Deblurring
Previous Article in Special Issue
An Effective Method of Equivalent Load-Based Time of Use Electricity Pricing to Promote Renewable Energy Consumption
 
 
Due to scheduled maintenance work on our database systems, there may be short service disruptions on this website between 10:00 and 11:00 CEST on June 14th.
Article

Energy–Logistics Cooperative Optimization for a Port-Integrated Energy System

1
School of Electrical Engineering, Southeast University, Nanjing 210096, China
2
National Key Laboratory of Electromagnetic Energy, Naval University of Engineering, Wuhan 430033, China
3
School of Electrical Engineering, Naval University of Engineering, Wuhan 430033, China
*
Author to whom correspondence should be addressed.
Mathematics 2024, 12(12), 1917; https://doi.org/10.3390/math12121917
Submission received: 9 May 2024 / Revised: 18 June 2024 / Accepted: 19 June 2024 / Published: 20 June 2024
(This article belongs to the Special Issue Evolutionary Multi-Criteria Optimization: Methods and Applications)

Abstract

:
In order to achieve carbon peak and neutrality goals, many low-carbon operations are implemented in ports. Integrated energy systems that consist of port electricity and cooling loads, wind and PV energy devices, energy storage, and clean fuels are considered as a future technology. In addition, ports are important hubs for the global economy and trade; logistics optimization is also part of their objective, and most port facilities have complex logistics. This article proposes an energy–logistics collaborative optimization method to fully tap the potential of port-integrated energy systems. A logistics–energy system model is established by deeply examining the operational characteristics of logistics systems and their corresponding energy consumption patterns, considering ships’ operational statuses, quay crane distribution constraints, and power balances. To better represent the ship–energy–logistics optimization problem, a hybrid system modeling technique is employed. The case of Shanghai Port is studied; the results show that costs can be reduced by 3.27% compared to the traditional optimization method, and a sensitivity analysis demonstrates the robustness of the proposed method.

1. Introduction

A port comprises a logistics system and an energy system; the logistics system is the main area supplied by the energy system and consumes a considerable amount of energy [1]. Concurrently, ports have emerged as major contributors to air pollution [2]. Empirical data derived from ports situated within the Yangtze River Delta region indicate that approximately 64% of emissions can be attributed to berthed ships, while port machinery and the transportation infrastructure contribute to 16% of the emissions. Given these circumstances, energy conservation and emission reductions in ports are urgent.
From the energy consumption perspective, using a shore-based power supply to replace high-emission ship auxiliary engines during ship berthing [3,4,5] expands the connection between ships and ports from the logistics system to the energy system, achieving coupling between the two subsystems. A Combined Cooling, Heating, and Power (CCHP) system, as the primary energy supply equipment powered by fossil fuels, using natural gas as a fuel can not only generate electricity and heat energy, but can also cool when necessary. A CCHP system can be used to reduce energy consumption and control pollutant emissions with a very high energy efficiency of up to 75%, which is about 24% higher than traditional energy units [6]. Hydrogen, termed ‘green hydrogen’ when produced by renewable energies, is a versatile, potentially zero-emission fuel that can be used to power ships, as well as a range of port equipment and vehicles [7]. Giri and Roy [8,9] and Lei et al. [10] propose a renewable energy supply chain that utilizes power to hydrogen (P2H) and a methanation device (MR) as an energy supply. This not only achieves the consumption of renewable energy, but also achieves the goal of carbon reduction. Chavan et al. [11] propose fuel cell (FC) power generation, which is efficient and environmentally friendly. Combined with hydrogen production equipment based on electrolysis, it can help improve the consumption rate of renewable energy. Holder et al. [7], Kelmalis et al. [12], and Zhang et al. [13] propose the electrification of logistics equipment, which will also help to improve the consumption rate of renewable energy. From the perspective of energy production, ports utilize abundant renewable energy sources such as wind and light to generate electricity and integrate multiple forms of energy, combined with electrical coupling [14,15] and electric thermal coupling [16,17,18,19], to form an integrated energy supply system, which can effectively improve the energy efficiency and renewable energy consumption and reduce air pollution and carbon emissions [20,21].
From the perspective of improving the efficiency of logistics systems, Ren [22] established a mathematical model based on the principle of minimizing the ineffective operation time and analyzed the advantages and disadvantages of the “operation line” and “operation surface” scheduling modes for container trucks. Their experiment found that the “operation surface” scheduling mode shortened the average waiting time by 33% compared to the “operation line” scheduling mode. Borelli et al. [23] use the lowest cost of delay to minimize the total ship service time by considering berth productivity under a given berth schedule. Aljuaid et al. [24] adopt a mixed-integer linear programming model, aiming to minimize the waiting time of ships at ports and improve the efficiency of ship entry and exit. Song et al. [25] propose a joint berth allocation and dock crane allocation model. Kovač et al. [26] aim to minimize the total service time of fully electric ships and developed an optimal berth allocation model, which is solved using the particle swarm optimization method.
The above methods only consider the individual optimization of the port energy system and logistics system and do not consider the logistics system’s impact on the energy system. As a matter of fact, the electricity consumption of the port logistics system accounts for more than 70% of the energy system, and there is a vast space for efficiency optimization. Different logistics scheduling schemes correspond to different energy consumption needs. A reasonable logistics scheduling scheme can effectively promote the operation optimization of the port energy system and improve the energy efficiency of the port [27,28].
More research is needed on the collaborative optimization of port logistics and energy systems. Shi et al. [29] propose a future port microgrid architecture that combines logistics and energy systems but does not provide a specific logistics–energy collaborative optimization method. A logistics and energy collaborative optimization strategy is constructed based on the demand response, and the results validate that the proposed strategy is effective for coordinating multi-energy and logistics scheduling and minimizing port operation cost [28]. Lassoued and Elloumi [30,31] investigate two crucial problems in ports, which are the berth allocation problem and the quay crane assignment problem. The optimization objective is to minimize the total service time of berthed vessels. Wang et al. [4] conduct in-depth research on the joint optimization of berth allocation and port energy supply and established an energy supply model for a port-integrated energy system (PIES) that considers multi-energy collaboration and berth optimization. In addition, traditional logistics systems mainly focus on the scheduling of berths, quay cranes, and ships to achieve optimal logistics costs without considering the energy usage of ships after connecting to shore power, resulting in the decoupling of logistics and energy systems [32,33]. At the same time, the lack of corresponding coordination and optimization methods has led to an increase in port operating costs and a decrease in energy efficiency.
Regarding modeling methods, the current optimization of port emission reductions mainly includes intelligent optimization algorithm-solving models, rule-based optimization models, mixed-integer programming models, etc. Wang [34] introduced the mutation operator from the differential evolution algorithm into the NSGA-II algorithm, obtaining a mixed differential NSGA-II algorithm, using this to obtain the optimal solution that minimizes the scheduling time of ships entering and exiting the port. An adaptive immune clone selection algorithm has been developed based on the mixed-integer programming model to minimize port operating costs to the greatest extent possible [4]. A distributed algorithm based on Benders decomposition embedded with an improved non-dominated sorting genetic (INSGA-II) algorithm is designed to realize the optimal collaboration of a PIES’s energy outputs and port container logistic system energy demands in a port [35]. Shi et al. [29] use a mixed-integer linear programming model; numerical simulations were carried out verify that the proposed strategy can minimize the total cost of the integrated energy–logistics system and increase the utilization rate of renewable energy systems for green ports. Jiang et al. [36] innovatively propose a nonlinear mixed-integer programming formula to obtain the optimal mode of berth and quay bridge collaborative optimization in ports under uncertain conditions. Yu et al. [37] aim to minimize cranes’ carbon emissions and operating costs. A hybrid non-inferior sorting genetic algorithm based on a simulated annealing algorithm is used to solve the yard crane scheduling problem, and the analytic hierarchy process is used to select an optimal solution. However, most coupling variables are simplified or not considered; for example, operation optimization of a PIES in the studies by Mao et al. [38], Yang et al. [39], and Zhen et al. [40] does not consider some coupling variables, such as the electrical load of quay cranes and moored ships. This research offers the following significant, novel contributions.
Abandoning the traditional operation mode of optimizing logistics and energy systems separately and introducing collaborative optimization between the two further improves the flexibility of port operation.
Adopting a hybrid system modeling method can decouple and finely describe coupling constraints by increasing the number of variables.
The model that has been suggested will bring considerable economic benefits to ports and has broad application prospects as proven by a case study on the collaborative optimization of logistics and energy systems in a port in Shanghai.
The structure of the paper is as follows: The related works that support the research in the proposed study are presented in Section 2. In Section 3, the port system is described. In Section 4, the problem statement and model formulation are discussed.
The objective function, balance, and model solution are shown in Section 5. Section 6 contains descriptions of the suggested model’s comparative verification and sensitivity analysis. Section 7 presents the managerial ramifications of the proposed study. Finally, some limitations and future study directions are included in the concluding remarks found in Section 8.

2. Related Works

In this study, a summary of relevant studies is provided for three topics: (i) logistics system scheduling models, (ii) logistics system load models, and (iii) energy production models.

2.1. Logistics System Scheduling Model

This section mainly analyzes the composition of the port logistics system, including two parts: ships and quay cranes. Then, based on the scheduled arrival time of ships, the loading and unloading volumes of goods, and quay crane constraints, the logistics system model is constructed to obtain the ship-in-port state and quay crane operation state models.

2.2. Logistics System Load Model

This section introduces the load composition of the logistics system, including the electrical load caused by the operation of the shore bridge and the connection of the ship to the shore power. The operation status of the shore bridge is consistent with the port status of the ship, and the ship itself includes both a constant power load and a variable power load. The variable power load needs to reach its rated workload during the ship’s berthing period.

2.3. Energy System Model

The energy system section introduces the energy facilities related to the port, covering power generation equipment and hydrogen production and storage equipment. The energy system provides the necessary electricity for the port logistics system.

2.4. Literature Analysis and Motivations

The literature review indicates that many studies have been conducted on ports from multiple perspectives such as berth optimization [23,24,30,31], logistics scheduling [36,38], and energy supply [5,6]. However, there is still relatively little research on the collaborative optimization of logistics and energy systems. There is still a lack of relevant sensitivity analyses for collaborative optimization systems of ports.
  • Motivation: To overcome this drawback and achieve optimal operating costs for the port, we construct a collaborative optimization model for logistics and energy systems and conduct relevant research and a sensitivity analysis using a port in Shanghai as an example. The results verify the effectiveness of the proposed optimization method in port energy conservation and emission reductions.
Although the published papers include the utilization of renewable energy, they have not achieved maximum use [7,9]. This is unfavorable for the development of green and low-carbon ports.
  • Motivation: To address this challenge, efforts should be made to promote the development of ports in a green and low-carbon direction. In this model, we introduce a renewable energy consumption system, and the intermittency of renewable energy leads to its low direct utilization rate. The introduction of P2H technology, MR, and hydrogen storage (HS) tanks absorbed some of the remaining renewable energy, thereby maximizing the consumption of renewable energy.
According to the related works in Section 1 and Table 1, we have learned about some optimization scheduling algorithms for PIESs. However, for situations with a large number of decision variables, their solving speed will become very slow, making it difficult to meet the needs of online scheduling.
  • Motivation: To overcome the problems of a slow model solving speed and a low solving accuracy, in this study, we construct a hybrid system modeling method that decouples and finely describes coupling constraints by increasing the number of variables, ultimately achieving fast and high-precision model solving. Compared with traditional modeling methods, this method leads to significant improvements in running speed and accuracy.

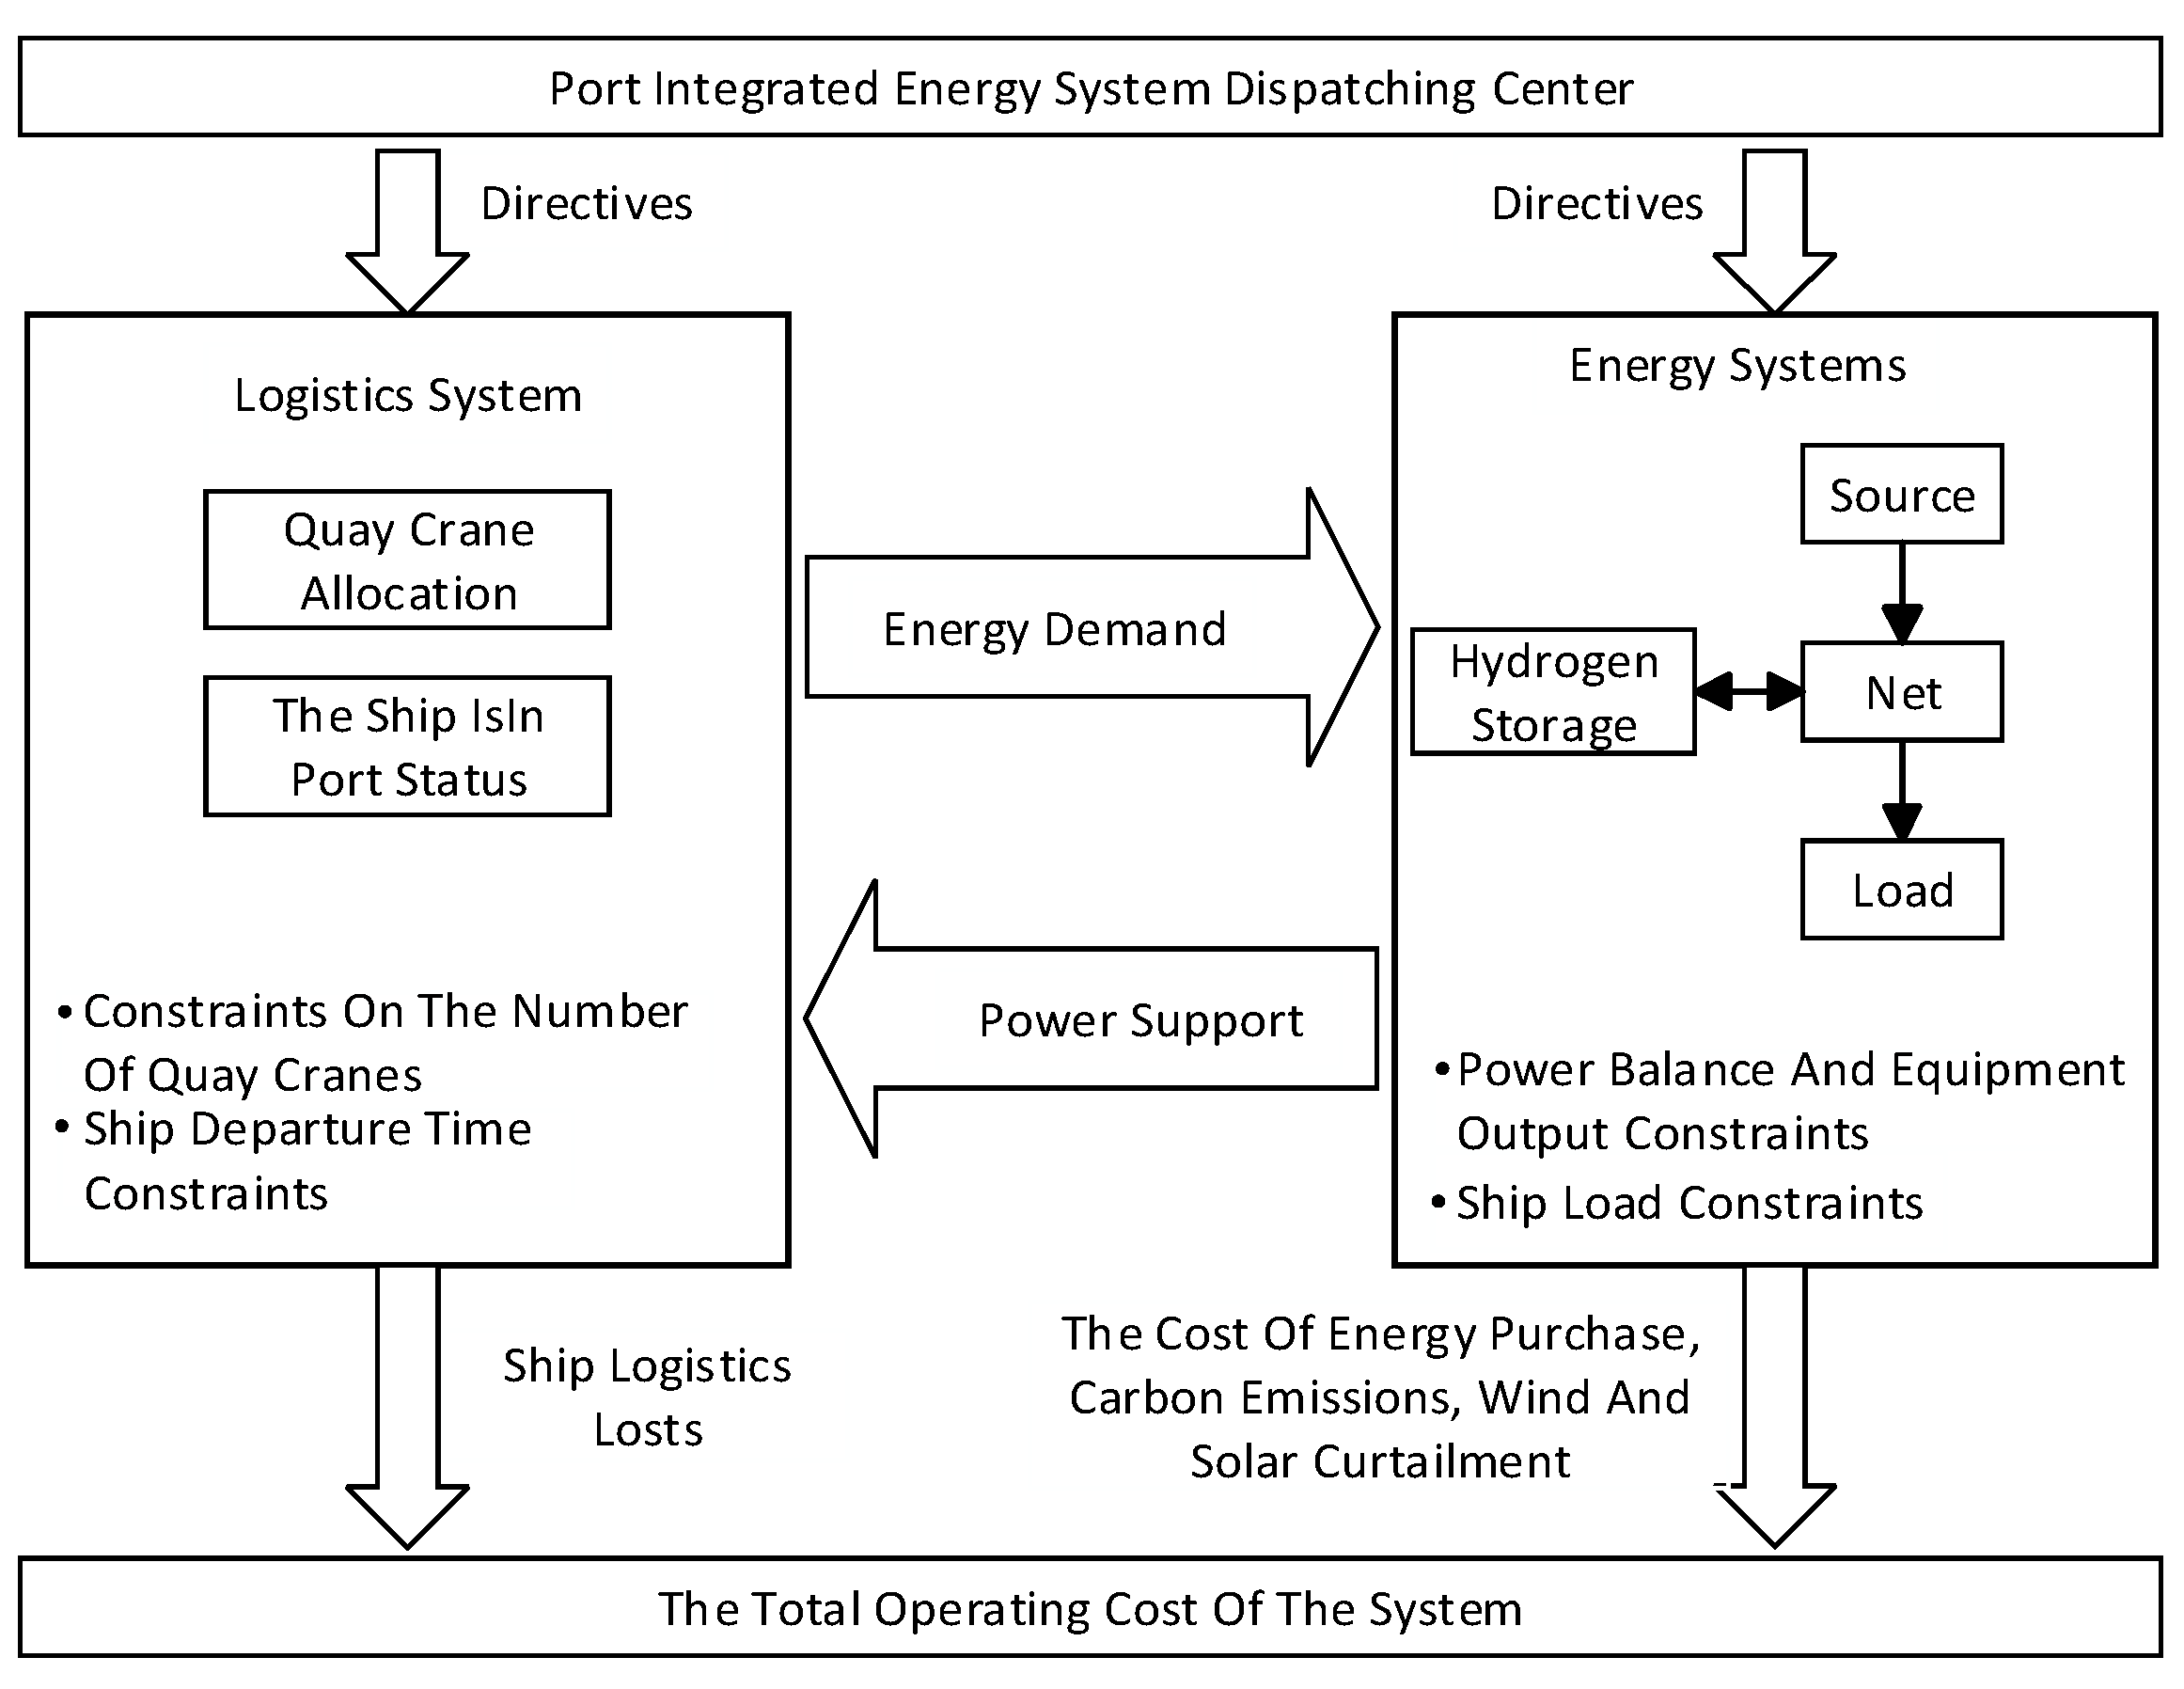
3. System Description

3.1. Description of the Port-Integrated Energy System

The PIES consists of a logistics system and an energy system, as shown in Figure 1. The concept of an integrated energy system, rooted in the energy hub (EH) model, includes the energy supply, energy conversion, and load sides. The logistics system not only performs logistics scheduling but also serves as a part of the load of the energy system. The two subsystems are coupled, forming a PIES that provides integrated logistics and energy services for ports and ships calling at ports. The energy supply side includes the main power grid, main gas grid, wind turbines (WTs), and photovoltaics (PV). The EH includes power grids, natural gas networks, heating networks, and various energy conversion equipment, ultimately achieving energy coupling and conversion. The inherent intermittency and peak–valley disparities associated with renewable energy generation, as identified within the scope of this discourse, present considerable challenges to traditional energy storage mechanisms which are only capable of partially mitigating these fluctuations. In light of this, the integration of hydrogen-based energy storage solutions is proposed, leveraging the expansive potential of hydrogen energy within ports. The load side includes port cooling and heating, civil electricity, and ship and quay crane loads. The dispatch center coordinates ships entering and leaving the port and the allocation of quay cranes, as well as the output of various energy equipment and the start and stop status of ship equipment, to ensure the coordinated and orderly operation of the port energy–logistics system. Among them, ships and quay cranes are the key to connecting the port logistics system and energy system. After berthing, the port operator arranges for the quay cranes to load and unload goods for ships immediately, and the corresponding quay cranes will stop operating after the ships leave the port. Based on this, we can achive logistics interaction between ships and ports. Meanwhile, shore-based power supply realizes energy interaction between ships and ports.
The logistics system aims to minimize the waiting and berthing time of ships. By scheduling ships entering and leaving the port and allocating quantities of quay cranes, this goal is achieved, facilitating the prompt berthing of awaiting ships, ensuring the swift departure of docked ships, and improving the operational efficiency of the logistics system. The impact of ships berthing at port on the port energy system is as follows: after the ship and the port are connected through shore power, this directly brings the shore power load to the port power grid, and the distribution of the shore power load in time is determined by the ship’s state in port. At the same time, by dispatching a certain number of quay cranes, ships berthing at the port indirectly increase the power load of the quay cranes, increasing the energy consumption of the logistics and energy systems and the overall operating cost of the system.
To decrease the energy consumption and operating cost, it is necessary to coordinate the operation of the energy system with the logistics system as the center. Based on fully considering the constraints of logistics scheduling through the reasonable scheduling of quay cranes and ships entering and leaving the port, and at the same time coordinating the output of various equipment in the energy system, the coordination and cooperation of the energy system with the logistics system can be realized, so that the ships and the quay cranes can flexibly adjust their loads based on completing logistics scheduling, at the same time allowing for the substitution of different types of energy, improving the flexibility and economy of system operation, promoting the consumption of renewable energy and reducing carbon dioxide emissions.

3.2. Description of the Modeling Method

The optimal scheduling of the PIES is a complex mixed-integer optimization problem, which contains real, integer and binary variables. Conventional optimization methodologies solve this problem but will encounter significant challenges in delivering rapid and precise solutions, particularly in instances characterized by a large number of decision variables inherent to the optimization and scheduling processes of PIESs. This complexity invariably results in diminished solution speeds, making it challenging to meet the solving needs of online scheduling. In light of these challenges, this article introduces the mixed logical dynamical (MLD) model to build a complex port framework. As first introduced by Bemporad and Morari [41], the MLD system modeling framework combines continuous and binary variables with logical relations in mixed-integer inequalities to express complex dynamic systems. It has been shown in work by Bemporad and Morari [41] and Heemels et al. [42] that such a framework can be used to model systems that have mixed continuous and discrete states and inputs, piece-wise affine and bilinear dynamics, finite state machines, qualitative outputs, and those with any combination of the former.
In addition, the optimization method based on Yalmip Toolbox was used by Liu et al. [43] and Xu et al. [44], which is adept at handling a plethora of standard optimization issues, including but not limited to linear programming, integer programming, nonlinear programming, mixed programming, and linear matrix inequalities (LMIs). Through its compatibility with CPLEX, various algorithms such as branch and bound and cutting plane algorithms are integrated, which can facilitate the efficient, rapid, and accurate derivation of solutions that align with the exigencies of online scheduling demands.

4. Energy–Logistics Integrated Systems Modeling

4.1. Logistics System Scheduling Model

Port logistics services are realized by dispatching a certain number of quay cranes to load and unload goods for ships berthing at the port, and the number of different quay cranes allocated is directly related to the time of ships in port, which in turn affects the status of ships in port. Therefore, establishing a relationship between the allocation quantity of quay cranes, the duration of ship berthing, and the ship’s state in port is the basis for the optimal scheduling of the logistics system.

4.1.1. Ship Berthing Time Model

Ships will inform the port before they arrive so that the ships’ arrival times are known. Ships do not dock immediately upon arrival at the port but wait in the waiting area for port dispatch. The relationship between the arrival time, the berth time, and the departure time of the ship is shown in Equation (1), where the departure time of the ship is determined by the port berth time, the loading and unloading volume of the ship and the number of allocated quay cranes, as shown in Equation (2):
t 0 t 1 t l e a v e
t l e a v e = t 1 + N j η C j
Port dispatch requires ships to leave before the latest departure time, and the number of quay cranes that ships can carry limits the departure time of ships, keeping the departure time within a specific range, as shown in Equations (3) and (4):
t l e a v e min t l e a v e t l e a v e max
t l e a v e min = t 1 + N j η C j max t l e a v e max = min t 1 + N j η C j min , t l e a v e l a t e s t

4.1.2. Ship-in-Port State Model

Equations (1)–(4) depict the relationship between ships’ arrival, berthing, and departure times and the allocation quantity of quay cranes. At the same time, ships’ berthing and departure times determine their states in port. A ship’s state in port is not only the basis for logistics scheduling but also the basis for energy system load modeling. The state of ship j in port is Xj(t), which is a variable of 0–1; the state in port before and after the ship docks at the port is 0, and the state in port during the port call is 1. In a single scheduling cycle, the ship’s state in port is
X j ( t ) = 0 , t [ 1 , t 1 ] 1 , t [ t 1 , t l e a v e ] 0 , t [ t l e a v e , T ]
From the beginning of the scheduling cycle to the end of the scheduling cycle, the total berthing time of the ship will be equal to the actual port call time:
t = 1 T X j ( t ) Δ t N j η C j t = 1 T X j ( t ) Δ t N j η C j + Δ t
The ship arrives at the port only once during the dispatch cycle and does not return after leaving the port:
X j ( t ) X j ( t + 1 ) , t [ t 1 , T 1 ]

4.1.3. Port Logistics Constraint Mode

The relationship between the ships’ states in port and the number of quay cranes allocated constitutes the fundamental constraint for logistics system scheduling. In addition, due to limitations in ship length and loading and unloading capacity, the number of quay cranes that can be carried is limited, and the allocation of quay cranes cannot exceed the minimum and maximum quay crane demand limits of the ship, as shown in Equation (8); at the same time, due to the limited resources of the dock quay cranes, the total number of operating quay cranes at a particular time cannot exceed the total amount of quay cranes resources Cmax, as shown in Equation (9):
C j min C j C j max
j = 1 n X j ( t ) C j C max
Based on Equations (1)–(9), the status of ships in port is adjusted by scheduling their berthing time and the number of quay cranes, and the coordination and interaction between quay cranes and ships at the logistics level are realized.

4.2. Logistics System Load Model

4.2.1. Quay Crane Load Model

Before the ship departs, the quay crane serves the same ship, and loading and unloading will not stop during the working period.
According to Equations (5)–(8), the number of quay crane operations during time t is obtained, and then the electrical load of the quay crane during time t is calculated.
P c r a n e ( t ) = j = 1 n P c r a n e 1 C j X j ( t )

4.2.2. Ship Load Model

The ship load includes the propulsion, service, and loading and unloading. During berthing, the propulsion load is deactivated. Only the service and loading and unloading loads are operational, including lighting systems, kitchen equipment, air conditioning and refrigeration equipment, communication equipment, ventilation equipment, entertainment equipment, various pumps, other service equipment, and loading and unloading equipment such as cargo lifters. The equipment mentioned above is divided into two categories according to the operation characteristics: one category is equipment that operates continuously during the ship’s berthing period, such as lighting equipment, air conditioning, and refrigeration equipment, which belongs to the constant power load and the other type is intermittent working equipment that controls the start and stop based on the energy demand of ships, such as water pumps, kitchen electrical equipment, etc., which belongs to the variable power load.
To mitigate the carbon emissions generated by ship power generation, after the ship docks, all the ship’s load is supplied by shore power. The ship’s total energy consumption bifurcates into constant and variable power loads. The constant power load, the ship’s foundational energy requirement, remains stable throughout the docking period. Conversely, the variable power load is a combination of the energy consumption of assorted intermittent operational equipment onboard:
L s h i p ( t ) = L c o n s ( t ) + L var ( t ) L var ( t ) = i = 1 m L var , i ( t ) L c o n s ( t ) = L b a s e X ( t )
The 0–1 variable si(t) is used to represent the start/stop states of intermittent working equipment i; si(t) = 1 indicates that the equipment is on and si(t) = 0 indicates that the equipment is off. Only considering the start and stop of intermittent work equipment during the ship’s berthing period, each type of intermittent work equipment will complete its rated workload and will not exceed its power upper and lower limits during operation:
s i ( t ) X ( t )
t = t 1 t l e a v e L var , i ( t ) Δ t = W var , i
s i L var , i min L var , i ( t ) s i L var , i max
P s h i p ( t ) = j = 1 n [ L c o n s , j ( t ) + L var , j ( t ) ]
The load model of the logistics system includes information on ships’ states in port, a crucial variable reflecting port logistics scheduling. Therefore, this model can simultaneously reflect the operational characteristics of logistics and energy systems. Ships change their states in port by entering and leaving the port, bringing a certain amount of shore power load to the port at the same time. This affects the distribution quantity and load size of quay cranes, thereby changing the energy consumption and equipment output of the entire energy system and achieving interactive coupling between the logistics system and the energy system.

4.3. Energy System Model

4.3.1. Combined Cooling, Heating and Power

CCHP consists of a gas turbine (GT) and a lithium bromide absorption refrigeration machine (AC). The GT uses natural gas as a raw material for power generation while recovering high-temperature flue gas to generate heat. Its thermoelectric relationship is shown in Equations (16) and (17):
P C C H P , G T e = C O P C C H P , G T e Q C C H P
P C C H P , G T h = ( 1 C O P C C H P , G T e C O P C C H P , G T h , l o s s ) C O P C C H P , G T h , r e cov e r y C O P C C H P , G T h Q C C H P
The refrigeration power of AC is shown in Equation (18):
P C C H P c = C O P A C c ( P C C H P , G T h P C C H P h )

4.3.2. Gas Turbine

When the capacity of the CCHP system cannot meet the heat demands of the port, the GT needs to be used for heating. The GT can produce a fixed proportion of electrical power while heating, and its electric heating model is as follows:
P G T e = C O P G T e Q G T
P G T h = C O P G T h Q G T

4.3.3. Fuel Cell

The FC uses hydrogen as a raw material, which is environmentally friendly. It can make up for electricity shortages at the port.
P F C = M F C C O P F C

4.3.4. Photovoltaics and Wind Turbine

PV and the WT, as clean energy sources, play a crucial role in energy conservation and emission reductions in ports [36]. In addition, they can also reduce port operating costs. Therefore, it is particularly important to fully utilize them.

4.3.5. Power to Hydrogen

Due to the high uncertainty of new energy generation, phenomena such as wind and solar power abandonment are often inevitable in the actual operation of port energy systems. P2H technology can be used in PIESs to convert wind power into hydrogen for storage and utilization.
M P 2 H = C O P P 2 H P P 2 H

4.3.6. Hydrogen Storage

HS can improve the utilization of energy over time and coordinate the imbalance between sources and loads. The HS device in this article can be used in conjunction with P2H to achieve the storage and utilization of hydrogen gas. By optimizing the storage behavior of hydrogen systems, better services can be provided to hydrogen equipment.
M H S , t = M H S , t 1 + M H S , t i n C O P H S i n M H S , t o u t / C O P H S o u t , t 1

4.3.7. Methanation Device

The MR can be used to convert hydrogen produced by P2H into methane, providing fuel for natural gas power generation equipment in the PIES.
Q M R = M M R C O P M R

5. Energy–Logistics Optimization

5.1. Objective Functions

The optimization strategy proposed in this paper aims to minimize the operating cost of the energy–logistics coupling system and realize the economic operation of the port through the collaborative optimization of the logistics and energy systems. System operating costs include energy purchase costs (natural gas purchases and power purchases from the grid) Cbuy, wind and solar curtailment penalties, Closs, carbon emission costs, Cco2, and ship logistics costs, Cship:
min C b u y + C l o s s + C s h i p + C c o 2

5.2. Balance Model

(1) Electrical power balance
P g r i d + P W T + P P V + P F C + P C C H P + P G T = P l o s s W T + P l o s s P V + P l o a d + P s h i p + P c r a n e + P P 2 H
where Pgrid, PWT, PPV, PFC, PCCHP, PGT and P l o s s W T , P l o s s P V , Pload, Pship, Pcrane, PP2H are, respectively, the power of main power grid, wind turbine, photovoltaic, FC, CCHP, GT, and abandoned wind and photovoltaic power, civilian power load, ship shore power, quay crane load, and P2H power.
(2) Heat load balancing
H G T + H C C H P = H l o a d
(3) Cooling load balancing
L C C H P = L l o a d
(4) Hydrogen balance
M P 2 H = M H S i n + M M R
M H S o u t = M F C
Equation (30) indicates that the hydrogen released from the hydrogen storage tank is supplied to the FC for power generation.
(5) Natural gas balance
Q g a s + Q M R = Q C C H P + Q G T

5.3. Model Solving

Figure 2 shows the energy–logistics collaborative optimization scheduling mode of the PIES. The dispatch center coordinates the logistics and energy systems by issuing instructions. The logistics system dispatches the number of quay crane allocations and the ships’ states in port, and inputs the energy demand of ships at shore and the quay crane load into the energy system. The energy system optimizes and schedules the output of each energy equipment based on power balance, equipment output, and ship load constraints, and it provides power support for the logistics system. Through the coupling interaction between the two systems, an optimal total operating cost is achieved, showcasing the efficacy of this integrated approach.

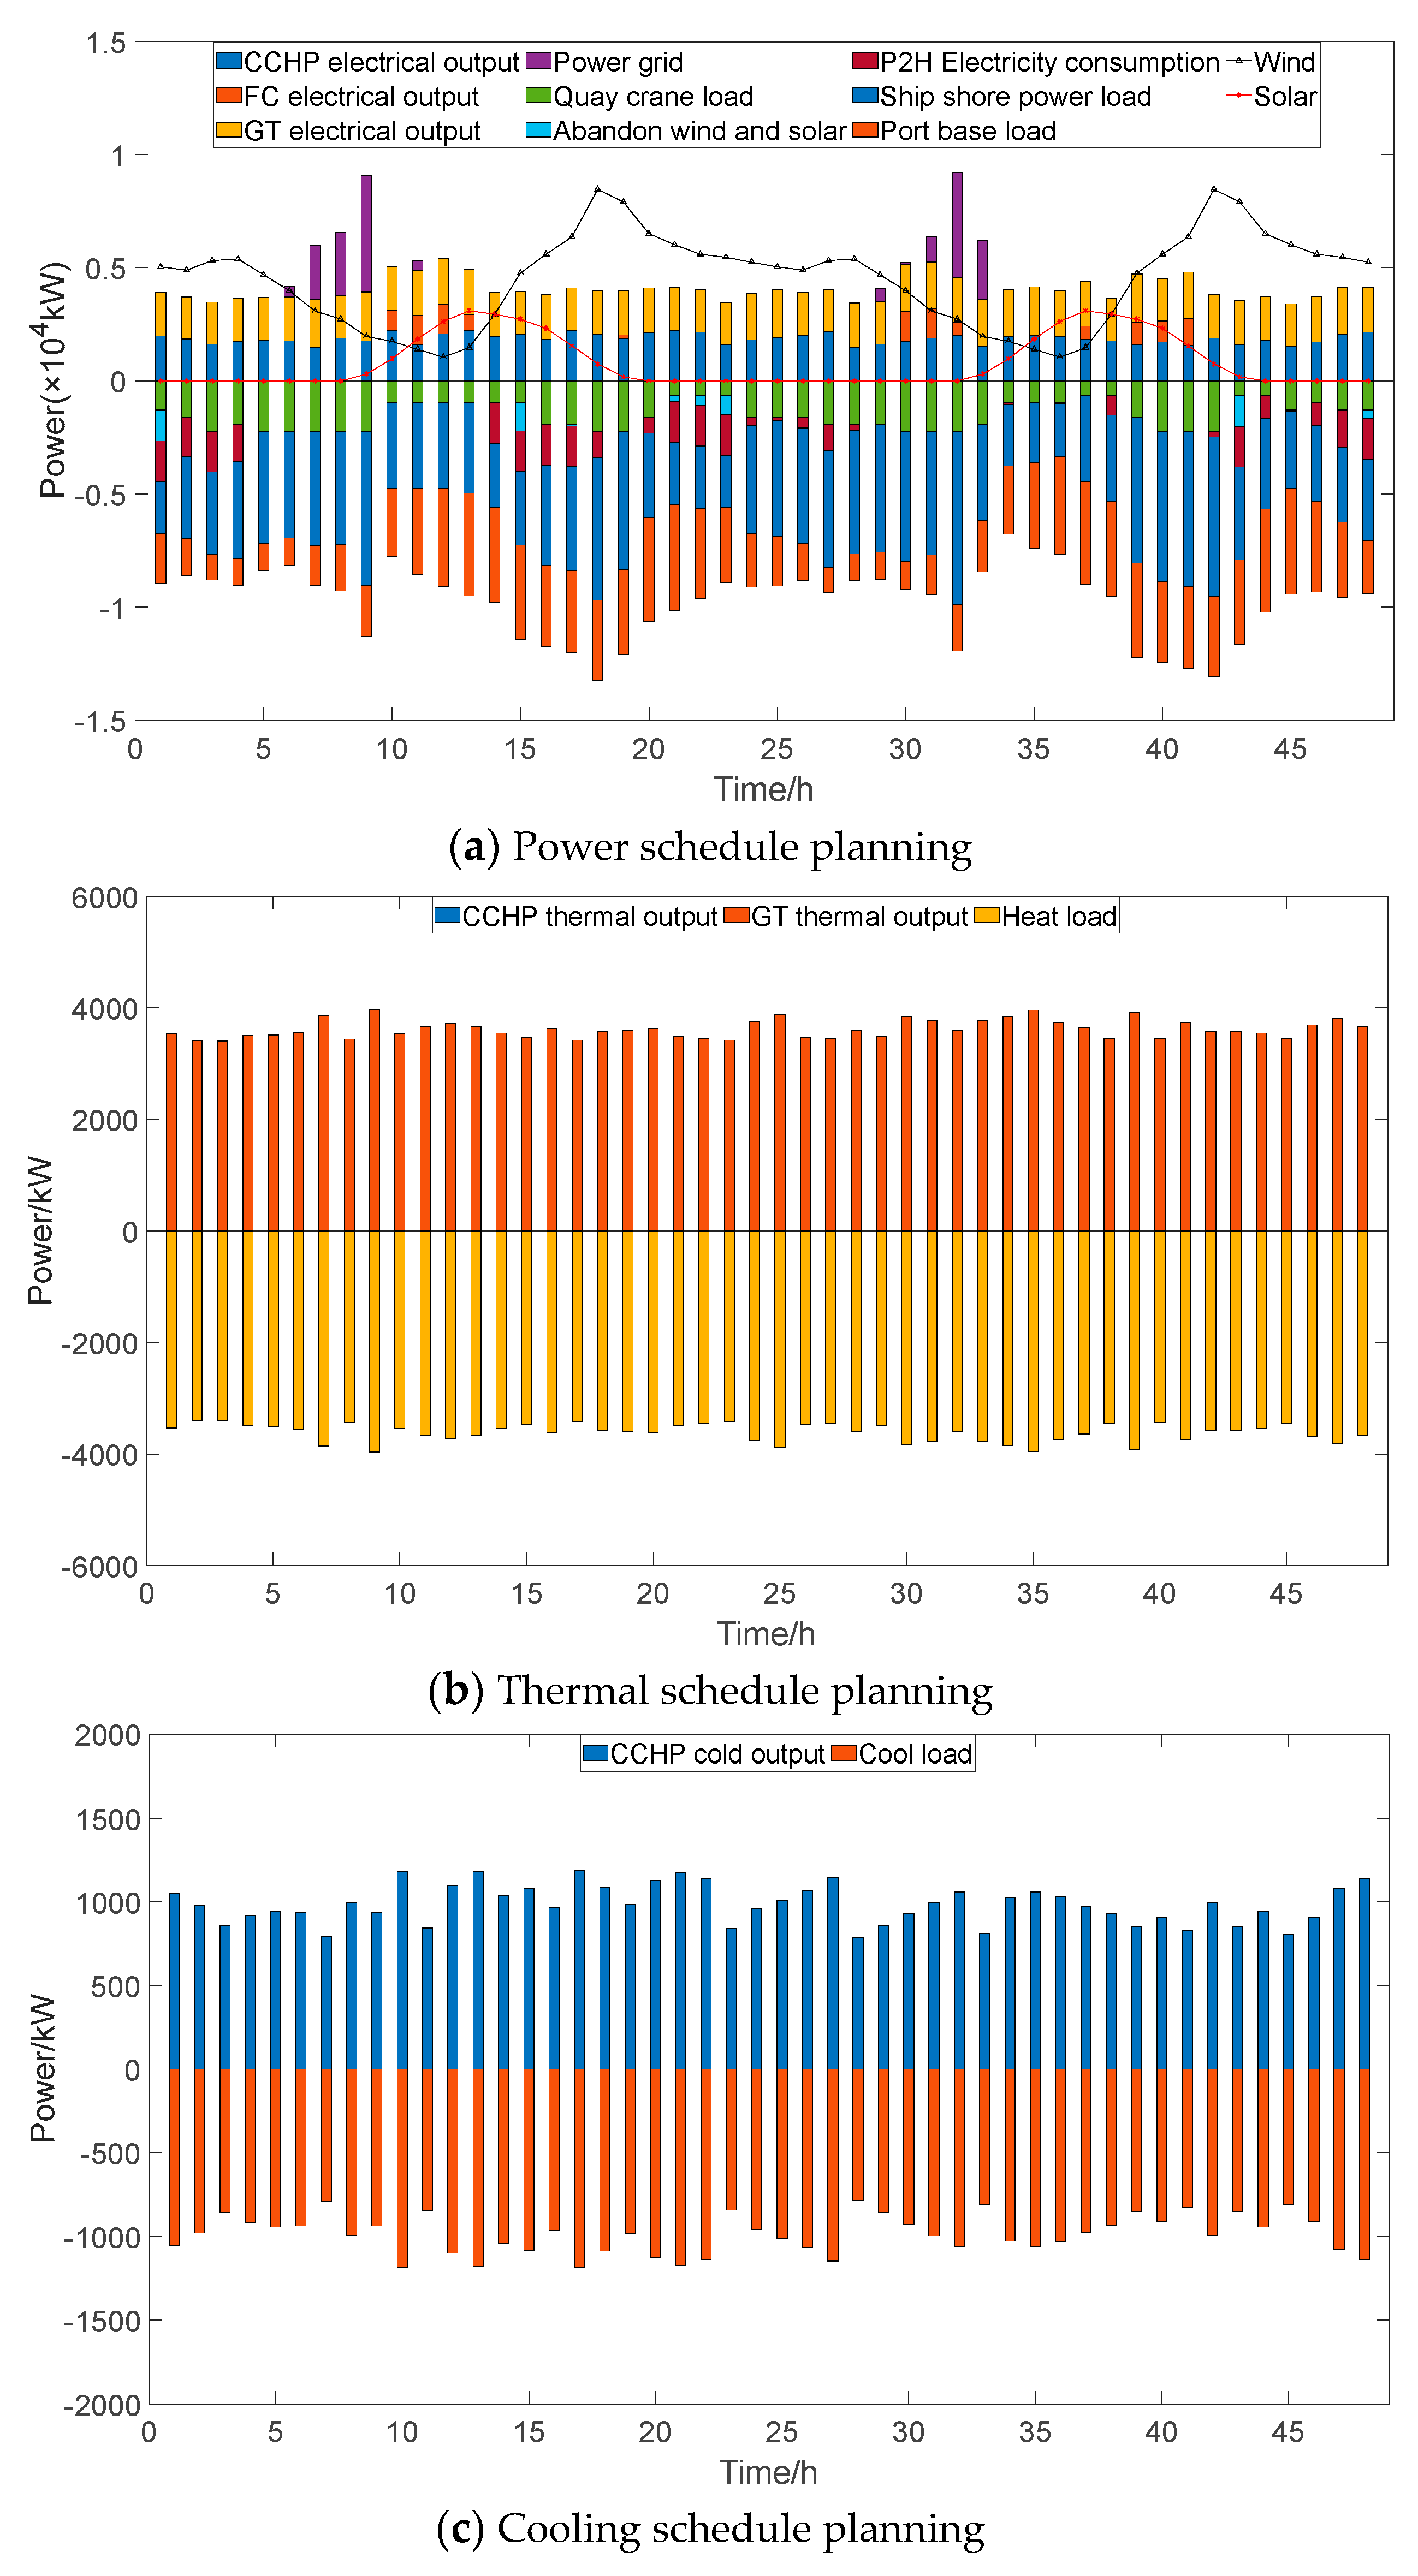
6. Case Verification

Taking a port in Shanghai as an example, the proposed method and model are verified. With a scheduling period of 48 h and a unit scheduling period of 1 h, the parameters of the port logistics and energy system are shown in Table 2 and the interaction parameters between ships and ports are shown in Table 3. The simulation was conducted on a 64-bit PC with a 2.40 GHZ CPU and 16 GB RAM, using MATLAB R2023a with a YALMIP solver.

6.1. Results and Discussion

6.1.1. Energy–Logistics System Collaborative Optimization Analysis

To verify the economic feasibility of collaborative optimization between the port logistics system and the energy system, two comparative cases are set up as follows:
(1)
Case A: Separate optimization of logistics and energy systems;
(2)
Case B: Collaborative optimization of logistics and energy systems.
Specifically, the separate optimization of logistics and energy systems was carried out in two steps. The first step is to minimize the waiting and berthing time of ships and obtain the allocation quantity of quay cranes and the ships’ states in port. The waiting and berthing time of ships is represented by the logistics cost of the ship.
After obtaining the number of quay cranes and the state of ships in port through minimizing Cship, the second step is to substitute the number of quay cranes and the ships’ states in port as known quantities into the integrated energy system for optimization and solution generation to obtain the output curve of each energy equipment and the operating cost of the system.
Table 4 presents the scheduling results of the two comparison cases, showing that the operation mode in case B brings superior economic advantages to the PIES and can effectively increase the renewable energy consumption rate and concurrently minimize carbon emissions. Conversely, in case A, the logistics and energy systems function in isolation. This segregation restricts the flexibility of both the ship and the quay crane in response to the energy system’s parameters, resulting in a less economically efficient outcome compared to case B.
As shown in Figure 3, when the logistics and energy systems are co-optimized, the electrical load is consistent with the wind and solar output. It is jointly supplied by the main power grid, the GT, and CCHP. Notably, the FC plays a minimal role in the energy dispatch cycle, attributed to its comparatively lower efficiency and economic disadvantages. In the thermal schedule plan, the heat load is almost entirely supplied by the GT, and the CCHP system contributes marginally, engaging only during specific intervals. Due to the single piece of cooling equipment, the cooling load is only provided by CCHP. This configuration ensures the utilization of nearly all waste heat generated by CCHP for refrigeration purposes, with heating applications become a secondary priority when the demand for cooling subsides.
To quantitatively analyze the advantages of the optimization method proposed in this paper, the following is a detailed comparative analysis of case A and case B. Figure 4 illustrates the duration of the ship’s stay in port for both cases, providing a visual representation to support the evaluation of the optimization method’s efficacy.
Case A focuses on optimizing the scheduling of quay cranes and ships with the objective of minimizing the overall cost of the logistics system. Consequently, this approach prioritizes the reduction in berthing and waiting times, as rapid docking and departure of ships are seen as essential to lowering these specific costs. However, this strategy leads to an increase in energy expenditure, which paradoxically results in a higher total cost compared to case B. Although the logistics costs are elevated during collaborative optimization, this phase incorporates the consideration of the operating parameters of the energy system. As a result, despite the initial higher logistics expenditure, the comprehensive evaluation of energy parameters ensures that the aggregated cost of the system remains the lowest. This highlights the importance of holistic optimization strategies that account for both logistical efficiency and energy consumption in reducing the overall operational costs of the port.
In Figure 4, an elongated waiting duration for the ship in case B is observed, which suggests that an optimal berthing time has been selected by the shipping entity. This decision appears to be strategically made to achieve a balance between logistics and energy expenditures, ultimately aiming at cost minimization.
In Figure 5, a comparative analysis is presented between two distinct cases regarding the load management of ships. In case A, the distribution of ship load does not demonstrate a significant correlation with electricity pricing, attributing this outcome to the exclusive consideration of logistics costs. The energy consumption cost is reduced only by adjusting the variable power load in a fixed period, and the adjustment effect is not apparent because the variable power load is small. Conversely, case B illustrates a strategic approach where ships possess the flexibility to modify their port arrival timings and load statuses in response to fluctuations in electricity prices. This adaptability results in a more efficient load distribution, characterized by reduced ship loads during periods of elevated electricity prices and increased loads when electricity prices are lower. This approach facilitates a more harmonious integration with the energy system, distinguishing it markedly from the outcomes observed in case A.
Figure 6 shows cases A and B’s P2H power and wind–solar load curves. The P2H power of case A is relatively high. During 1:00–4:00, 14:00–16:00, 17:00–27:00, and 42:00–44:00, the combined output from wind and solar sources falls short of the total electricity load. Nevertheless, the electricity yielded by the gas equipment’s combined heat and power generation results in an excess of wind and solar energy, prompting the P2H system to activate and subsequently reach its capacity limit during certain periods. This leads to the squandering of renewable energy resources. During the 17:00 and 45:00–48:00 periods, the output from wind and solar exceeds the total electrical load. However, constraints related to the P2H power capacity and the operational limits of gas-powered electrical equipment prevent the full utilization of wind and solar energy, culminating in a significant wind and solar curtailment rate of 10.32%. Case B’s output from wind and solar is lower than the electrical load. The surplus wind and solar energy seldom breaches the P2H system’s upper power threshold when considering the contribution of gas equipment, leading to a markedly reduced incidence of renewable energy wastage, quantified at a mere 2.37%. In Figure 6b, the maximum and minimum values of the electricity load in case B are 12,823 kW and 5788 kW, respectively. Compared to case A’s 15,626 kW and 2347.7 kW, the electricity load curve in case B is more stable and the trend in changes is closer to the wind and solar power output, indicating that energy–logistics collaborative optimization enables ships to better synchronize with the available wind and solar energy. Based on meeting production demands, adjusting the temporal distribution of the load allows the logistics system to flexibly change according to the energy system, thus achieving interaction between the two systems.

6.1.2. Scheduling Analysis of Ships Waiting for Berth

Based on the collaborative optimization of logistics and energy systems, to further study the impact of ship scheduling on the system, the following comparative cases are studied.
Case C: Regardless of the scheduling of waiting ships, when the ship arrives at the port, it immediately berths. That is, the ship’s arrival time is equal to the berthing time.
The cost comparison between case C and case B is shown in Table 5, and a comparison of ship load, P2H power, and wind–solar load curves is shown in Figure 7 and Figure 8, respectively.
Upon analyzing Table 4 and Table 5, it is evident that even in scenarios where waiting costs are not considered, the logistics cost associated with case C remains higher than that of A, indicating that the port call time of the ship is relatively longer to distribute the load of the ship during the period when the electricity price is lower, or the wind and solar output is more extensive. In Table 5, compared with case C, case B achieves a more substantial reduction in cost by incorporating the scheduling of waiting ships. This finding suggests that the strategic scheduling of ships awaiting berth not only enhances the system’s overall flexibility but also yields a more pronounced optimization effect than the strategies employed in cases A and C.
In the analysis presented in Figure 7, although case C is a collaborative optimization of logistics and energy, this approach overlooks the crucial aspect of scheduling for waiting ships. This oversight leads to a suboptimal alignment between the demand load curve and the fluctuating electricity prices, consequently elevating the system’s overall operational costs. Compared with Figure 5 and Figure 7, the ship load curves and system operating costs of the two cases exhibit a notable similarity because the ships’ waiting times in cases A and C are almost the same. During the period of 10:00–20:00 and 30:00–42:00, the load curves across the three studied cases are inversely correlated with the variations in electricity pricing. This phenomenon is primarily influenced by factors such as the ships’ scheduled arrival times, production time requirements, and the availability of quay cranes. In the period of 31:00–41:00, the load attributed to ships in case B is markedly lower than those observed in cases A and C. This discrepancy underscores the potential for ships in case B to effectively adjust their operations in response to electricity pricing dynamics, highlighting strategic advantages in operational flexibility and cost efficiency. This indicates that when berth allocation is combined with a time-of-use pricing model, port operators can optimize the berthing sequence to schedule electricity demand, allowing docked ships’ needs to be met at a lower total cost.
Figure 8 shows a comparison of P2H power and wind–solar load curves between case B and case C. Notably, case C exhibits a higher P2H power output relative to case B. During P2H operations, a recurrent observation is its operation at the power limit, rendering it incapable of fully integrating available renewable energy sources. This operational characteristic, in turn, contributes to an elevated rate of wind and solar curtailment in case C as compared to case B. Figure 8b shows that the maximum and minimum values of the electricity load in case C are 16,373 kW and 2347.7 kW, respectively. Compared with case B, the fluctuation in its electricity load is larger, and its fitting degree to wind and solar power output is poor. This in turn proves that the optimized scheduling of waiting vessels can improve the utilization rate of renewable energy.
In conclusion, the optimization strategy delineated within this paper demonstrates a significant reduction in operational costs for port systems by adjusting the ship’s state in port and the state of the load operation, as well as the output of various energy equipment, based on fully considering the port’s logistics scheduling. This approach offers dual benefits. Firstly, it enhances the efficiency and productivity of port operations, aligning with the operational paradigms and production management expectations of ship owners. Secondly, it embodies a commitment to economic viability and environmental protection, making it a holistic solution for contemporary maritime logistics challenges.

6.2. Sensitivity Analysis

Here, several sensitivity analyses are illustrated for different important parameters to validate the effectiveness of the developed model (Table 6).
(a)
Through a data comparison, it is found that when the upper limit of P2H power increases, the consumption rate of renewable energy improves, indirectly reducing the purchasing power of the port, thereby reducing the operating costs of the port.
(b)
When only renewable energy generation is increased, this will cause excessive waste, and the operating costs of ports will not significantly increase; when the upper limit of P2H power and the amount of renewable energy generation increase synchronously, the operating costs of the port will be further reduced. Therefore, when expanding, it is possible to consider binding the two together.
(c)
When a fixed electricity price is used in ports instead of time-of-use electricity prices, the flexibility of berth scheduling is independent of electricity prices, which further reduces the performance of port collaborative optimization scheduling. Therefore, time-of-use electricity prices are an indispensable part of port collaborative optimization scheduling.
(d)
When doubling the carbon emission price of the port, the carbon emission cost of the port also doubles and the operating cost increases significantly. Thus, it can be seen that carbon emission prices have a significant impact on port operating costs.

7. Managerial Implications

Here, we discuss some managerial implications of the suggested research.
(a)
We should advocate for the coordinated optimization of port logistics and energy systems, which can reduce the operating costs of a port overall. This can promote the collaborative optimization of ports by implementing practical reward and punishment mechanisms for port operators and relevant stakeholders.
(b)
Policy-makers can encourage port operators to install more PV and WTs, emphasizing the importance of renewable energy for green and low-carbon ports. This can not only promote energy conservation and emission reductions in ports, but also reduce dependence on fossil fuel power generation, thereby protecting the environment.
(c)
Governments should encourage port operators to adopt P2H technology and related hydrogen equipment to reduce carbon dioxide emissions. This may include providing subsidies to ports that purchase equipment that helps reduce carbon dioxide emissions.
(d)
Policy-makers should encourage learning and exchange between different countries and ports to share knowledge and learn about port operation strategies and carbon reduction methods. This can promote a global approach to reducing port operating costs and promoting the consumption of renewable energy.

8. Conclusions, Limitation and Future Research

In recent times, ports have become increasingly important hubs for international trade and engines for economic development in various countries, while their energy consumption has also increased sharply. To improve the economic and environmental efficiency of ports, this paper delves into the intricacies of PIESs, scrutinizing the interconnections and potential for optimization within logistics systems, ships, and diverse forms of energy. We propose a novel approach for collaborative optimization scheduling, specifically tailored for the energy–logistics nexus within port environments. The primary conclusions drawn from this study are systematically presented, highlighting the significant implications for enhancing the efficiency and sustainability of port operations.
(1) In contrast to the isolated optimization of logistics and energy systems, a collaborative optimization approach has been observed to decrease operational costs by 3.27%. The inclusion of ship waiting schedule optimization further enhances the system’s flexibility. Moreover, the integrated optimization of both logistics and energy systems has been notably effective in minimizing the curtailment rates of wind and solar energies. This indicates that the proposed methodology not only considers economic and environmental sustainability but also significantly improves the overall energy utilization rate by seamlessly integrating port logistics with energy systems.
(2) Upon conducting a comprehensive analysis focused on the collaborative optimization of logistics and energy systems, it has been observed that the operational expenditures associated with the system were notably reduced. Concurrently, there was an absence of substantial alterations in the scheduling of ship itineraries. This outcome suggests that the methodology proposed herein is capable of effectively enhancing the interconnectivity between logistical and energy systems operating within a port. This enhancement has been accomplished without compromising the service expectations of ship owners regarding port production management. Consequently, this approach not only facilitates energy conservation and emission reductions but also promotes the economic viability of port operations.
Apart from the numerous benefits that the proposed model offers, this study has certain limitations that may be addressed in future research. The optimization approach proposed in this paper lacks consideration of other uncertainties and the interaction between port operators and ships. In addition, acquiring dependable, useful, and correct data is the most crucial task. The ambiguity resulting from human factors as well as the use of software cannot be ignored, even though the primary data sources for this study are peer-reviewed publications.
In the future, multi-scenario port energy management studies can be conducted to analyze the social benefits of optimal scheduling and flexible berth allocation while accounting for different types of uncertainties such as vessel arrivals, electricity prices, and fuel costs. Statistical or ambiguous logic-based techniques should be used to estimate the model’s necessary data. This study contributes significantly to enhancing the energy efficiency and economic performance of PIESs, leveraging advanced methodologies and theoretical frameworks to explore innovative solutions for sustainable port infrastructure development.

Author Contributions

Conceptualization, A.M. and Y.Z.; methodology, A.M., Y.Z. and L.S.; software, A.M., Y.Z. and L.S.; validation, A.M., Y.Z., L.S. and Y.X.; formal analysis, F.M. and Y.X.; investigation, Y.Z. and F.M.; resources, Y.Z., F.M. and Y.X.; data curation, A.M.; writing—original draft preparation, A.M.; writing—review and editing, A.M. and Y.Z.; visualization, A.M., Y.Z. and L.S.; supervision, F.M. and Y.X.; project administration, Y.X. Thank you for the funding from Y.X. All authors have read and agreed to the published version of the manuscript.

Funding

This work was partly supported by the Logistics research funding program (No. BHJ22R047).

Data Availability Statement

Data are contained within the article.

Conflicts of Interest

The authors declare no conflicts of interest.

Nomenclature

Acronyms
PIESPort-Integrated Energy System.
CCHPCombined Cooling, Heating, and Power.
GTGas turbine.
ACRefrigeration machine.
P2HPower to hydrogen.
PVPhotovoltaics.
WTWind turbine.
HSHydrogen storage.
EHEnergy hub.
MRMethanation device.
FCFuel cell.
Indices
n/jSet/index of ships.
T,tSet/index of operation periods.
m/iSet/index of variable power equipment.
Parameters
t0/ t l e a v e l a t e s t Estimated arrival/departure time of a ship.
NjNumber of loading or unloading containers.
ηLoading and unloading efficiency of quay cranes.
C j m a x / C j m i n Maximum and minimum number of quay cranes.
P c r a n e 1 Power consumption of a single quay crane.
ΔtUnit scheduling period.
CmaxTotal amount of quay crane resources.
Wvar,iRated workload of the intermittent equipment.
L v a r , i m i n / L v a r , i m a x Upper/lower limits of the intermittent equipment.
C O P C C H P , G T e Electrical efficiency of GT.
C O P C C H P , G T h , l o s s Heat loss rate of GT.
C O P C C H P , G T h , r e c o v e r y Flue gas recovery rate of GT.
C O P C C H P , G T h Recovery rate of waste heat of GT.
C O P A C c Refrigeration coefficient of AC.
C O P G t e Electrical efficiency of GT.
C O P G T h Thermal efficiency of GT.
COPFCElectrical efficiency of FC.
COPP2HElectrolytic efficiency of P2H.
C O P H S i n Charging efficiency of HS.
C O P H S o u t Discharging efficiency of HS.
COPMRConversion efficiency of MR.
HloadConstant heat load of the port.
LloadConstant cooling load of the port
α/βCarbon emission coefficient of power/gas.
PgasNatural gas price.
Pco2Carbon emission price.
C O 2 m a x Maximum carbon emissions of ports.
PabandonAbandoned wind and solar punishment cost.
a1Valley price.
a2Ordinary price.
a3Peak price.
Variables
t1/tleaveBerthing time/departure time of ship.
CjAllocation quantity of quay cranes.
t l e a v e m i n / t l e a v e m a x Earliest/latest departure time of ship.
C j m a x / C j m i n Maximum and minimum number of quay cranes.
Xj(t)Ship in port state.
Pcrane(t)Power consumption of all quay cranes.
Lship(t)Total load power of the ship.
Lcons(t)Constant power load of the ship.
Lvar(t)Variable power load of the ship.
Lvar,i(t)Size of variable power.
si(t)Status of intermittent working equipment.
Pship(t)Sum of the shore power of all ships.
QCCHPGas consumption of CCHP.
P C C H P , G T e Power generation of GT.
P C C H P , G T h Recyclable heat power of GT exhaust gas.
P C C H P , G T h Total thermal produced by CCHP.
P C C H P c Cold power output by CCHP.
P C C H P h Heat supplied to the port outputting by CCHP.
P G T e Power generation of GT.
P G T h Heat generation of GT.
QGTGas consumption of GT.
MFCHydrogen consumption of FC.
PFCPower generated by FC.
PP2HElectrical power consumed by P2H.
MP2HHydrogen production of P2H.
MHS,tEnergy storage state value of HS.
M H S , t i n / M H S , t o u t Charging/discharging hydrogen power of HS.
MMRHydrogen consumption of the MR.
QMRPower of methane production of the MR.

References

  1. Ezeh, C.I.; Richter, U.H.; Seufert, J.H.; Peng, C. Operational-Based Decarbonization of Container Ports: The Case of Ningbo-Zhoushan Port. Int. J. Sustain. Transp. 2024, 18, 34–45. [Google Scholar] [CrossRef]
  2. Zhou, Y.; Zhou, H. The Emission Reduction Technology Decision of the Port Supply Chain. Mathematics 2024, 12, 848. [Google Scholar] [CrossRef]
  3. Daniel, H.; Trovão, J.P.F.; Williams, D.; Boulon, L. Unlocking Shore Power in St. Lawrence and Great Lakes for Cargo Ships. Transp. Res. Part D Transp. Environ. 2024, 131, 104230. [Google Scholar] [CrossRef]
  4. Wang, Z.; Hu, H.; Zhen, L. Berth and Quay Cranes Allocation Problem with On-Shore Power Supply Assignment in Container Terminals. Comput. Ind. Eng. 2024, 188, 109910. [Google Scholar] [CrossRef]
  5. Karimi, S.; Zadeh, M.; Suul, J.A. Operation-Based Reliability Assessment of Shore-to-Ship Charging Systems Including On-Shore Batteries. IEEE Trans. Ind. Appl. 2023, 59, 4752–4763. [Google Scholar] [CrossRef]
  6. Qi, P.; Gao, W. Study on Load Forecasting of Combined Cooling, Heat and Power System with Deep Learning Algorithm Based on Attention Mechanism. In Proceedings of the 2023 5th International Academic Exchange Conference on Science and Technology Innovation (IAECST), Guangzhou, China, 8–10 December 2023; pp. 1353–1358. [Google Scholar]
  7. Holder, D.; Percy, S.D.; Yavari, A. A Review of Port Decarbonisation Options: Identified Opportunities for Deploying Hydrogen Technologies. Sustainability 2024, 16, 3299. [Google Scholar] [CrossRef]
  8. Giri, B.K.; Roy, S.K.; Deveci, M. Fuzzy Robust Flexible Programming with Me Measure for Electric Sustainable Supply Chain. Appl. Soft Comput. 2023, 145, 110614. [Google Scholar] [CrossRef]
  9. Giri, B.K.; Roy, S.K. Fuzzy-Random Robust Flexible Programming on Sustainable Closed-Loop Renewable Energy Supply Chain. Appl. Energy 2024, 363, 123044. [Google Scholar] [CrossRef]
  10. Lei, J.; Zhang, H.; Pan, J.; Zhuo, Y.; Chen, A.; Chen, W.; Yang, Z.; Feng, K.; Li, L.; Wang, B.; et al. Techno-Economic Assessment of a Full-Chain Hydrogen Production by Offshore Wind Power. Energies 2024, 17, 2447. [Google Scholar] [CrossRef]
  11. Chavan, H.R.; Knollmeyer, J.; Khan, S. A Study on the Potential of Hydrogen Fuel Cells for Maritime Transportation Applications. In Proceedings of the SoutheastCon 2023, Orlando, FL, USA, 1–16 April 2023; pp. 498–503. [Google Scholar]
  12. Kelmalis, A.; Dimou, A.; Lekkas, D.F.; Vakalis, S. Cold Ironing and the Study of RES Utilization for Maritime Electrification on Lesvos Island Port. Environments 2024, 11, 84. [Google Scholar] [CrossRef]
  13. Zhang, L.; Zeng, Q.; Wang, L. How to Achieve Comprehensive Carbon Emission Reduction in Ports? A Systematic Review. J. Mar. Sci. Eng. 2024, 12, 715. [Google Scholar] [CrossRef]
  14. Sun, P.; Wang, L.; Yuan, T.; Ma, D.; Ma, L.; Li, L.; Guo, J.; Dong, X.; Gao, K. A Comprehensive Study on Electric Field Coupling Effects of Medium-Voltage SiC Power Module and Optimization Design. In Proceedings of the 2024 IEEE Applied Power Electronics Conference and Exposition (APEC), Long Beach, CA, USA, 25–29 February 2024; pp. 2556–2561. [Google Scholar]
  15. He, W.; Feng, Y.; Wu, S.; Wang, W. Mechanical–Thermal–Electrical Coupling Modeling and Temperature Rise Characteristic of a Parallel Groove Clamp with Improved Representation of Contact Interactions. IEEE Trans. Compon. Packag. Manuf. Technol. 2023, 13, 356–364. [Google Scholar] [CrossRef]
  16. Xu, Z.; Zhang, C.; Sun, B.; Liu, S. The Electric-Thermal Coupling Simulation and State Estimation of Lithium-Ion Battery. J. Energy Storage 2023, 58, 106431. [Google Scholar] [CrossRef]
  17. Fu, L.; Li, H.; Deng, Y.; Tang, C. The Influence of Small Molecule Products on Natural Ester Impregnated Cellulose Insulation Paper under Electric-Thermal Coupling Field. Colloids Surf. A Physicochem. Eng. Asp. 2024, 697, 134426. [Google Scholar] [CrossRef]
  18. Song, R.; Hamacher, T.; Terzija, V.; Perić, V.S. Potentials of Using Electric-Thermal Sector Coupling for Frequency Control: A Review. Int. J. Electr. Power Energy Syst. 2023, 151, 109194. [Google Scholar] [CrossRef]
  19. Liu, W.; Teh, J.; Alharbi, B.; Yang, G.; Wang, B.; Meng, D.; Shi, J.; AlKassem, A.; Aljabr, A.; Alshammari, N. An Electric-Thermal Coupling Modeling Method for Lithium-Ion Battery Using the State of Charge Normalization Calculation Method. J. Energy Storage 2023, 72, 108724. [Google Scholar] [CrossRef]
  20. Skowron, Ł.; Chygryn, O.; Gąsior, M.; Koibichuk, V.; Lyeonov, S.; Drozd, S.; Dluhopolskyi, O. Interconnection between the Dynamic of Growing Renewable Energy Production and the Level of CO2 Emissions: A Multistage Approach for Modeling. Sustainability 2023, 15, 9473. [Google Scholar] [CrossRef]
  21. Putranto, L.M.; Budi, R.F.S.; Novitasari, D. Generation Expansion Planning with a Renewable Energy Target and Interconnection Option: A Case Study of the Sulawesi Region, Indonesia. Renew. Sustain. Energy Rev. 2023, 183, 113489. [Google Scholar] [CrossRef]
  22. Ren, Y. Research of AGV Scheduling in Container Terminal. Master’s Thesis, Jimei University, Xiamen, China, 2014. [Google Scholar]
  23. Borelli, D.; Devia, F.; Schenone, C.; Silenzi, F.; Tagliafico, L.A. Dynamic Modelling of LNG Powered Combined Energy Systems in Port Areas. Energies 2021, 14, 3640. [Google Scholar] [CrossRef]
  24. Aljuaid, A.M.; Koubâa, M.; Ammar, M.H.; Kammoun, K.; Hachicha, W. Mathematical Programming Formulations for the Berth Allocation Problems in Container Seaport Terminals. Logistics 2024, 8, 50. [Google Scholar] [CrossRef]
  25. Song, T.; Li, Y.; Zhang, X.-P.; Wu, C.; Li, J.; Guo, Y.; Gu, H. Integrated Port Energy System Considering Integrated Demand Response and Energy Interconnection. Int. J. Electr. Power Energy Syst. 2020, 117, 105654. [Google Scholar] [CrossRef]
  26. Kovač, M.; Tadić, S.; Krstić, M.; Roso, V. Modelling Dry Port Systems in the Framework of Inland Waterway Container Terminals. Comput. Model. Eng. Sci. 2023, 137, 1019–1046. [Google Scholar] [CrossRef]
  27. Xu, X.; Li, Z.; Jiang, X.; Huang, X.; Lu, Y.; Li, L. Port Berth Allocation and Microgrid Cluster Joint Optimization Scheduling Based on Master-Slave Game. J. Clean. Prod. 2024, 452, 142220. [Google Scholar] [CrossRef]
  28. Zhao, W.; Ma, K.; Yang, J.; Guo, S. A Risk-Averse Logistics-Energy Coordination Optimization Strategy for Port Energy System Considering Demand Response Program. Electr. Power Syst. Res. 2024, 231, 110297. [Google Scholar] [CrossRef]
  29. Shi, Z.; Fan, F.; Tai, N.; Qing, C.; Meng, Y.; Guo, R. An Optimal Operation Strategy for Integrated Energy-Logistics System in Green Port. In Proceedings of the 2022 IEEE/IAS Industrial and Commercial Power System Asia (I&CPS Asia), Shanghai, China, 8–11 July 2022; pp. 1592–1597. [Google Scholar]
  30. Lassoued, R.; Elloumi, A. A Bi-Level Optimization Model for Solving the Berth and Quay Cranes Allocation Problems in Port Terminal. In Proceedings of the 2021 International Conference on Decision Aid Sciences and Application (DASA), Sakheer, Bahrain, 7–8 December 2021; pp. 981–985. [Google Scholar]
  31. Lassoued, R.; Elloumi, A. Hierarchical Optimization for Solving the Integrated Berth and Quay Crane Assignment Problem in Port Terminal. In Proceedings of the 2022 8th International Conference on Control, Decision and Information Technologies (CoDIT), Istanbul, Turkey, 17–20 May 2022; Volume 1, pp. 1479–1483. [Google Scholar]
  32. Chang, S.-C.; Lin, M.-H.; Tsai, J.-F. An Optimization Approach to Berth Allocation Problems. Mathematics 2024, 12, 753. [Google Scholar] [CrossRef]
  33. Ji, B.; Huang, H.; Yu, S.S. An Enhanced NSGA-II for Solving Berth Allocation and Quay Crane Assignment Problem with Stochastic Arrival Times. IEEE Trans. Intell. Transp. Syst. 2023, 24, 459–473. [Google Scholar] [CrossRef]
  34. Wang, Z. Optimization of Port Ship Collaborative Scheduling Based on Differential NSGA-II Algorithm. China Water Transp. 2023, 23, 19–21. [Google Scholar]
  35. Pu, Y.; Liu, H.; Wang, J.; Hou, Y. Collaborative Scheduling of Port Integrated Energy and Container Logistics Considering Electric and Hydrogen-Powered Transport. IEEE Trans. Smart Grid 2023, 14, 4345–4359. [Google Scholar] [CrossRef]
  36. Jiang, M.; Ma, F.; Zhang, Y.; Lv, S.; Pei, Z.; Wu, G. Collaborative Scheduling Optimization of Container Port Berths and Cranes under Low-Carbon Environment. Sustainability 2024, 16, 2985. [Google Scholar] [CrossRef]
  37. Yu, M.; Lv, Y.; Li, W. Multi objective optimization of low-carbon global scheduling for field bridges. Logist. Technol. 2020, 39, 41–47. [Google Scholar]
  38. Mao, A.; Yu, T.; Ding, Z.; Fang, S.; Guo, J.; Sheng, Q. Optimal Scheduling for Seaport Integrated Energy System Considering Flexible Berth Allocation. Appl. Energy 2022, 308, 118386. [Google Scholar] [CrossRef]
  39. Yang, J.; Wang, J.; Ma, K.; Liu, H.; Dai, Y.; Li, C. A Multi-Energy Pricing Strategy for Port Integrated Energy System Based on Bayesian Stackelberg Game. Sustain. Energy Grids Netw. 2024, 38, 101264. [Google Scholar] [CrossRef]
  40. Zhen, L.; Yang, Z.; Wang, S.; Hu, H.; Chew, E.P.; Fan, T. Integrated Planning Model for Two-Story Container Ports. Transp. Res. Part C Emerg. Technol. 2024, 160, 104535. [Google Scholar] [CrossRef]
  41. Bemporad, A.; Morari, M. Control of Systems Integrating Logic, Dynamics, and Constraints. Automatica 1999, 35, 407–427. [Google Scholar] [CrossRef]
  42. Heemels, W.P.M.H.; Schutter, B.D.; Bemporad, A. Equivalence of Hybrid Dynamical Models. Automatica 2001, 37, 1085–1091. [Google Scholar] [CrossRef]
  43. Liu, Y.; Zhang, T.; Gao, Y.; Lv, L.; Song, X. A MATLAB GUI Toolbox for Surrogate-Based Design and Optimization. In Proceedings of the 2019 IEEE 9th Annual International Conference on CYBER Technology in Automation, Control, and Intelligent Systems (CYBER), Suzhou, China, 29 July–2 August 2019; pp. 103–106. [Google Scholar]
  44. Xu, L.; Xu, X.; Tang, Y.; Ren, X.; Guo, Y. A Matlab Toolbox for Modelling Viscoelastic Constitutive Equation and Parameter Optimization. In Proceedings of the 2017 3rd IEEE International Conference on Computer and Communications (ICCC), Chengdu, China, 13–16 December 2017; pp. 2884–2888. [Google Scholar]
  45. Huang, Y.; Huang, W.; Wei, W.; Tai, N.; Li, R. Logistics-energy Collaborative Optimization Scheduling Method for Large Seaport Integrated Energy System. Chin. J. Electr. Eng. 2022, 42, 6184–6196. [Google Scholar] [CrossRef]
Figure 1. Port-integrated energy system.
Mathematics 12 01917 g001
Figure 2. Port energy–logistics system collaborative optimal scheduling.
Mathematics 12 01917 g002
Figure 3. Energy schedule in case B.
Mathematics 12 01917 g003
Figure 4. Duration of ship in port.
Mathematics 12 01917 g004
Figure 5. Comparison of ship load in cases A and B.
Mathematics 12 01917 g005
Figure 6. Comparison of P2H power and wind–solar load curves in case A and case B.
Mathematics 12 01917 g006
Figure 7. Comparison of ship load in case B and case C.
Mathematics 12 01917 g007
Figure 8. Comparison of P2H power and wind–solar load curves in case B and case C.
Mathematics 12 01917 g008
Table 1. A comparison of the most relevant previous studies.
StudyDNSOREP2HFPSM
Lassoued and Elloumi [30]MLSO bi-level programming model
Zhao et al. [28]MCOLE risk-aware stochastic method
Ji et al. [33]SLSO enhanced non-dominated sorting genetic algorithm II
Shi et al. [29]MCOLE mixed-integer linear programming
Chang et al. [32]MLSO genetic algorithm optimization approach
Wang et al. [4]MLSO adaptive immune clone selection algorithm
Pu et al. [35]MCOLE distributed algorithm based on Benders decomposition
Jiang et al. [36]MLSO nonlinear mixed-integer programming formulation
Lassoued and Elloumi [31]MLSO bi-level programming model
Song et al. [25]MESO mixed-integer linear programming
Aljuaid et al. [24]MLSO multi-objective optimization model based on goal programming
Kovač et al. [26]SLSO hybrid metaheuristic model
Mao et al. [38]MCOLE Mixed-integer linear programming
Xu et al. [27]MLSO a multi-objective berth allocation model
Proposed studyMCOLEhybrid system modeling method
DN: design of network; M: multi-objective; S: single objective; SO: system optimization; LSO: logistics system optimization; ESO: energy system optimization; COLE: collaborative optimization of logistics and energy systems; RE: renewable energy; P2H: power to hydrogen; FP: flexible programming; SM: solution method.
Table 2. Parameters of the port logistics and energy system.
ParameterValueParameterValueParameterValue
η (TEU/H)35 C O P G t e 0.3β (kg/kWh)2.262
Cmax7 C O P G T h 0.55Pgas (USD/kWh)0.0422
P c r a n e 1 (kW)320COPFC0.65Pco2 (USD/kg)0.0068
C O P C C H P , G T e 0.3COPP2H0.6 C O 2 m a x (kg/h)35,000
C O P C C H P , G T h , l o s s 0.15 C O P H S i n 0.98Pabbandon (USD/kWh)0.0138
C O P C C H P , G T h , r e c o v e r y 0.3 C O P H S o u t 0.98a1 (USD/kWh)0.0651
C O P C C H P , G T h 0.8COPMR0.5a2 (USD/kWh)0.1211
C O P A C c 1.2α (kg/kWh)0.7129a3 (USD/kWh)0.1514
Table 3. Parameters of ship and port interactions [45].
Ship NumberTime of Arrival/hLatest Departure Time/hLoading And Unloading
/Box
Largest Quay Crane Demand/UnitMinimal Quay Crane Demand/Unit
111445042
221460031
352580052
482750032
5113055032
6152550031
7183460021
8234250032
9273965031
10294255042
11314645031
12344755021
13384860052
14404850042
Table 4. Total cost of the two schemes.
ParameterCase ACase B
Cbuy/USD30,094.727,199
Cco2/USD8896.59511.1
Closs/USD362.483.1
Abandoned wind and solar rate/%10.322.37
Cship/USD10,926.711,894.9
Total cost/USD50,280.348,688.1
Compare with case B+3.27%-
Table 5. Scheduling results of case B and case C.
ParameterCase BCase C
Cbuy/USD27,19931,653.8
Cco2/USD9511.19690
Closs/USD83.1412.2
Abandon wind and solar rate/%2.3711.73
Cship/USD11,894.911,203.3
Total cost/USD48,688.152,959.3
Compare with case B-+8.77%
Table 6. Sensitivity analysis of different parameters.
ParameterCase BP2H*2Re*2(P2H+Re)*2Fixed Electricity PriceCO2*2
Cbuy/USD27,11927,072.724,992.924,340.427,690.326,968.7
Cco2/USD9511.19503.49413.994189486.118,987.7
Closs/USD83.102568.51749.95365.7
Abandon rate/%2.37036.5624.911.511.87
Cship/USD11,894.911,894.911,203.311,06512,309.812,171.5
Total cost/USD48,688.148,47148,178.646,573.349,539.258,193.6
Compared with case B-−0.45−1.05−4.34+1.75+19.52
P2H*2: P2H maximum power multiplied by two; Re*2: renewable energy generation multiplied by two; (P2H+Re)*2: P2H maximum power and renewable energy generation multiplied by two; CO2*2: the price of carbon dioxide emissions multiplied by two.
Disclaimer/Publisher’s Note: The statements, opinions and data contained in all publications are solely those of the individual author(s) and contributor(s) and not of MDPI and/or the editor(s). MDPI and/or the editor(s) disclaim responsibility for any injury to people or property resulting from any ideas, methods, instructions or products referred to in the content.

