The Quest for an ESG Country Rank: A Performance Contribution Analysis/MCDM Approach

 ,
,  ,
,  ,
,  , and
, and
Abstract
1. Introduction
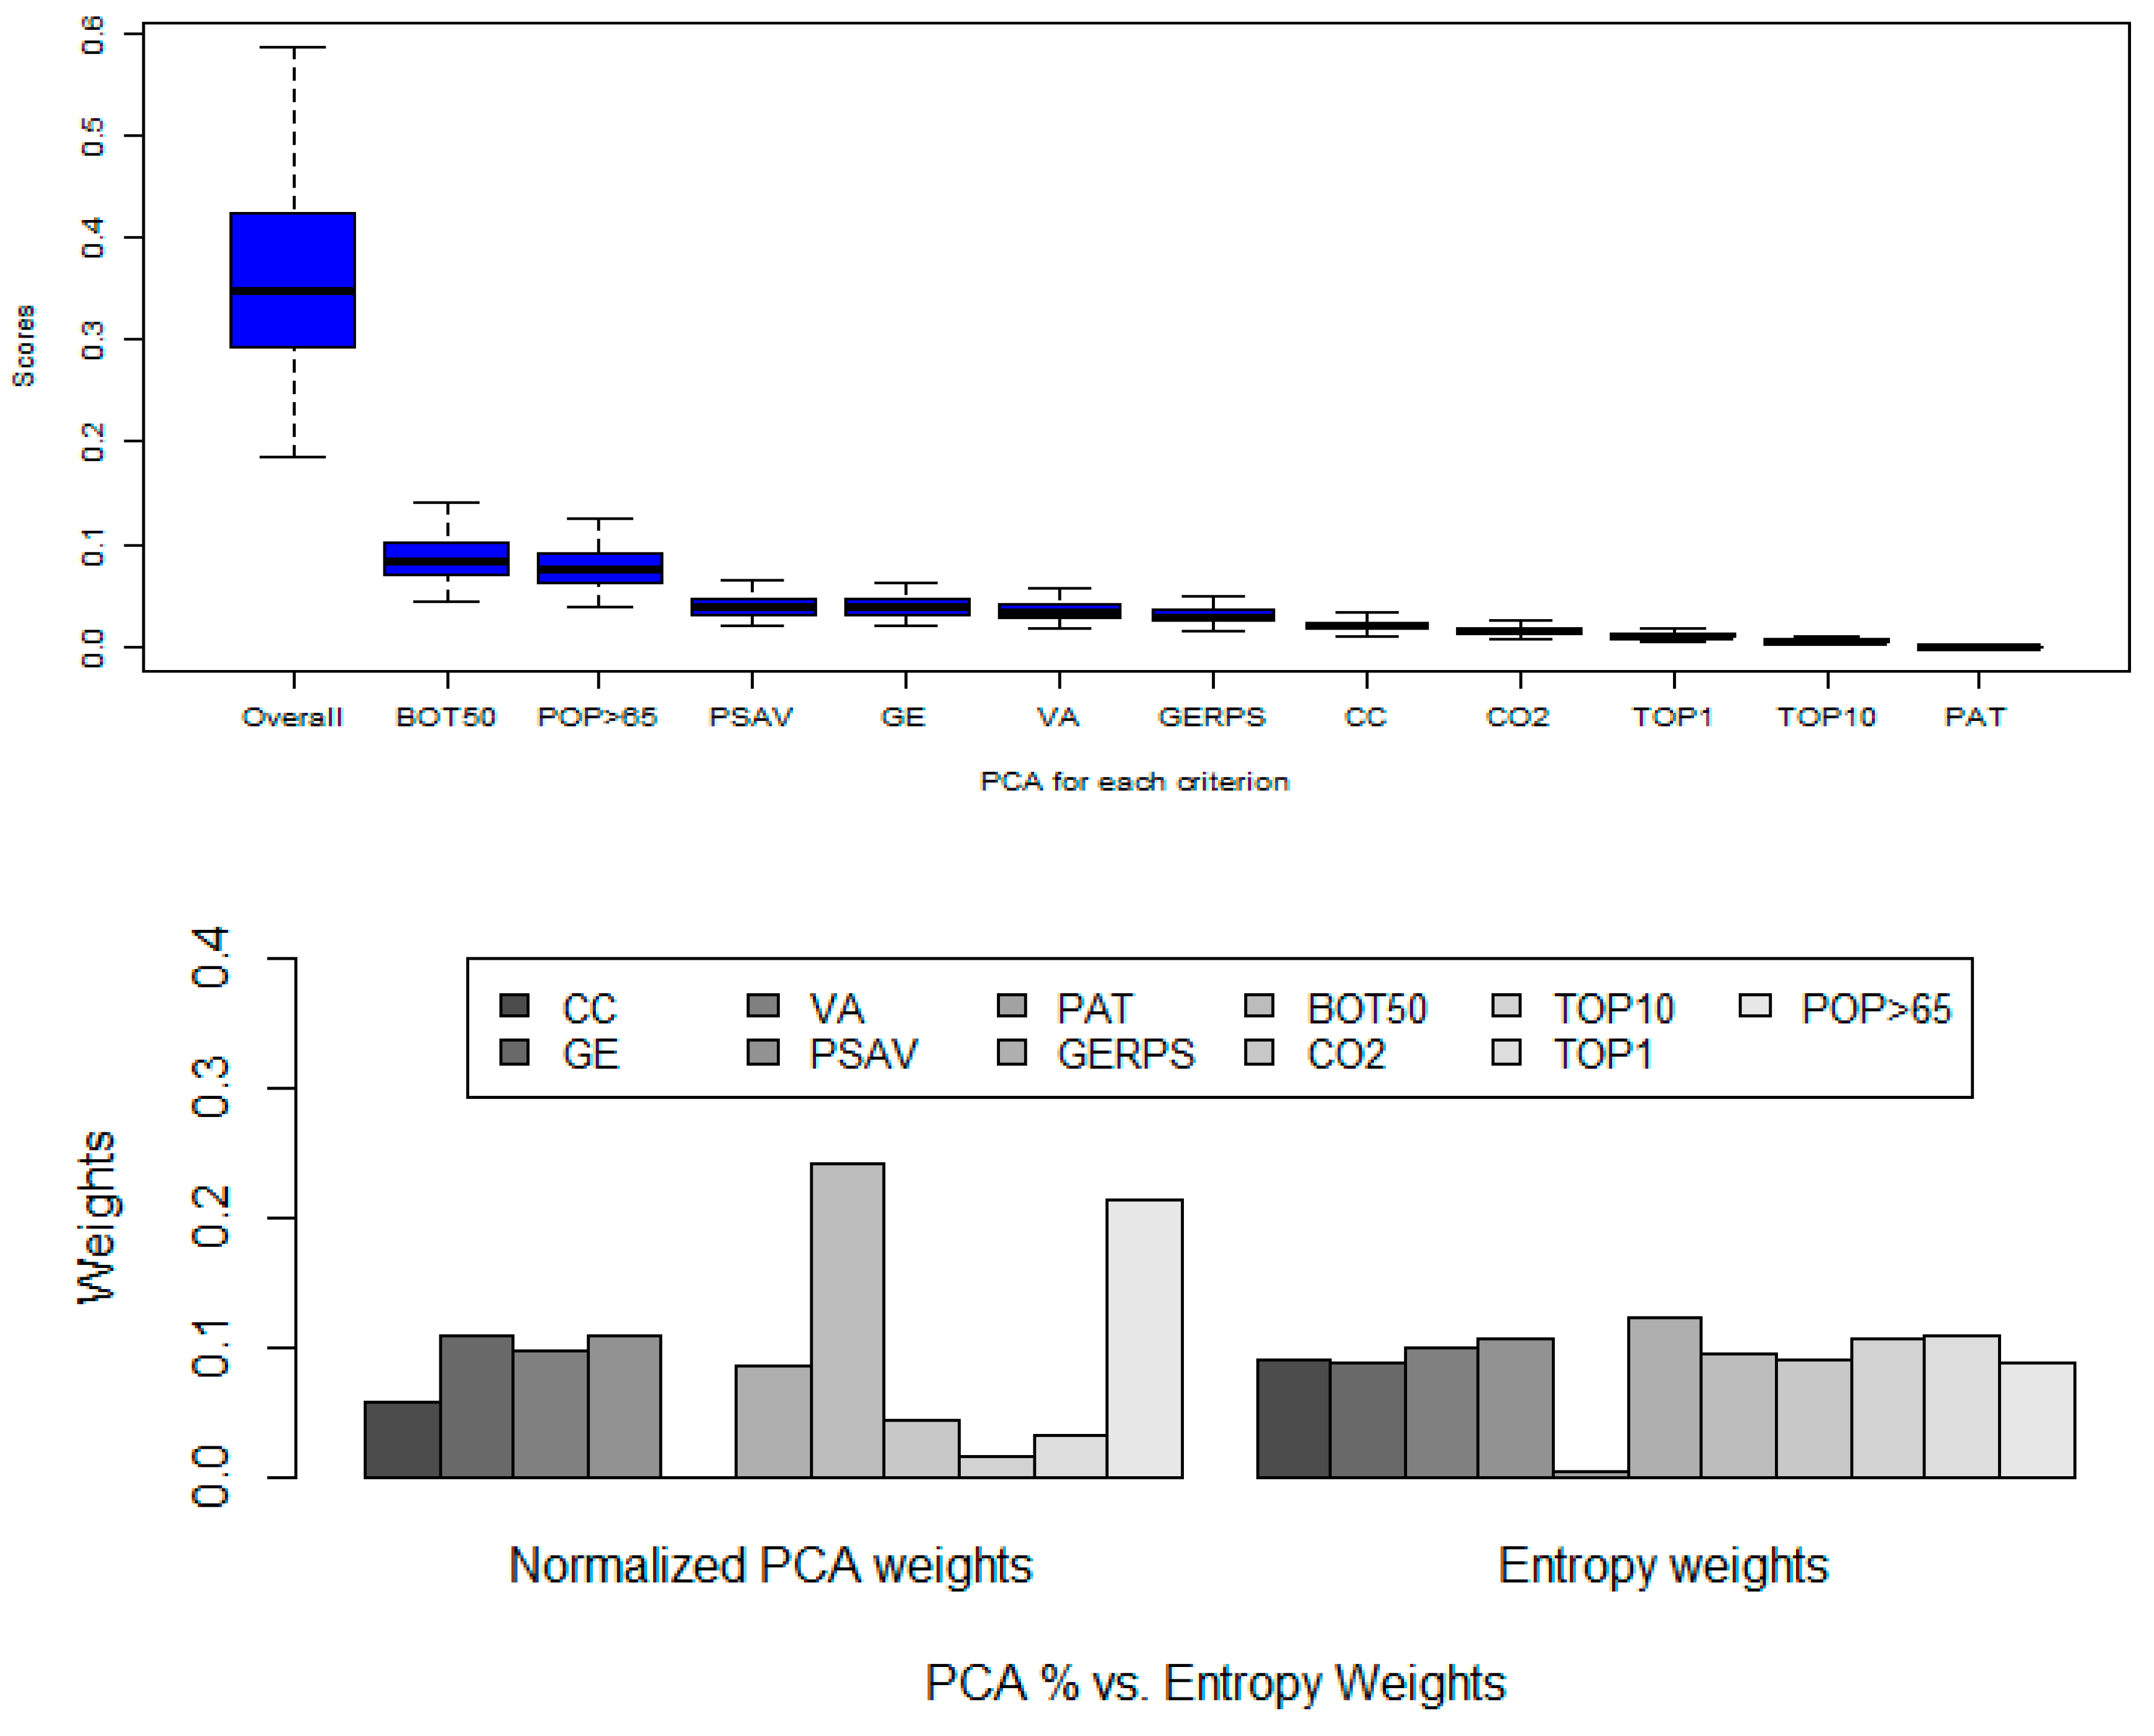
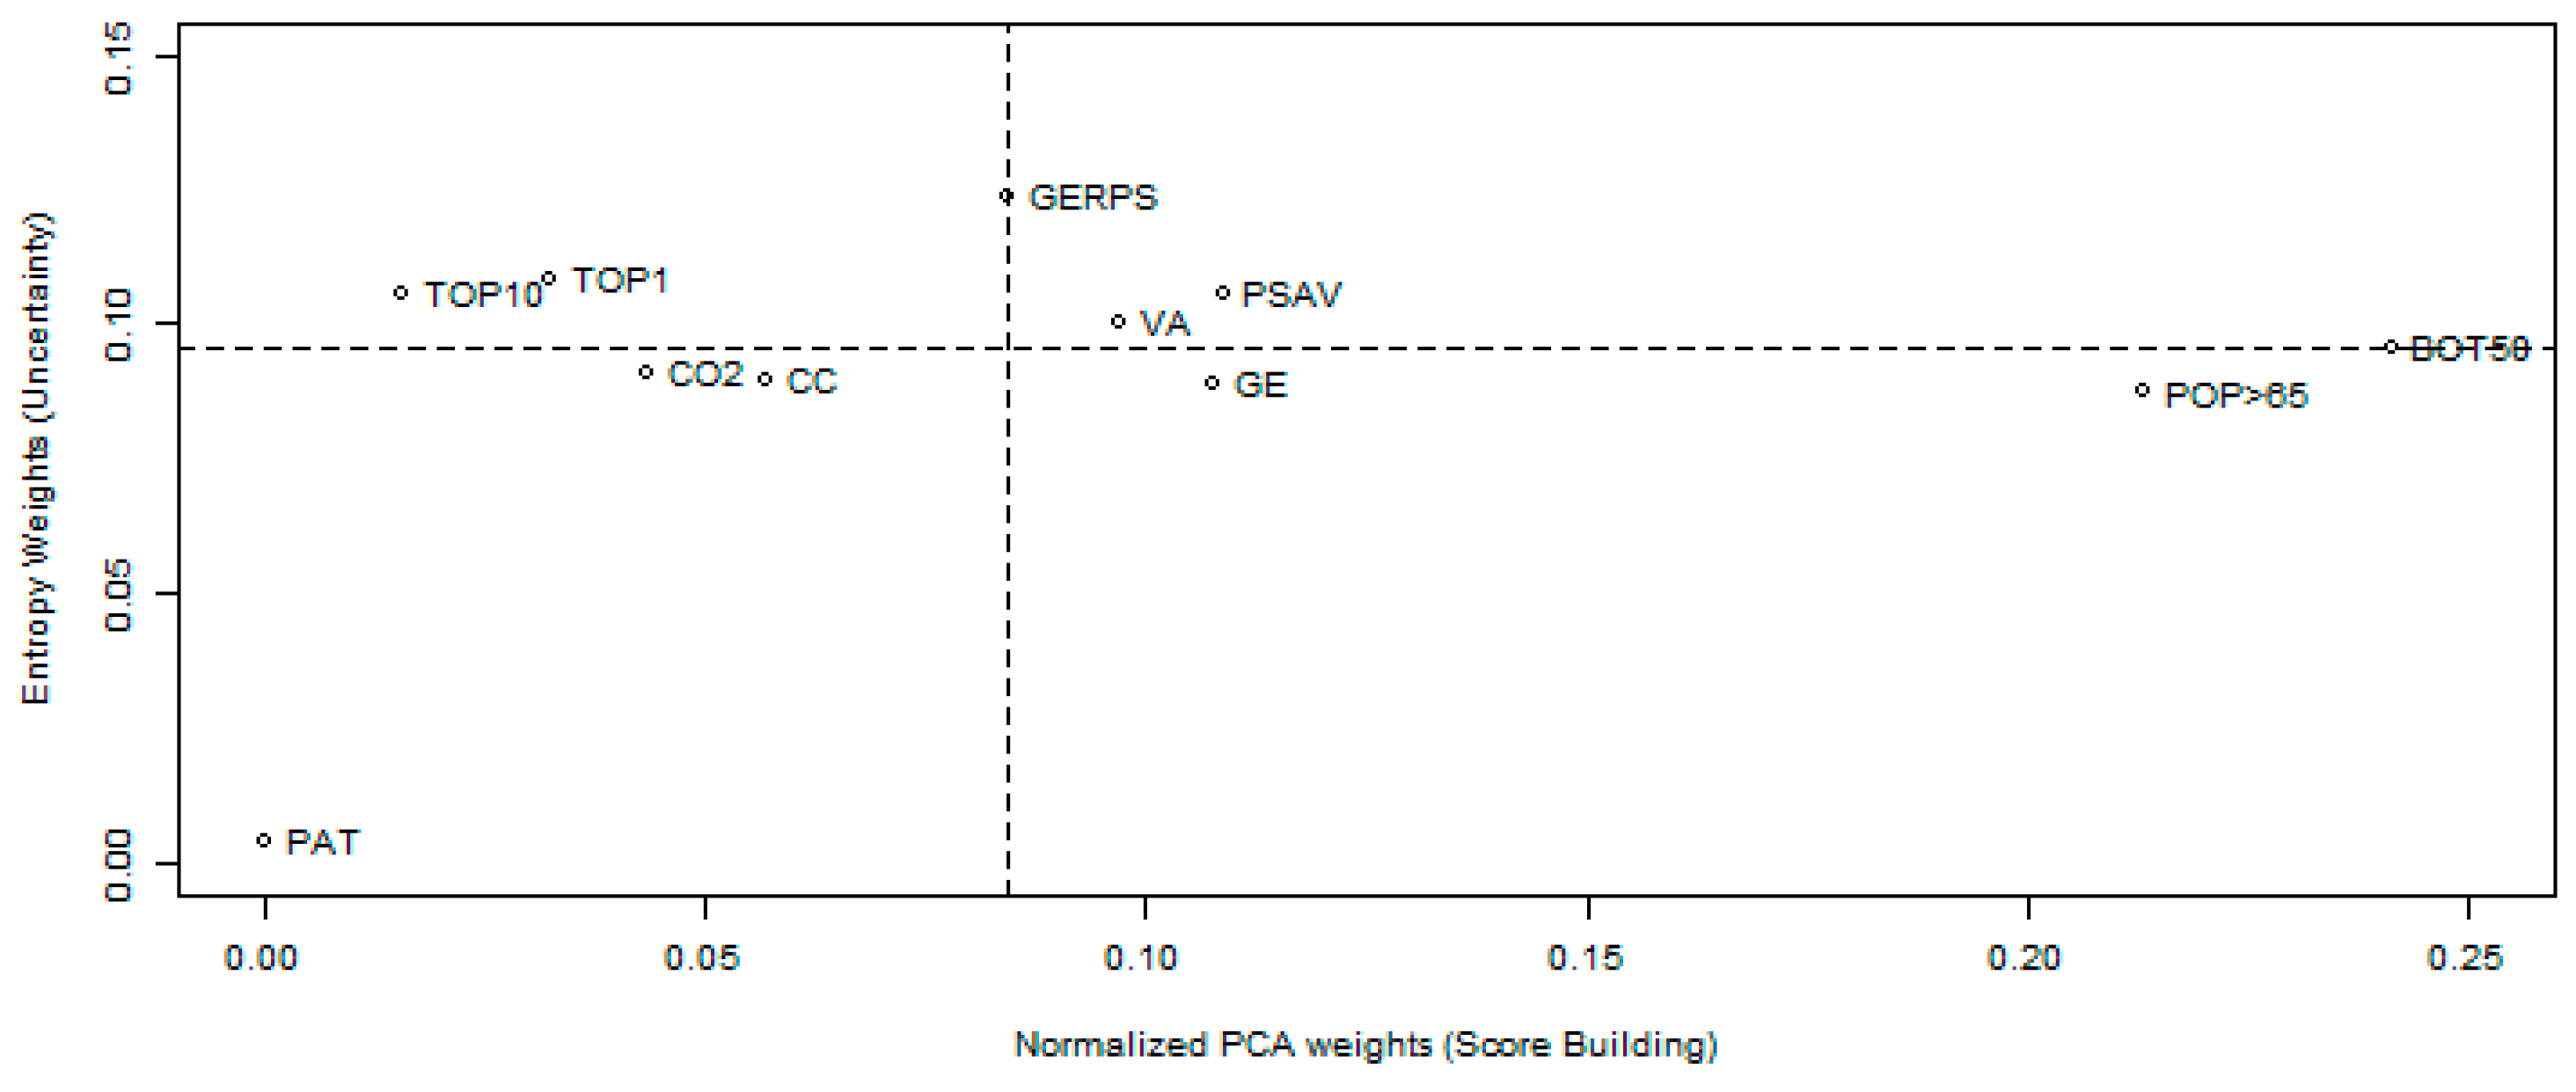
- Within this novel model, namely Performance Contribution Analysis (PCA), the use of information entropy for criteria weighting could help address subjectivity and bias in current ESG indicators. Information entropy provides a measure of the uncertainty or variability in the data, which can be used to objectively weigh the importance of different criteria when composing or computing final scores [14]
- On the other hand, using Clifford algebra to decompose overall scores into partial criteria contributions can help address the issue of transparency and consistency in current ESG indicators [15].
- By decomposing the overall score into partial contributions from each criterion, the model can provide a more detailed and nuanced understanding of how a country’s performance is numerically built upon different ESG factors. This can help identify areas of strength and weakness, as well as potential trade-offs and synergies between different criteria [16].
- This score composition (using information entropy weights) with further decomposition (using Clifford algebra) could help in generating a PCA 2 × 2 matrix for decision-makers in prioritizing ESG policies at the country level. Criteria with high information entropy and high contribution to the overall country’s score would be considered key criteria for policy formulation, as they are both important and uncertain [17].
- On the other hand, criteria with low information entropy and low contribution to the overall score would receive lower priorities in policy formulation, as they are less important and more predictable. This paper also contributes to considering many countries across multiple continents worldwide. Previously, studies have been limited to specific regions or countries, but in this paper, we attempt to cover the majority of the countries globally in comparison to previous studies [18].
2. Literature Review
3. Methodology
3.1. Background
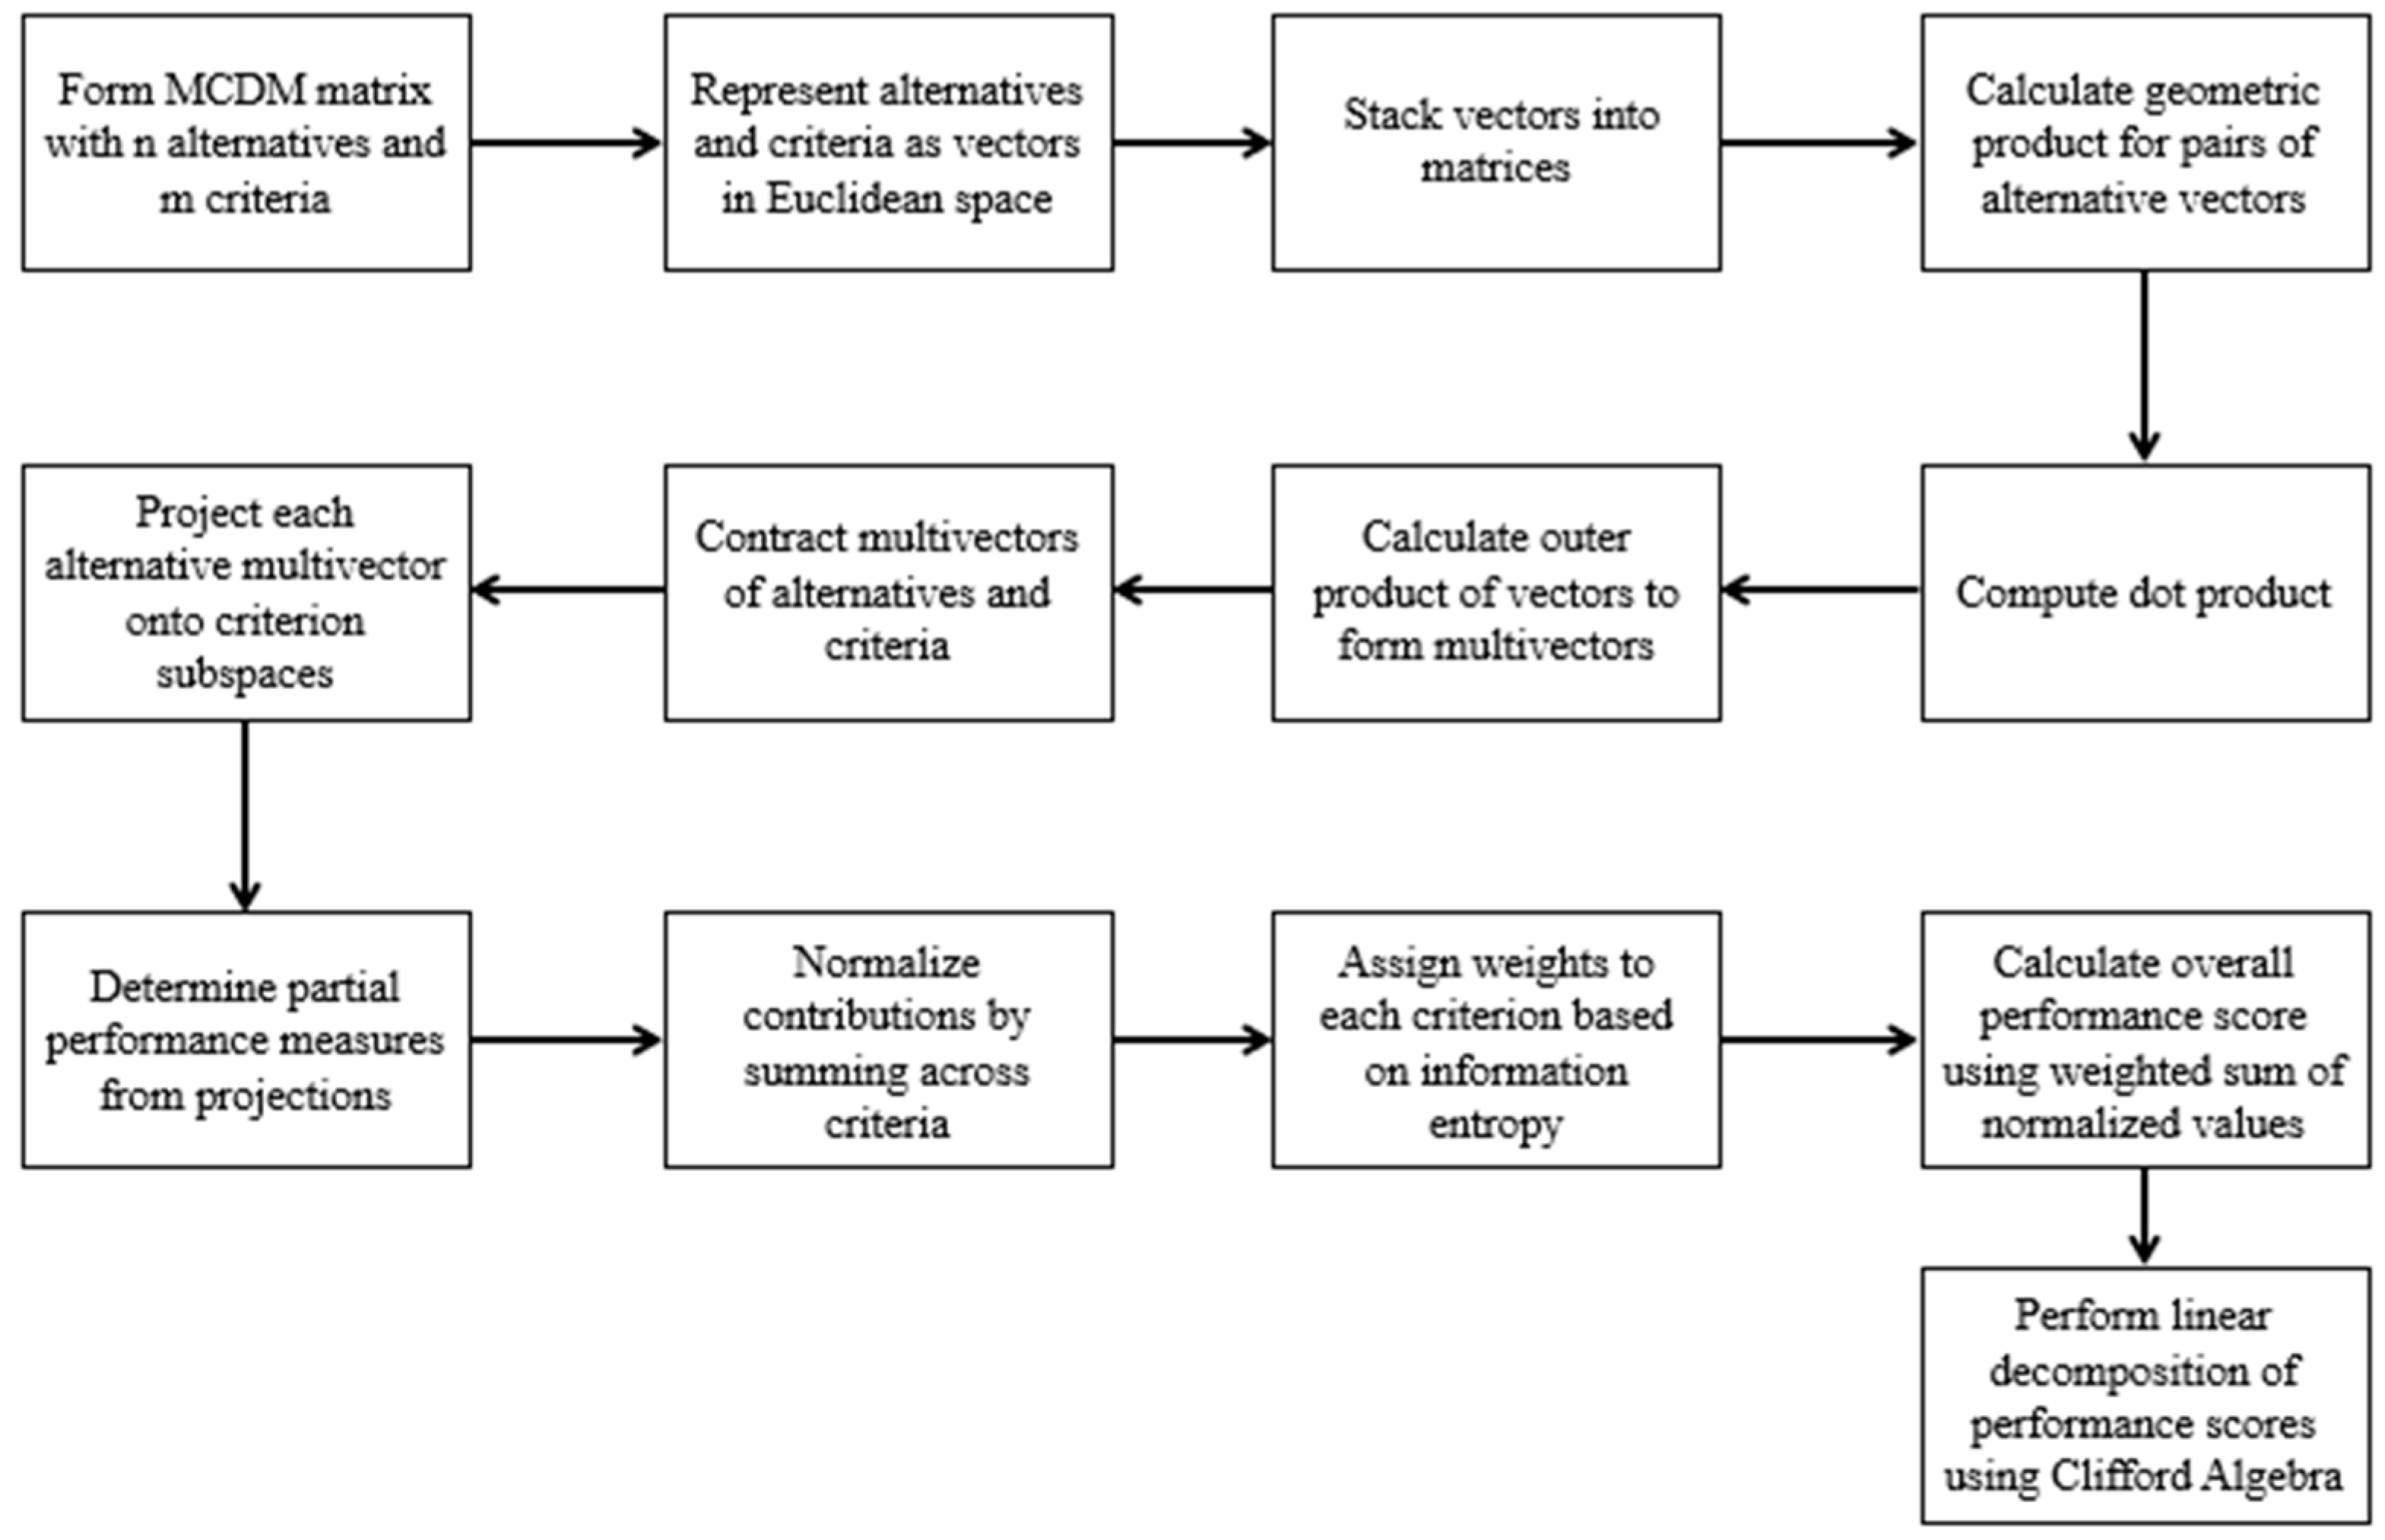
3.2. Clifford Algebra Applied to MCDM
3.3. Outer Product
3.4. Performance Contribution Analysis
3.5. Information Entropy Weights for Each Criterion
3.6. Overall Performance Score per Alternative and Linear Decomposition
3.7. Limitations of Methods and Assumptions
3.7.1. Limitations
3.7.2. Assumptions
3.8. Selecting Factor
3.9. Type of Data
4. Analysis and Discussion of Results
4.1. Data and Variable Classification
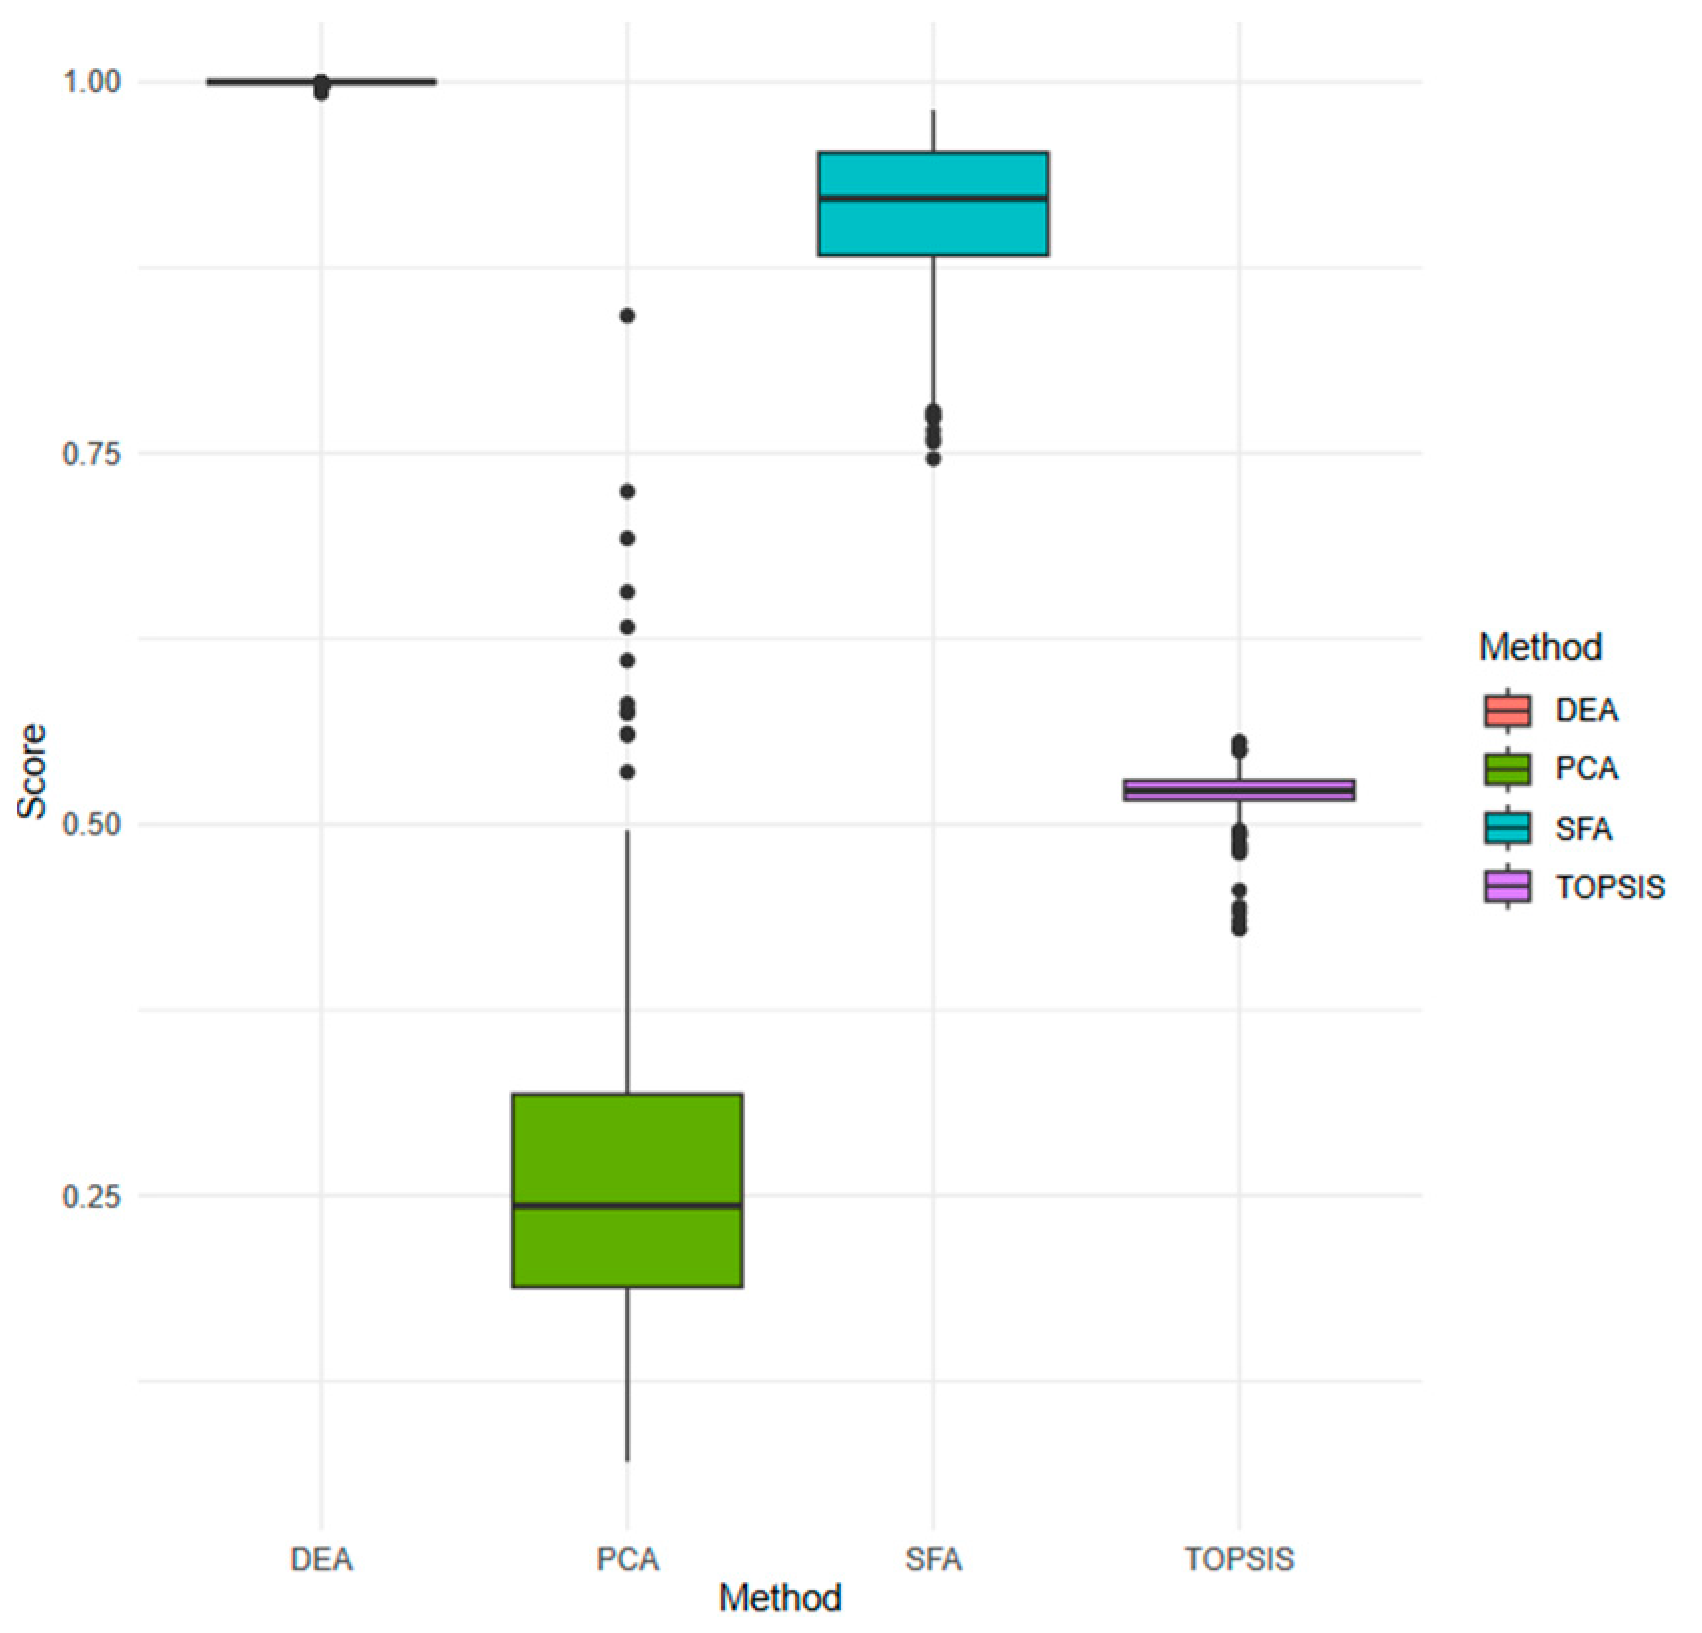
4.2. Results of the PCA and the Comparison between PCA and Other Methods
4.3. Results of the OLS
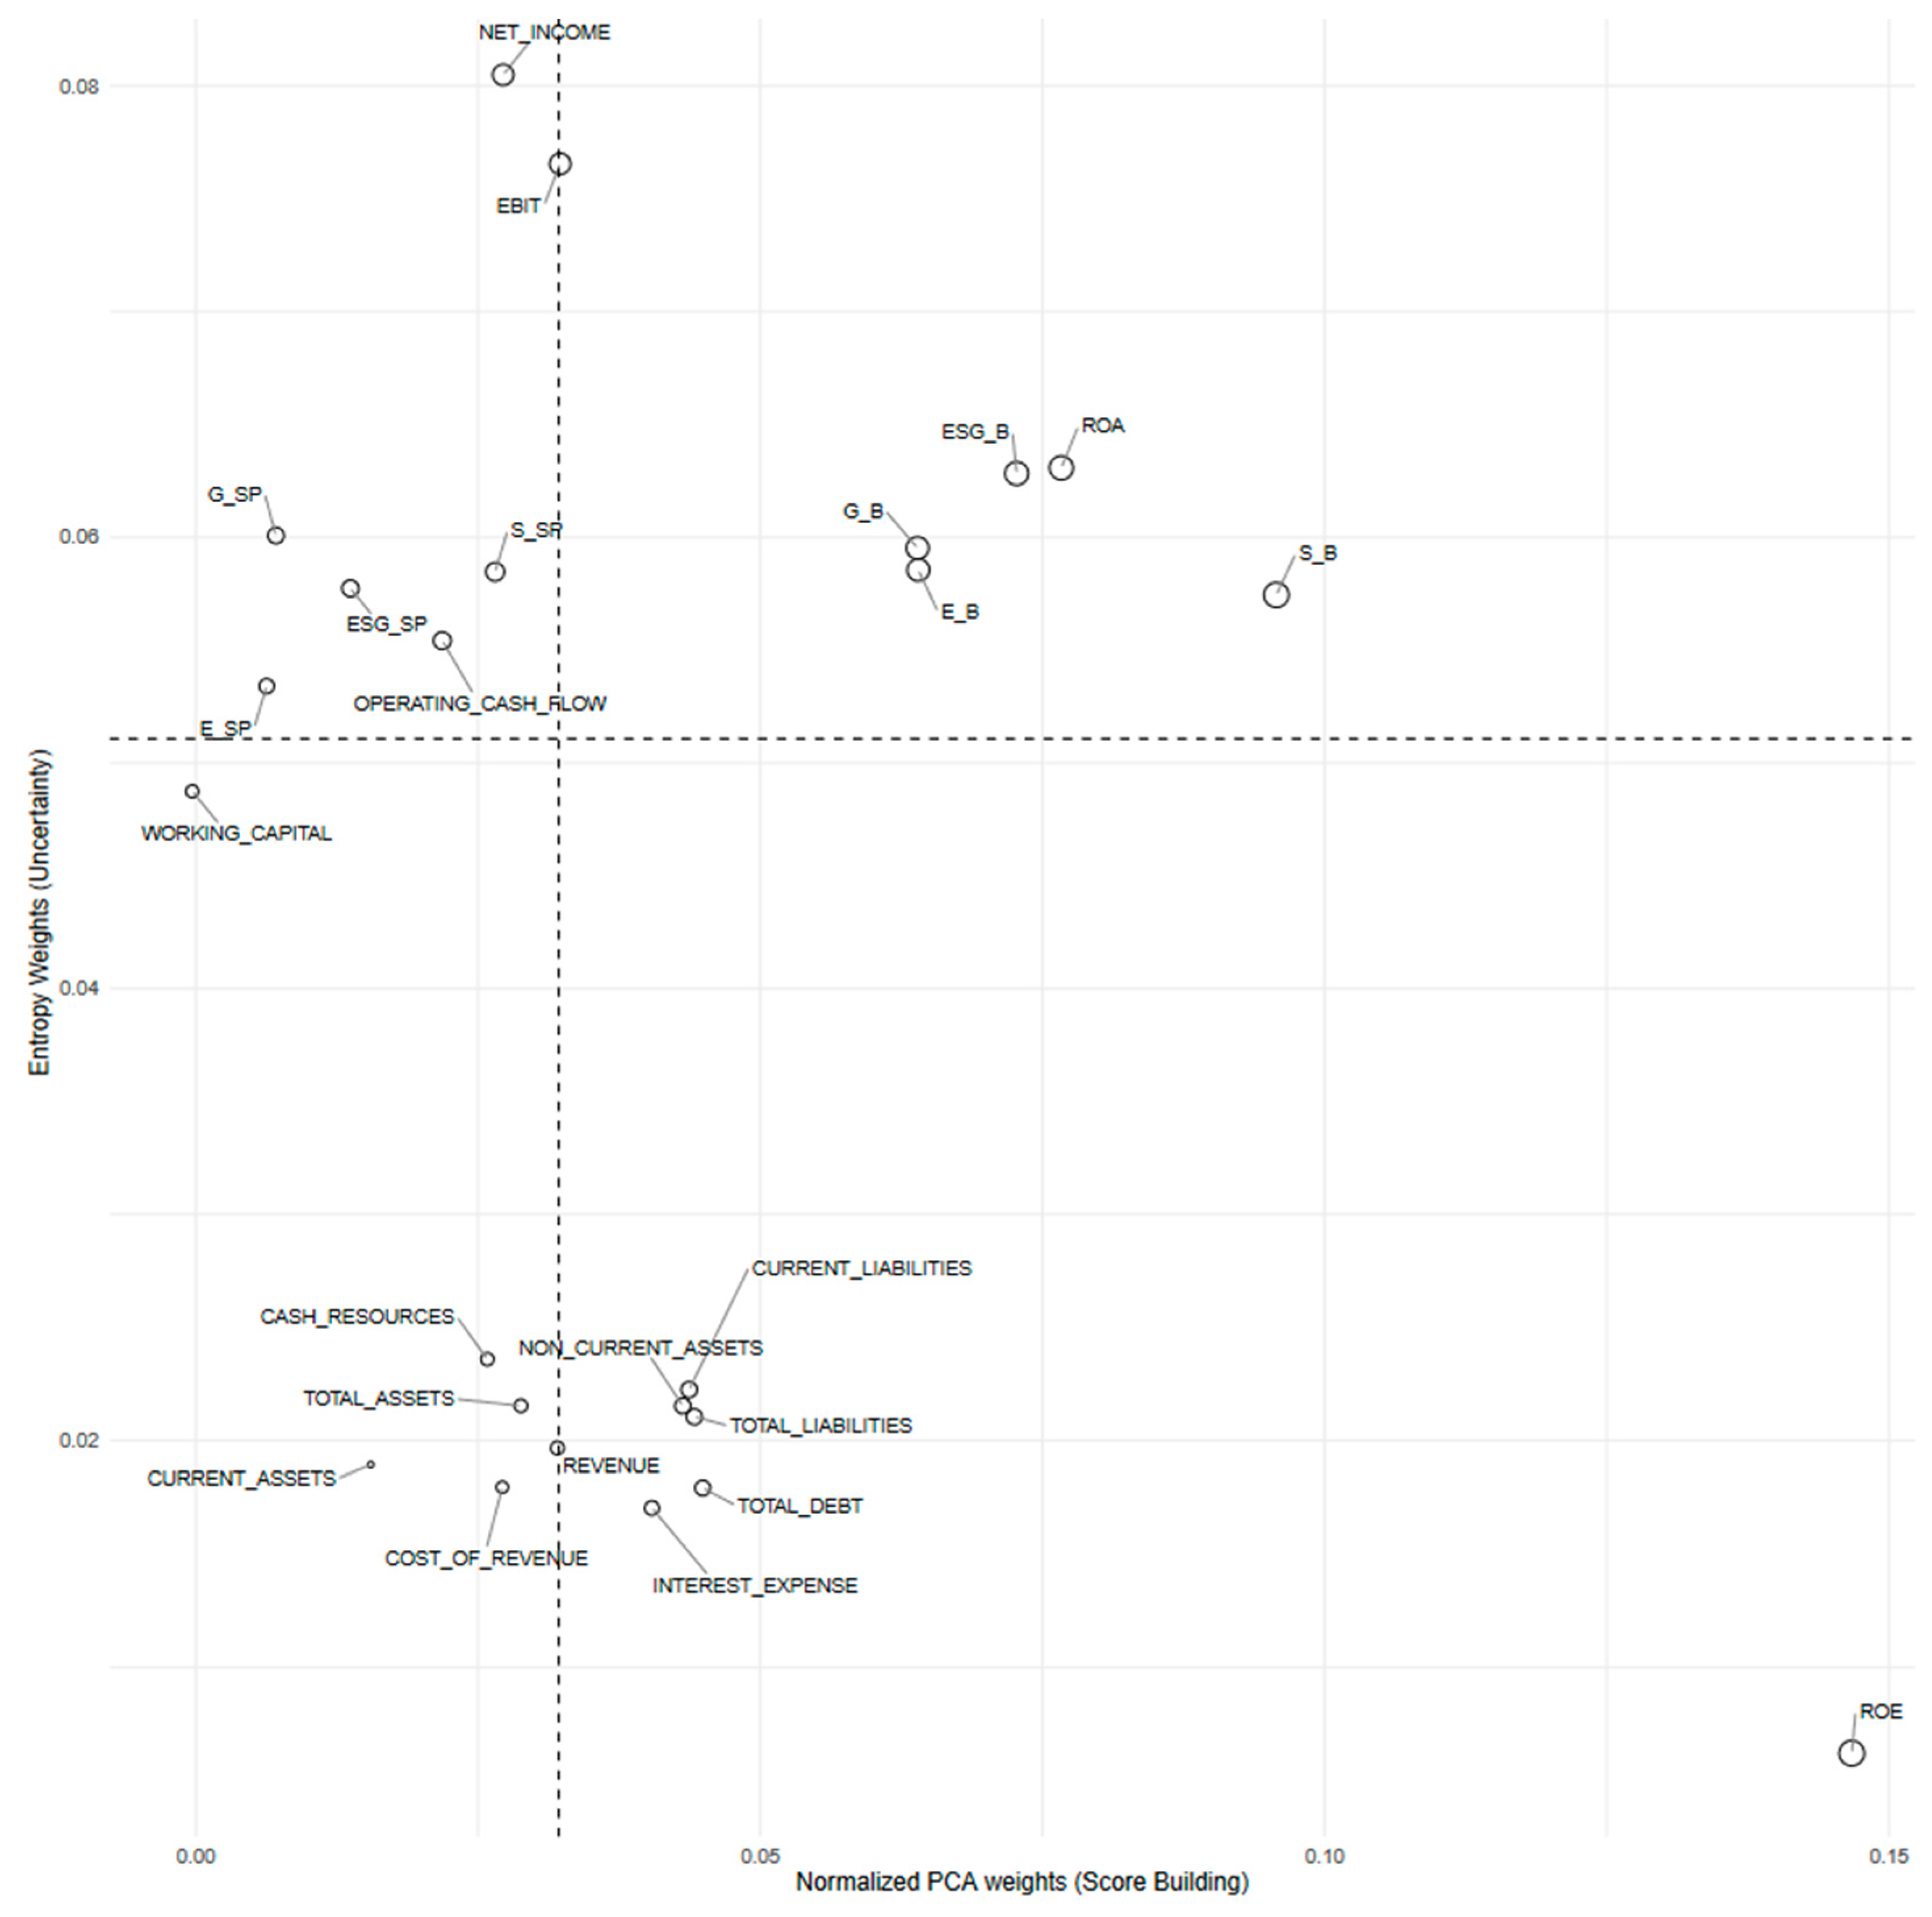
4.4. PCA and Information Entropy
5. Conclusions
Author Contributions
Funding
Data Availability Statement
Conflicts of Interest
Appendix A. Application of Methodology to Alternative Dataset


| Variable | Type | Min | Median | Max | Mean | SD | CV | Skewness | Kurtosis | Entropy |
|---|---|---|---|---|---|---|---|---|---|---|
| REVENUE | Positive | 49,724 | 98,897,248.5 | 76,332,345,000 | 5,654,551,850.939 | 12,248,181,215.409 | 2.166 | 3.084 | 10.619 | 0.330 |
| NET_INCOME | Positive | −2,172,768,809 | 8,325,208.5 | 6,617,239,000 | 179,528,329.607 | 584,974,544.913 | 3.258 | 5.905 | 60.039 | 0.319 |
| EBIT | Positive | −2,516,231,412 | 19,000,657 | 9,855,899,000 | 353,078,264.742 | 943,857,429.310 | 2.673 | 5.145 | 42.902 | 0.304 |
| ROE | Positive | −227 | 0.084 | 7.417 | −0.805 | 14.548 | −18.068 | −15.403 | 236.499 | 0.031 |
| ROA | Positive | −0.375 | 0.032 | 0.263 | 0.041 | 0.054 | 1.334 | −1.212 | 16.443 | 0.561 |
| CASH_RESOURCES | Positive | 16,418 | 35,776,230.500 | 4,775,166,000 | 407,835,401.193 | 801,630,993.986 | 1.966 | 2.887 | 9.374 | 0.396 |
| CURRENT_ASSETS | Positive | 47,563 | 158,190,641.500 | 46,621,630,000 | 2,623,390,356.180 | 5,981,378,261.584 | 2.280 | 4.133 | 21.169 | 0.348 |
| TOTAL_ASSETS | Positive | 952,264 | 337,121,269.000 | 91,471,614,000 | 7,006,978,817.488 | 14,469,025,803.046 | 2.065 | 3.065 | 11.118 | 0.359 |
| ESG_B | Positive | 4.063 | 54.573 | 100 | 53.301 | 24.294 | 0.456 | −0.113 | −1.062 | 0.787 |
| E_B | Positive | 1.6 | 52.950 | 100 | 53.750 | 27.223 | 0.506 | −0.100 | −1.111 | 0.785 |
| S_B | Positive | 2.5 | 55 | 100 | 54.036 | 27.927 | 0.517 | −0.038 | −1.193 | 0.778 |
| G_B | Positive | 0 | 52.363 | 100.5 | 52.118 | 27.984 | 0.537 | 0.050 | −1.078 | 0.779 |
| ESG_SP | Positive | 0 | 18.5 | 89 | 28.246 | 24.708 | 0.875 | 0.985 | −0.340 | 0.728 |
| E_SP | Positive | 0 | 18.524 | 96.163 | 29.100 | 27.794 | 0.955 | 1.010 | −0.351 | 0.731 |
| S_SP | Positive | 0 | 19.295 | 91 | 27.684 | 24.035 | 0.868 | 0.959 | −0.308 | 0.741 |
| G_SP | Positive | 0 | 19 | 103.765 | 28.349 | 24.179 | 0.853 | 0.990 | −0.124 | 0.709 |
| TOTAL_LIABILITIES | Negative | 337,170 | 175,464,854 | 36,666,671,000 | 3,426,387,833.590 | 7,093,829,776.213 | 2.070 | 2.499 | 5.816 | 0.380 |
| TOTAL_DEBT | Negative | 543,965 | 97,287,926 | 22,519,230,000 | 2,006,945,252.279 | 4,460,215,054.222 | 2.222 | 2.602 | 6.400 | 0.318 |
| WORKING_CAPITAL | Negative | −2,129,056,255 | 5,296,902 | 25,538,007,000 | 792,489,363.139 | 2,855,036,039.078 | 3.603 | 5.483 | 36.238 | 0.322 |
| OPERATING_CASH_FLOW | Negative | −826,654,211 | 13,850,435 | 8685737,000 | 482,971,384.451 | 1,169,752,703.034 | 2.422 | 3.868 | 17.694 | 0.362 |
| INTEREST_EXPENSE | Negative | 13,174 | 2,379,319 | 755,711,000 | 56,589,570.123 | 133,026,909.673 | 2.351 | 3.012 | 9.566 | 0.303 |
| COST_OF_REVENUE | Negative | 1600 | 78,253,415 | 64,451,219,000 | 4,644,586,483.877 | 10,696,550,981.778 | 2.303 | 3.246 | 11.571 | 0.317 |
| NON_CURRENT_ASSETS | Negative | 310,007 | 218,459,622 | 44,849,984,000 | 4,383,588,469.455 | 8,847,331,657.015 | 2.018 | 2.505 | 6.287 | 0.329 |
| CURRENT_LIABILITIES | Negative | 8920 | 88,538,511 | 21,083,623,000 | 1,830,900,993.029 | 3,728,051,602.709 | 2.036 | 2.737 | 7.722 | 0.383 |
References
- Senadheera, S.S.; Gregory, R.; Rinklebe, J.; Farrukh, M.; Rhee, J.H.; Ok, Y.S. The development of research on environmental, social, and governance (ESG): A bibliometric analysis. Sustain. Environ. 2022, 8, 2125869. [Google Scholar] [CrossRef]
- Singh, A.; Bathla, G. Environmental, Social, and Governance (ESG) Measures and Their Impact on Insurance Industry: A Global Perspective. In The Impact of Climate Change and Sustainability Standards on the Insurance Market; Scrivener Publishing LLC: Beverly, MA, USA, 2023; pp. 417–427. [Google Scholar]
- Dat, P.M.; Mau, N.D.; Loan, B.T.T.; Huy, D.T.N. Comparative China corporate governance standards after financial crisis, corporate scandals and manipulation. J. Secur. Sustain. Issues 2020, 9, 735–746. [Google Scholar] [CrossRef] [PubMed]
- Daugaard, D.; Ding, A. Global drivers for ESG performance: The body of knowledge. Sustainability 2022, 14, 2322. [Google Scholar] [CrossRef]
- Alkaraan, F.; Albitar, K.; Hussainey, K.; Venkatesh, V.G. Corporate transformation toward Industry 4.0 and financial performance: The influence of environmental, social, and governance (ESG). Technol. Forecast. Soc. Change 2022, 175, 121423. [Google Scholar] [CrossRef]
- Husnah, H.; Nurdin, D.; Kasim, M. Informativeness of environmental, social and governance (ESG) data on investment decisions: The mediating role purpose of investment. Int. J. Data Netw. Sci. 2023, 7, 1991–2000. [Google Scholar] [CrossRef]
- Dimson, E.; Marsh, P.; Staunton, M. Divergent ESG ratings. J. Portf. Manag. 2020, 47, 75–87. [Google Scholar] [CrossRef]
- Linnenluecke, M.K. Environmental, social and governance (ESG) performance in the context of multinational business research. Multinatl. Bus. Rev. 2022, 30, 1–16. [Google Scholar] [CrossRef]
- Simionescu, M.; Szeles, M.R.; Gavurova, B.; Mentel, U. The impact of quality of governance, renewable energy and foreign direct investment on sustainable development in CEE countries. Front. Environ. Sci. 2021, 9, 765927. [Google Scholar] [CrossRef]
- Montiel, I.; Cuervo-Cazurra, A.; Park, J.; Antolín-López, R.; Husted, B.W. Implementing the United Nations’ sustainable development goals in international business. J. Int. Bus. Stud. 2021, 52, 999–1030. [Google Scholar] [CrossRef]
- Kaewsaeng-on, R.; Mehmood, S. Quantile modeling for environmental risk: SAARC’s journey with green finance, policies, and regulations. J. Clean. Prod. 2024, 434, 140234. [Google Scholar] [CrossRef]
- Bai, F.; Shang, M.; Huang, Y. Corporate culture and ESG performance: Empirical evidence from China. J. Clean. Prod. 2024, 437, 140732. [Google Scholar] [CrossRef]
- Truant, E.; Borlatto, E.; Crocco, E.; Bhatia, M. ESG performance and technological change: Current state-of-the-art, development and future directions. J. Clean. Prod. 2023, 429, 139493. [Google Scholar] [CrossRef]
- Wu, R.M.X.; Zhang, Z.; Yan, W.; Fan, J.; Gou, J.; Liu, B.; Gide, E.; Soar, J.; Shen, B.; Fazal-e-Hasan, S. A comparative analysis of the principal component analysis and entropy weight methods to establish the indexing measurement. PLoS ONE 2022, 17, e0262261. [Google Scholar] [CrossRef] [PubMed]
- Ren, Y.; Zhi, Y.; Zhang, J. Geometric-algebra affine projection adaptive filter. EURASIP J. Adv. Signal Process. 2021, 2021, 82. [Google Scholar] [CrossRef]
- Costamagna, A.; De Micheli, G. Accuracy recovery: A decomposition procedure for the synthesis of partially-specified boolean functions. Integration 2023, 89, 248–260. [Google Scholar] [CrossRef]
- Zhang, Z. Mathematical Study on the Expressive Power of Machine Learning and Applications in Optimal Filtering Problems. Ph.D. Thesis, The Florida State University, Tallahassee, FL, USA, 2023. [Google Scholar]
- Fedajev, A.; Stanujkic, D.; Karabašević, D.; Brauers, W.K.M.; Zavadskas, E.K. Assessment of progress towards “Europe 2020” strategy targets by using the MULTIMOORA method and the Shannon Entropy Index. J. Clean. Prod. 2020, 244, 118895. [Google Scholar] [CrossRef]
- Li, C.; Tang, W.; Liang, F.; Wang, Z. The impact of climate change on corporate ESG performance: The role of resource misallocation in enterprises. J. Clean. Prod. 2024, 445, 141263. [Google Scholar] [CrossRef]
- Yan, J.; Huang, Y.; Liao, X. Help or hindrance? The impact of female executives on corporate ESG performance in China. J. Clean. Prod. 2024, 437, 140614. [Google Scholar] [CrossRef]
- Wang, W.; Sun, Z.; Wang, W.; Hua, Q.; Wu, F. The impact of environmental uncertainty on ESG performance: Emotional vs. rational. J. Clean. Prod. 2023, 397, 136528. [Google Scholar] [CrossRef]
- Zopounidis, C.; Garefalakis, A.; Lemonakis, C.; Passas, I. Environmental, social and corporate governance framework for corporate disclosure: A multicriteria dimension analysis approach. Manag. Decis. 2020, 58, 2473–2496. [Google Scholar] [CrossRef]
- Su, J.; Sun, Y. An Improved TOPSIS Model Based on Cumulative Prospect Theory: Application to ESG Performance Evaluation of State-Owned Mining Enterprises. Sustainability 2023, 15, 10046. [Google Scholar] [CrossRef]
- Meng, X.; Shaikh, G.M. Evaluating Environmental, Social, and Governance Criteria and Green Finance Investment Strategies Using Fuzzy AHP and Fuzzy WASPAS. Sustainability 2023, 15, 6786. [Google Scholar] [CrossRef]
- Quayson, M.; Bai, C.; Mahmoudi, A.; Hu, W.; Chen, W.; Omoruyi, O. Designing a decision support tool for integrating ESG into the natural resource extraction industry for sustainable development using the ordinal priority approach. Resour. Policy 2023, 85, 103988. [Google Scholar] [CrossRef]
- Escrig-Olmedo, E.; Rivera-Lirio, J.M.; Muñoz-Torres, M.J.; Fernández-Izquierdo, M.Á. Integrating multiple ESG investors’ preferences into sustainable investment: A fuzzy multicriteria methodological approach. J. Clean. Prod. 2017, 162, 1334–1345. [Google Scholar] [CrossRef]
- Park, S.R.; Jang, J.Y. The impact of ESG management on investment decision: Institutional investors’ perceptions of country-specific ESG criteria. Int. J. Financ. Stud. 2021, 9, 48. [Google Scholar] [CrossRef]
- Plastun, A.; Makarenko, I.; Krvchenko, O.; Ovcharova, N.; Oleksich, Z. ESG Disclosure Regulation: In Search of a Relationship with the Countries Competitiveness. Alex Plastun Inna Makarenko Olena Kravchenko Natalia Ovcharova Zhanna Oleksich 2019 ESG Discl. Regul. Search A Relatsh. Countries’ Competitiveness. Probl. Perspect. Manag. 2019, 17, 76–88. [Google Scholar]
- Costantiello, A.; Leogrande, A. The Impact of Voice and Accountability in the ESG Framework in a Global Perspective. Available online: https://papers.ssrn.com/sol3/papers.cfm?abstract_id=4398483 (accessed on 1 May 2024).
- Costantiello, A.; Leogrande, A. The Impact of Research and Development Expenditures on ESG Model in the Global Economy. Available online: https://papers.ssrn.com/sol3/papers.cfm?abstract_id=4414232 (accessed on 1 May 2024).
- Reig-Mullor, J.; Garcia-Bernabeu, A.; Pla-Santamaria, D.; Vercher-Ferrandiz, M. Evaluating ESG corporate performance using a new neutrosophic AHP-TOPSIS based approach. Technol. Econ. Dev. Econ. 2022, 28, 1242–1266. [Google Scholar] [CrossRef]
- Xidonas, P.; Essner, E. On ESG Portfolio Construction: A Multi-Objective Optimization Approach. Comput. Econ. 2024, 63, 21–65. [Google Scholar] [CrossRef] [PubMed]
- Camargo, H.G.; ANTUNES, J.; Wanke, P. ESG Performance Impact on Improvement of Financial Health—A Robust Compromise (Roco) Mcdm Approach. Available online: https://papers.ssrn.com/sol3/papers.cfm?abstract_id=4495437 (accessed on 1 May 2024).
- Mayne, J. Contribution analysis: An approach to exploring cause and effect. Available online: https://cgspace.cgiar.org/items/fdcce0f6-ad3b-4d8a-9b7f-8d1c7c820405 (accessed on 1 May 2024).
- Dugger, Z.; Halverson, G.; McCrory, B.; Claudio, D. Principal Component Analysis in MCDM: An exercise in pilot selection. Expert Syst. Appl. 2022, 188, 115984. [Google Scholar] [CrossRef]
- Teng, S.Y.; How, B.S.; Leong, W.D.; Teoh, J.H.; Cheah, A.C.S.; Motavasel, Z.; Lam, H.L. Principal component analysis-aided statistical process optimisation (PASPO) for process improvement in industrial refineries. J. Clean. Prod. 2019, 225, 359–375. [Google Scholar] [CrossRef]
- Hestenes, D.; Ziegler, R. Projective geometry with Clifford algebra. Acta Appl. Math. 1991, 23, 25–63. [Google Scholar] [CrossRef]
- Lundholm, D.; Svensson, L. Clifford algebra, geometric algebra, and applications. arXiv 2009, arXiv:0907.5356. [Google Scholar]
- Dong, X.; Lu, H.; Xia, Y.; Xiong, Z. Decision-making model under risk assessment based on entropy. Entropy 2016, 18, 404. [Google Scholar] [CrossRef]
- Kleeman, R. Information theory and dynamical system predictability. Entropy 2011, 13, 612–649. [Google Scholar] [CrossRef]
- Joubrel, M.; Maksimovich, E. ESG Data and Scores. In Valuation and Sustainability: A Guide to Include Environmental, Social, and Governance Data in Business Valuation; Springer: Berlin/Heidelberg, Germany, 2023; pp. 67–98. [Google Scholar]
- Huan, Y.; Liang, T.; Li, H.; Zhang, C. A systematic method for assessing progress of achieving sustainable development goals: A case study of 15 countries. Sci. Total Environ. 2021, 752, 141875. [Google Scholar] [CrossRef] [PubMed]
- Zidek, J.V.; Sun, W.; Le, N.D. Designing and integrating composite networks for monitoring multivariate Gaussian pollution fields. J. R. Stat. Soc. Ser. C Appl. Stat. 2000, 49, 63–79. [Google Scholar] [CrossRef]
- Angelova, D.; Bosello, F.; Bigano, A.; Giove, S. Sovereign rating methodologies, ESG and climate change risk: An overview. Available online: https://papers.ssrn.com/sol3/papers.cfm?abstract_id=3841948 (accessed on 1 May 2024).
- Chithambaranathan, P.; Subramanian, N.; Gunasekaran, A.; Palaniappan, P.L.K. Service supply chain environmental performance evaluation using grey based hybrid MCDM approach. Int. J. Prod. Econ. 2015, 166, 163–176. [Google Scholar] [CrossRef]
- Tan, Y.; Wanke, P.; Antunes, J.; Emrouznejad, A. Unveiling endogeneity between competition and efficiency in Chinese banks: A two-stage network DEA and regression analysis. Ann. Oper. Res. 2021, 306, 131–171. [Google Scholar] [CrossRef]
- Antunes, J.; Hadi-Vencheh, A.; Jamshidi, A.; Tan, Y.; Wanke, P. Bank efficiency estimation in China: DEA-RENNA approach. Ann. Oper. Res. 2022, 315, 1373–1398. [Google Scholar] [CrossRef]
- Thao, V.T.T.; Tien, N.H.; Anh, D.B.H. Sustainability Issues in Social Model of Coporate Social Responsibility Theoretical Analysis and Practical Implication. J. Adv. Res. Manag. 2019, 10, 17–29. [Google Scholar]
- Cruz, C.A.; Matos, F. ESG maturity: A software framework for the challenges of ESG data in investment. Sustainability 2023, 15, 2610. [Google Scholar] [CrossRef]
- Balan, P.; Antunes, J.; Wanke, P.; Tan, Y. The Black-Box of ESG Scores from Rating Agencies: What Do They Mean in Terms of Financial Indicators and Technological Frontiers? COPPEAD Working Paper; Federal University of Rio de Janeiro: Rio de Janeiro, Brazil, 2024. [Google Scholar]

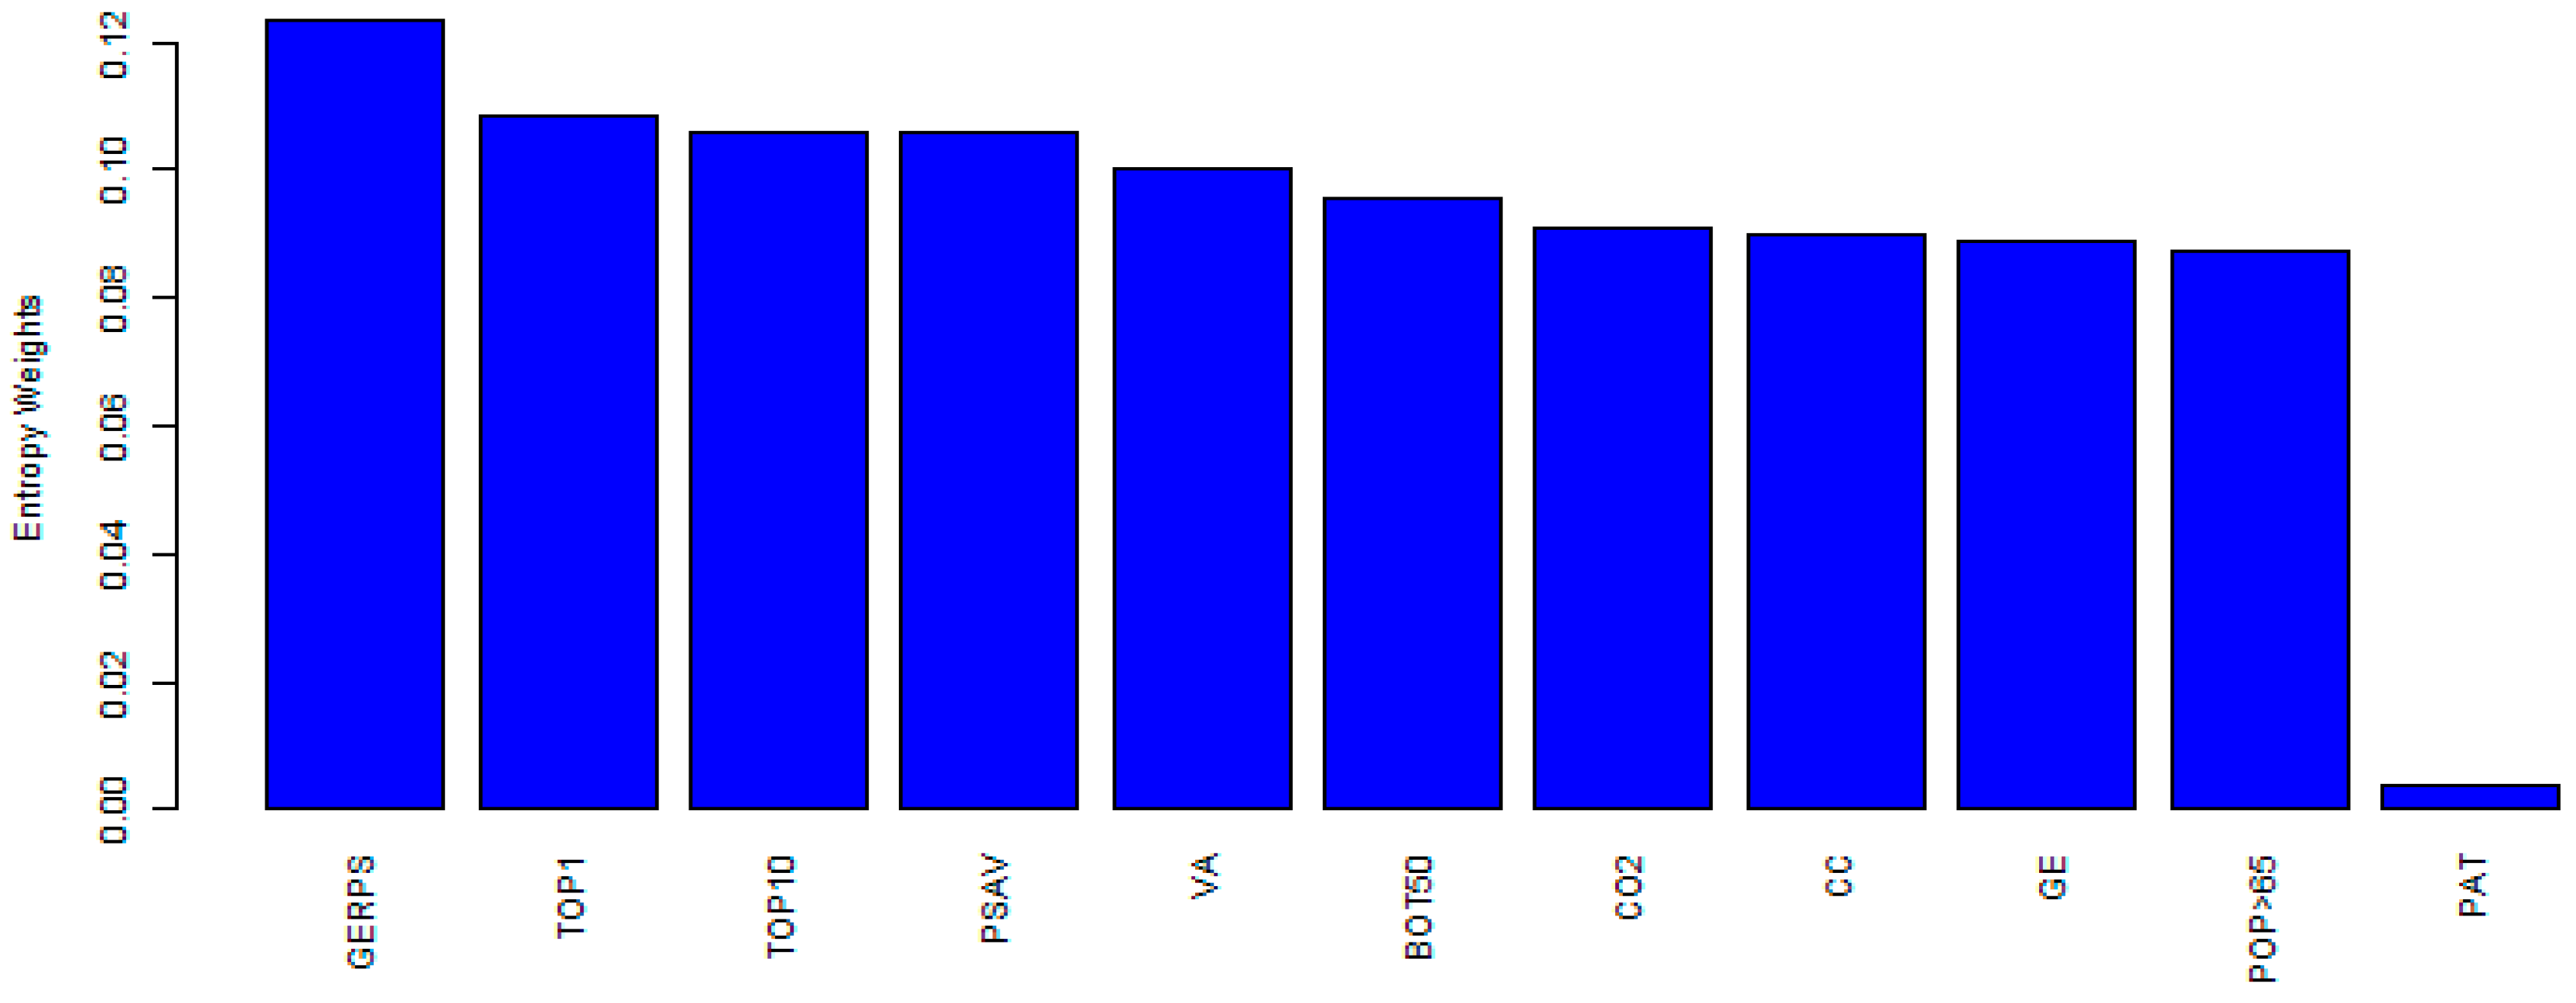
| Criteria | Direction | Acronym | Mean | SD | CV | Max | Min | Skewness | Kurtosis | Entropy |
|---|---|---|---|---|---|---|---|---|---|---|
| Control of Corruption | positive | CC | 0.94 | 0.72 | 0.77 | 2.40 | - | 0.59 | (1.07) | 7.36 |
| Government Effectiveness | positive | GE | 0.89 | 0.65 | 0.74 | 2.24 | - | 0.32 | (1.19) | 7.30 |
| Voice and Accountability | positive | VA | 0.92 | 0.53 | 0.58 | 2.12 | - | (0.11) | (1.25) | 7.17 |
| Political Stability and Absence of Violence | positive | PSAV | 0.70 | 0.42 | 0.60 | 2.01 | 0.01 | 0.20 | (0.88) | 7.04 |
| Patent | positive | PAT | 18,556.36 | 128,190.17 | 6.91 | 1,393,815 | 2.00 | 8.57 | 75.90 | 8.74 |
| Gross Enrollment Ratio—Primary School | positive | GERPS | 102.61 | 6.00 | 0.06 | 128.64 | 84.47 | 0.64 | 2.40 | 9.09 |
| Bottom 50% share—pre-tax national income | positive | BOT50 | 0.17 | 0.05 | 0.30 | 0.26 | 0.05 | (0.46) | (0.55) | 8.59 |
| CO2 emissions (kg per USD of GDP [43]) | negative | CO2 | 0.43 | 0.33 | 0.76 | 2.07 | 0.05 | 1.48 | 2.27 | 9.09 |
| Top 10% share—pre-tax national income | negative | TOP10 | 0.42 | 0.10 | 0.24 | 0.68 | 0.27 | 0.92 | (0.09) | 8.66 |
| Top 1% share—pre-tax national income | negative | TOP10 | 0.15 | 0.05 | 0.33 | 0.31 | 0.07 | 1.20 | 1.20 | 8.55 |
| Population ages 65 and above | negative | POP > 65 | 0.13 | 0.06 | 0.42 | 0.22 | 0.03 | (0.26) | (1.33) | 9.09 |
| Mean | SD | CV | Max | Min | Skewness | Kurtosis | Entropy | |
|---|---|---|---|---|---|---|---|---|
| GDP per capita | 31,137.60 | 21,400.91 | 0.69 | 116,283.70 | 1047.59 | 1.40 | 2.89 | 9.09 |
| Population | 75,847,211.84 | 250,939,932.49 | 3.31 | 1,407,745,000.00 | 318,041.00 | 4.76 | 21.20 | 9.09 |
| Foreign trade/GDP | 101.02 | 66.39 | 0.66 | 379.10 | 22.49 | 2.19 | 5.34 | 9.09 |
| Country Count | |||||
|---|---|---|---|---|---|
| Armenia | 10 | Finland | 10 | Mozambique | 10 |
| Australia | 10 | France | 10 | NewZealand | 10 |
| Austria | 10 | Georgia | 10 | Norway | 10 |
| Azerbaijan | 10 | Germany | 10 | Peru | 10 |
| Belarus | 10 | Greece | 10 | Portugal | 10 |
| Belgium | 10 | Guatemala | 10 | Romania | 10 |
| Bulgaria | 10 | Hungary | 10 | Serbia | 10 |
| Canada | 10 | India | 10 | Singapore | 10 |
| Chile | 10 | Indonesia | 9 | Slovakia | 10 |
| China | 10 | Ireland | 10 | SouthAfrica | 10 |
| Colombia | 10 | Israel | 10 | Spain | 10 |
| CostaRica | 10 | Latvia | 10 | Sweden | 10 |
| Croatia | 9 | Lithuania | 10 | Switzerland | 10 |
| Cyprus | 10 | Luxembourg | 10 | Thailand | 10 |
| CzechRepublic | 10 | Malaysia | 10 | Turkey | 10 |
| Denmark | 8 | Malta | 10 | UnitedKingdom | 10 |
| Ecuador | 10 | Mexico | 10 | Uzbekistan | 10 |
| Estonia | 10 | Morocco | 10 | Vietnam | 10 |
| Year Count | |||||
| 2010 | 55 | 2014 | 55 | 2018 | 55 |
| 2011 | 53 | 2015 | 55 | 2019 | 55 |
| 2012 | 53 | 2016 | 55 | ||
| 2013 | 55 | 2017 | 55 | ||
| PCA | DEA | SFA | TOPSIS | Average | |
|---|---|---|---|---|---|
| PCA | 1.0000 | 0.4678 | 0.7739 | 0.5290 | 0.6927 |
| DEA | 0.4678 | 1.0000 | 0.5202 | 0.5084 | 0.6241 |
| SFA | 0.7739 | 0.5202 | 1.0000 | 0.3543 | 0.6621 |
| TOPSIS | 0.5290 | 0.5084 | 0.3543 | 1.0000 | 0.5979 |
| Mean | SD | CV | Max | Min | Skewness | Kurtosis | Entropy | |
|---|---|---|---|---|---|---|---|---|
| DEA | 0.835 | 0.153 | 0.183 | 1.000 | 0.392 | (0.680) | (0.529) | 7.666 |
| PCA | 0.360 | 0.084 | 0.233 | 0.587 | 0.186 | 0.387 | (0.685) | 9.093 |
| SFA | 1.060 | 0.020 | 0.018 | 1.164 | 1.029 | 0.955 | 1.594 | 9.093 |
| TOPSIS | 0.303 | 0.057 | 0.188 | 0.731 | 0.183 | 2.944 | 19.147 | 9.093 |
| Coefficient | t-Value | p-Value | |
|---|---|---|---|
| (Intercept) | 0.3588050388 * | 76.95958153 | 3.70 × 10−121 |
| Trend | −0.0004424813 | −0.02089351 | 9.83 × 10⁵ |
| Trend2 | −0.0016312695 | −0.07695365 | 9.39 × 10⁵ |
| GDP per capita | 0.0638894040 * | 10.54915716 | 4.98 × 10⁻¹⁴ |
| Population | 0.0044968509 | 0.92006019 | 3.59 × 10⁵ |
| Foreign trade | −0.0132574130 * | −2.21560559 | 2.81 × 10⁴ |
| Estimate | Std. Error | t-Value | Pr (>|t|) | Sig. | |
|---|---|---|---|---|---|
| (Intercept) | 0.250 | 0.011 | 21.808 | 0.000 | * |
| Sweden | 0.276 | 0.015 | 18.916 | 0.000 | * |
| Finland | 0.255 | 0.015 | 17.492 | 0.000 | * |
| New Zealand | 0.240 | 0.015 | 16.465 | 0.000 | * |
| Luxembourg | 0.235 | 0.015 | 16.084 | 0.000 | * |
| Switzerland | 0.232 | 0.015 | 15.900 | 0.000 | * |
| Denmark | 0.230 | 0.015 | 15.777 | 0.000 | * |
| India | 0.223 | 0.015 | 15.287 | 0.000 | * |
| Norway | 0.222 | 0.015 | 15.190 | 0.000 | * |
| Canada | 0.216 | 0.015 | 14.782 | 0.000 | * |
| Germany | 0.213 | 0.015 | 14.586 | 0.000 | * |
| Austria | 0.200 | 0.015 | 13.724 | 0.000 | * |
| Australia | 0.186 | 0.015 | 12.772 | 0.000 | * |
| United Kingdom | 0.175 | 0.015 | 11.993 | 0.000 | * |
| Chile | 0.158 | 0.015 | 10.858 | 0.000 | * |
| Singapore | 0.156 | 0.015 | 10.708 | 0.000 | * |
| Estonia | 0.153 | 0.015 | 10.472 | 0.000 | * |
| Belgium | 0.148 | 0.015 | 10.180 | 0.000 | * |
| Portugal | 0.148 | 0.015 | 10.163 | 0.000 | * |
| France | 0.146 | 0.015 | 10.040 | 0.000 | * |
| Uzbekistan | 0.142 | 0.015 | 9.705 | 0.000 | * |
| China | 0.133 | 0.015 | 9.150 | 0.000 | * |
| Malta | 0.133 | 0.015 | 9.125 | 0.000 | * |
| Czech Republic | 0.127 | 0.015 | 8.689 | 0.000 | * |
| Israel | 0.114 | 0.015 | 7.821 | 0.000 | * |
| Lithuania | 0.107 | 0.015 | 7.364 | 0.000 | * |
| Spain | 0.106 | 0.015 | 7.264 | 0.000 | * |
| Belarus | 0.099 | 0.015 | 6.766 | 0.000 | * |
| Cyprus | 0.094 | 0.015 | 6.304 | 0.000 | * |
| Mozambique | 0.084 | 0.015 | 5.790 | 0.000 | * |
| Thailand | 0.084 | 0.015 | 5.762 | 0.000 | * |
| Azerbaijan | 0.084 | 0.015 | 5.725 | 0.000 | * |
| Georgia | 0.081 | 0.015 | 5.545 | 0.000 | * |
| Hungary | 0.079 | 0.015 | 5.418 | 0.000 | * |
| Costa Rica | 0.073 | 0.015 | 5.033 | 0.000 | * |
| Slovakia | 0.070 | 0.015 | 4.780 | 0.000 | * |
| Vietnam | 0.067 | 0.015 | 4.594 | 0.000 | * |
| Latvia | 0.066 | 0.015 | 4.497 | 0.000 | * |
| Mexico | 0.057 | 0.015 | 3.932 | 0.000 | * |
| Turkey | 0.056 | 0.015 | 3.872 | 0.000 | * |
| Bulgaria | 0.052 | 0.015 | 3.561 | 0.000 | * |
| Serbia | 0.041 | 0.015 | 2.837 | 0.005 | * |
| Peru | 0.038 | 0.015 | 2.636 | 0.009 | * |
| Indonesia | 0.038 | 0.015 | 2.591 | 0.010 | * |
| Croatia | 0.032 | 0.015 | 2.224 | 0.027 | * |
| Guatemala | 0.031 | 0.015 | 2.105 | 0.036 | * |
| Malaysia | 0.030 | 0.015 | 2.047 | 0.041 | * |
| Colombia | 0.021 | 0.015 | 1.465 | 0.144 | |
| Morocco | 0.020 | 0.015 | 1.354 | 0.176 | |
| South Africa | 0.018 | 0.015 | 1.259 | 0.209 | |
| Greece | 0.018 | 0.015 | 1.246 | 0.213 | |
| Armenia | 0.012 | 0.015 | 0.824 | 0.410 | |
| Ireland | 0.008 | 0.015 | 0.558 | 0.577 | |
| Romania | 0.006 | 0.015 | 0.430 | 0.668 | |
| Trend | 0.000 | 0.002 | 0.131 | 0.896 | |
| Trend2 | (0.000) | 0.000 | (0.230) | 0.818 |
Disclaimer/Publisher’s Note: The statements, opinions and data contained in all publications are solely those of the individual author(s) and contributor(s) and not of MDPI and/or the editor(s). MDPI and/or the editor(s) disclaim responsibility for any injury to people or property resulting from any ideas, methods, instructions or products referred to in the content. |
© 2024 by the authors. Licensee MDPI, Basel, Switzerland. This article is an open access article distributed under the terms and conditions of the Creative Commons Attribution (CC BY) license (https://creativecommons.org/licenses/by/4.0/).
Share and Cite
Tan, Y.; Karbassi Yazdi, A.; Antunes, J.; Wanke, P.; Gunasekaran, A.; Corrêa, H.L.; Coluccio, G. The Quest for an ESG Country Rank: A Performance Contribution Analysis/MCDM Approach. Mathematics 2024, 12, 1865. https://doi.org/10.3390/math12121865
Tan Y, Karbassi Yazdi A, Antunes J, Wanke P, Gunasekaran A, Corrêa HL, Coluccio G. The Quest for an ESG Country Rank: A Performance Contribution Analysis/MCDM Approach. Mathematics. 2024; 12(12):1865. https://doi.org/10.3390/math12121865
Chicago/Turabian StyleTan, Yong, Amir Karbassi Yazdi, Jorge Antunes, Peter Wanke, Angappa Gunasekaran, Henrique Luiz Corrêa, and Giuliani Coluccio. 2024. "The Quest for an ESG Country Rank: A Performance Contribution Analysis/MCDM Approach" Mathematics 12, no. 12: 1865. https://doi.org/10.3390/math12121865
APA StyleTan, Y., Karbassi Yazdi, A., Antunes, J., Wanke, P., Gunasekaran, A., Corrêa, H. L., & Coluccio, G. (2024). The Quest for an ESG Country Rank: A Performance Contribution Analysis/MCDM Approach. Mathematics, 12(12), 1865. https://doi.org/10.3390/math12121865