1. Introduction
As one of the best-selling platforms in the mobile intelligent terminal market, the Android system has a higher market share with the popularization of smart phones, tablet PCs and smart wearable devices in recent years.
According to the 46th “Statistical Report on Internet Development in China” [
1] of the China Internet Information Center in 2020, in the first half of 2020, affected by the epidemic, employment pressure has increased significantly in China. New businesses and new models under the Internet platform economy have added a large number of jobs and are becoming an important force supporting employment. Personal Internet applications have shown a steady increase and expansion. In 2020, the Internet penetration rate reached 67.0%, and the proportion of Chinese Internet users using mobile terminals to access the Internet reached 99.2%.
At the same time, malicious software for the Android system emerged in a large stream. “The special report on Android malware in 2019” [
2] pointed out that in the whole year of 2019, the 360 Brain of Security intercepted about 1.809 million new malicious program samples on mobile terminals, an increase of 5000 new mobile phone malicious program samples every day on average. The 360 Brain of Security has intercepted about 950 million malicious program attacks for mobile phone users nationwide, with an average of about 2.592 million attacks on mobile phones every day. In terms of the number of vulnerabilities in 2019, the product which had been ranked first in the Android market has 44 vulnerabilities. Therefore, the comprehensive detection of Android system malware has been a major problem in the industry field.
At present, the methods for detecting Android malware are divided into static detection and dynamic detection [
3]. The first detection method mainly analyzes APK files and also features from configuration files and code files by the decompilation technique. The dynamic detection method mainly monitors data and function calls in the software running process, then processes and fuses features for matching [
4,
5].
For example, Cui Yanpeng [
6] and others put forward an Android malware detection method based on an abstract API call sequence. The method adopted the API package name, confusion name and user-defined name to abstract the API call sequence so that the abstracted sequence did not depend on the API version. On this basis, the random forest classification algorithm was used to detect the malware. This method only detected malicious software from the static analysis point of view but ignored the action of dynamic features. In the same way, the detection method proposed by Song Xin et al. based on the random forest algorithm [
7] only defined authority permissions based on Android, and the accuracy of the detection results was relatively low. In addition, the detection method of mining data’s hidden features proposed by Zhang Yuling [
8] and the detection method based on an improved association rule mining algorithm proposed by Yan Zhe [
9] et al. did not analyze and detect the dynamic behavior of software during the runtime. Although Wu Fan [
10] obtained some hybrid features based on dynamic analysis and static analysis, respectively, the analysis and extraction of dynamic features were not comprehensive and did not fully consider the user’s current software operating status, as Su also found [
11].
In summary, the research methods for mobile terminal malware detection by domestic and foreign researchers have their own merits and advantages. However, the features they extract or analyze have been limited to a certain aspect, have only used Android permissions as valid features or have only analyzed the native code, and the above-mentioned researchers did not fully explain the basis for the selection of features.
Therefore, in order to improve the detection accuracy and efficiency for mobile terminals of its malware, this paper proposed a mobile terminal malware detection method based on API call sequences. Firstly, the paper analyzed the dex object of mobile terminals software, obtained its API call sequence and then used the AndroGuard [
12] tool to obtain the function call graph of APK files. Secondly, the paper used a series of feature preprocessing techniques to remove the redundant processing of the API call relationship and obtained the time series-based API call sequences. Finally, the recurrent neural network method (RNN) was used to build the model and perform detection and verification. Furthermore, this paper constructed a malware detection model based on a two-way recurrent neural network and used the two-way LSTM network model to train the data set. The contribution of our malware detection technology is mainly reflected in the following four points:
- (1)
The paper proposed an Android malware detection method based on API call sequences, which used the API call sequence as training and detection samples, used a two-way recurrent neural network as its detection model and adopted the cloud platform system as its deployment platform to improve the efficiency of malware detection;
- (2)
The paper proposed an API call sequence extraction method through analysis of the dex object of mobile terminals software to improve malware detection accuracy and efficiency for mobile terminals;
- (3)
The paper proposed a series of feature preprocessing techniques, such as redundant subsequence removal and continuous same mode API removal, to remove the redundant processing of the API call relationship and obtained the time series-based API call sequence;
- (4)
The paper adopted the recurrent neural network method to build the detection method and perform its detection and verification, which constructed a malware detection model based on a two-way recurrent neural network and used the two-way LSTM network model to train the data set.
The remainder of the paper is organized as follows.
Section 2 discusses the related work.
Section 3 describes the Android malware detection model, which mainly includes an API call sequence extraction method, API call sequence processing method, API vectorization and malware detection model based on a recurrent neural network.
Section 4 presents the cloud platform system design and deployment.
Section 5 discusses the experimental setup and result analysis.
Section 6 concludes the article and gives future work.
2. Related Works
Dynamic detection and static detection are currently the mainstream methods for detecting malicious software. The first one refers to running malicious software in a simulated environment and analyzing whether it contains malicious behavior during program operation. However, the static detection method refers to the use of relevant tools to extract the behavioral characteristics of malicious software, such as opcodes, APIs, binary sequences, etc., without running the software; the detection method only uses the above data to complete detection and judgment.
Bernardi [
13] et al. proposed a process-oriented and dynamic mining detection method. This method identified the relationships and repeated execution patterns in the system call traces collected from the application software by the process mining technology to characterize its behavior. Jerbi [
14] et al. proposed an AMD method based on the genetic algorithm, which discovered new malicious behaviors by evolving a set of API call sequences and following this evolutionary rule. Kuma [
15] and others proposed a deep learning technology based on LSTM and encoding–decoding neural network architecture to detect and analyze malware by detecting the CPU, memory and battery usage. The above three sets of methods analyzed the process, API call sequence and system status, respectively, but they were all in a single way and did not detect or analyze multiple features. As a result, detection accuracy can only be improved by their own algorithms. Venkatraman et al. [
16] proposed an image-based hybrid method and deep learning architecture, which were applied in malware classification. This method measured detection performance by using various similarity measures of malware behavior patterns and a cost-sensitive deep learning architecture; the shortcomings of this method were reflected in the relatively single selection criteria in the process of software behavior pattern screening. Han et al. [
17] proposed a program behavior semantic detection method based on sequence analysis of program behavior operations. Although this method could more accurately understand the operational intent of malicious software, semantic detection often required a large amount of feature data and computational resources. Zhao et al. [
18] proposed a dynamic analysis method based on an API dependency graph, but this method adopted the method of calling API functions from the application layer, making many lower-level system call function methods unable to be monitored, which to some extent affected the accuracy of its detection. Hemalatha et al. [
19] used a visualization-based method to describe malicious software binaries as two-dimensional images and classified the software using a deep learning model. The authors of [
20] proposed a method for extracting malicious features based on adaptive software which compared and analyzed three types of software features according to three aspects—effectiveness, system load and security—by combining different search strategies and adjusted the weight of each feature to meet the detection requirements of different malware. However, this method did not effectively integrate the semantic features of malicious software, so there were certain shortcomings in feature construction.
Furthermore, based on the above advantages, more and more studies in recent years have tended to use cloud platforms to solve problems [
21,
22,
23]. This paper proposes a malware detection system based on a recurrent neural network on a cloud platform, which uses a recurrent neural network algorithm to build a model for malware detection. While improving the detection accuracy, this platform also strengthens the generalization ability of the model. Since the construction of detection models and tasks requires high computing capabilities, in order to ensure the detection efficiency of the detection system, the entire system is built on a cloud platform to give full play to the advantages of cloud computing, which can effectively reduce the burden on the client and improve the overall the detection efficiency.
3. Android Malware Detection Model
In this section, the API call sequence extraction method is proposed first, which mainly includes obtaining a function call graph, internal complete sequence acquisition and API call sequence, etc. Next, the paper presents an API call sequence processing method, which consists of redundant subsequence removal and continuous same mode API removal. Furthermore, this section puts forward an API vectorization method. Lastly, the paper describes the malware detection model based on RNN.
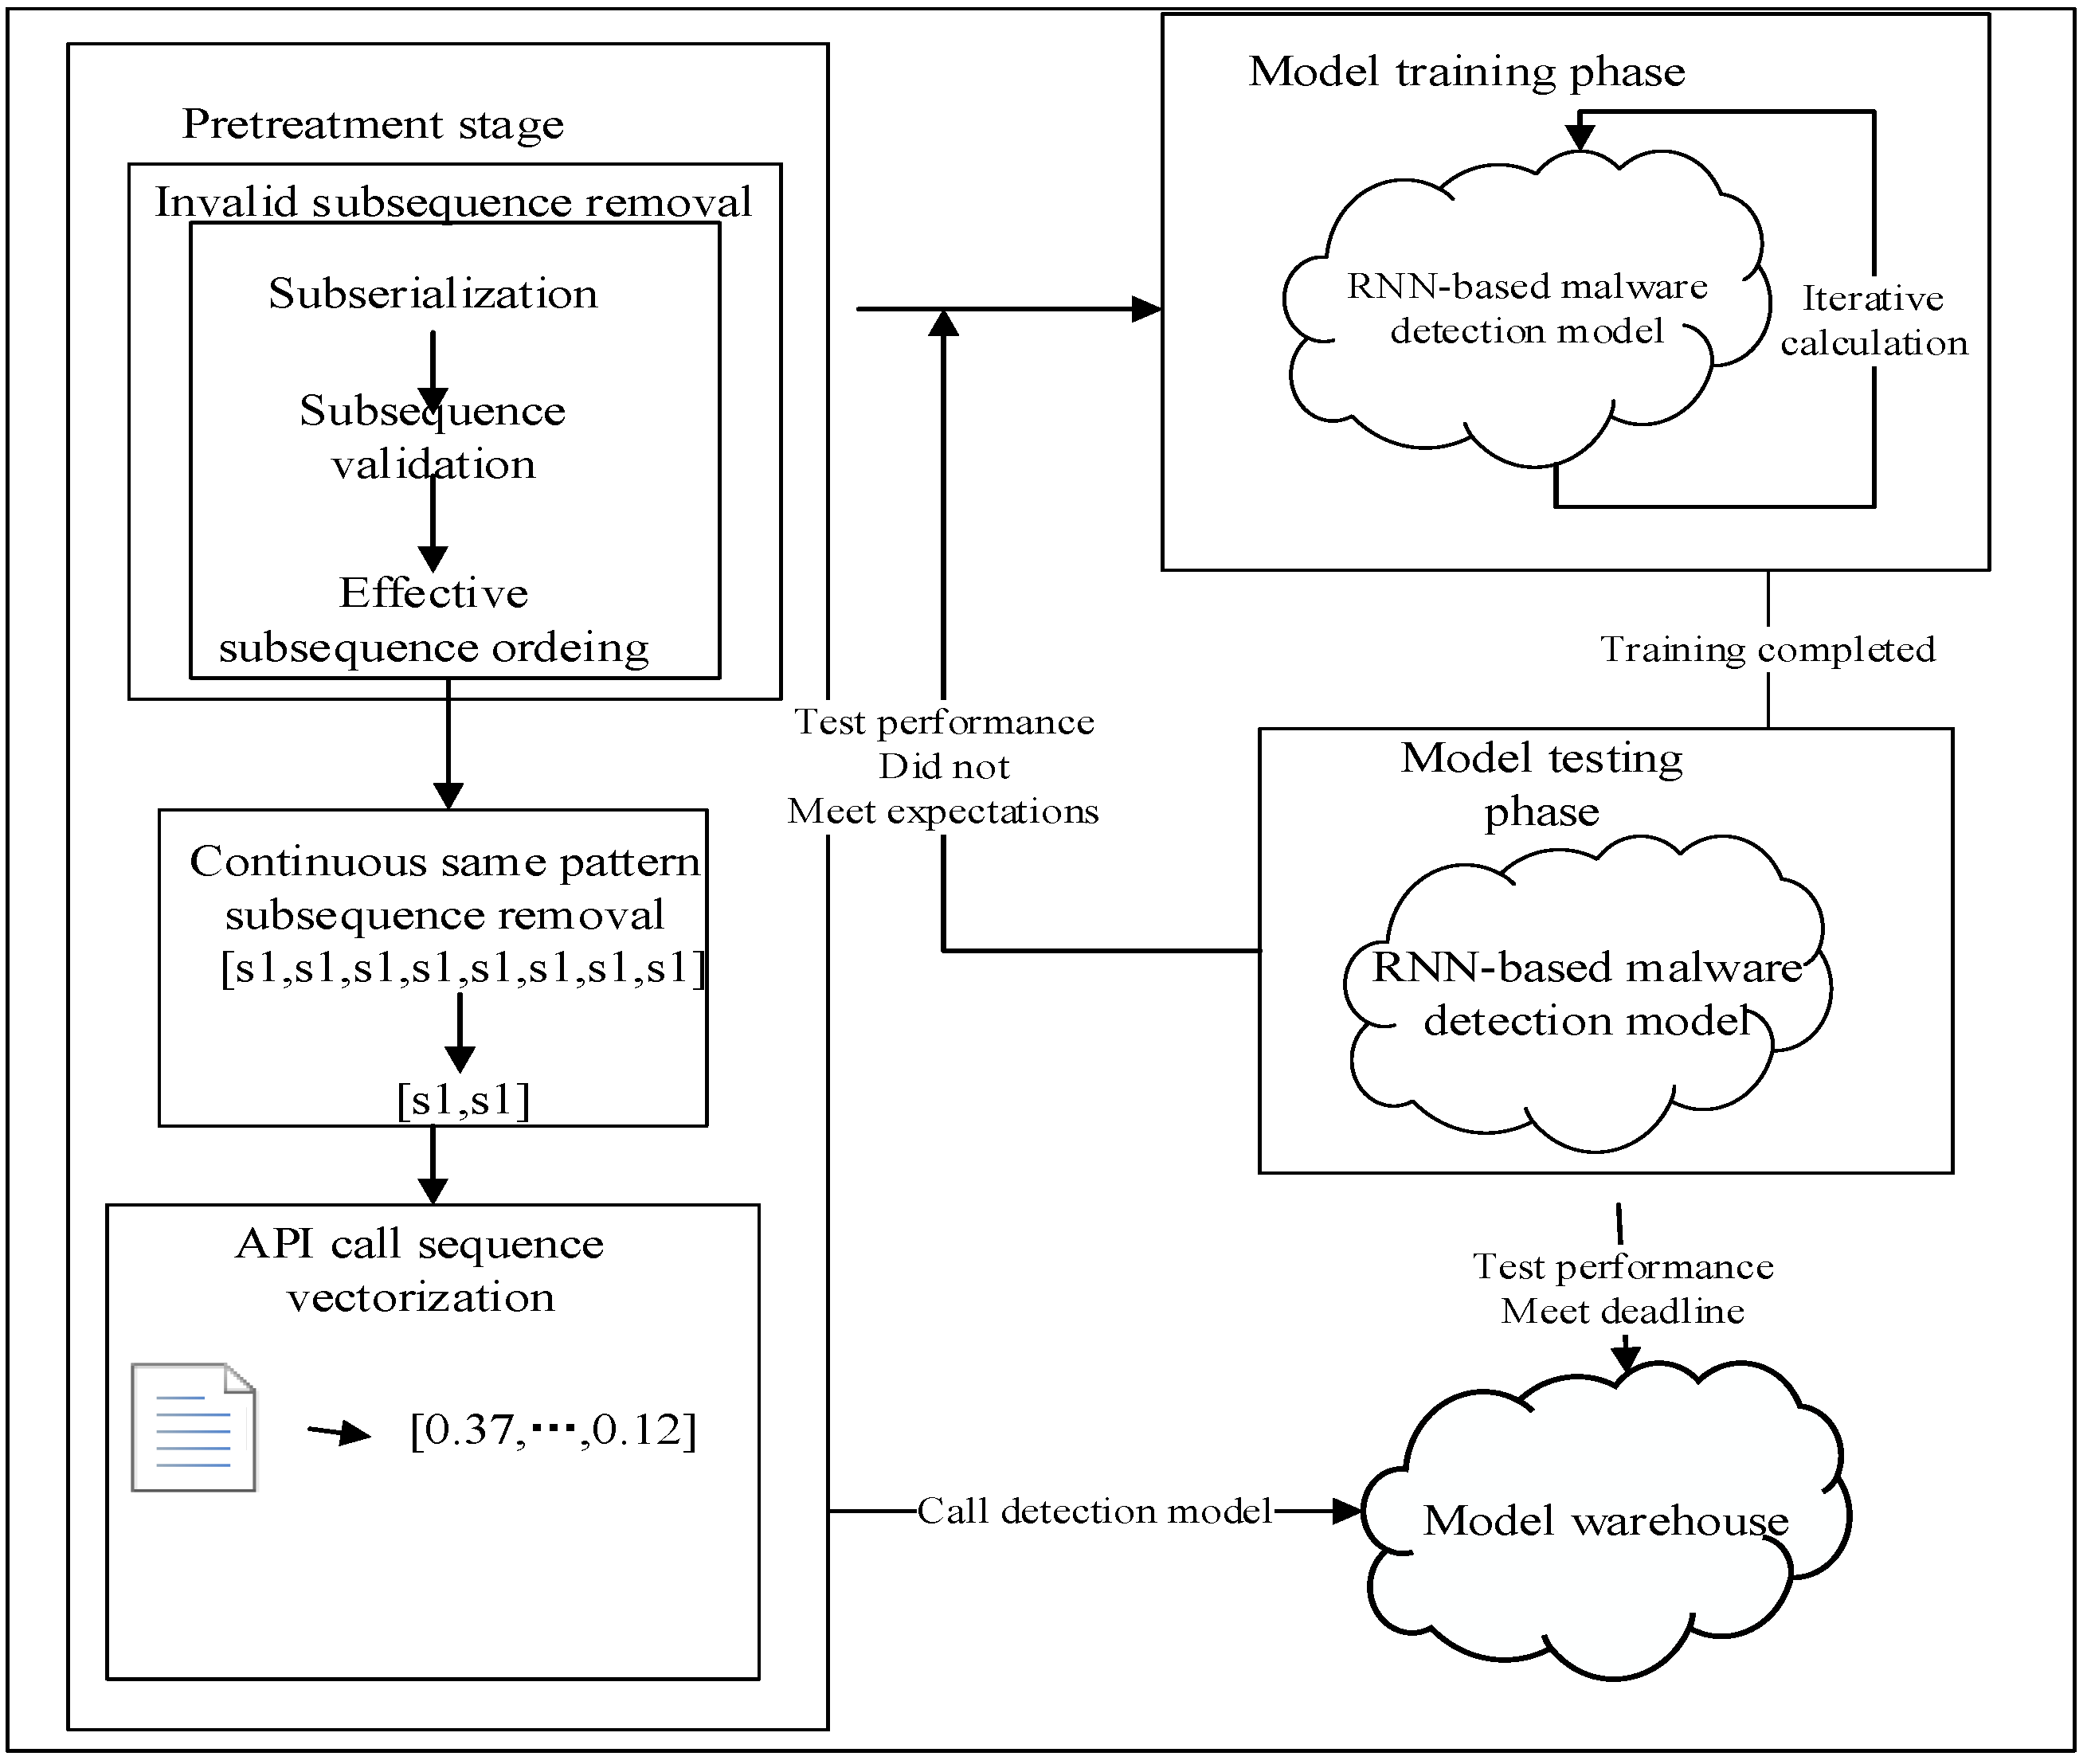
The cyclic neural network malware detection model based on the API call sequence is mainly based on the API call sequence extracted from the decompiled APK file. The feature vector is obtained after the feature preprocessing operation to train the cyclic neural network malware detection model, which is used to detect malware. The detection model architecture is shown in
Figure 1.
3.1. API Call Sequence Extraction Method
In this section, the API call sequence extraction method is proposed first. Through analysis of the .dex files, the function call graph is extracted using AndroGuard. Then, the depth-first traversal algorithm is used to obtain the internal complete sequence acquisition from the function call graph and to obtain the API call sequence based on address information.
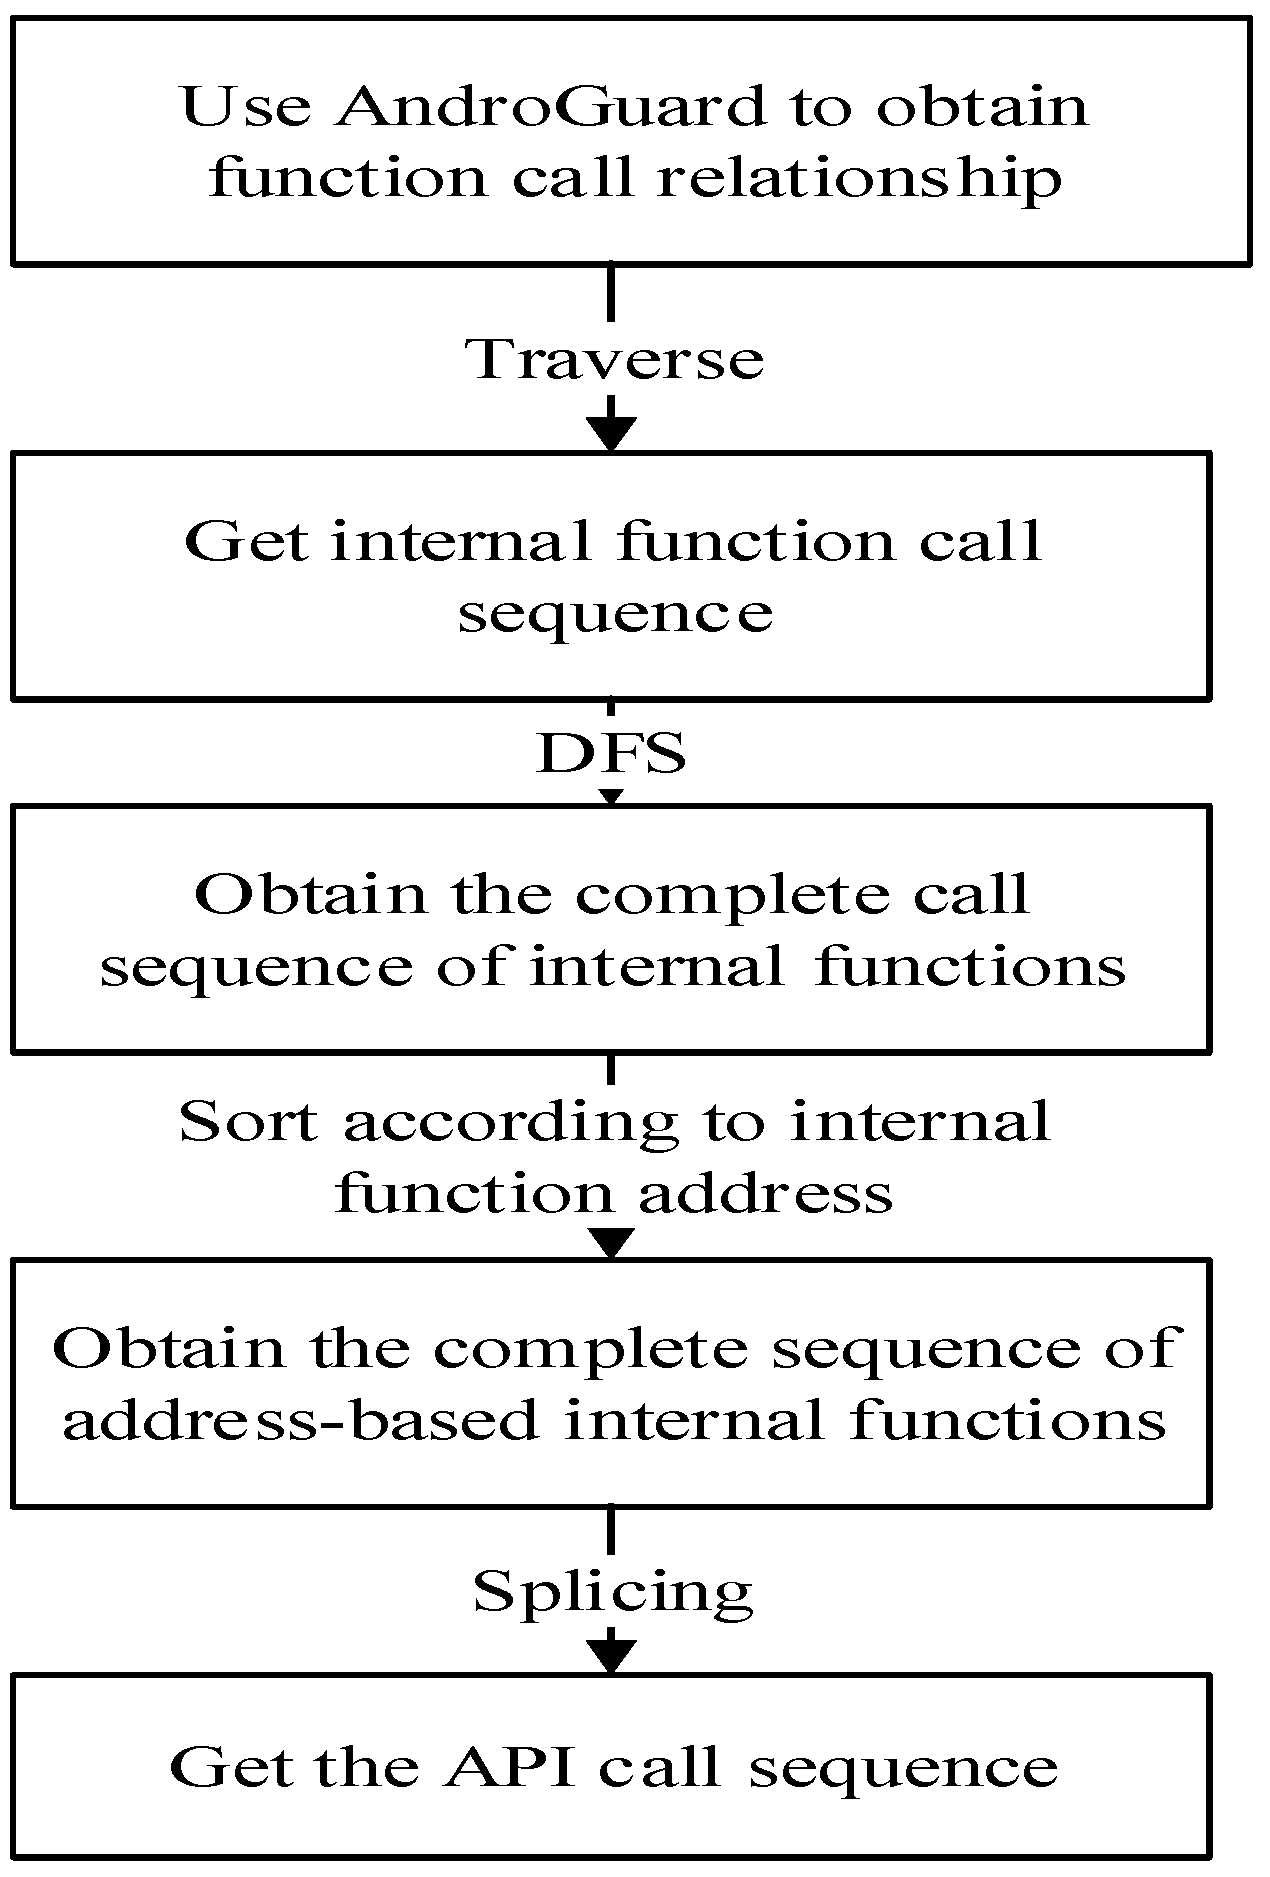
The paper fist analyzes the dex object for the APK file and obtains the API call graph in the dex files. Then, it processes the edge information in the function call graph above and obtains the API call relationship within each category. Next, it uses the depth-first traversal algorithm to perfect each API call sequence in order to obtain and sort the multiple complete in-class call sequences in light of the address information of the sequence head node in the memory. At last, all the in-class call sequences are spliced together in order of increasing address to construct a complete API call sequence. The above operation flow is shown in
Figure 2.
The specific algorithm is shown in Algorithm 1.
| Algorithm 1: Android software API call sequence extraction algorithm |
Input:
APK file sample set
Output:
Android software API call sequence data set
Begin
Step 1: Input the APK files in the APK file sample set into the processing module.
Step 2: Obtain the package name of the main class in the current APK file.
Step 3: Use AndroGuard to construct a function call relationship graph under the corresponding package name.
Step 4: Remove isolated nodes that do not have a function call relationship during the construction process.
Step 5: Input the generated function call relationship graph into the extraction module.
Step 6: Record the node information in the function call relationship graph in nodes[].
Step 7: Traverse the edge information to obtain the calling sequence of all source nodes and record in allSeqs[].
Step 8: Use the depth-first traversal algorithm to traverse allSeqs[] to obtain the complete call sequence of all source nodes and record them in hasInternal[].
Step 9: Sort the sequence in hasInternal[] according to the increasing order of the source node address information.
Step 10: Remove the internal nodes in hasInternal[] to obtain noInternal[].
Step 11: Splice the call sequence in noInternal[] in order from top to bottom to obtain the API call sequence.
Step 12: Output the API call sequence to the specified file.
End |
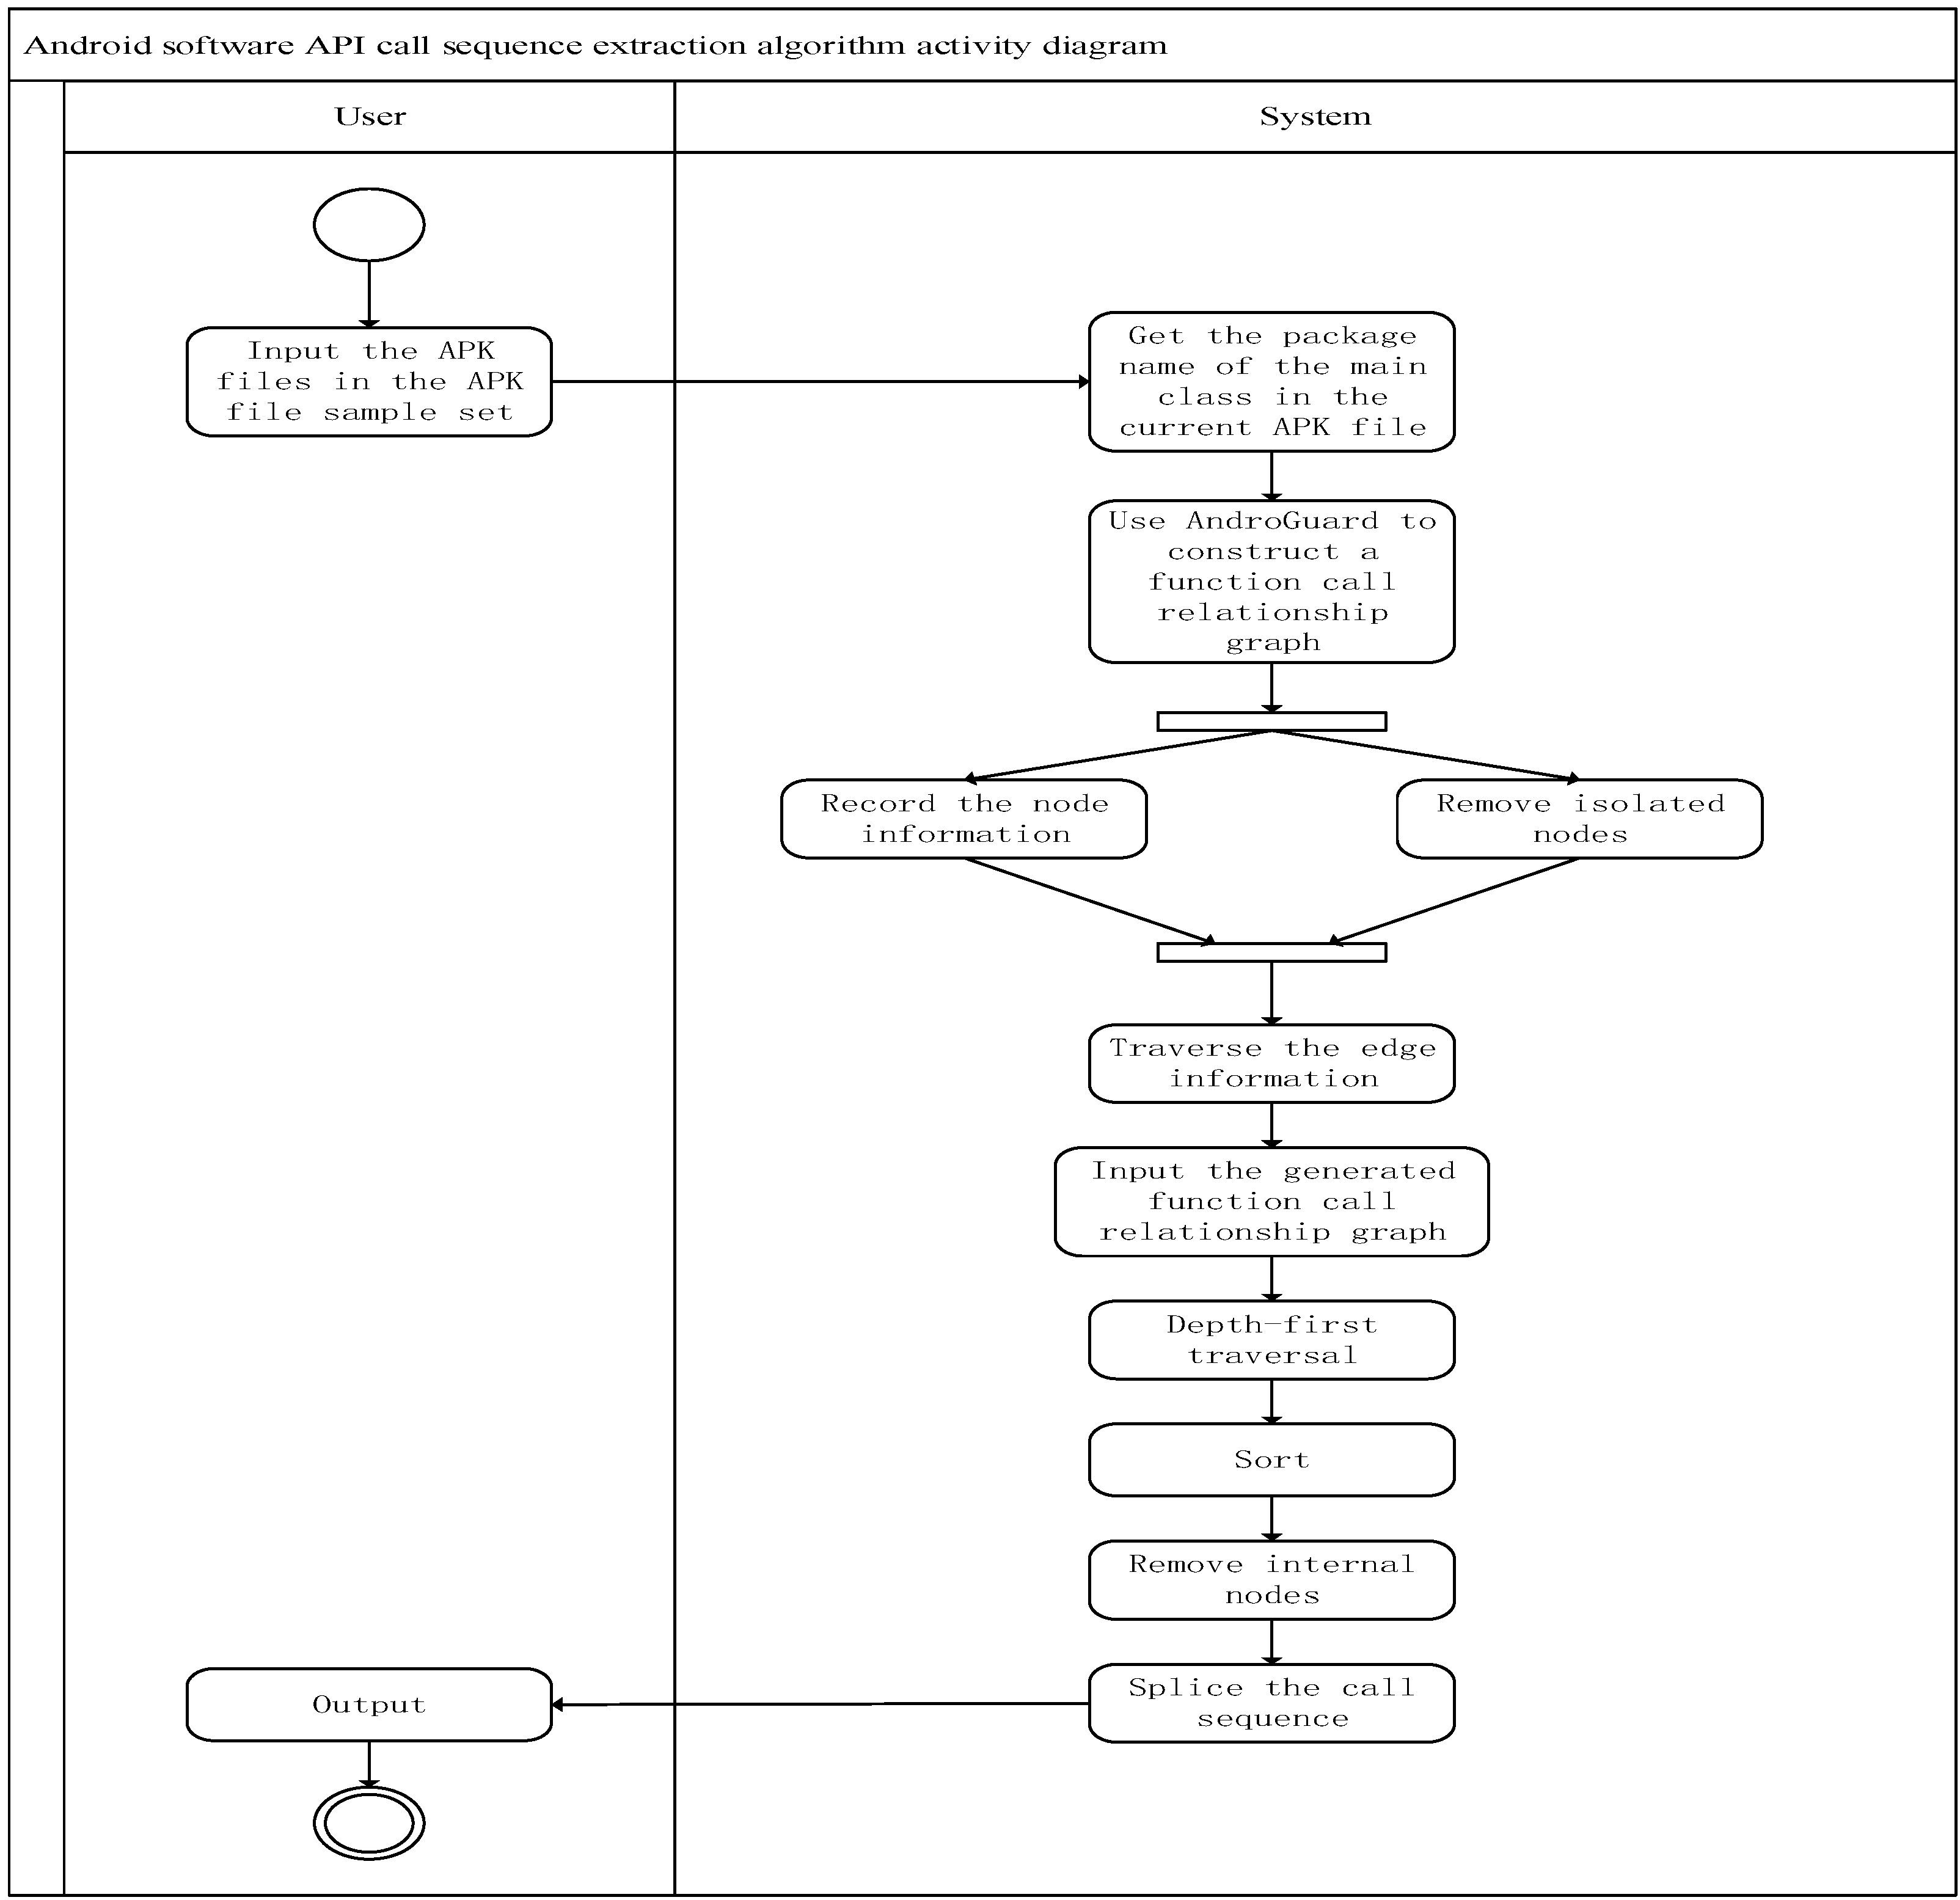
In Algorithm 1, the extraction of the API call sequence of the APK file can be divided into two stages in general. The first one is to extract the function call relationship diagram, including steps one to three. This stage is mainly completed by AndroGuard. In the first stage, it is necessary to obtain the package name of the main class under the APK file. The purpose is to extract the function call relationship diagram in a targeted manner to reduce the redundant information that has little effect on the detection of malware. There are isolated nodes with function call relationships. These nodes are still redundant information and need to be removed. The second stage is the function call relationship graph analysis stage, which includes steps 4 to 9. The main purpose of this stage is to obtain API calls for APK files sequence, so there are two problems to be solved: one is whether the obtained call sequence is complete, and the other is whether the final call sequence is an API call sequence based on time series. Steps 6 and 9 use a depth-first traversal algorithm and a sequence integration method based on address information to solve these two problems and to ensure that the output in step 10 is the key time series-based API call sequence in the APK file. The activity diagram of the Android software API call sequence extraction method is shown in
Figure 3.
3.1.1. Use AndroGuard to Obtain Function Call Graph
This paper mainly uses AndroGuard to obtain the function call graph of the APK file. In order to make the obtained function call graph as concise as possible under the premise of ensuring the integrity of the data, this paper only extracts the function call graph under the package of the main class. There are mainly the following two steps:
- (1)
Determine the package name where the main class of the APK file is located;
- (2)
Construct a function call graph under a specific package name.
The function call graph obtained is a .gml file. In order to make the function call graph look more intuitive, this method uses Gephi to visualize the .gml file. In the function call graph, the function nodes are represented by black dots, and each function node has its own label, which indicates the specific function represented by the function node. The label also contains information such as the node number, function path, function name and whether it is an external node (the function implementation is not in the current class), and the label of the internal node (the function is implemented in the current class) also contains the corresponding address information, located after the @ symbol. The calling relationship between function nodes is represented by a directed arrow, and the node pointed to by the arrow is the called node.
3.1.2. Internal Complete Sequence Acquisition Based on Depth-First Traversal
After obtaining the API call graph, this paper analyzes the .gml file and obtains the following two points: the first one is the number of nodes in the .gml file, and the last one is the edge of API call graph.
In order to obtain the first one above, this method traverses all the leaf nodes in the file, saves all the target nodes with call relationships under the same source node and integrates the API call sequence of the source node in the order of the increasing number of nodes. In response to the issue mentioned in (2) above, this method obtains the call sequences of all source nodes and uses a depth-first traversal algorithm to obtain each call sequence.
3.1.3. Obtain API Call Sequence Based on Address Information
After obtaining multiple complete call sequences and sorting according to the address information of the source node of each call sequence, the method removes all internal nodes to obtain multiple call sequences with only external nodes.
After the obtained sequence is analyzed, it is found that there are repeated calling sequences. These repeated calling sequences represent the same software behavior, and only one copy is kept. It is necessary to perform repeated call sequence removal processing so that only one copy of the same call sequence is retained in the API call sequence. For the sake of sequence integrity, this detection technique keeps the calling sequence that appears multiple times in the longest sequence and deletes the others. Finally, these sequences are spliced together in order from top to bottom and end to end to get a complete API call sequence.
3.2. API Call Sequence Processing Method
In this section, the paper presents an API call sequence processing method. After analyzing the API call sequence of part of the malware, it is evident that there are a large number of subsequences in the obtained sequence that have little effect on sample classification, so removing redundant subsequences and using a continuous same mode API method to improve model training efficiency and increase detection accuracy is put forward.
3.2.1. Redundant Subsequence Removal
The API call sequence extraction technology extracts the time series-based API call sequence from the APK file. However, due to the different number of API calls between different samples, the API sequence length of each sample obtained by the above method is different. And by analyzing the API call sequence of part of the malware, it is found that there are a large number of subsequences in the obtained sequence that have little effect on sample classification, so it is necessary to remove these redundant subsequences to improve model training efficiency and increase detection accuracy.
- (1)
Sample subserialization
This detection technology is based on the N-gram algorithm to subserialize the API call sequence. The basic idea of the adopted N-gram algorithm is that in the obtained API call sequence, a sliding window of size N is used to divide the entire long sequence into multiple short sequences of length N.
Figure 4 is an integer sequence corresponding to an API call sequence, and the process of subsequence division based on the N-gram method of this detection technology. The size of the sliding window is 4, and the sliding step of the sliding window is 1.
- (2)
Subsequence validation
The number of subsequences obtained after N-gram sample subsequence extraction is very large. It is necessary to screen out those subsequences that have a large effect on classification in the detection process. In this paper, a feature selection method based on information gain is used to select subsequences. The main idea of information gain is that for a subsequence, the amount of information contained in the system is different with and without it. The difference between the amount of information before and after this is the amount of information that the subsequence brings to the system. The following is an example to illustrate the operation of this method, as shown in
Table 1.
Information entropy:
Conditional entropy of subsequence 1:
Conditional Entropy of Subsequence 2:
Information gain of subsequence 1:
Information gain of subsequence 2:
Through the information gain algorithm, the amount of information contained in each subsequence is calculated, and then the subsequence with higher information content is selected as the effective feature subsequence. Such subsequences can better reflect the difference between normal samples and malicious samples because they have better distinction.
- (3)
Effective subsequence ordering
The subsequences filtered by the information gain are all valid subsequences, that is, they exhibit good distinction between whether the software is malicious or not. Now it is necessary to integrate all the effective subsequences to obtain an effective long sequence based on time. This article uses the list of sample subsequences obtained through N-gram as a dictionary set. The set of effective subsequences selected by the information gain is called a data set. Extract the N-gram subsequences existing in the data set from the dictionary set and connect them according to the order of the dictionary set to obtain an effective long sequence based on time, as shown in
Table 2.
3.2.2. Continuous Same Mode API Removal
As shown in
Table 2, after the effective subsequence is serialized, adjacent feature items may appear in the effective long sequence, which has no effect on distinguishing normal software from malicious software and is also redundant information. In order to reduce the length of the feature sequence input to the model but not decrease the amount of information retained by the call, the continuous same API function removal method in reference [
13] in this article is used.
Table 3 shows the method of continuous same mode API removal adopted in preprocessing.
3.3. API Vectorization
In this section, the paper puts forward a Mikolov’s skip-gram network model to obtain the API vectorization so that it can be input into the neural network to be processed. For the API called by the software, the above operations have been preprocessed. In order to input the neural network, it needs to be converted into a vector. This paper refers to Mikolov’s skip-gram network model [
19] to train the API word vectors. Mikolov’s skip-gram network mode architecture is shown in
Figure 5.
In order to find the word representations, the paper uses the skip-gram mode to predict the surrounding words in a sentence or document, which includes the following four steps:
Step 1: For each API function, this model adopts a specific integer representation, and the integers correspond to different API functions, which are all different.
Step 2: For the entire API data set, the model performs a one-hot encoding method as in
Table 4, which illustrates the one-hot encoding rules.
Step 3: Use all one-hot encoded API vectors as the input data to train the skip-gram model.
Step 4: The range parameter can be set according to the specific scenarios which are in the output layer of the skip-gram model. In this model, the larger n is, the more the training examples are generated, and the higher the accuracy will be. However, the training time will also increase. After the training is performed, this model outputs the embedding weight matrix and uses the results of the one-hot vector of the API sequence and the weight matrix to represent the embedding vector of the sequence (
Figure 6).
Assume that the weight matrix of embedding is the dense matrix W [vocabSize, embeddingSize], where the parameter vocabSize is the number of all items. The other parameter, embeddingSize, is the vector length, which can be classified according to where the effect is set, which is set to 5 before the start of training. In the function Embedding_Lookup (W, var), the parameter var is a one-hot vector of a certain API, the size of which is from 1 to vocabSize. The one-hot vector in this method is multiplied by the matrix W [vocabSize, embeddingSize], and the result is a vector [1, embeddingSize]. In this paper, the value of the embedding weight matrix W could be initialized randomly before the start of training, which is updated with continuous automatic derivation, so that the embedding vector corresponding to each API will gradually stabilize with training process (Algorithm 2).
| Algorithm 2: API call sequence vectorization algorithm based on skip-gram model |
Input:
API call sequence in the sample set
Output:
API call sequence vector matrix
BeginStep 1: Perform one-hot encoding for each API function in the API call sequence to obtain a sparse matrix based on one-hot encoding. Step 2: Set the window size c of the output layer in the skip-gram model. Step 3: Determine the number of API functions near the center API function. Step 4: Input the one-hot encoded sparse matrix into the skip-gram network model and train each API function in the API call sequence as the central word in turn. Step 5: Obtain the conditional probability of generating the background word given the central word. It is calculated as follows:
(where the total number of APIs in the API call sequence is V, and the index of the API function in the API call sequence is i. When it is the central word, the vector is expressed as vi, and when it is the background word, the vector is expressed as ui. Suppose the central word 𝜔c is in the API, the index in the calling sequence is c, and the background word 𝜔o is indexed in the API calling sequence).
Step 8: After the central word gradient is obtained, it can be updated iteratively according to this gradient. Step 9: After the central word update is completed, the same method is used to update the background word; Step 10: After the training is completed, for any API function with index i in the API call sequence, two sets of word vectors vi and ui of the API as the central word and the background word can be obtained.
(Generally speaking, the central word vector will be used as the representation vector
of the word).
End |
3.4. Malware Detection Model Based on Recurrent Neural Network
In this section, the paper constructs a malware detection model based on a two-way recurrent neural network and uses the two-way long short-term memory network model (LSTM). Finally, the feature vector of the APK file to be detected is passed into the model and the detection results are obtained.
3.4.1. Two-Way LSTM Network Model
The application of the recurrent neural network in malware detection mainly uses time series-based API call sequence information extracted from APK files as the sample features to train the recurrent neural network algorithm model and then uses this model to detect whether unknown software is malware. This detection model is mainly trying to find the difference between malware and normal software in some API call sequences, mining the hidden information in the API sequence information and trying to understand the true intention of the program through the API sequence.
The recurrent neural network selected in this article is LSTM. While the LSTM recurrent neural network exhibits selective memory, the unidirectional LSTM model faces the challenge of uneven output information distribution [
24,
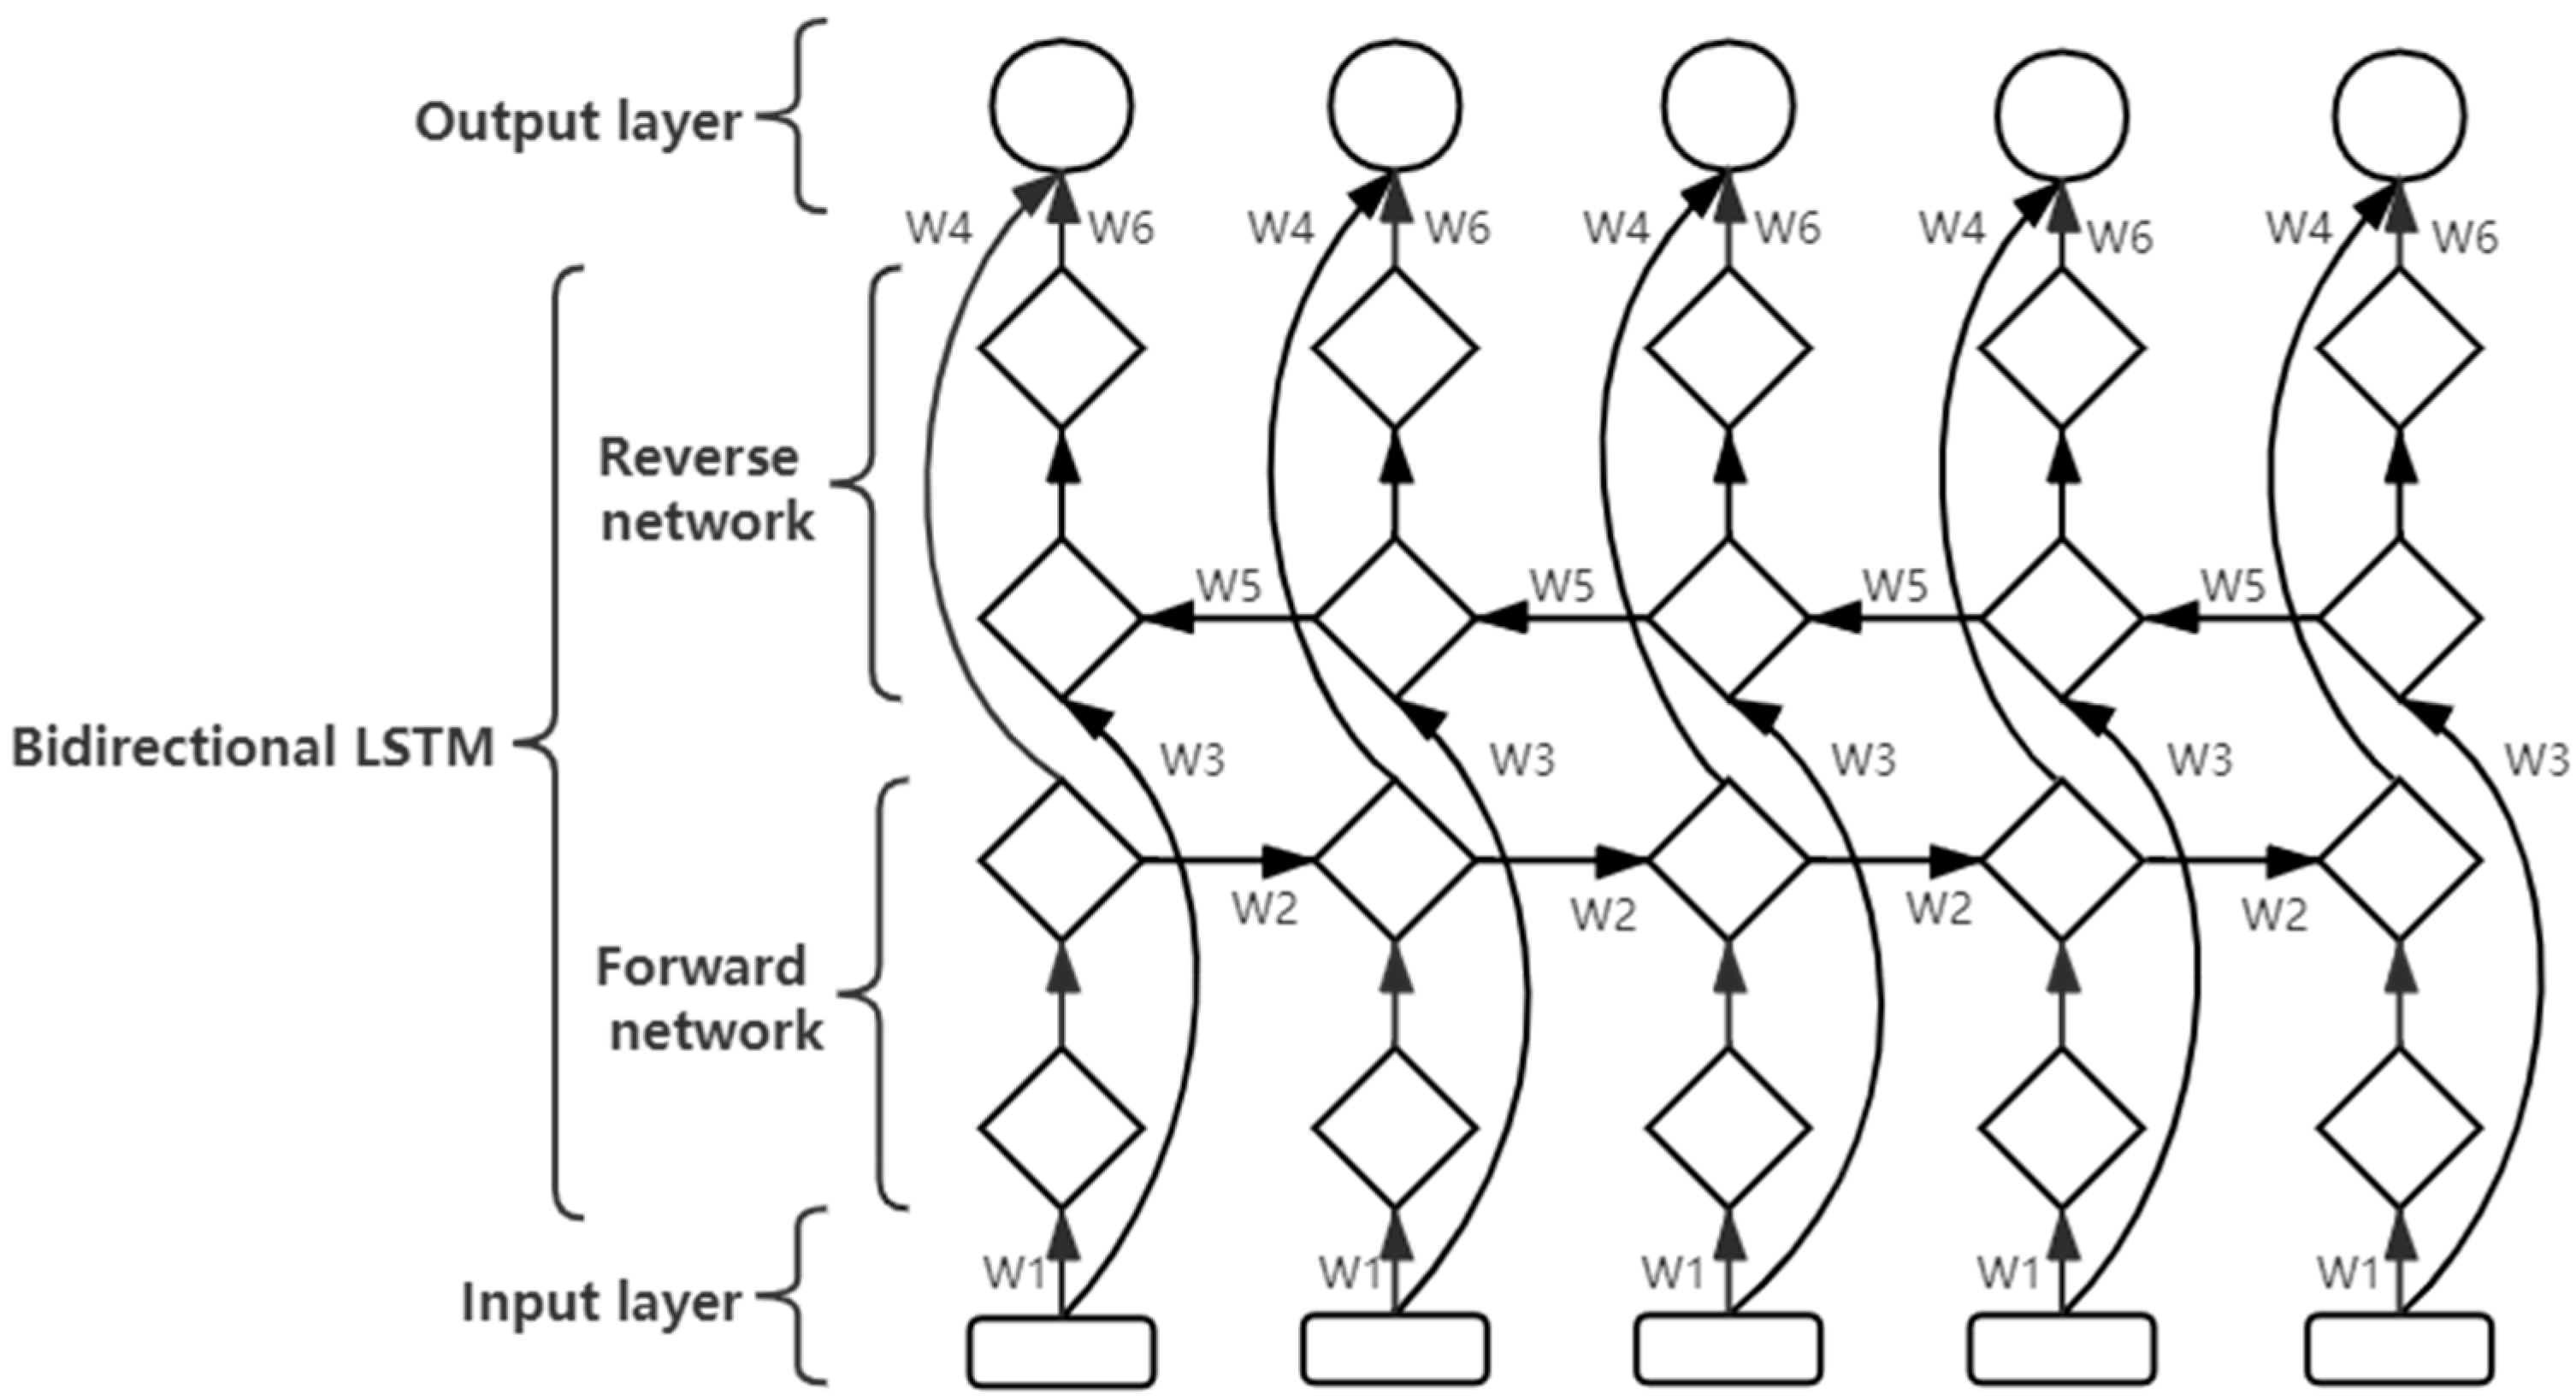
25]. Specifically, positional information that is distant from the output unit is prone to being easily ignored. Therefore, the idea of the bidirectional cyclic neural network is used to construct a bidirectional LSTM network model. The basic idea of the two-way recurrent neural network is to use two recurrent neural networks: one network uses the forward sequence for training, the other one uses the reverse sequence for training, and finally the outputs of the two recurrent neural networks are combined. The advantage of this structure is that the complete context information is provided for each datum in the input sequence, which makes the judgment of the current input more accurate. The six unique weights in the entire network are repeatedly used at each step, and the six weights correspond to the follows: input to the forward and backward hidden layers (w1, w3), the hidden layer to the hidden layer itself (w2, w5), and the forward and backward hidden layer to the output layer (w4, w6). The recurrent neural networks in both directions have their own states, and there is no direct connection between them. The network architecture is shown in
Figure 7.
In the two-way LSTM network model constructed in this paper, two LSTM networks, one forward and one reverse, are trained at the same time so that the API sequence covers its own context information, and the final state output by the two networks is combined. As the training result of the sample, the training result can be judged through a sigmoid function.
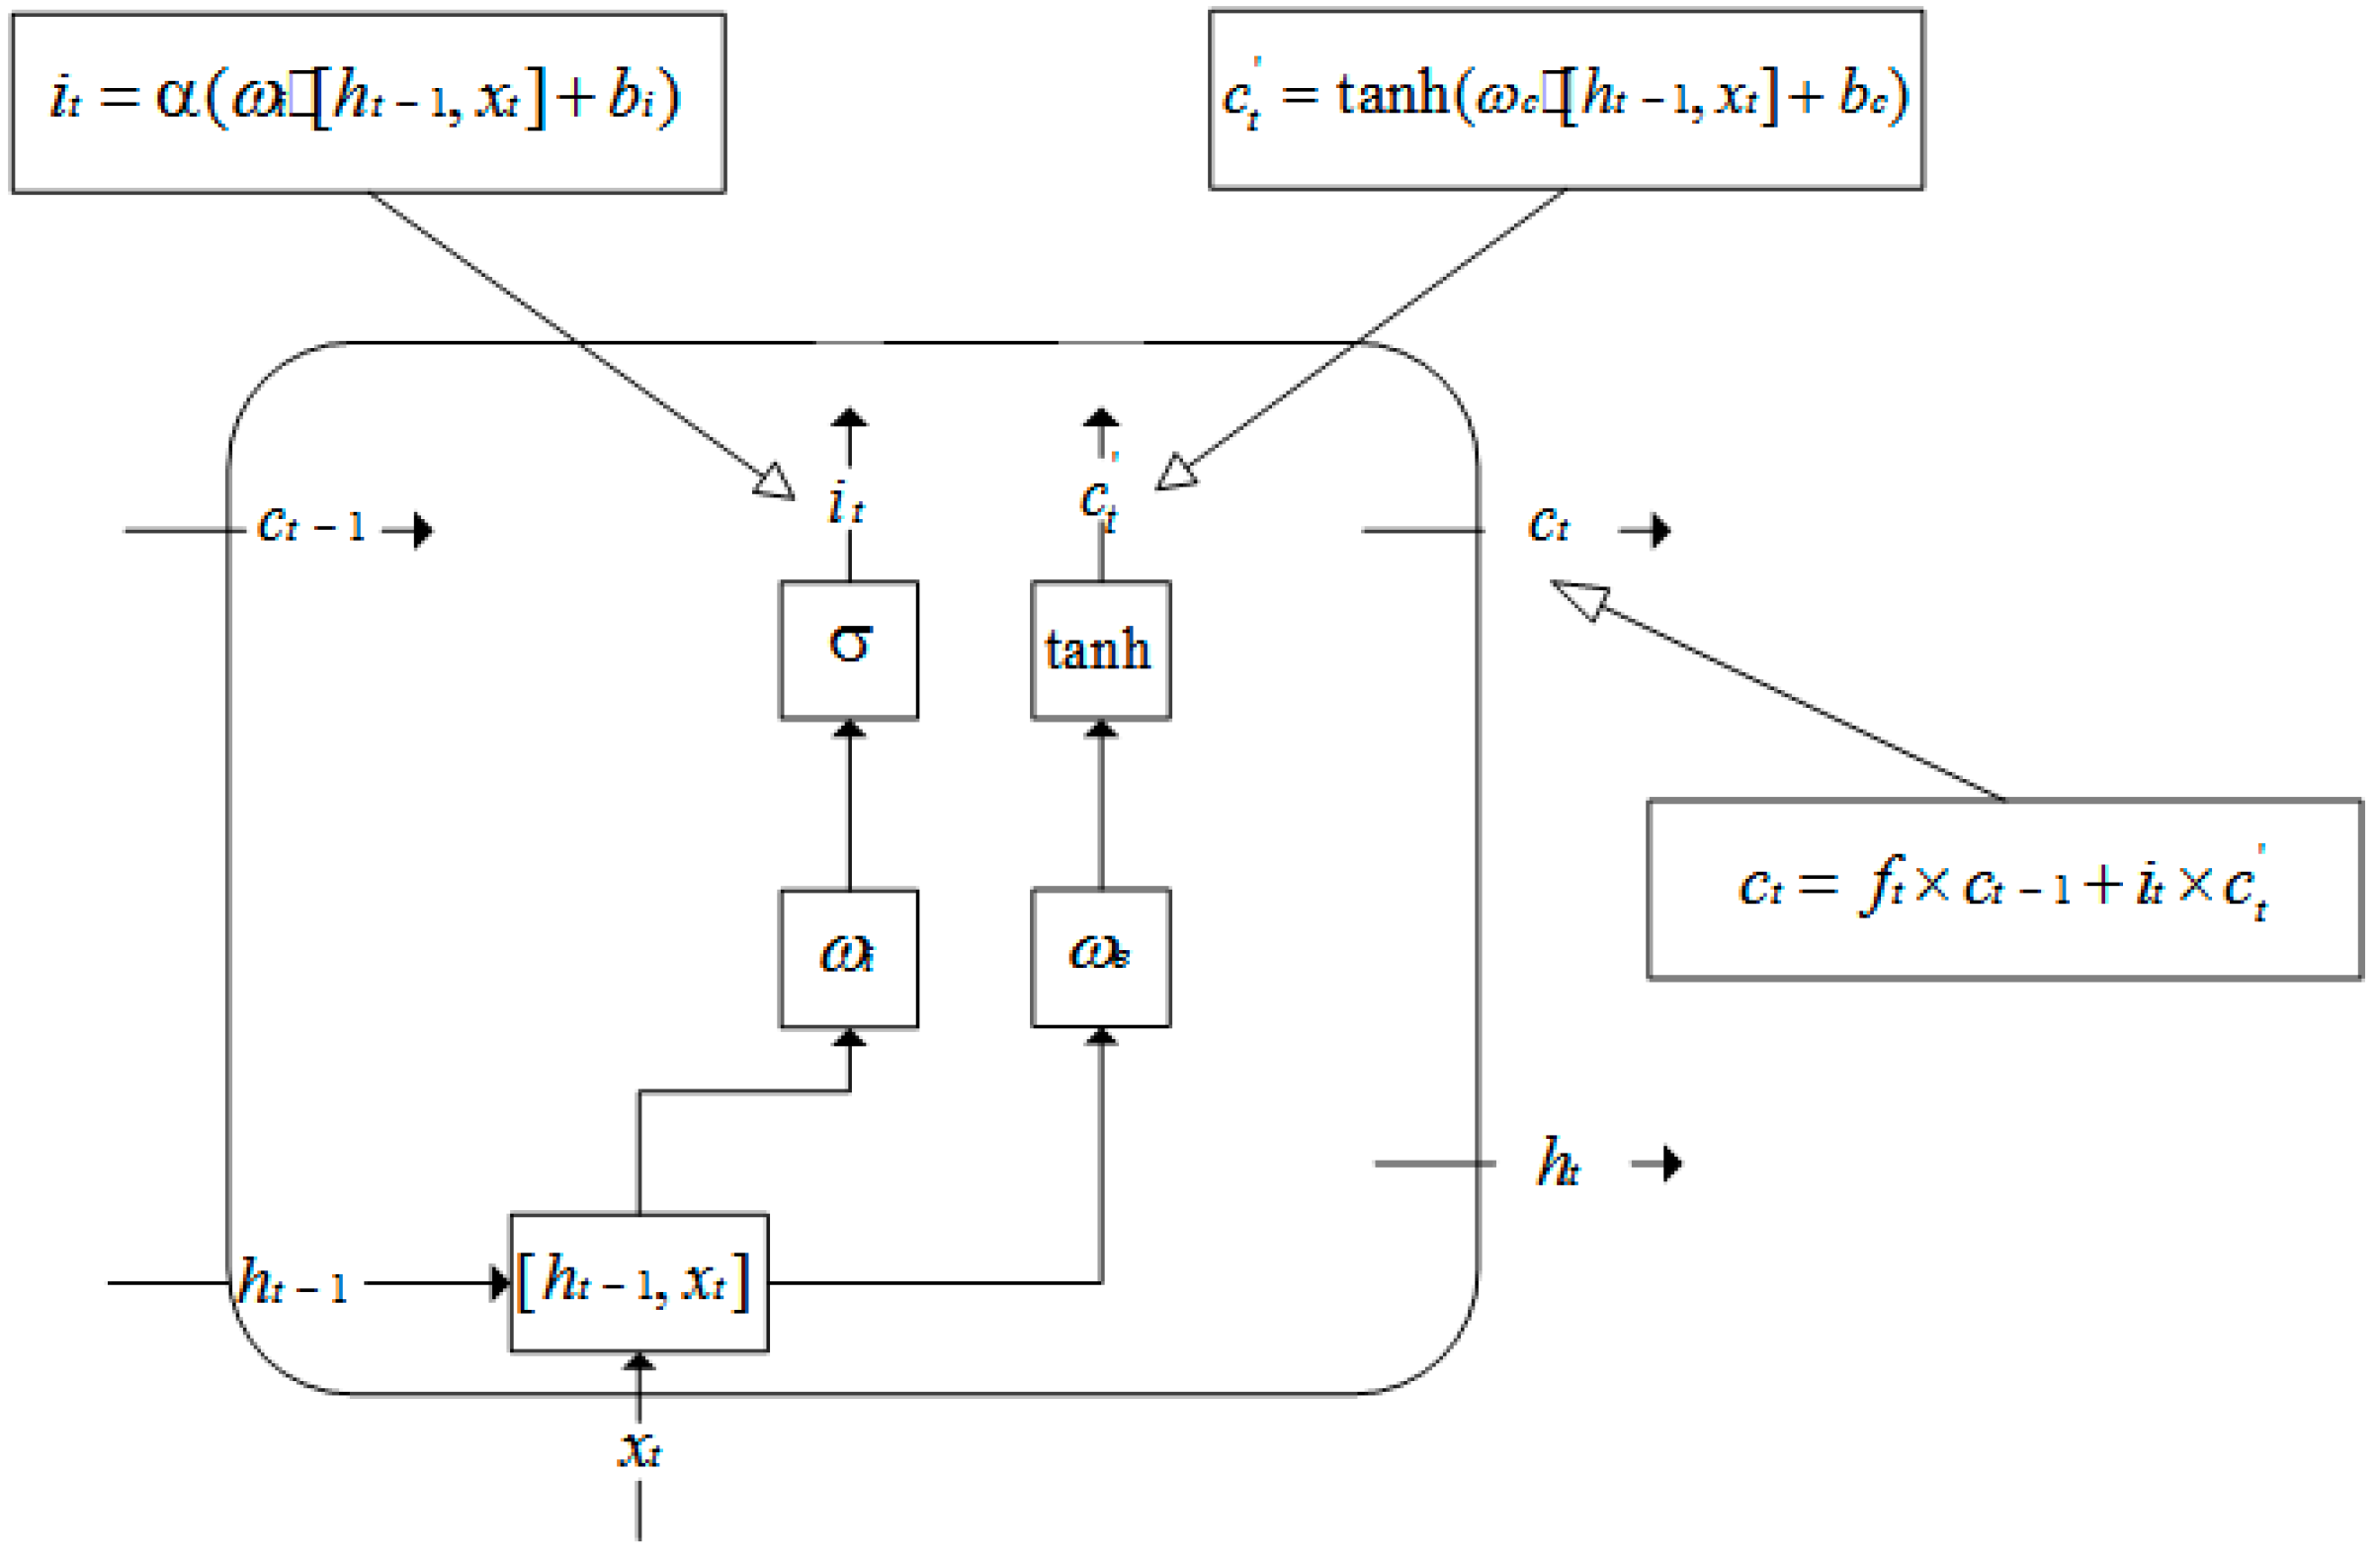
In the LSTM structure, there are multiple state values at the same time.
Figure 8 shows the use of a single LSTM unit in a malware detection scenario.
An API call sequence contains multiple API functions called at different moments. When the API call sequence is input into the LSTM cyclic neural network, different API functions are regarded as the input information at different moments.
In
Figure 8,
is the input at the current time, which is the API function called at time t in the API call sequence,
is the state of the hidden layer at the previous time,
is the state of the hidden layer at the current time,
is the state of the unit at the previous time,
is the state of the unit at the current time, and
is the output of the node at the current time.
The LSTM involves the calculation of forget gates, input gates and output gates when performing forward calculations [
26,
27]. The forget gate mainly determines how much information in the API call sequence can be retained until the current moment as of the last moment. The processing flow is shown in
Figure 9. In this figure, [
,
] means that the two vectors are spliced in at the same time; the reserved information in the API call sequence up to the current moment and the API function at the current moment are connected into a vector, where
is the weight matrix of the forgetting gate,
is the output of the forgetting gate at the current moment,
is the sigmoid function, and
is the forgetting gate.
The input gate is mainly to avoid some common API functions and API functions that benign applications will also call from entering the network by examining how much information in the API function called at the current moment can be recorded. The processing flow is shown in
Figure 10, where
is the weight matrix of the input gate,
is the output of the input gate at the current moment,
is the bias value in the input gate,
is the weight matrix of the unit, and
is the temporary state of the unit at the current moment. The unit state at the current moment is mainly obtained by the product of the unit state at the previous moment and the output of the forgetting gate, and it adds the output of the input gate at the current moment and the temporary state of the cell. In this way, the unit state can be saved in the previous API call sequence. Due to the control of the input gate, it is possible to prevent the API functions that have little effect on the detection of malware from entering the network.
The output gate mainly controls the historical API call sequence information, which filters the content that can be used for the final output and controls the impact of long-term memory on the current output. The processing flow is shown in
Figure 11, where
is the weight matrix of the output gate,
is the offset value in the output gate, and
is the output of the output gate at the current moment.
When LSTM conducts reverse propagation, the back propagation of the error term mainly involves two directions as follows:
- (1)
Back propagation along time, that is, starting from the current time t, the method calculates the error term at each time. The learning objectives involved here are mainly eight sets of parameters, which are the weight matrix and bias values and of the forgetting gate. The method needs to input the weight matrix and bias values and of the gate, output the weight matrix and bias values and of the gate and calculate the weight matrix and bias values and of the unit state.
- (2)
To propagate the error to the next level, the calculation formula here is as follows:
In Formulas (1)–(5), the symbol represents cycle multiplication.
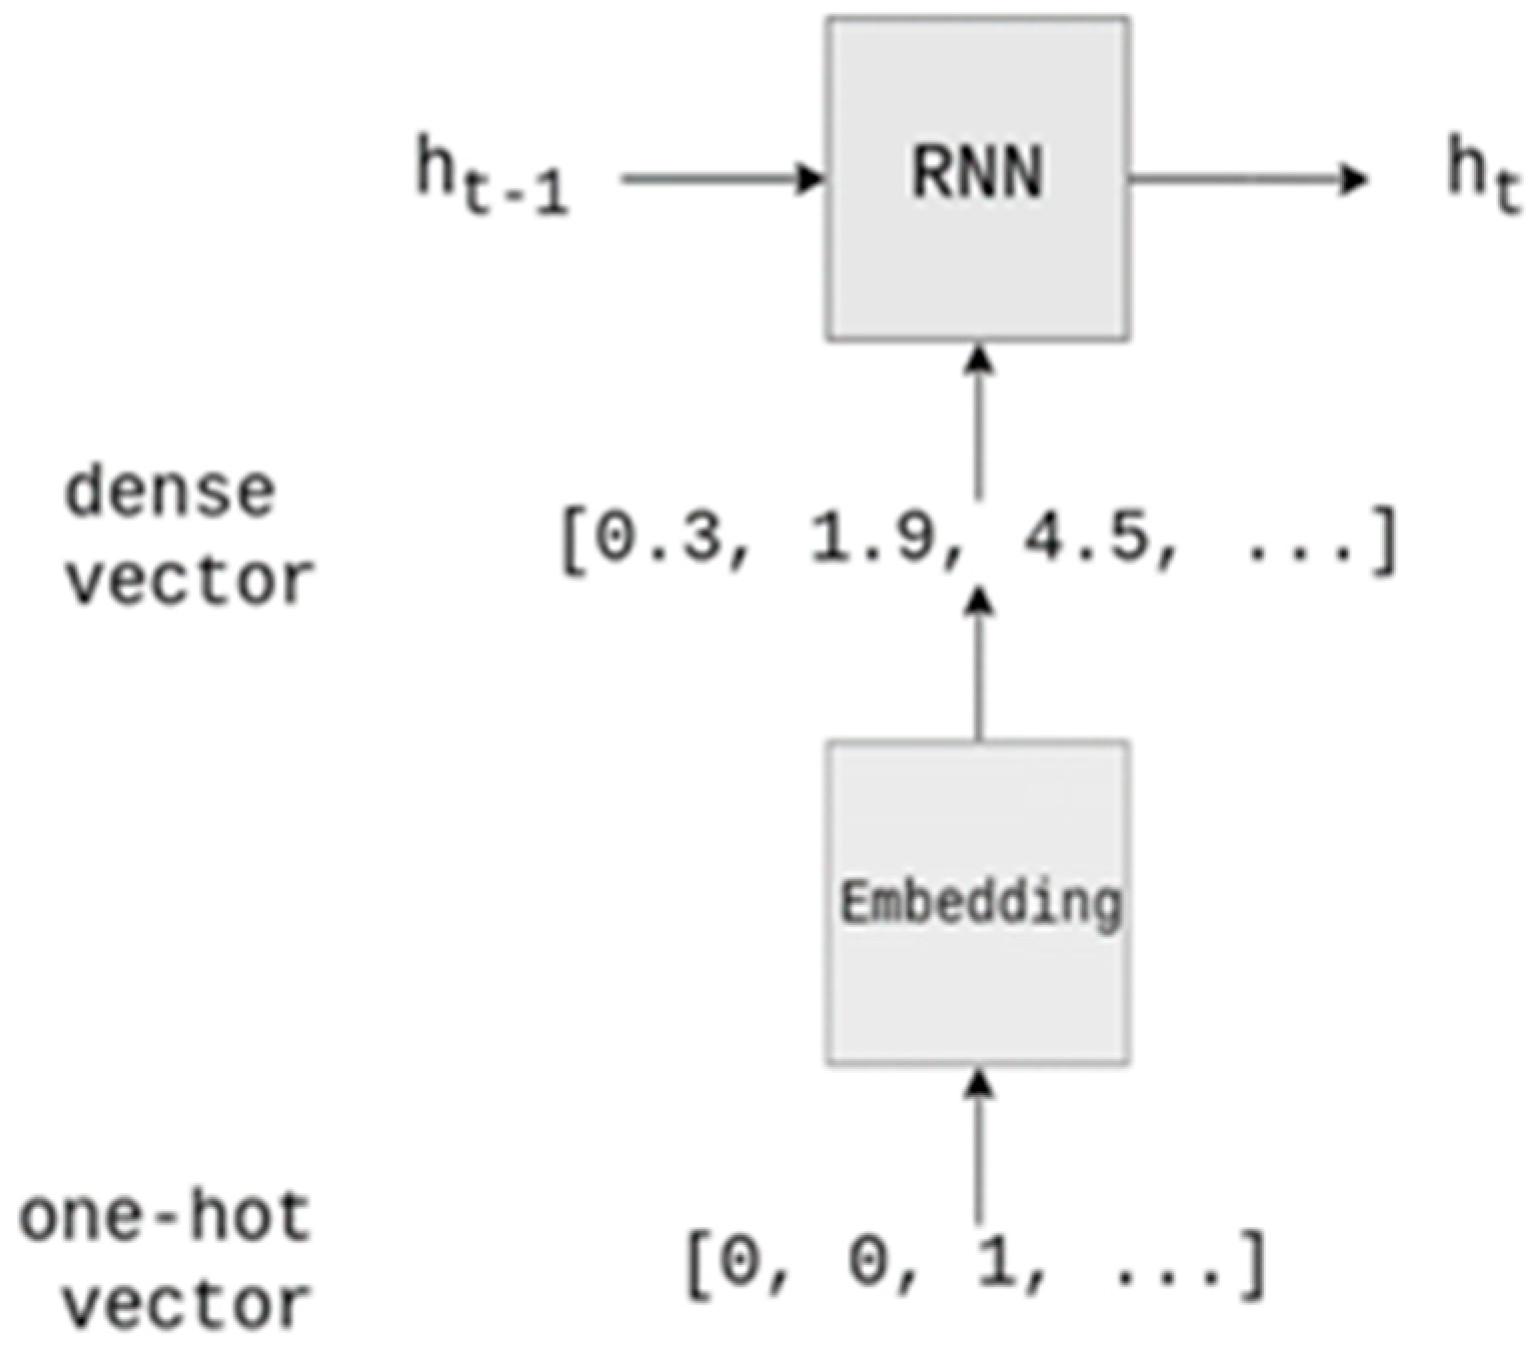
3.4.2. Embedding Layer Preprocessing Technology
Usually, the LSTM network needs to set up an embedding layer before performing the task. The function of this layer is to re-encode the one-hot vector of the input data to change the input matrix from a sparse matrix to a dense matrix [
18].
Figure 12 shows the conventional operation of the embedding layer, which performs one-hot encoding of the feature vector and then through training of the embedding layer converts it into a dense feature matrix and then inputs it into the detection model. The weight matrix of the embedding layer here is initialized randomly. This operation method will cause the input feature vector to lose some attributes during the training process, and the training of the embedding layer takes a lot of time, which leads to a high cost of training time for the malware detection model. Therefore, this paper puts the embedding matrix trained during API vectorization directly into the embedding layer here, which speeds up the model convergence while preserving the input attributes.
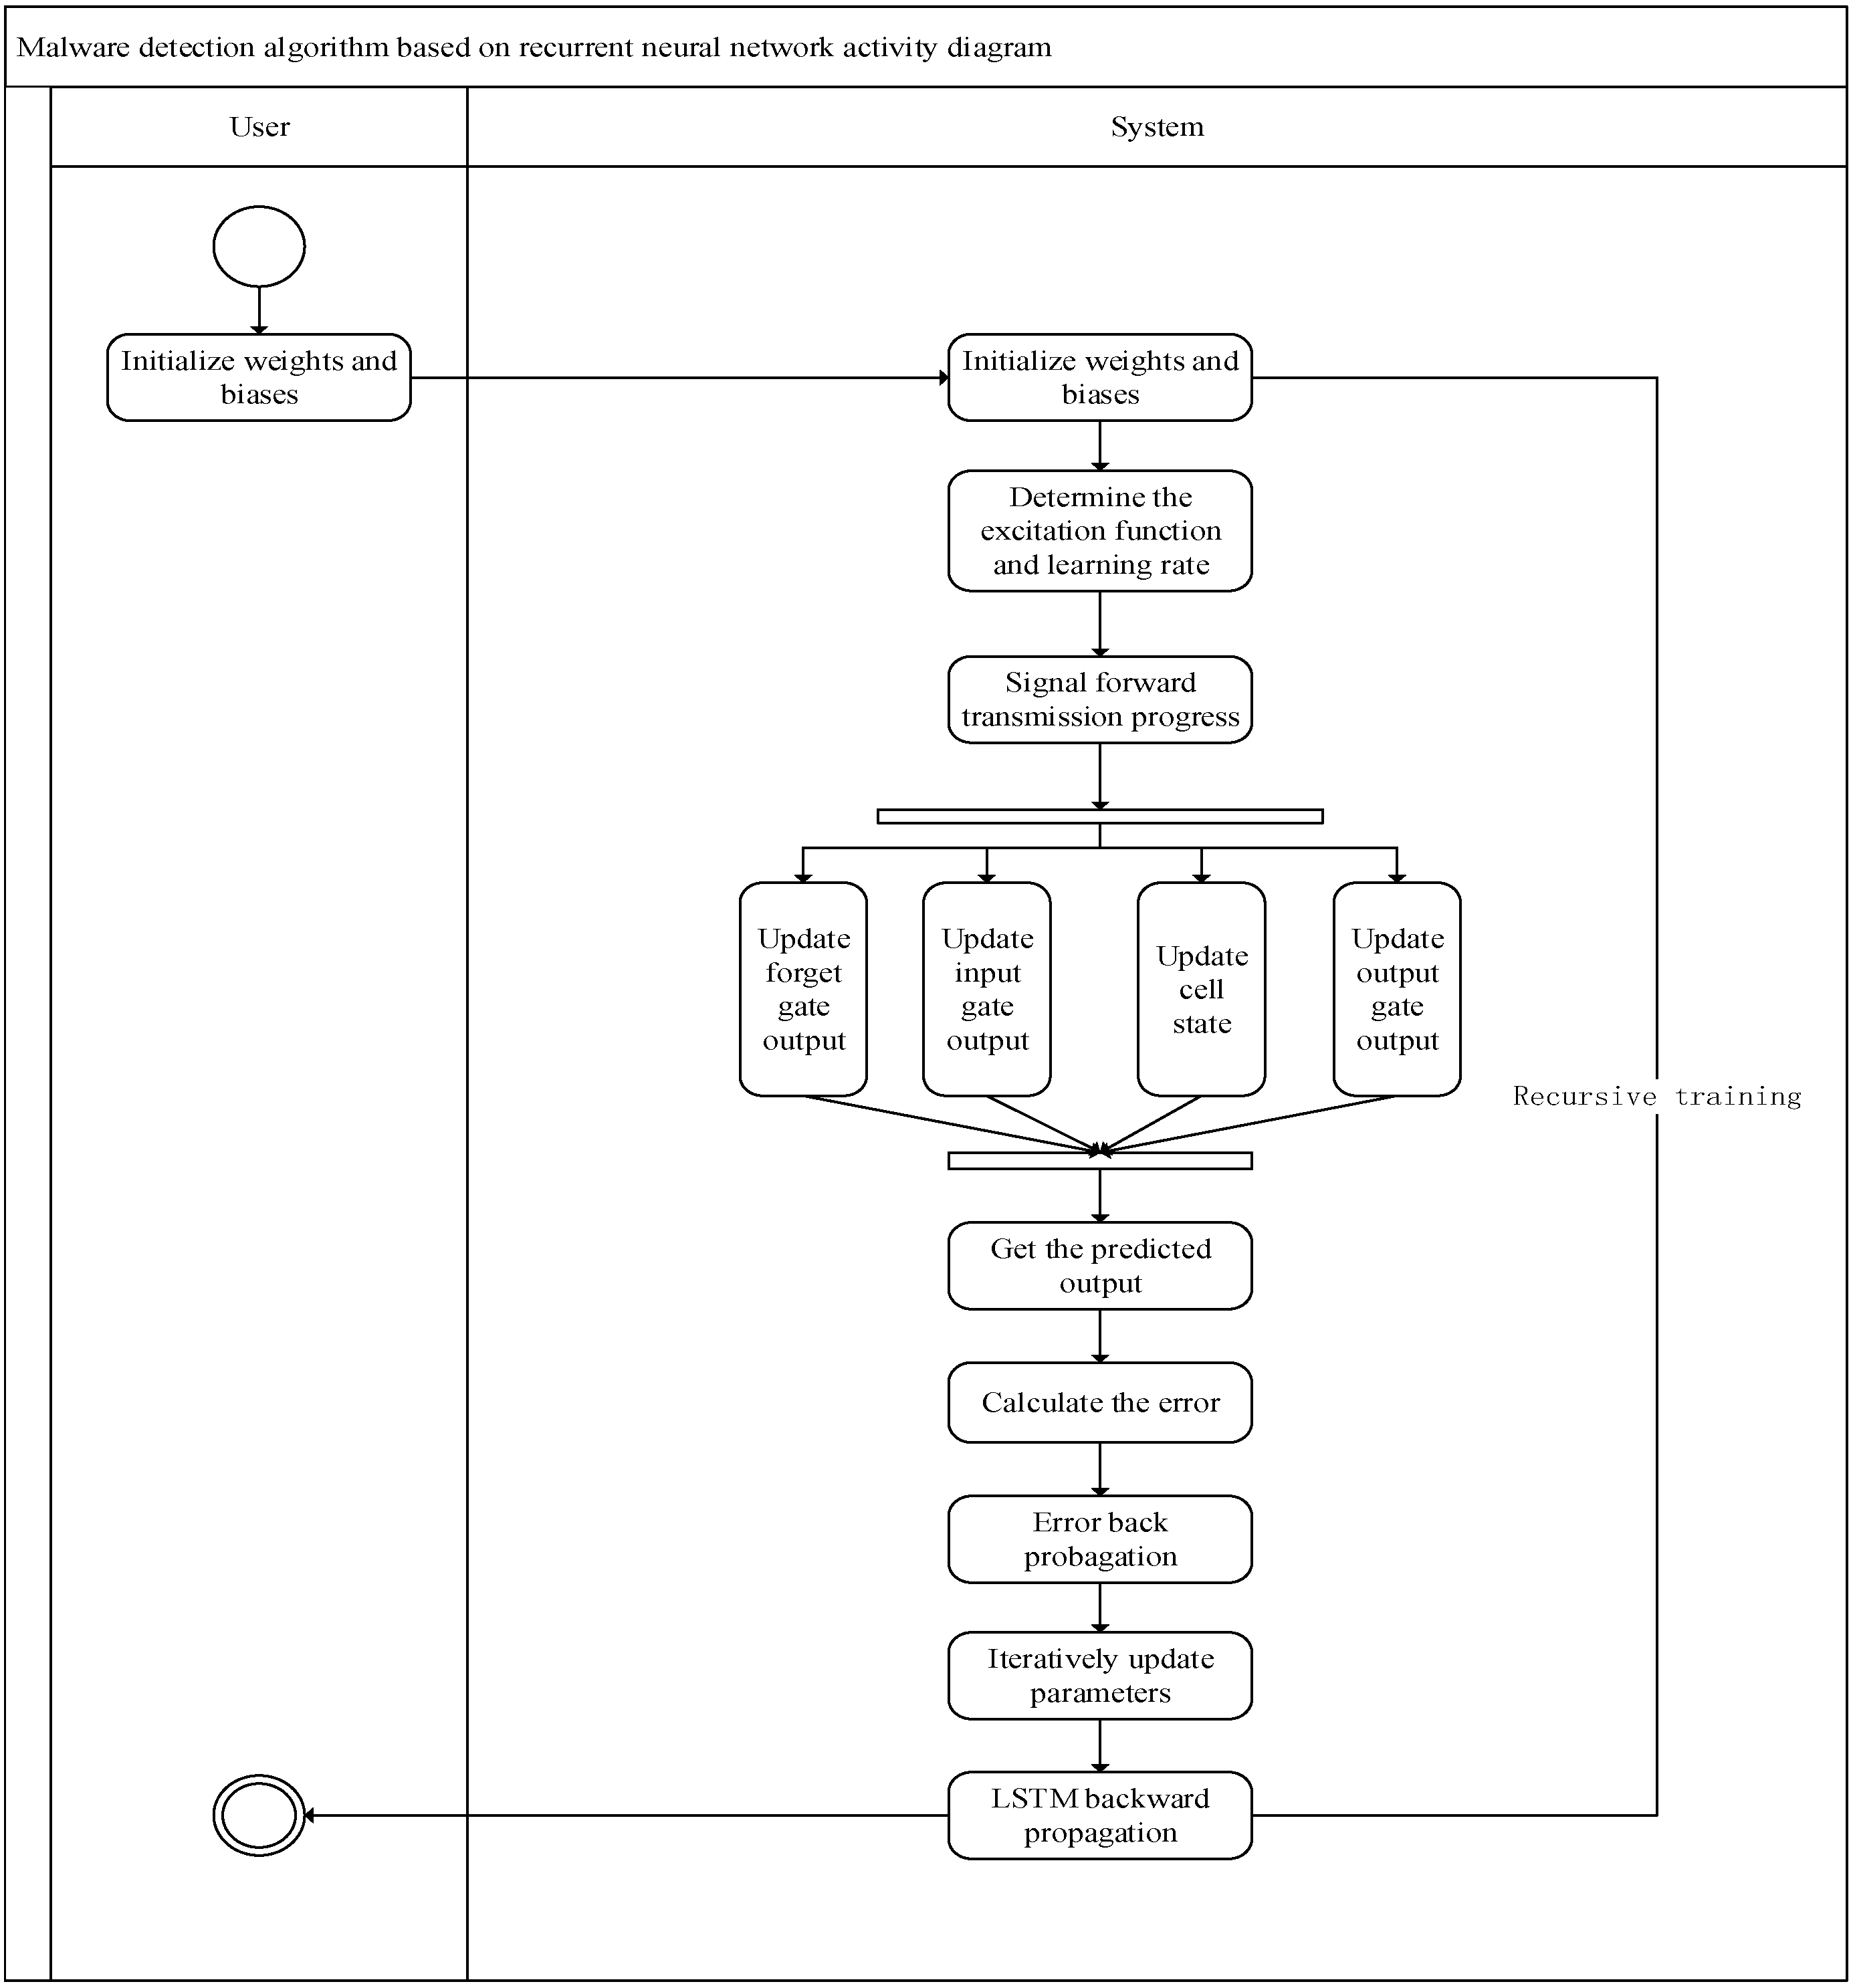
3.4.3. Network Model Training
After the design of the parameters and structure of the cyclic neural network model for malware detection is completed, the model needs to be trained to detect unknown software. The learning algorithm of the recurrent neural network model for malware detection is shown as Algorithm 3. The activity diagram of the malware detection algorithm based on a recurrent neural network is shown as
Figure 13.
| Algorithm 3: Malware detection algorithm based on recurrent neural network |
Input:
APK file training data set
where
is the API call sequence corresponding to the APK file.
Output:
LSTM network model in malware detection
scenarios
BeginStep 1: Initialize the malware detection network. Clarify the number of nodes of the input layer, hidden layer and output layer of the network. Step 2: Initialize the weights, hidden layer and output layer bias between them. Step 3: Initial weights and biases are generally initialized randomly to −1 to 1 or between 0.5 and 0.5. Step 4: Determine the excitation function and learning rate. Step 5: Signal forward transmission process: The input vector, representing the sequence of API calls, traverses the hidden layer, undergoes nonlinear transformation and influences the output node to produce the predicted classification result. The calculation method of each threshold in the forward conduction process is as follows. Step 6: Update forget gate output:
(In the above formula, are the weight coefficient vectors of the forget gate, the input gate and the output gate, respectively. respectively, correspond to the linear relationship coefficients of the three gate control devices, and respectively, correspond to the offset of the linear relationship of the three gate control devices).
Step 11: Calculate the error between the predicted classification value of the output layer after the malware detection network and the label value of the APK file itself. Step 12: Error back propagation: the output layer error is transmitted in the opposite direction (output layer → hidden layer → input layer) to update the weight of each connection and the bias of each node. Step 13: The same method above (step 12) is used as the traditional RNN idea; through gradient descent, the method iteratively updates all parameters. Step 14: When LSTM is propagating backward, only is propagating backward, and
only helps the current layer calculation:
than the preset threshold.
End |
The malware detection model, based on a recurrent neural network, is trained using the API call sequence as the feature. Throughout the training process, the parameters in the detection model are continually adjusted based on the degree of fit between the classification results of the training software and the actual outcomes. Eventually, a malware detection model with discerning capabilities from benign software is derived. This detection model can then be employed to identify test software or unknown software.
4. Cloud Platform System Design and Deployment
In this section, the cloud platform-based malware detection and storage subsystem are proposed first. Next, the paper presents a cloud platform-based malware detection computing subsystem and analysis subsystem. In order to accelerate the training process of the malware detection model, this paper adopts the distributed parallel computing framework based on cloud computing architecture. Finally, the data flow diagram of the malware detection and analysis subsystem based on a cloud platform is described in detail.
The data processing process of the malware detection cloud platform constructed in this paper can be roughly divided into the data collection phase, the data persistence phase, the data processing phase and the result feedback phase. The data collection stage is divided into two parts. The first one is manual collection, which is mainly to collect the data set required for the training of the malware detection model. The second one will collect a variety of Android installation software packages and transmit them over the network. In the data persistence stage, the cloud platform will be responsible for receiving the installation software package transmitted by the client and the training data set of the storage model [
28,
29,
30,
31]. The data processing stage includes a series of substages, such as feature extraction, feature data preprocessing and model training, which is the core stage of the entire detection cloud platform. The result feedback stage is mainly to return the test results of the cloud platform to the user according to the upload order of the client, which gives the user a clear visual test result.
The cloud platform system comprises the malware detection storage subsystem, the malware detection computing subsystem and the malware detection analysis subsystem according to their functions.
4.1. Cloud Platform-Based Malware Detection and Storage Subsystem
In this section, the paper presents a cloud platform-based malware detection and storage subsystem system architecture, which is integrated on Hadoop common storage components and some specific ones.
The main functions of this subsystem are the parallel transmission of files and the distributed storage of files. Good fault tolerance, seamless scalability to handle big data and convenient access to massive data sets are essential requirements. The specific architecture is illustrated in
Figure 14.
To integrate based on Hadoop [
32] common storage components, the specific components are as follows:
- (1)
HDFS is a distributed file system [
33]. It can detect and respond to hardware failures and is used to running on low-cost general-purpose hardware. It provides high-throughput application data access functions through streaming data access;
- (2)
HBase is a scalable, highly available, high-performance and column-oriented dynamic database designed for unstructured data [
34]. The data stored in HBase can be processed using MapReduce;
- (3)
Hive is a data warehouse architecture based on Hadoop [
35], providing data storage management and query and analysis capabilities for large data sets;
- (4)
Finally, considering the efficiency of the cloud platform on certain occasions in actual application development, it is also necessary to deploy and build an efficient data caching component Redis, which provides a data caching function based on computer memory and supports multiple data types and storage methods (key-value type).
At this point, the malware detection storage subsystem based on the cloud platform has basically been constructed. The storage subsystem designed through the above architecture has the following advantages:
- (1)
Extremely strong scalability and easy maintenance. From an architectural point of view, the subsystem itself is independent of other cloud platform-based malware detection subsystems, so it can be used in the future according to changes in specific usage scenarios make improvements;
- (2)
Reliability and security: The bottom layer of the cloud platform-based malware detection storage subsystem uses the distributed file management system unique to Hadoop as the data storage core, which is solved by uniformly using the storage disks provided by the cluster. A large amount of data is stored on a single computer. This design greatly improves the reliability and security of the cloud platform-based malware detection storage subsystem in terms of data storage;
- (3)
Multiple types of data storage: The malware detection and storage subsystem based on the cloud platform integrates multiple data storage components, so that it can not only store APK files but can also provide a way to store feature vectors and detection results.
4.2. Cloud Platform-Based Malware Detection Computing Subsystem
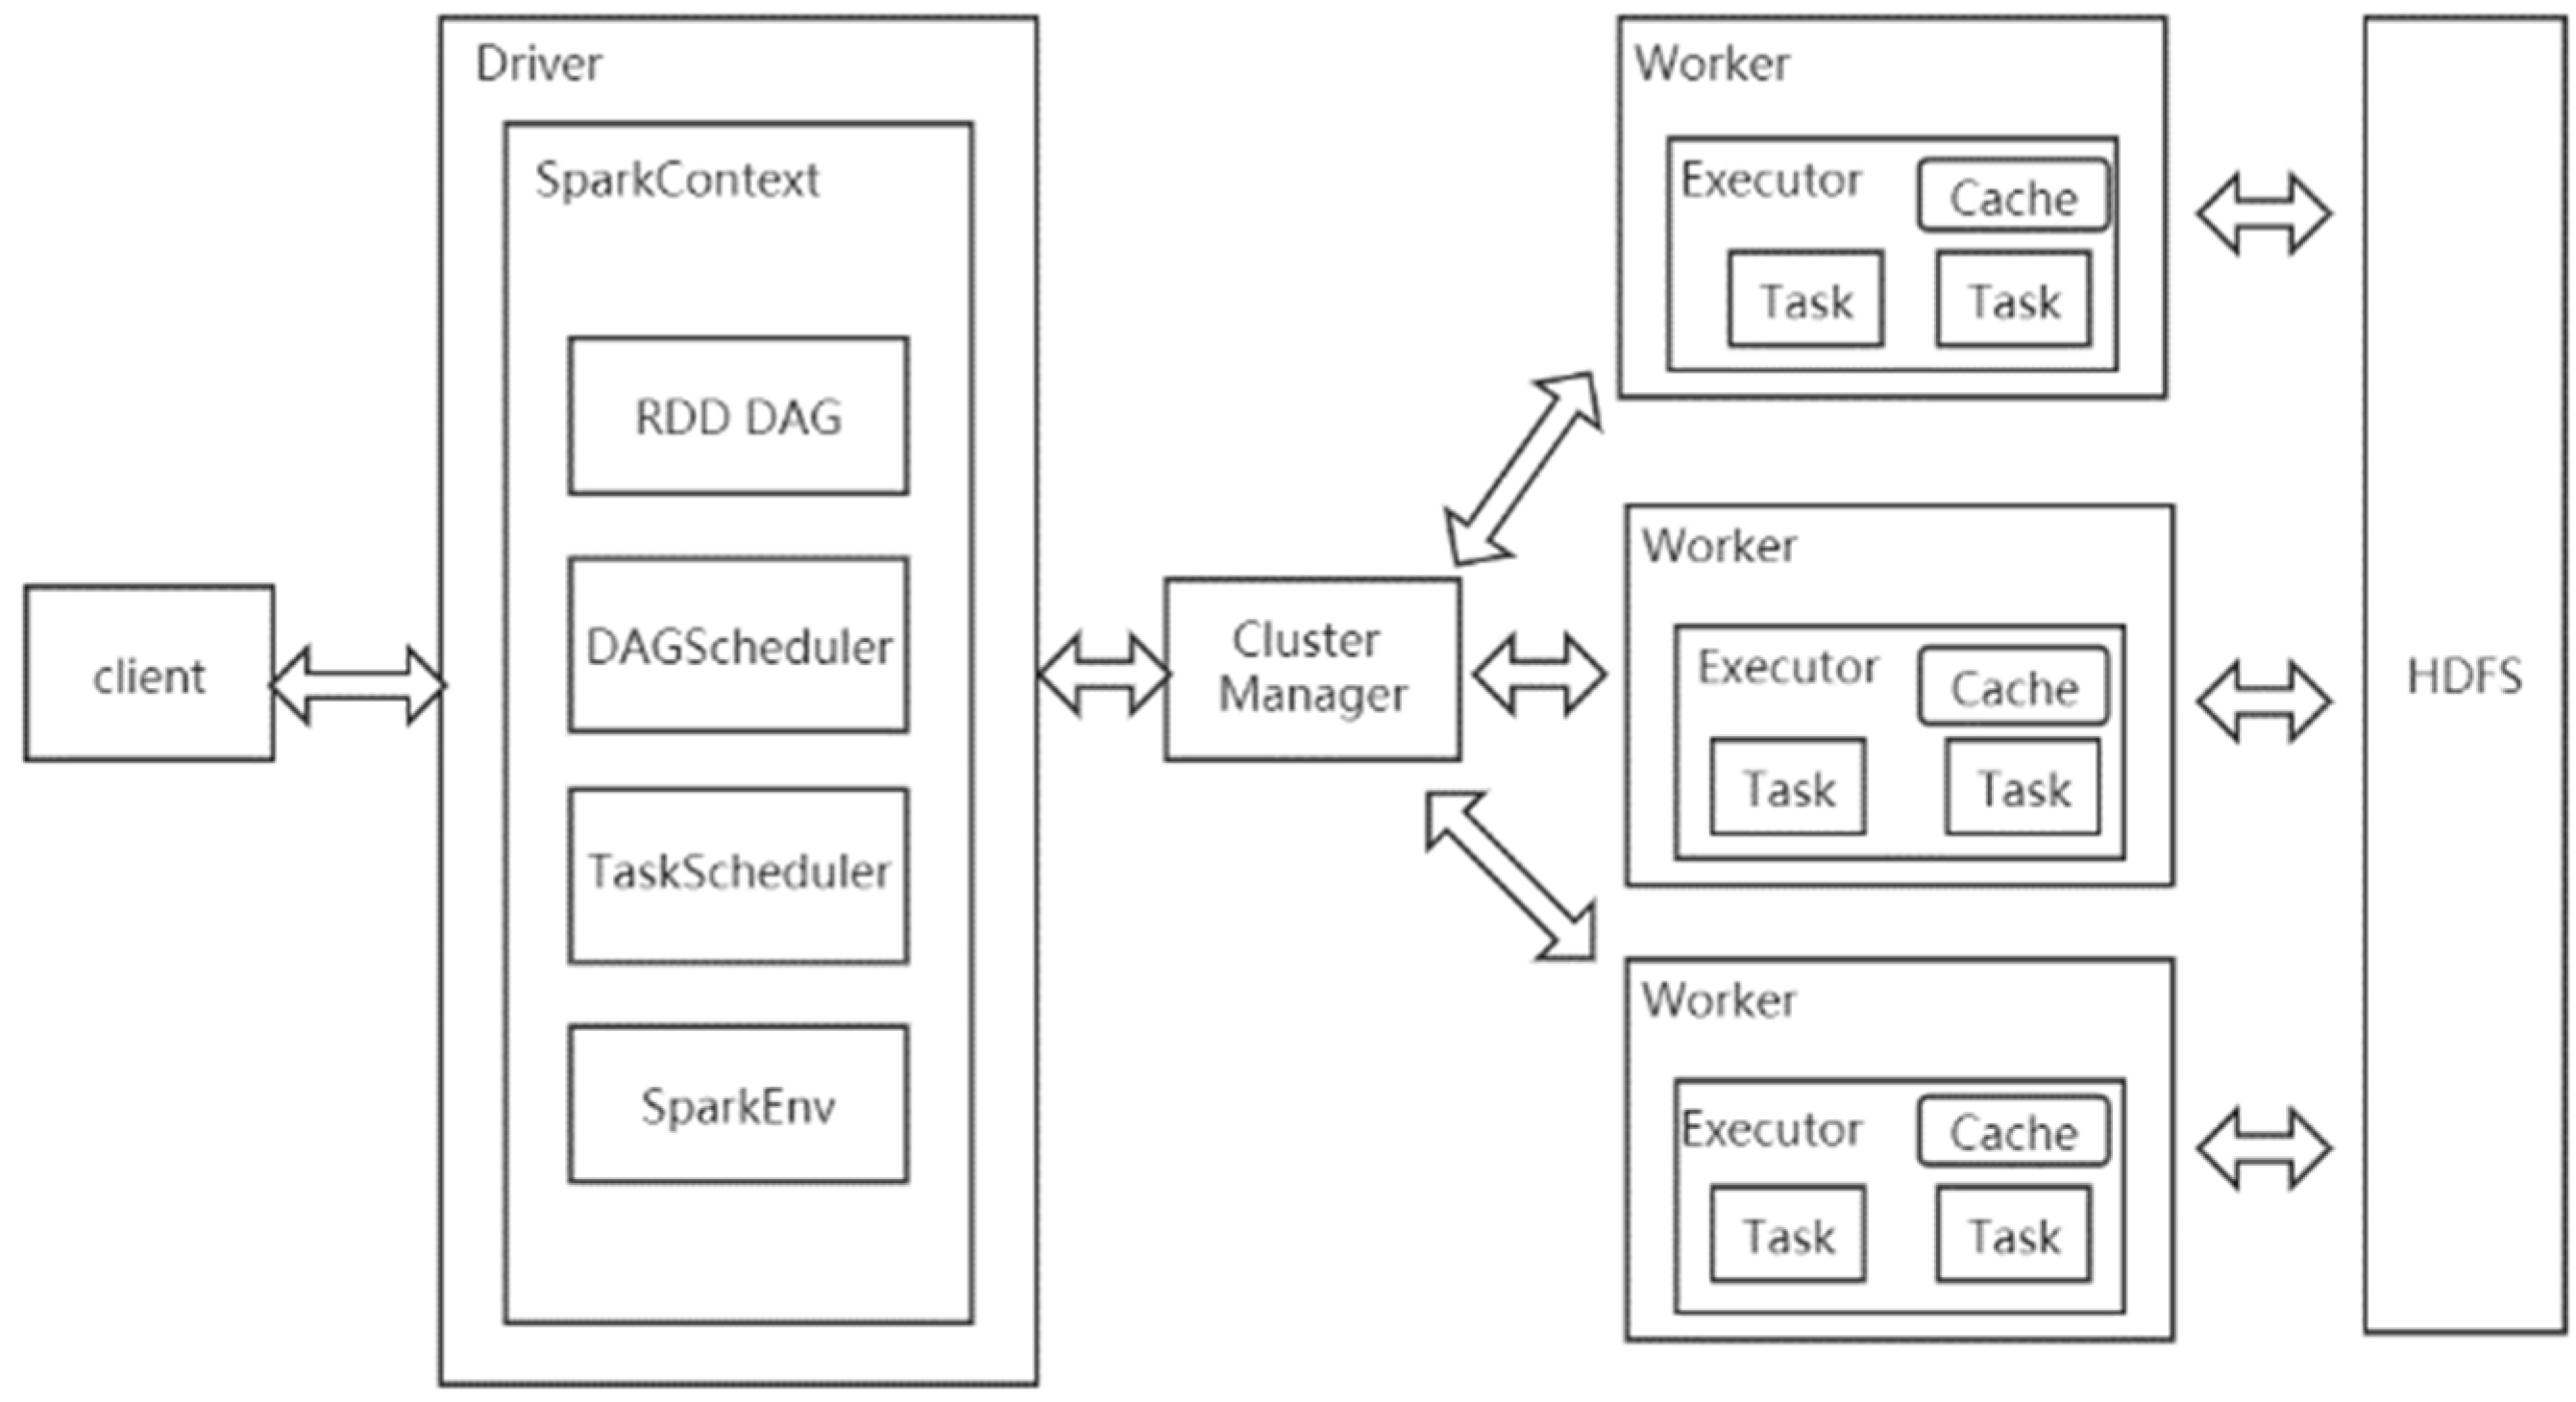
In this section, the paper presents a Cloud platform-based malware detection computing subsystem architecture, which is integrated on MapReduce and Spark components.
The main task of this subsystem is to complete the computational tasks in malware detection, as its system structure and functional components directly affect the training speed of the malware detection model. The main components of this subsystem include MapReduce and Spark. The working principle of the malware detection calculation subsystem is shown in
Figure 15.
MapReduce primarily handles the computation of offline tasks. This component abstracts the entire parallel computing process into two functions: it reads and preprocesses data in the map phase, and then sends the preprocessed results to the reduce phase for merging. A MapReduce program only needs to specify map(), reduce(), input and output; the framework takes care of the rest.
Spark is responsible for the processing of real-time tasks. The Spark cluster is composed of driver, cluster manager (Standalone, YARN or Mesos) and worker node. For each Spark application, there is an executor process on the worker node, and the executor process includes multiple task threads. After the task on Spark is started, the driver applies for resources from the cluster manager, and the cluster manager sends a call-up signal to certain work nodes. The recruited work node starts the executor process to respond to the call and applies for tasks from the driver, and the driver distributes the program code of the task and different data pieces to the work node. Each work node performs a complete logical task based on the data it receives. After completing the training, the task parameters are summarized and sent to the driver program. Finally, the parameters are averaged.
The malware detection computing subsystem based on the cloud platform designed in this paper uses the Spark on YARN operating mode. The operating process of the subsystem is as follows:
- (1)
After the malware detection task is started, the corresponding driver initiates a resource application request to the resource manager in YARN;
- (2)
After receiving the resource application request, YARN selects an agent node in the cluster as the first container of the malware detection program and opens the application manager of the malware detection program in the current container;
- (3)
Register the application manager of the malware detection program in Resource manager so that the resource manager can be used to observe the execution of the malware detection program;
- (4)
The application manager of the malware detection program performs the remaining resource allocation tasks;
- (5)
After the application manager completes the application for the required container, it initiates a task request to the Spark context in the driver by communicating with the rest of the work node;
- (6)
Spark context assigns tasks to work nodes. Each work node returns the execution status of the current task to the application manager while executing the detection program. Through the application manager, the execution status of all tasks under the work node can be learned;
- (7)
While waiting for the task execution to end, the driver will summarize and output the task running results, and the application manager will log off the malware detection program to the resource manager.
In order to accelerate the training speed of malware detection models, the malware detection module based on the cloud service adopts the Spark distributed parallel computing framework for parameter training. The working principle of the parallel training process of the malware detection model is shown in
Figure 16.
4.3. Cloud Platform-Based Malware Detection and Analysis Subsystem
In this section, the paper presents a cloud platform-based malware detection and analysis subsystem architecture, which serves as the core of the malware detection system, constructed upon the storage subsystem and the computing subsystem. The core logic code of the malware detection technology is executed within this subsystem.
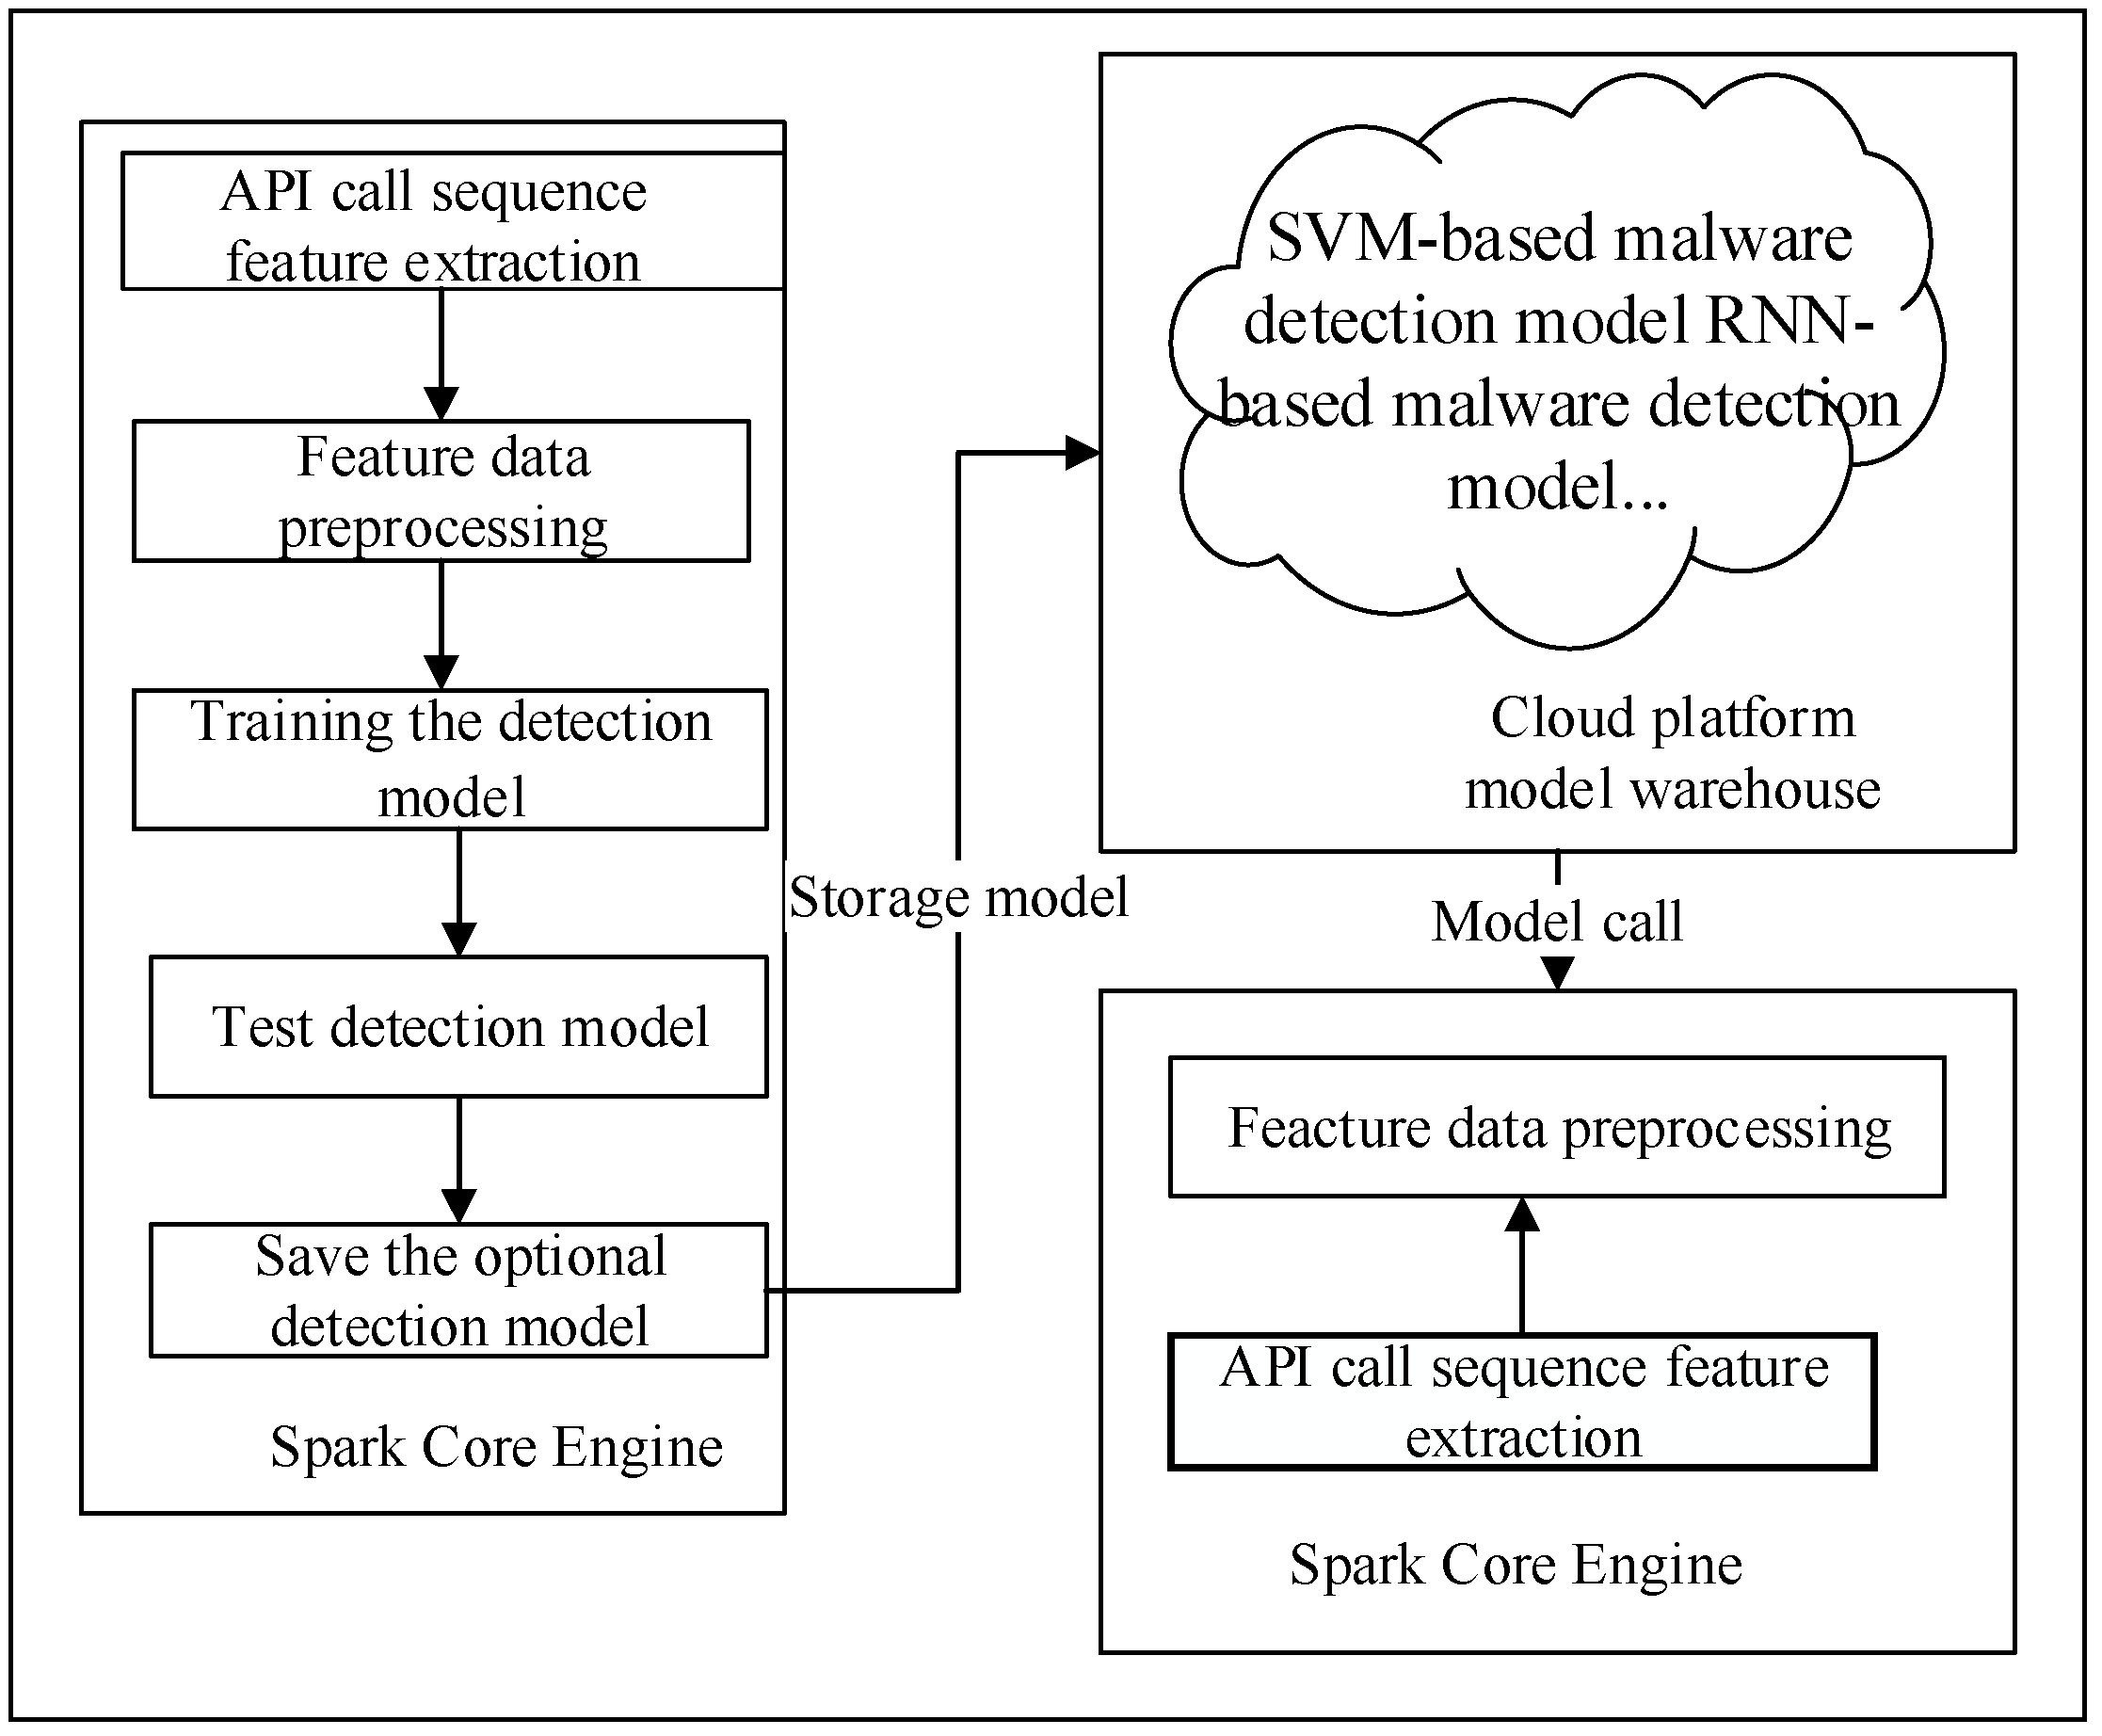
The data flow of this subsystem is illustrated in
Figure 17. The data flow of the subsystem is designed as follows:
- (1)
Input the APK file sample set from the storage subsystem and perform the API call sequence feature extraction operation on the sample set;
- (2)
After the feature extraction is completed, it enters the data preprocessing stage. In this stage, the skip-gram network model needs to be trained with the sample set, and then the output of the model is preprocessed;
- (3)
Use the preprocessed data to train the detection model. The detection model selected here is a two-way LSTM network model. The model here is built on the core engine of Spark, which can ensure the rapid construction of the model;
- (4)
After completing the model training, store the trained model in the cloud model warehouse;
- (5)
Input the APK file to be detected from other subsystems to the analysis subsystem, call the corresponding malware detection model, and finally generate predictive analysis of the data.
This paper used the experimental sample data provided in
Section 5 to test the malicious software detection method proposed in this article on PC machines and cloud environments. The time required for detecting different samples is shown in
Table 5. It can be seen that the cloud-based malware detection deployment method has sufficient computing resources, storage resources and network resources, and the experimental results indicate that a malicious detection method in a cloud platform environment has lower detection time and higher detection efficiency than in PC computing ones.
5. Experiment and Result Analysis
The experiments in this paper were performed on three servers with i7-10700K CPU, 32 G memory, 3.9 GHz main frequency, NVIDIA 3060 graphics card and Ubuntu 20.04 system.
Before the experiment, the data sources tested in this article were first introduced. The samples were collected between August 2010 and October 2012 and were provided by the MobileSandbox project. The Canadian Institute of Cyber Security provided the second part of the publicly available CICAndMal2017 data set, namely CICInvesAndMal2019, which includes permissions and intents as static functions, the API calls and all the generated log files as dynamic functions, which are divided into three steps (during installation, before restart and after restarting the phone). In this part, by combining the previous dynamic features (80 network flows using CICFlowMeter-V3) with the two-gram sequence relationship of API calls, the performance of the malware category and family classification improved by about 30%. In addition, these features were checked in the presented two-layer malware analysis framework. The company also provides other capture functions, such as battery status, log status, packages, process logs, etc.
For the sake of evaluating the effectiveness of malware detection methods, this paper proposed some indicators, such as detection accuracy and recall rate, etc. In order to reduce the error caused by the imbalance between the test set and the training set, the 10 times 10-fold cross-validation method was used in the experiment. In this test validation, the paper obtained a total of the 10 times 10-fold cross-validation tests, and the average of the results obtained from these validation tests was used as the final performance test result.
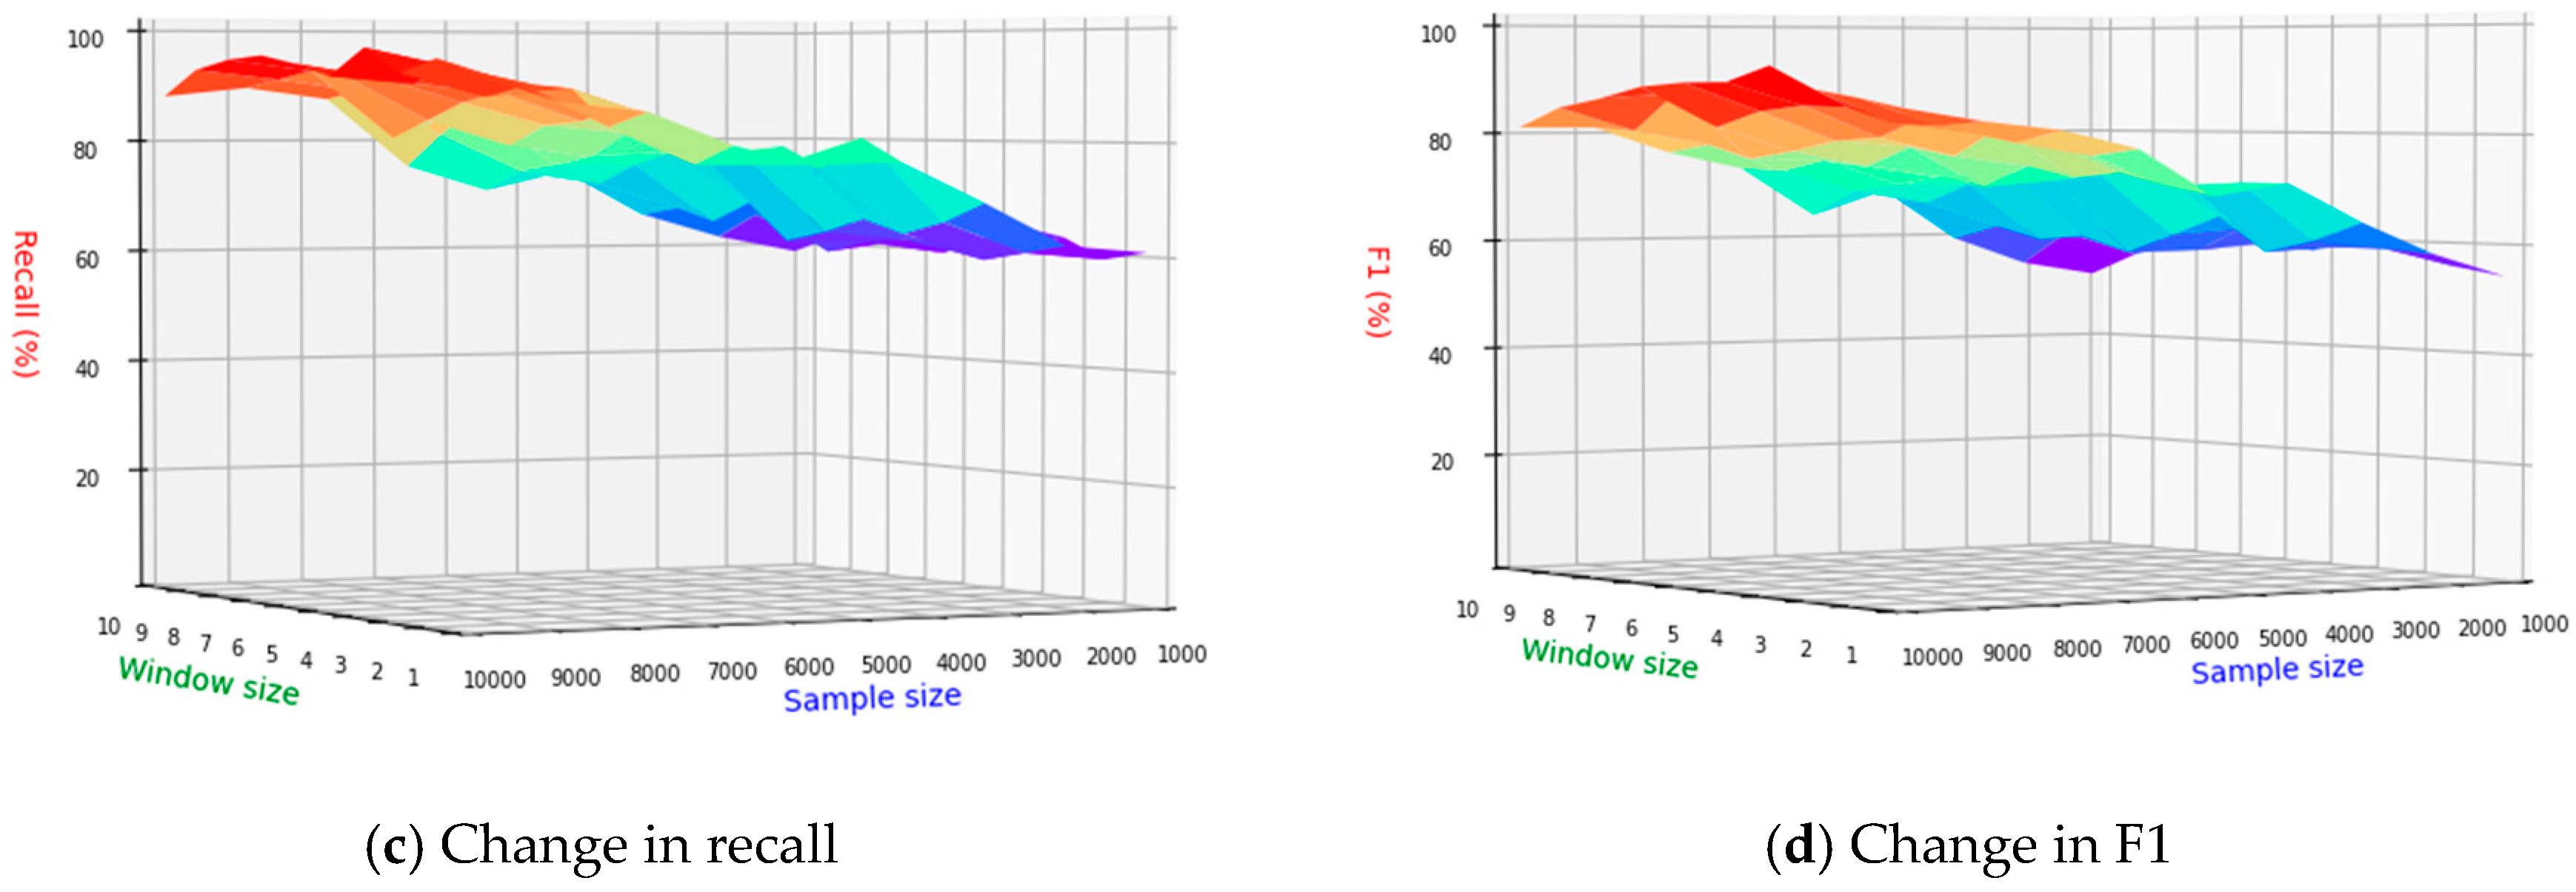
In order to determine the optimal size of the window value in the N-gram algorithm on the current sample set, this paper changed the window value while increasing the number of training sets and compared the changes in the evaluation indicators of the malware detection model.
Figure 18a–d illustrate changes in accuracy, precision, recall and F1 value across different window sizes and sample set numbers, and the different colors in the figure represent the changes in performance indicators with different WINDOWS sizes.The accuracy demonstrates an overall upward trend with an increase in the number of sample sets. It consistently rises and peaks when the sample set reaches its maximum, and the window size is four. In terms of recall, the overall index is higher, and it is on the rise with the increase in the number of sample sets. The main reason for this phenomenon may be malware samples in the sample set being larger, as the malware detection model tends to divide the software to be detected into malware. The F1 value of the malware detection model also reaches the maximum when the number of samples is the largest and the window size is four. Based on the above analysis, for the window value in the N-gram algorithm, it is most appropriate to choose four under the current data set.
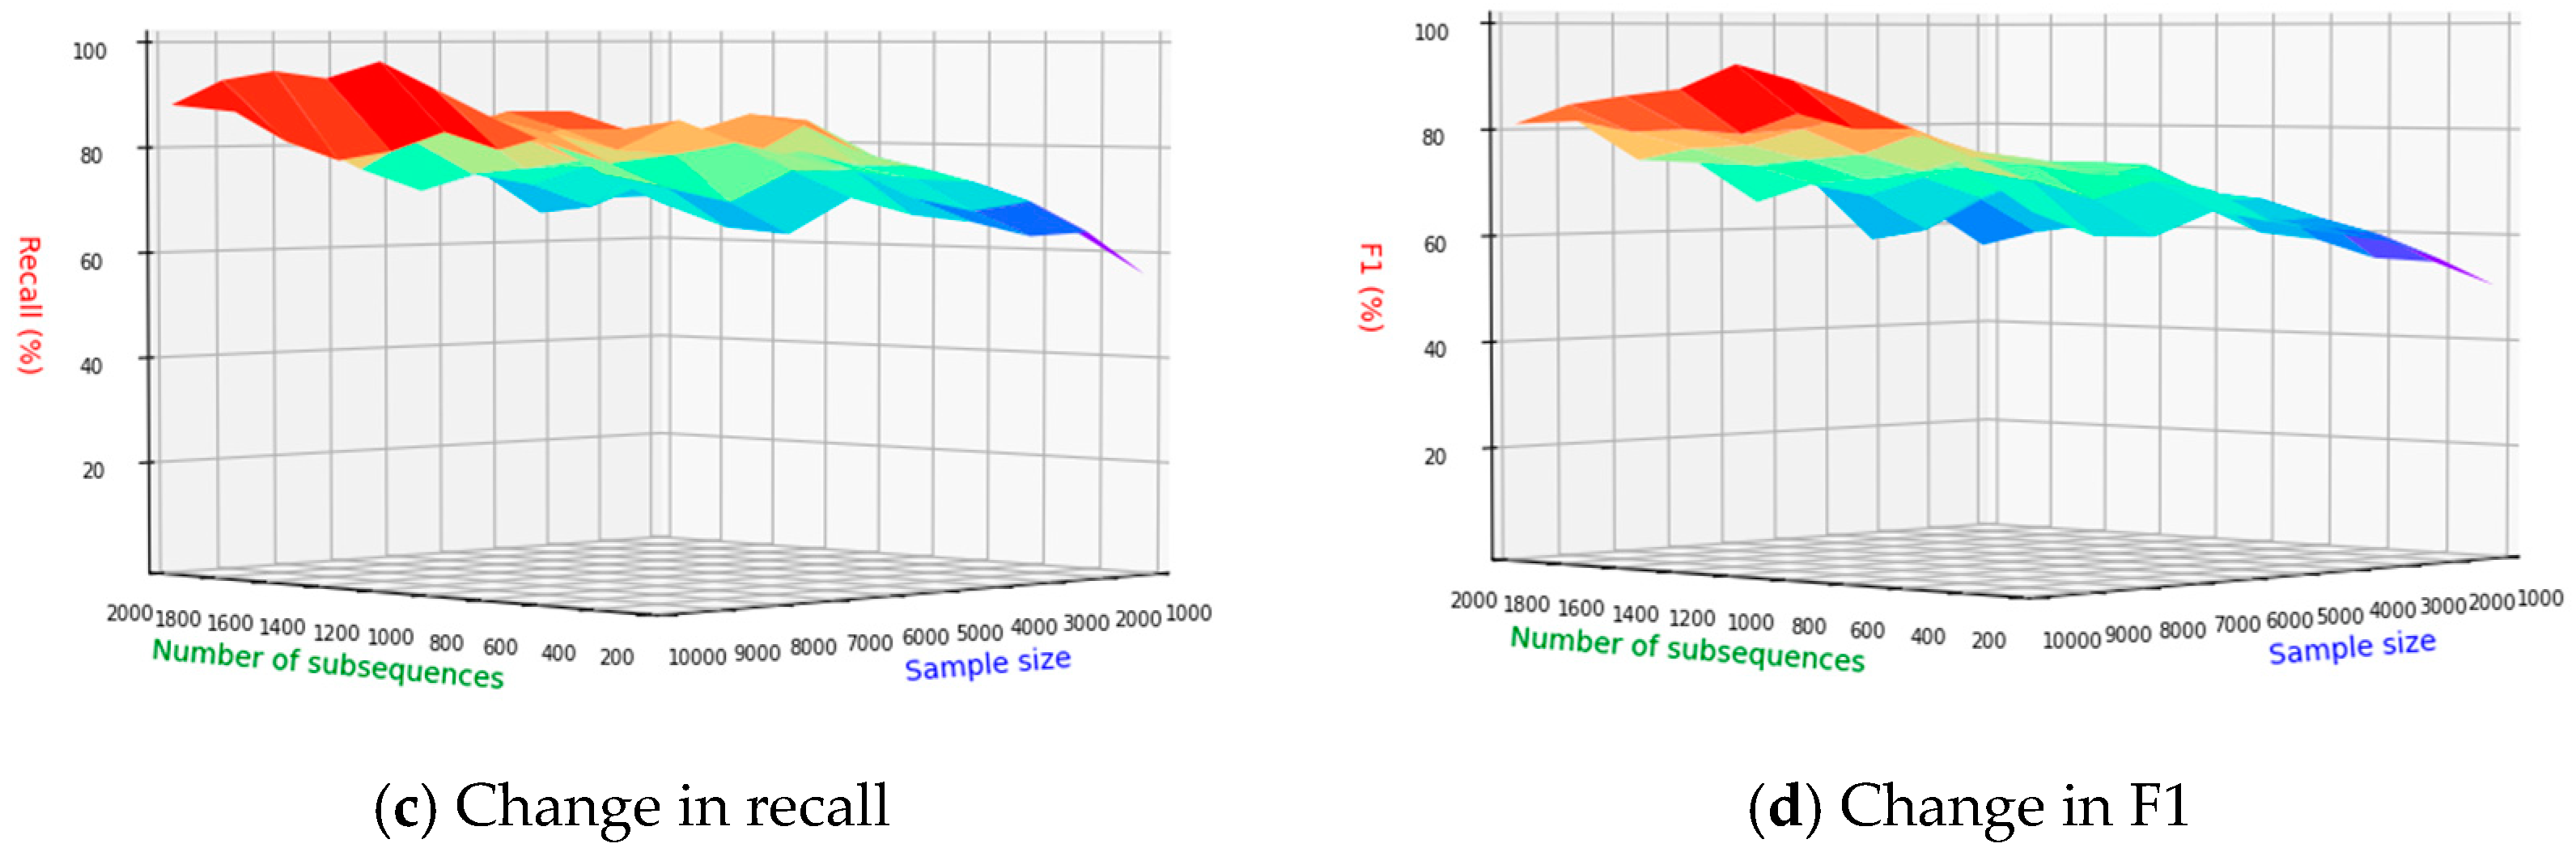
The information gain algorithm is used to calculate the amount of information contained in each subsequence after the N-gram, and the subsequences are sorted according to the amount of information, and then a limited number of subsequences are selected to form a new feature vector. The number of selected subsequences has a direct impact on the length of the newly formed feature vector. The amount of information contained in feature vectors of different lengths is also different. Generally speaking, the longer the vector, the greater the amount of information, but when the length of the feature vector input to the malware detection model increases, the training time of the model also increases. It will become longer, and the detection efficiency will decrease. Therefore, a comparative experiment was used to determine the optimal number of subsequences in the current test environment.
Figure 19a–d, respectively, show the changes of accuracy, precision, recall and F1 values under different numbers of subsequences and different sample sets, and the different colors in the figure represent the changes in performance indicators with different WINDOWS sizes. From the figure, it can be seen that the accuracy as a whole increases with the number of sample sets. It is on the rise, but at different stages of the number of sample sets, when the number of sequences is small, the accuracy is lower. When the number of sample sets reaches the maximum and the number of subsequences is 1200, the accuracy reaches the maximum. The reason for this phenomenon may be that when the number of subsequences is small, the malware detection model cannot collect enough information to distinguish malware. The precision as a whole increases with the increase in the number of sample sets, and the change is relatively stable. When the sample set reaches its maximum, subsequence precision peaks at 1200 sequences. Recall starts above 50% from the beginning and steadily increases with the growth of the sample sets. This trend indicates that the malware detection model tends to classify the software under detection as malware. The malware F1 of the detection model reaches the maximum when the number of sample sets reaches the maximum and the number of subsequences is 1200. In summary, the number of subsequences is 1200 in the current data set.
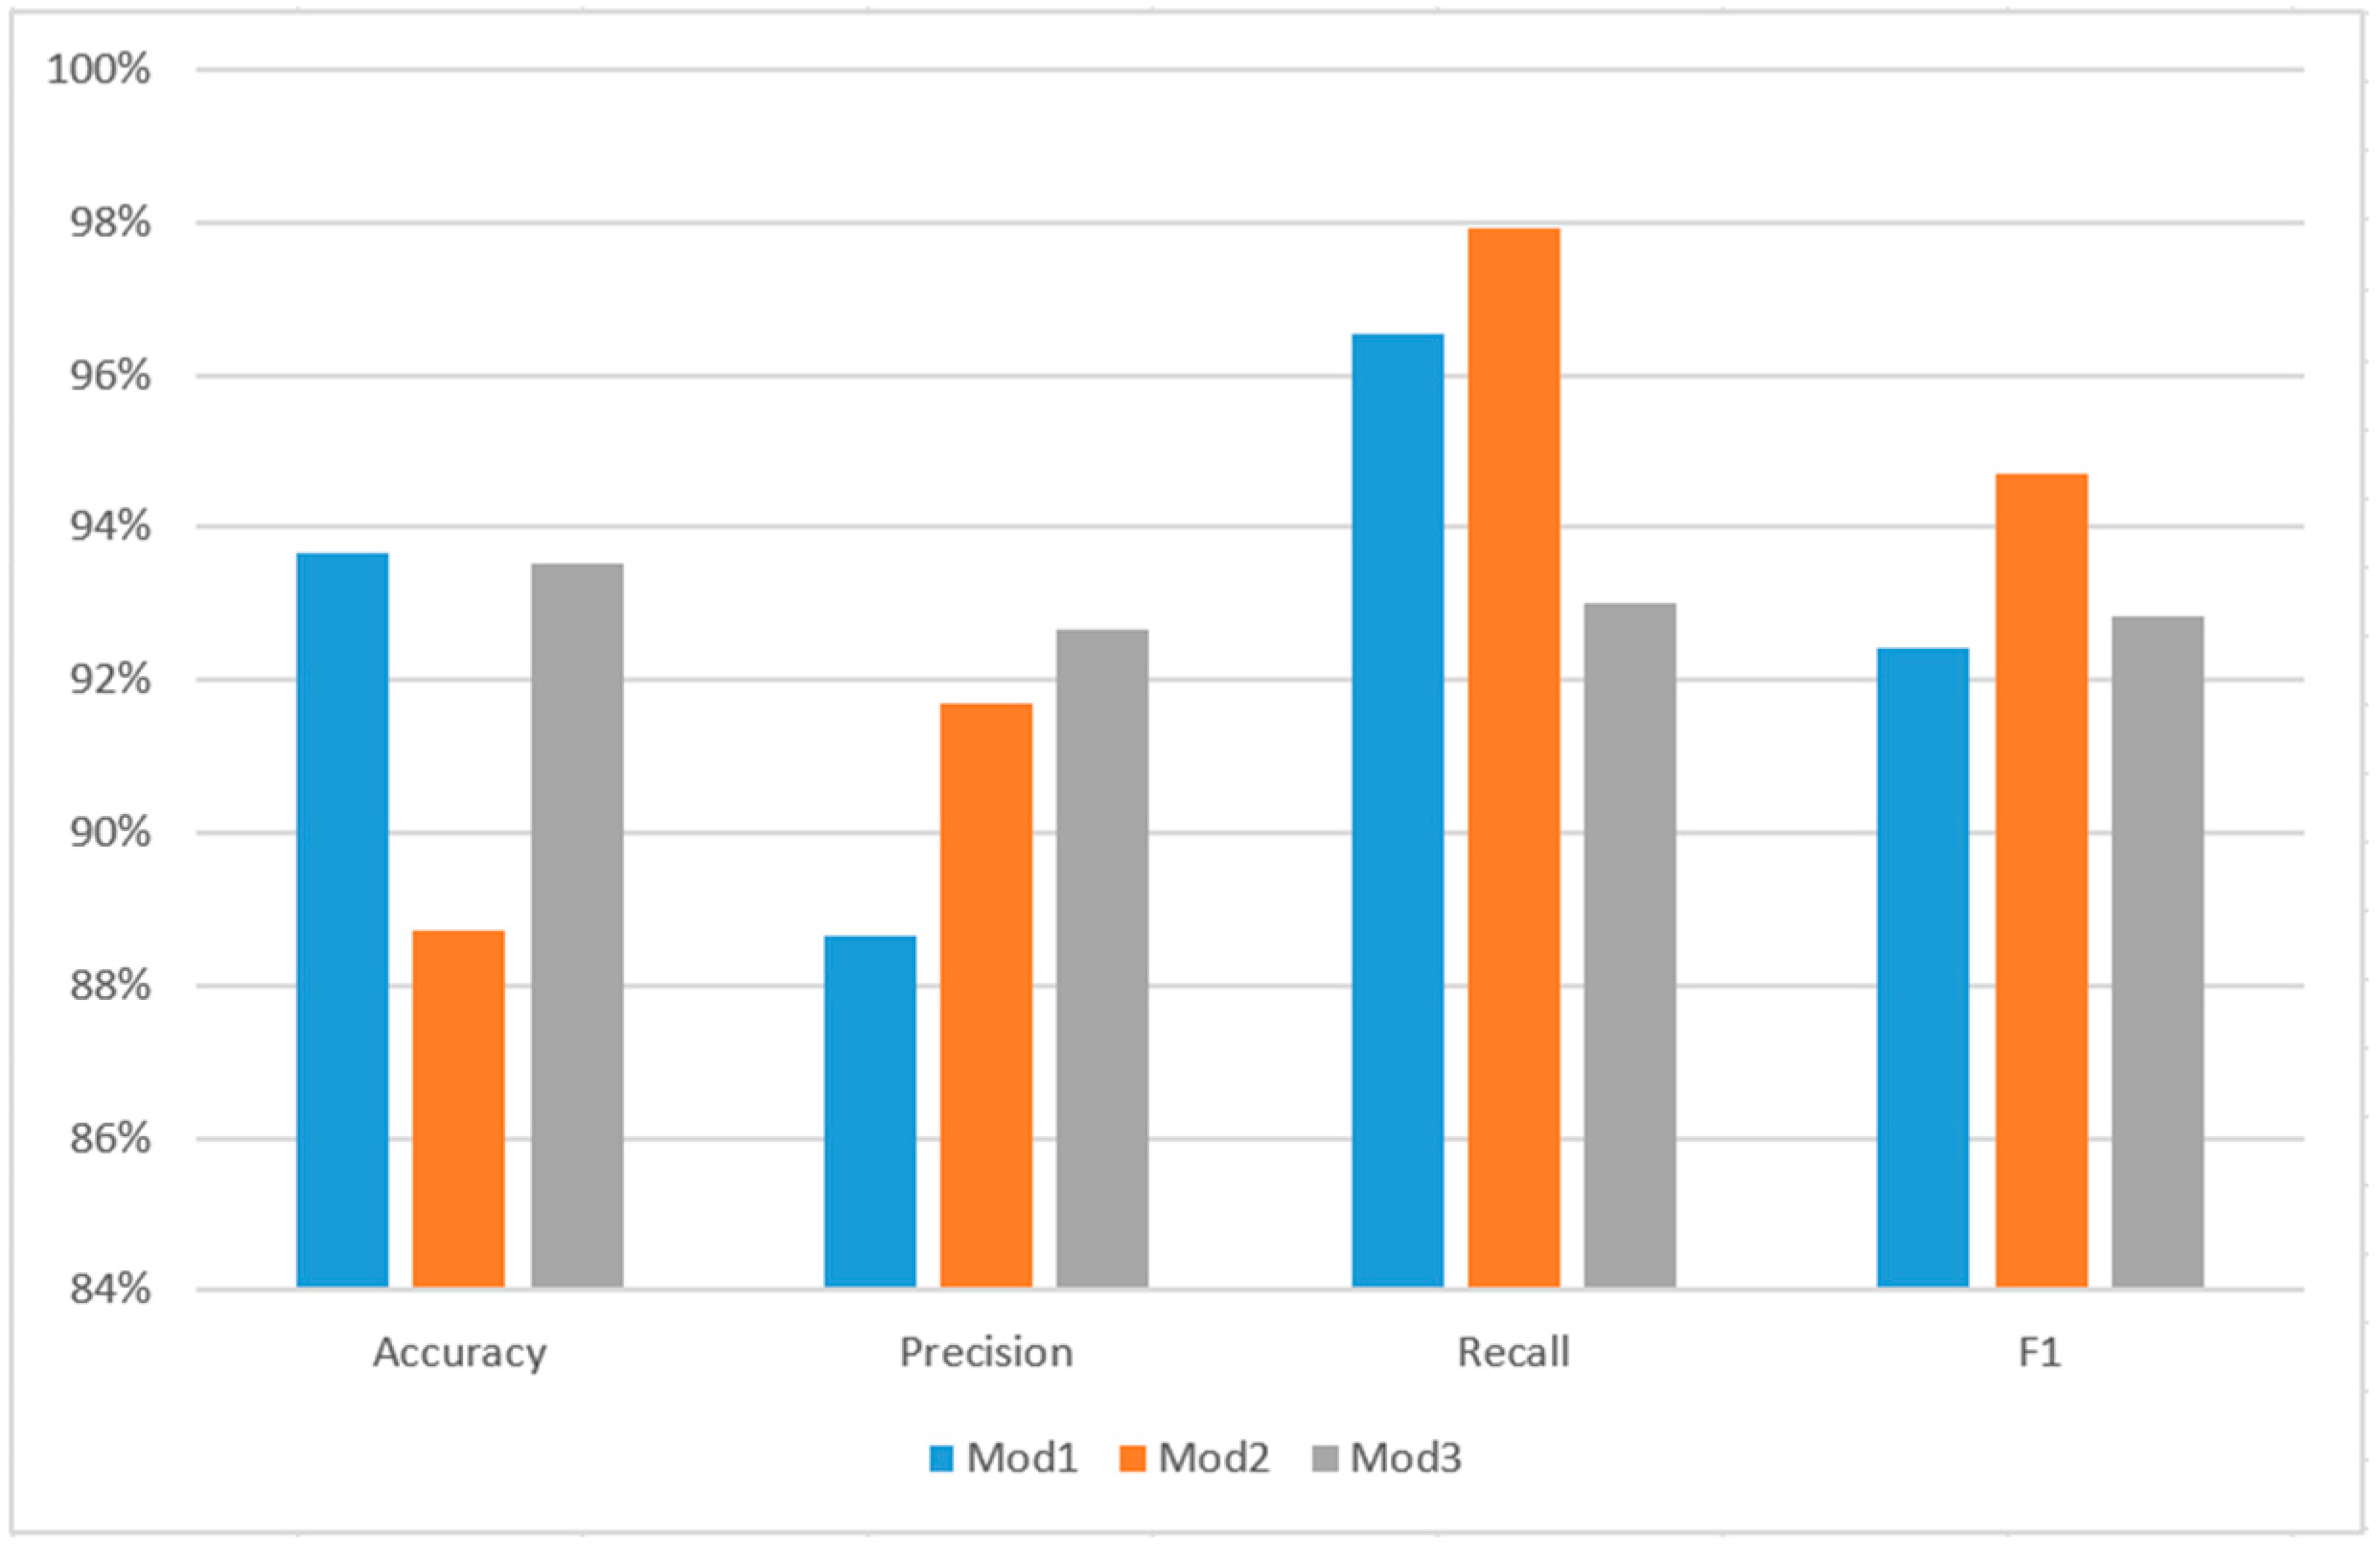
In order to verify the effectiveness of the detection model (Mod1) proposed in this paper, the API sequence-based recurrent neural network detection model (Mod2) [
3] constructed by Xu Hao of Beijing University of Posts and Telecommunications and the API feature-based detection model constructed by Wang Tianqi of Beijing University of Posts and Telecommunications were selected. A logistic regression detection model (Mod3) [
7] was compared. The experimental results obtained are shown in
Table 6.
Figure 20 shows the comparison between several malware detection models. It can be seen from the figure that the detection model constructed in this paper is the best for ACC, but its precision is significantly lower than the other two detection models. The main reason may be the model. Given the concern about overfitting and to address the issue of some omissions in identifying certain malware, this paper restricts the number of iterations for the model. A less complex network model is chosen, acknowledging that this may result in some limitations in identifying certain types of malware.
6. Conclusions
This method separates the malware software detection of mobile terminals into four steps. The first part is API call sequence extraction, which uses AndroGuard to obtain a function call graph, then based on depth-first traversal to achieve an internal complete sequence acquisition and, finally, relying on address information, to obtain an API call sequence. Second, the paper adopts a preprocessing technique to remove the redundant subsequence and the continuous same mode API. Third, the paper presents the malware detection model based on a recurrent neural network, which uses the two-way LSTM network model to train the data set containing malware samples and benign software samples to obtain the final detection model and its parameters. Lastly, malware software detection of mobile terminals based on a cloud platform system is presented. The experimental results show that the proposed malware detection method can effectively improve detection accuracy. The application of deep learning algorithms combined with cloud platforms can not only greatly accelerate detection speed but can also improve detection accuracy. With the development of deep learning algorithms and the continuous maturity of cloud platform technology and applications, malware detection technology will become more specialized and personalized.
Author Contributions
Methodology, Y.Y., Y.Z. and Y.J.; Software, Y.J., X.S. and L.Z.; Validation, Y.Y., X.S., D.Z. and J.D.; Investigation, L.Z., D.Z. and J.D.; Writing—original draft, Y.Y., Y.J. and X.S.; Writing—review & editing, Y.Z.; Supervision, Y.Y. and Y.Z. All authors have read and agreed to the published version of the manuscript.
Funding
The research is supported in part by the Key Research Development plan of Shaanxi Province of China (No. 2019ZDLGY12-07, 2021ZDLGY05-05), the National Key Research and Development Program of China (2020YFB 1712201) and the National Industrial Internet Innovation and Development Project (bidding No. TC190A3X8-16-1, TC200H 038).
Data Availability Statement
Data will be made available on request.
Conflicts of Interest
The authors declare that they have no known competing financial interests or personal relationships that could have appeared to influence the work reported in this paper.
References
- China Internet Information Center. 46th “Statistical Report on Internet Development in China” [EB/OL]. Available online: http://www.gov.cn/xinwen/2020-09/29/content_5548176.htm (accessed on 29 September 2020).
- 360 Beacon Lab, 360 Safe Brain. “Android Malware Special Report 2019” [EB/OL]. Available online: https://cert.360.CN/report/contingent?Id=0d66c8BA239680d6674F2DBA9f2BE5f7 (accessed on 26 February 2020).
- Yang, H.; Zhang, Y.; Hu, Y.; Liu, Q.X. Android ware detection method based on permision sequentialpattern miningalgorithm. J. Commun. 2013, 34, 106–115. [Google Scholar]
- Chuangfeng, L.; Wanlung, L.; Wei, S. Android Malware Detection Algorithm Based on CNN and Naive Bayesian Method. J. Inf. Secur. Res. 2019, 5, 470–476. [Google Scholar] [CrossRef]
- Zhang, G.; Li, Y.; Bao, X.; Chakarborty, C.; Rodrigues, J.J.P.C.; Zheng, L.; Zhang, X.; Qi, L.; Khosravi, M.R. TSDroid: A Novel Android Malware Detection Framework Based on Temporal & Spatial Metrics in IoMT. ACM Trans. Sens. Netw. 2023, 19, 1–23. [Google Scholar] [CrossRef]
- Cui, Y.; Yan, B.; Hu, J. Android malware detection method based on abstract API call sequence. Comput. Appl. Softw. 2019, 36, 321–326. [Google Scholar] [CrossRef]
- Song, X.; Zhao, K.; Zhang, L.; Fang, W. Research on Android malware detection based on Random Forest theory. Inf. Netw. Secur. 2019, 19, 1–5. [Google Scholar]
- Zhang, Y.; Yin, C. Research on anomaly detection of Android malware based on characteristic frequency. J. Intell. Syst. 2018, 13, 168–173. [Google Scholar] [CrossRef]
- Yan, Z.; Zhu, B. An Android malware detection method based on improved association rule mining algorithm. Comput. Digit. Eng. 2018, 46, 1167–1172. [Google Scholar] [CrossRef]
- Wu, F.; Lu, J.; Cao, W. Multi-feature detection of malicious programs on Android platform. Micro Comput. Syst. 2018, 39, 151–155. [Google Scholar] [CrossRef]
- Su, M.Y.; Chang, J.Y.; Fung, K.T. Machine learning on merging static and dynamic features to identify malicious mobile apps. In Proceedings of the 2017 Ninth International Conference on Ubiquitous and Future Networks (ICUFN), Milan, Italy, 4–7 July 2017; IEEE: Piscataway, NJ, USA, 2017; pp. 863–867. [Google Scholar] [CrossRef]
- Androguard/Androguard—GitHub. Available online: https://github.com/androguard/androguard (accessed on 29 September 2020).
- Bernardi, M.L.; Cimitile, M.; Distante, D.; Martinelli, F.; Mercaldo, F. Dynamic malware detection and phylogeny analysis using process mining. Int. J. Inf. Secur. 2018, 18, 257–284. [Google Scholar] [CrossRef]
- Jerbi, M.; Dagdia, Z.C.; Bechikh, S.; Ben Said, L. On the use of artificial malicious patterns for android malware detection. Comput. Secur. 2020, 92, 101743. [Google Scholar] [CrossRef]
- Kumar, R.; Sethi, K.; Prajapati, N.; Rout, R.R.; Bera, P. Machine Learning based Malware Detection in Cloud Environment using Clustering Approach. In Proceedings of the 2020 11th International Conference on Computing, Communication and Networking Technologies (ICCCNT), Kharagpur, India, 1–3 July 2020. [Google Scholar] [CrossRef]
- Venkatraman, S.; Alazab, M.; Vinayakumar, R. A hybrid deep learning image-based analysis for effective malware detection. J. Inf. Secur. Appl. 2019, 47, 377–389. [Google Scholar] [CrossRef]
- Han, W.; Xue, J.; Qian, K. A Novel Malware Detection Approach Based on Behavioral Semantic Analysis and LSTM Model. In Proceedings of the 2021 IEEE 21st International Conference on Communication Technology (ICCT), Tianjin, China, 13–16 October 2021; pp. 339–343. [Google Scholar] [CrossRef]
- Zhao, C.; Zhang, W.; Fang, Y. Malwared etection based on semantic API dependency-graph. J. Sichuan Univ. (Nat. Sci. Ed.) 2020, 57, 488–494. [Google Scholar] [CrossRef]
- Hemalatha, J.; Roseline, S.A.; Geetha, S.; Kadry, S.; Damaševičius, R. An Efficient DenseNet-Based Deep Learning Model for Malware Detection. Entropy 2021, 23, 344. [Google Scholar] [CrossRef]
- Zhang, J.; Gao, C.; Gong, L.; Gu, Z.; Man, D.; Yang, W.; Li, W. Malware Detection Based on Multi-level and Dynamic Multi-feature Using Ensemble Learning at Hypervisor. Mob. Networks Appl. 2020, 26, 1668–1685. [Google Scholar] [CrossRef]
- Qiu, J.; Zhang, J.; Luo, W.; Pan, L.; Nepal, S.; Xiang, Y. A Survey of Android Malware Detection with Deep Neural Models. ACM Comput. Surv. 2020, 53, 1–36. [Google Scholar] [CrossRef]
- Al-Janabi, M.; Altamimi, A.M. A Comparative Analysis of Machine Learning Techniques for Classification and Detection of Malware. In Proceedings of the 2020 21st International Arab Conference on Information Technology (ACIT), Giza, Egypt, 28–30 November 2020. [Google Scholar] [CrossRef]
- Kimmel, J.C.; Mcdole, A.D.; Abdelsalam, M.; Gupta, M.; Sandhu, R. Recurrent Neural Networks Based Online Behavioural Malware Detection Techniques for Cloud Infrastructure. IEEE Access 2021, 9, 68066–68080. [Google Scholar] [CrossRef]
- Shar, L.K.; Demissie, B.F.; Ceccato, M.; Minn, W. Experimental comparison of features and classifiers for Android malware detection. In Proceedings of the IEEE/ACM 7th International Conference on Mobile Software Engineering and Systems, Seoul, Republic of Korea, 13–15 July 2020. [Google Scholar] [CrossRef]
- Fan, M.; Liu, J.; Wang, W.; Li, H.; Tian, Z.; Liu, T. DAPASA: Detecting Android Piggybacked Apps through Sensitive Subgraph Analysis. IEEE Trans. Inf. Forensics Secur. 2017, 12, 1772–1785. [Google Scholar] [CrossRef]
- Bhat, P.; Dutta, K. A Survey on Various Threats and Current State of Security in Android Platform. ACM Comput. Surv. 2019, 52, 1–35. [Google Scholar] [CrossRef]
- Musikawan, P.; Kongsorot, Y.; You, I.; So-In, C. An Enhanced Deep Learning Neural Network for the Detection and Identification of Android Malware. IEEE Internet Things J. 2022, 10, 8560–8577. [Google Scholar] [CrossRef]
- Hussain, T.; Sanga, A.; Mongia, S. Big Data Hadoop Tools and Technologies: A Review. In Proceedings of the International Conference on Advancements in Computing & Management (ICACM), Jaipur, India, 13–14 April 2019. [Google Scholar] [CrossRef]
- Scetbon, M.; Cuturi, M.; Peyre, G. Low-rank sinkhorn factorization. arXiv 2021, arXiv:2103.04737. [Google Scholar]
- Gou, J.; Yu, B.; Maybank, S.J.; Tao, D. Knowledge distillation: A survey. arXiv 2021, arXiv:2006.05525. [Google Scholar] [CrossRef]
- Zhao, M.; Zhong, S.; Fu, X. Deep residual shrinkage networks for fault diagnosis. IEEE Trans. Ind. Inform. 2019, 16, 4681–4690. [Google Scholar] [CrossRef]
- Apache Hadoop. Available online: https://hadoop.apache.org/ (accessed on 29 September 2020).
- HDFS: Distributed File System. Available online: https://he.utexas.edu/hdfs (accessed on 29 September 2020).
- Apache HBase—Apache HBase Home. Available online: https://hbase.apache.org/ (accessed on 29 September 2020).
- Apache Hive. Available online: https://hive.apache.org/ (accessed on 29 September 2020).
Figure 1.
Recurrent neural network malware detection model based on API call sequence.
Figure 1.
Recurrent neural network malware detection model based on API call sequence.
Figure 2.
API sequence extraction flowchart.
Figure 2.
API sequence extraction flowchart.
Figure 3.
The activity diagram of Android software API call sequence extraction.
Figure 3.
The activity diagram of Android software API call sequence extraction.
Figure 4.
Four-gram subsequence extraction.
Figure 4.
Four-gram subsequence extraction.
Figure 5.
Skip-gram model architecture.
Figure 5.
Skip-gram model architecture.
Figure 6.
The activity diagram of API call sequence vectorization method based on skip-gram model.
Figure 6.
The activity diagram of API call sequence vectorization method based on skip-gram model.
Figure 7.
Bidirectional recurrent neural network architecture.
Figure 7.
Bidirectional recurrent neural network architecture.
Figure 8.
LSTM unit structure.
Figure 8.
LSTM unit structure.
Figure 9.
LSTM forget gate processing flow.
Figure 9.
LSTM forget gate processing flow.
Figure 10.
LSTM input gate processing flow.
Figure 10.
LSTM input gate processing flow.
Figure 11.
LSTM output gate processing flow.
Figure 11.
LSTM output gate processing flow.
Figure 12.
Embedding layer coding.
Figure 12.
Embedding layer coding.
Figure 13.
The activity diagram of malware detection algorithm based on recurrent neural network.
Figure 13.
The activity diagram of malware detection algorithm based on recurrent neural network.
Figure 14.
Cloud platform-based malware detection and storage subsystem architecture diagram.
Figure 14.
Cloud platform-based malware detection and storage subsystem architecture diagram.
Figure 15.
Schematic diagram of the computing subsystem of malware detection based on cloud platform.
Figure 15.
Schematic diagram of the computing subsystem of malware detection based on cloud platform.
Figure 16.
Work flow chart of parallelization of malware detection model.
Figure 16.
Work flow chart of parallelization of malware detection model.
Figure 17.
Data flow diagram of malware detection and analysis subsystem based on cloud platform.
Figure 17.
Data flow diagram of malware detection and analysis subsystem based on cloud platform.
Figure 18.
Changes in different indicators for different window sizes and different sample set numbers.
Figure 18.
Changes in different indicators for different window sizes and different sample set numbers.
Figure 19.
Changes in different indicators for different numbers of subsequences and different sample sets.
Figure 19.
Changes in different indicators for different numbers of subsequences and different sample sets.
Figure 20.
Comparison of evaluation indicators of different detection models.
Figure 20.
Comparison of evaluation indicators of different detection models.
Table 1.
Information gain application examples.
Table 1.
Information gain application examples.
| | Normal | Malicious | Total |
|---|
| Number of samples | 5 | 10 | 15 |
| Subsequence 1 | 3 | 5 | 8 |
| Subsequence 2 | 2 | 5 | 7 |
Table 2.
Four-gram subsequence connection.
Table 2.
Four-gram subsequence connection.
| Subsequence a | Subsequence b | Result |
|---|
| | |
| | |
Table 3.
Continuous same mode API removal.
Table 3.
Continuous same mode API removal.
| Continuous Same Pattern | After Removal |
|---|
| |
| |
Table 4.
API one-hot encoding.
Table 4.
API one-hot encoding.
| API Name | Index | One-Hot Vector |
|---|
| getAllCellInfo() | 0 | [1, 0, 0, 0, 0] |
| isActiveNetworkMetered() | 1 | [0, 1, 0, 0, 0] |
| getPhoneCount() | 2 | [0, 0, 1, 0, 0] |
| getSimState() | 3 | [0, 0, 0, 1, 0] |
| dataChanged() | 4 | [0, 0, 0, 0, 1] |
Table 5.
The experimental sample data for PC machines and cloud environments.
Table 5.
The experimental sample data for PC machines and cloud environments.
| Deployment | 50 Samples | 200
Samples | 500
Samples | 1000
Samples | 2000 Samples |
|---|
| PC | 1.21 (s) | 2.34 (s) | 4.53 (s) | 9.71 (s) | 15.32 (s) |
| Cloud sys. | 0.74 (s) | 0.91 (s) | 1.12 (s) | 1.34 (s) | 1.68 (s) |
Table 6.
Evaluation indicators for different detection models.
Table 6.
Evaluation indicators for different detection models.
| Index | Mod | Mod1 | Mod2 | Mod3 |
|---|
| Accuracy | 93.68% | 88.72% | 93.53% |
| Precision | 88.64% | 91.7% | 92.66% |
| Recall | 96.53% | 97.91% | 93.00% |
| F1 | 92.42% | 94.70% | 92.83% |
| Disclaimer/Publisher’s Note: The statements, opinions and data contained in all publications are solely those of the individual author(s) and contributor(s) and not of MDPI and/or the editor(s). MDPI and/or the editor(s) disclaim responsibility for any injury to people or property resulting from any ideas, methods, instructions or products referred to in the content. |
© 2023 by the authors. Licensee MDPI, Basel, Switzerland. This article is an open access article distributed under the terms and conditions of the Creative Commons Attribution (CC BY) license (https://creativecommons.org/licenses/by/4.0/).


