Article

Strategic Electricity Production Planning of Turkey via Mixed Integer Programming Based on Time Series Forecasting

by
Gökay Yörük
1,
Ugur Bac
2,
Fatma Yerlikaya-Özkurt
2 and
Kamil Demirberk Ünlü
2,*
1
Graduate School of Natural and Applied Sciences, Atilim University, 06830 Ankara, Turkey
2
Department of Industrial Engineering, Atilim University, 06830 Ankara, Turkey
*
Author to whom correspondence should be addressed.
Mathematics 2023, 11(8), 1865; https://doi.org/10.3390/math11081865
Submission received: 14 February 2023 / Revised: 7 April 2023 / Accepted: 12 April 2023 / Published: 14 April 2023

Abstract

:
This study examines Turkey’s energy planning in terms of strategic planning, energy policy, electricity production planning, technology selection, and environmental policies. A mixed integer optimization model is proposed for strategic electricity planning in Turkey. A set of energy resources is considered simultaneously in this research, and in addition to cost minimization, different strategic level policies, such as CO2 emission reduction policies, energy resource import/export restriction policies, and renewable energy promotion policies, are also considered. To forecast electricity demand over the planning horizon, a variety of forecasting techniques, including regression methods, exponential smoothing, Winter’s method, and Autoregressive Integrated Moving Average methods, are used, and the best method is chosen using various error measures. The optimization model constructed for Turkey’s Strategic Electricity Planning is obtained for two different planning intervals. The findings indicate that the use of renewable energy generation options, such as solar, wind, and hydroelectric alternatives, will increase significantly, while the use of fossil fuels in energy generation will decrease sharply. The findings of this study suggest a gradual increase in investments in renewable energy-based electricity production strategies are required to eventually replace fossil fuel alternatives. This change not only reduces investment, operation, and maintenance costs, but also reduces emissions in the long term.

1. Introduction

Strategic energy planning is the process of coming up with long-term energy policies that will affect the future of energy systems in a region or the whole country. Due to globalization, fast population growth, and countries’ efforts to become more industrialized, the demand for energy and natural resources has grown a lot. The demand for energy services is expected to grow by 1.3% per year until the year 2040 [1]. The main sources of energy are hydraulic, nuclear power, and thermal. Renewable energy sources can also be thought of as alternatives to traditional energy sources, such as wind, sunlight, geothermal heat, waterpower, and biomass [2].
A lot of greenhouse gases are made by the main energy sources, which causes global warming. On the other hand, the main problems with using renewable energy resources are the high initial investment costs, the unknown operational risks, and the need to choose different locations for facilities [2]. Due to these problems, energy resources are not used as well as they could be, thus, optimal planning is very important and can help ensure sustainability and protect the natural balance.
In this study, a strategic level energy planning model is proposed for Turkey. This model can be used to figure out different ways to produce electricity during the planning horizon, considering strategic goals, resource limits, available demand, emission goals and limits, and other factors. To forecast electricity demand over the planning horizon, a variety of forecasting techniques, including regression methods, exponential smoothing, Winter’s method, and Autoregressive Integrated Moving Average (ARIMA) methods, are used, and the best method is chosen using various error measures. Thus, this ensures that the information needed in optimization modeling is accurately predicted.
In the proposed optimization model different types of alternative energy sources are considered, such as fossil, renewable, and nuclear. The cost to build, run, maintain, and fuel each type of power plant is different. The levelized cost concept is used so that all costs can be measured in the same way. This concept is defined as “the average cost over the lifetime of the electricity generation plan per MWh of electricity generated” [3]. Optimization methods are needed to choose the best portfolio of ways to produce electricity that minimizes costs while meeting operational constraints and long-term goals. Mathematical modeling is used to find the best way to reduce the total levelized cost of all power plants that are running during the planning period.
All possible energy resources, such as fossil fuels, renewable energy resources, nuclear energy, and so on, are considered in the production of electricity. As a result, in terms of “classifying energy problems based on energy type,” our problem is an electricity planning problem. Furthermore, we consider energy resources, such as solid fuels, oil/gas, renewable energy sources, and nuclear energy sources. The research is a general energy planning problem in this regard. The research problem includes a set of alternative energy policies, such as reducing CO2 emissions, using fewer fossil fuels in electricity generation, and utilizing more renewable energy resources. In terms of application, it falls into the category of “energy policy analysis.” In addition, the proposed model performs strategic level energy planning over the planning horizon while meeting annual total electricity demand throughout the year. In this regard, the problem in this study can also be considered as an “Energy Power Planning” issue.
In the rest of this study, Section 2 gives a detailed review of the related literature. Section 3 goes over the methods used to figure out how much electricity costs and how much energy it uses, and the prices and methods used to predict how much electricity will be used. In Section 4, the results are analyzed based on a real-world application. Finally, in Section 5, the study is summed up and future research ideas are given.

2. Literature Review

Multiple objectives are handled concurrently in energy planning issues, making it a strong application area for operations research. As a result, the number of studies in energy planning is expanding in the literature [4]. In the literature, problems, such as energy efficiency improvement, energy decision-making, energy investment and planning, energy plant selection, selection of the most suitable energy alternative, energy resource sharing, and energy source reliability, are studied in terms of energy optimization applications [4]. Several researchers focus on decision-making challenges in the literature. The most commonly used multi-criteria approaches in the literature are the Analytic Hierarchy Process (AHP), Preference Ranking Organization Method for Enrichment Evaluation (PROMETHEE), Elimination and Choice Translating Reality (ELECTRE), and Technique for Order of Preference by Similarity to Ideal Solution (TOPSIS) methods [5,6,7,8,9,10,11,12,13].
Since most energy resources are used in response to climatic circumstances, optimization approaches are necessary for the design, planning, and control phases of energy management. Challenges in the energy sector are complicated, unclear, and involve several associated parties. As a result, the choices are constrained by many restrictions. As there are so many choice factors and parameters, they are technically complicated to solve. It is seen that a variety of studies are available in the literature [14,15,16,17,18,19,20,21,22,23,24,25,26,27,28].
Moreover, there are several evaluations on energy planning issues. These works examine and categorize the literature on energy planning and suggest some future research areas. For example, ref. [29] examined energy supply models to assess investment options and expansions. It was assumed that demand quantities and input costs were known, and the model determined the investment choice with the lowest cost over time. Energy type (fossil, nuclear, single hydro, or hydro), energy transport options, investment, and replacement schedules, and optimal mode of system operation are all factors to consider. Ref. [30] examined African countries’ electrical planning studies that used both qualitative and quantitative methodologies. Ref. [31] studied Turkey’s generation plans up to 2023 and assessed the viability of the 2023 Vision. The capacity objectives were examined, and projections were made using a semi-empirical electrical demand model. Other recent studies on Turkish electricity markets are [32,33,34].
On the other hand, there are also many studies conducted on electricity demand forecasting. Indeed, electricity demand forecasting is classified into three categories: short-term, mid-term, and long-term forecasting. Short-term predictions range from one hour to one week, mid-term forecasts range from one week to a year, and long-term forecasts span more than a year [35,36]. Demand forecasting is a prominent study topic since it occurs in practically every system that involves production and customers. In the literature, several techniques and models have been established for electricity demand forecasting, such as Holte Winters exponential smoothing approach, multivariate adaptive regression splines, ARIMA, and support vector regression [37,38,39,40,41,42,43]. Another classification of demand forecasting is based on the degree of mathematical analysis involved in the forecasting process. These approaches are classified as quantitative and qualitative. Qualitative approaches include the Delphi method and curve fitting. Regression, machine learning by [44], smoothing approaches by [45], deep learning by [46,47], and the Box-Jenkins methodology by [48], on the other hand, are examples of quantitative methods.
To summarize, electricity planning is a prominent research field in the literature, and several works examine various elements of energy planning. Our study varies from the previous research for many reasons. First, we address the energy planning problem for Turkey over several time horizons. Some investigations have been undertaken in Turkey, such as [49,50]. These studies also look at energy planning in Turkey, but only in the past, therefore they do not address the present situation.
Furthermore, we evaluate the government’s most recent strategic aims under current strategic plans in our research. As a result, we throw light on the near future. This analysis takes into consideration not just Turkey’s present installed energy capacity, but also projected energy investments and closures. In other words, in addition to present capacity, prospective power plants must be opened or shuttered within the timeframes specified. First, demand is forecasted for several planning horizons (e.g., 10 and 20 years) utilizing a set of forecasting approaches in this work. The best forecasting technique is chosen using several error measurements, and the prediction provided by the chosen approach is incorporated into the mathematical model.

3. Methodology

Framework developed for the strategic planning of electricity production in Turkey is summarized as shown in Figure 1. Forecasted data is the main requirement of strategic plans. To generate this data there are different time series forecasting methods available in the literature. All of these methods require past-time data to be used in the forecasting of the future. Our framework begins with the gathering of the energy demands in the past and these data were used to evaluate different time series forecasting methods under different performance metrics, as explained in Section 4. Following the evaluation phase, the selected forecasting method is used to forecast energy demand in the years 2021–2040 and this data is used in the mixed integer programming model formulated to plan the number and capacities of energy plants according to their types. Different types of time series forecasting methodologies have been utilized and the one which has the best performance metrics is used to get the future demand of electricity loads. The forecasted electricity loads are used as the input of the model. The formulated mathematical model has been coded in General Algebraic Modeling System (GAMS) software which includes built-in solvers to find the optimal solution for different types of mathematical models. Runs are made in GAMS for two different time intervals and three additional scenarios.

3.1. Time Series Forecasting

Determining the most appropriate energy resources to satisfy the yearly energy demand requires consideration of alternative electricity generation options, such as fossil fuels, renewable energy, and nuclear energy, and selecting a subset of these energy generation technologies while taking government strategic goals and environmental issues into account. To assist this goal a methodology is developed to forecast yearly energy demands and by using these demand forecasts a mathematical optimization model is formulated to select the most appropriate energy resources to satisfy these demands. The developed methodology is applied to the Turkey case to identify investment decisions for the next twenty years. To accomplish this goal, demand data for Turkey from 1981 to 2020 is used to forecast demand between 2021 and 2040. The steps described by [51] were followed to determine the best forecasting model that fits the demand data.
Quantitative forecasting methods are used in this study to generate long-term forecasts of electricity demand. Regression Analysis (linear/exponential/beta growth and first, second, and third order polynomial equations), Double Exponential Smoothing, Winters’ Method (linear, additive, and multiplicative models), and ARIMA for different autoregressive, differencing, and moving average parameters are among the forecasting methods considered. Regression analysis is a set of statistical methods for estimating the relationships between one or more independent variables and a dependent variable. The least squares method is used to approximate the model parameters, resulting in an improved model. For parameter estimation, the method minimizes the sum of squares.
Y t = β 0 + β 1 t + e t ,
where t is the time, β 0 is the constant, β 1 is the average difference from one period to the next, and e t is the error term. The regression model can be linear or nonlinear and different mathematical models can be used for modeling the input data, such as linear growth, exponential growth, beta growth, the polynomial of the first order, second order, third order, etc. In this study, different regression types are used for finding the best regression model that fits the demand data and third order polynomial model produced the best fits.
Double exponential smoothing uses a level and a trend component at each period. This method has two smoothing weights for updating the components in each period. Winters’ Method smooths the data and provides forecasts for the short to medium term using Holt–Winters’ exponential smoothing. When both seasonality and trend are present, this procedure can be beneficial. These two components can have a linear, multiplicative, or additive relationship. Winters’ Method generates dynamic estimates for three variables: level, trend, and seasonal. When there is no seasonality in the data, the linear model is used, and this method is known as the Holt–Winters nonseasonal algorithm. When the seasonal pattern in the data does not change with the data size, an additive model is used. When seasonal patterns in data depend on data size, a multiplicative model is used. ARIMA model is a modified traditional technique that is used for modeling time series [40,41,51]. In this research, the forecasting accuracy measures are calculated for the comparison of different forecasting methods. Scale dependent measures are used commonly whose scale depends on the scale of the data. Root mean square errors (RMSE) and mean absolute errors (MAE) are the most commonly used scale dependent measures while percentage errors are scale independent, they are frequently used to compare forecasting performance across different data sets. Mean absolute percentage error (MAPE) and coefficient of determination score (R2) are the most commonly used percentage error measures [51].

3.2. Optimization Model

In this section, the assumptions, sets and indices, parameters, decision variables, and mathematical model are presented.

3.2.1. Assumptions

  • Even if construction is completed within the previous year, the new power plants are expected to be operational at the beginning of the following year;
  • The availability factor determines the maximum working hours of power plants while taking maintenance and other resource requirements into account. Unplanned interruptions and plant failures are considered at the operational level;
  • Due to the closing dates of the power plants are unknown due to the government’s information privacy policy, it is assumed that the existing facilities will be operational without interruption until the end of the planning period;
  • Future costs are calculated using average escalation rates that are determined for each cost component, and future cash flows are calculated using an average interest rate;
  • There is no significant variation or dramatic change in economic indicators and demand patterns, and they continue to follow the long-term trend;
  • The potential energy resources in Turkey will not change significantly over the planning horizon;
  • Power plant basic data, efficiency, initial investment costs, and CO2 emissions are assumed to be constant over time.

3.2.2. Set, Indices, Parameters, and Decision Variables

The set of indices used in the mathematical model is as follows:
I:Set of energy resources used for electricity production, indexed by i;
I = {lignite, hard coal, imported coal, natural gas, uranium};
J:Set of electrical generation power plant types, indexed by j;
J = {Fluized Lignite, Elbistan Lignite, Hard Coal, Imported Coal, Natural Gas, Nuclear, Hydroelectric, Wind, solar, Geothermal};
K:Set of power plant categories indexed by k;
K = {Renewables (R), Fossil Fuels (F), Nuclear (N)};
Jk:Set of power plants that are in resource category k;
JR = {Hydroelectric, Wind, Solar, Geothermal};
JF = {Fluized Lignite, Elbistan Lignite, Hard Coal, Imported Coal, Natural Gas};
JN = {Nuclear};
T:Set of years considered in the planning period, indexed by t;
t = {2021,2023, …,T}.
The parameters of the model are:
Cj,tinv:Capital investment cost of type j power plant at year t ($);
Cj,tOM:Operation and maintenance cost of type j plant at year t;
Cj,tfuel:Fuel cost of type j power plan at year t ($);
Ej,t:Total energy generation of type j power plant at year t (MWh);
Tj:The operational lifetime of type j power plant (year);
Tjconst:Construction time of type j power plant (year);
ICapj:Installed capacity of type j power plant (MW);
β j :Availability percentage of type j power plant (%);
β j h o u r : Availability factor of type j power plant (h/year);
LCj:Levelized cost of type j power plant ($/MWh);
Ctimp:Unit import cost in year t ($/MWh);
Ctexp:Export revenue in year t ($/MWh);
explimit:Annual export limit (MWh);
implimit:Annual import limit (MWh);
AVLj:Number of type j power plants that are operational before the planning horizon;
PLNjt:Number of type j power plants that are already planned to be opened before the planning horizon at year t
Dt:Electric Demand in Year t (MWh);
NJRopr:Maximum number of renewable power plants that can be in operation in a year (calculated based on resource potential);
H t n u m :Maximum number of hydroelectric power plants that can be opened in year t (calculated based on construction capacity in Turkey);
ε j : The CO2 emission factor of type j power plant (ton/MWh);
ε t l i m i t : Emission limit of CO2 in year t (ton);
Yt:Percentage of renewable power plant capacity in year t (%);
M:A sufficiently large number;
r:Interest rate (%);
ef:Escalation rate for fuel type f (%);
e O M : Escalation rate for operation and maintenance costs (%).
The escalation rate is the price increase for goods and services caused by a variety of factors, such as inflation, supply, and demand, engineering changes, or other similar causes. Using historical data, average escalation rates for fuel types, and operation and maintenance costs are estimated. Lastly, the decision variables are as follows:
xjt:Number of type j power plants opened in year t;
wjt:Number of type j power plants closed in year t;
Njt:Total number of type j power plants in year t;
vj:Binary variable, 1 if the capacity of type j power plants is increased, 0 otherwise;
yjt:The energy supply of type j power plant in year t (MWh);
expt:Electric energy exported in year t (MWh);
impt:Electric energy imported in year t (MWh);
z:Total levelized cost of power plants.

3.2.3. Mathematical Model

A mathematical optimization model is required to decide on the optimal combination of different power plants and capacities required from each type. For this purpose, a linear mixed integer programming model is formulated. As with all linear programming models, real-life objectives and constraints are represented as mathematical equations in the proposed model. Each equation formulated for this purpose is explained in detail below.
The objective function of the model seeks to minimize the total cost, which has three sub goals. The first one is to minimize the levelized cost of power plants operating within the planning horizon. The levelized cost is the average cost per MWh of electricity generated over the life of a power plant. The lifetime cost of a power plant is expressed in terms of generation cost in $/MWh. Investment costs, operation, and maintenance costs, and fuel costs are all included in the levelized cost. The second part of the objective function minimizes the total energy import costs, and finally, the last part of the objective function maximizes the total energy export revenues.
M i n i m i z e   z = t ϵ T j ϵ J β j h o u r I C a p j N j t L C j + t ϵ T C t i m p i m p t t ϵ T C t e x p e x p t
L C j = T o t a l   C a p i t a l   a n d   O p e r a t i o n   C o s t s   o f   P o w e r   P l a n t   j   D u r i n g   L i f e t i m e N e t   E l e c t r i c i t y   G e n e r a t i o n   o f   P o w e r   P l a n t   j   D u r i n g   L i f e t i m e
L C j = C j , 0 i n v + t = 1 T j C j t i n v + C j t O M + C j t f u e l / ( 1 + r ) t t = 1 T j E j t
E j t = β j h o u r ( I C a p j )
C j t O M = C j 0 O M ( 1 + e O M ) t
C j t f u e l = C j 0 f u e l ( 1 + e f ) t
Constraints (3) and (4) are the flow balance constraints, and they ensure that the sum of already existing type j power plants in year t before the planning period, type j power plants that have already planned to be opened or closed in year t, and new type j power plants opened or closed in year t equals to the total number of type j power plants in year t. Constraint (4) ensures that the number of type j power plants from the previous period (t − 1) is updated accordingly in the following years.
A V L j + P L N j t + x j t w j t = N j t     f o r   j J   a n d   t = 2021
N j , t 1 + P L N j t + x j t w j t = N j t   f o r   j J   a n d   t > 2021
Constraints (5) and (6) control the opening and closing decisions for power plants. A power plant type can be either opened or closed within the planning horizon in a given year, but not both.
x j t M     v j     f o r     j J     a n d     t T
w j t M     ( 1 v j )     f o r     j J     a n d     t T
Constraint (7) prevents a power plant from being operational before the construction time at the start of the planning horizon. For example, because nuclear power plants take seven years to build, it is not possible to open one during the first seven years of the planning horizon.
x j t = 0     f o r     j J     a n d     t T j c o n s t
Constraint (8) confirms that the total electricity generation capacity of type j power plants cannot exceed the total installed electricity generation capacity of type j power plants in any year during the planning horizon. The availability factor of a type j power plant, the installed capacity of a unit type j power plant, and the number of type j power plants in operation in year t are multiplied to calculate the electricity generation capacity of a type j power plant in year t.
y j t β j h o u r I C a p j N j t     f o r     j J     a n d     t T
The total electrical energy generated by power plants plus total imports minus total exports should be greater than or equal to the forecasted demand at year t. This constraint is formulized as follows:
j J y j t + i m p t e x p t D t     f o r     t T
Constraints (10) and (11) confirm that total exports and imports in year t cannot exceed total export and import limits. The capacity of the transmission lines, which connect the importing and exporting countries, determines export and import limits. There are independent transmission lines between the countries in each direction (export and import), thus we have different limits for exports and imports.
e x p t e x p l i m i t     f o r     t T
i m p t i m p l i m i t     f o r     t T
Renewable power plants should at least generate a certain percentage of the total installed capacity. This percentage is determined by the government and stated in the government’s strategic goals.
j J r I C a p j N j t γ t j J I C a p j N j t     f o r     t T
Constraint (13) confirms that power plants’ total CO2 emissions should be less than or equal to the CO2 emission limit. CO2 emissions are proportional to the amount of electricity generated by power plants.
j J ε j y j t ε t l i m i t     f o r     t T
Constraint (14) ensures that nuclear power plants are not closed due to the government’s strategic goals.
v N u c l e a r P P = 1
Due to construction capacity, Constraint (15) limits the number of hydroelectric power plants built each year.
x H y d r o e l e c t r i c P P , t H t n u m     f o r     t T
Constraint (16) ensures that the total number of type j renewable energy plants does not exceed renewable capacity. Potentials for each type of renewable energy plant are defined for each country. For example, in the case of solar energy, the potential is determined by the angle of solar radiation, total sunbathing time, the total area suitable for solar farms, and so on. Wind power plant potentials are determined by wind speed, duration, and the total area reserved for wind farms. The flow rates of the rivers, available areas for power plants, and construction time and capacity limitations are all considered when determining hydroelectric potential. The potential of geothermal energy is determined by the amount of thermal water and its temperature.
N j t N j o p r     f o r     j J R     a n d     t T
Finally, the sign restrictions of the model are as follows:
x j t , w j t ,     a n d     N j t 0     a n d     i n t e g e r j J     a n d     t T v j 0,1 j J y j t , e x p t ,     a n d     i m p t 0 j J     a n d     t T

4. Time Series Analysis and Application of the Model

4.1. Time Series Analysis

For Turkey, demand data from 1981 to 2020 are used to forecast demand for the years 2021–2030 and 2021–2040 [52], respectively. As a result, 40 observations are gathered. The obtained data shows an increase over the years. First, the data is represented graphically to determine whether or not it is stationary. Several tests and analyses, including the Augmented Dickey–Fuller Test (ADF) based on the unit root process, were used to analyze the demand data. At a 5% significance level, the unit root test implies nonstationary. As [51] suggests we differentiate the time series and this time we reject the null hypothesis of ADF. Thus, the time series investigated is integrated as order 1 (I(1)). The first difference in the time series is used for the ARIMA model in this study.
The demand data from 1980 to 2020 is used to forecast demand between 2021–2030 and 2021–2040. First, various regression methods are used, including beta growth, exponential growth, and first, second, and third order polynomial equations. The third-order regression model produced the best fit of these methods. Different ARIMA models, on the other hand, are considered, and the best model is found to be ARIMA (2,1,2), which produces the best fit. Furthermore, double exponential smoothing, and Holt-additive, Winter’s multiplicative, and linear models, are considered. Table 1 compares selected forecasting methods in terms of different performance measures. When the performance results of all statistical models in this table are examined, it is seen that especially R2 and MAPE values show very good performance results. Since these selected models produce extremely good and sufficient results for the given data, the statistical modeling approach is preferred instead of learning-based models.
Based on these analyses, the ARIMA (2,1,2) model outperformed the other forecasting methods across all performance metrics. As a result, the ARIMA (2,1,2) model can be used to forecast electricity demand in Turkey. Hence, ARIMA forecast results are used in our mathematical model.

4.2. Application of the Mathematical Model

In this section, we will look at Turkey’s strategic energy production planning problem and apply the mathematical model defined in Section 3. The parameters’ values are gathered from a variety of sources, including Turkey Electricity Transmission Company (TEA), the International Energy Agency (IEA), the Turkish Statistical Institute, and others.
The proposed model is studied in terms of constraints and goal function during model verification. The model is shown to perform correctly, and all imposed conditions are met as expected. The validation stage confirms that the mathematical model’s outputs are appropriate when compared to real-world strategies and goals. The suggested model estimates power plant types and total installed capacities based on operational limitations and strategic goals. The model’s outputs meet the strategic goals set by institutions, such as Energy Market Regulatory Authority’s (EMRA), strategic plans. As a result, we find that the suggested model accurately captures the real system. The model is solved with GAMS optimization software for two distinct periods, namely 2021–2030 and 2021–2040.
The number of power plants in operation between 2020 and 2030 is shown in Table 2. In general, the number of fossil power plants is decreasing while the number of renewable power plants is increasing. Specifically, the coal power plants (Elbistan lignite, fluidized lignite, hard coal, and imported coal) are scheduled to close within the next ten years. Natural gas power plants, another type of fossil fuel power plant, are reduced in numbers (from 37 to 11), but not completely closed. On the other hand, the number of renewable options, such as wind, solar, and hydroelectric power plants is increasing. Geothermal power plants, the other renewable option, are scheduled to close within the planning horizon. Finally, in 2024, five preplanned nuclear power plant modules are put into service and used within the planning interval. In general, due to strategic goals, such as renewable share constraints and emission limits, the renewable share is increasing.
The total installed capacity of power plants follows a similar pattern to the number of power plants. Table 3 shows that the shares of wind, solar, hydroelectric, and nuclear power plants are increasing while the share of other power plants is decreasing. Along with strategic goals, the total share of fossil fueled power plants decreases significantly.
During the planning horizon, the total supply of natural gas decreases significantly. Wind and solar, on the other hand, are becoming increasingly important. In addition, the hydroelectric contribution increases marginally. Finally, nuclear will make a consistent contribution beginning in 2024. Wind, hydroelectric, solar, natural gas, and nuclear power plant options are listed in decreasing order of contribution in 2030.
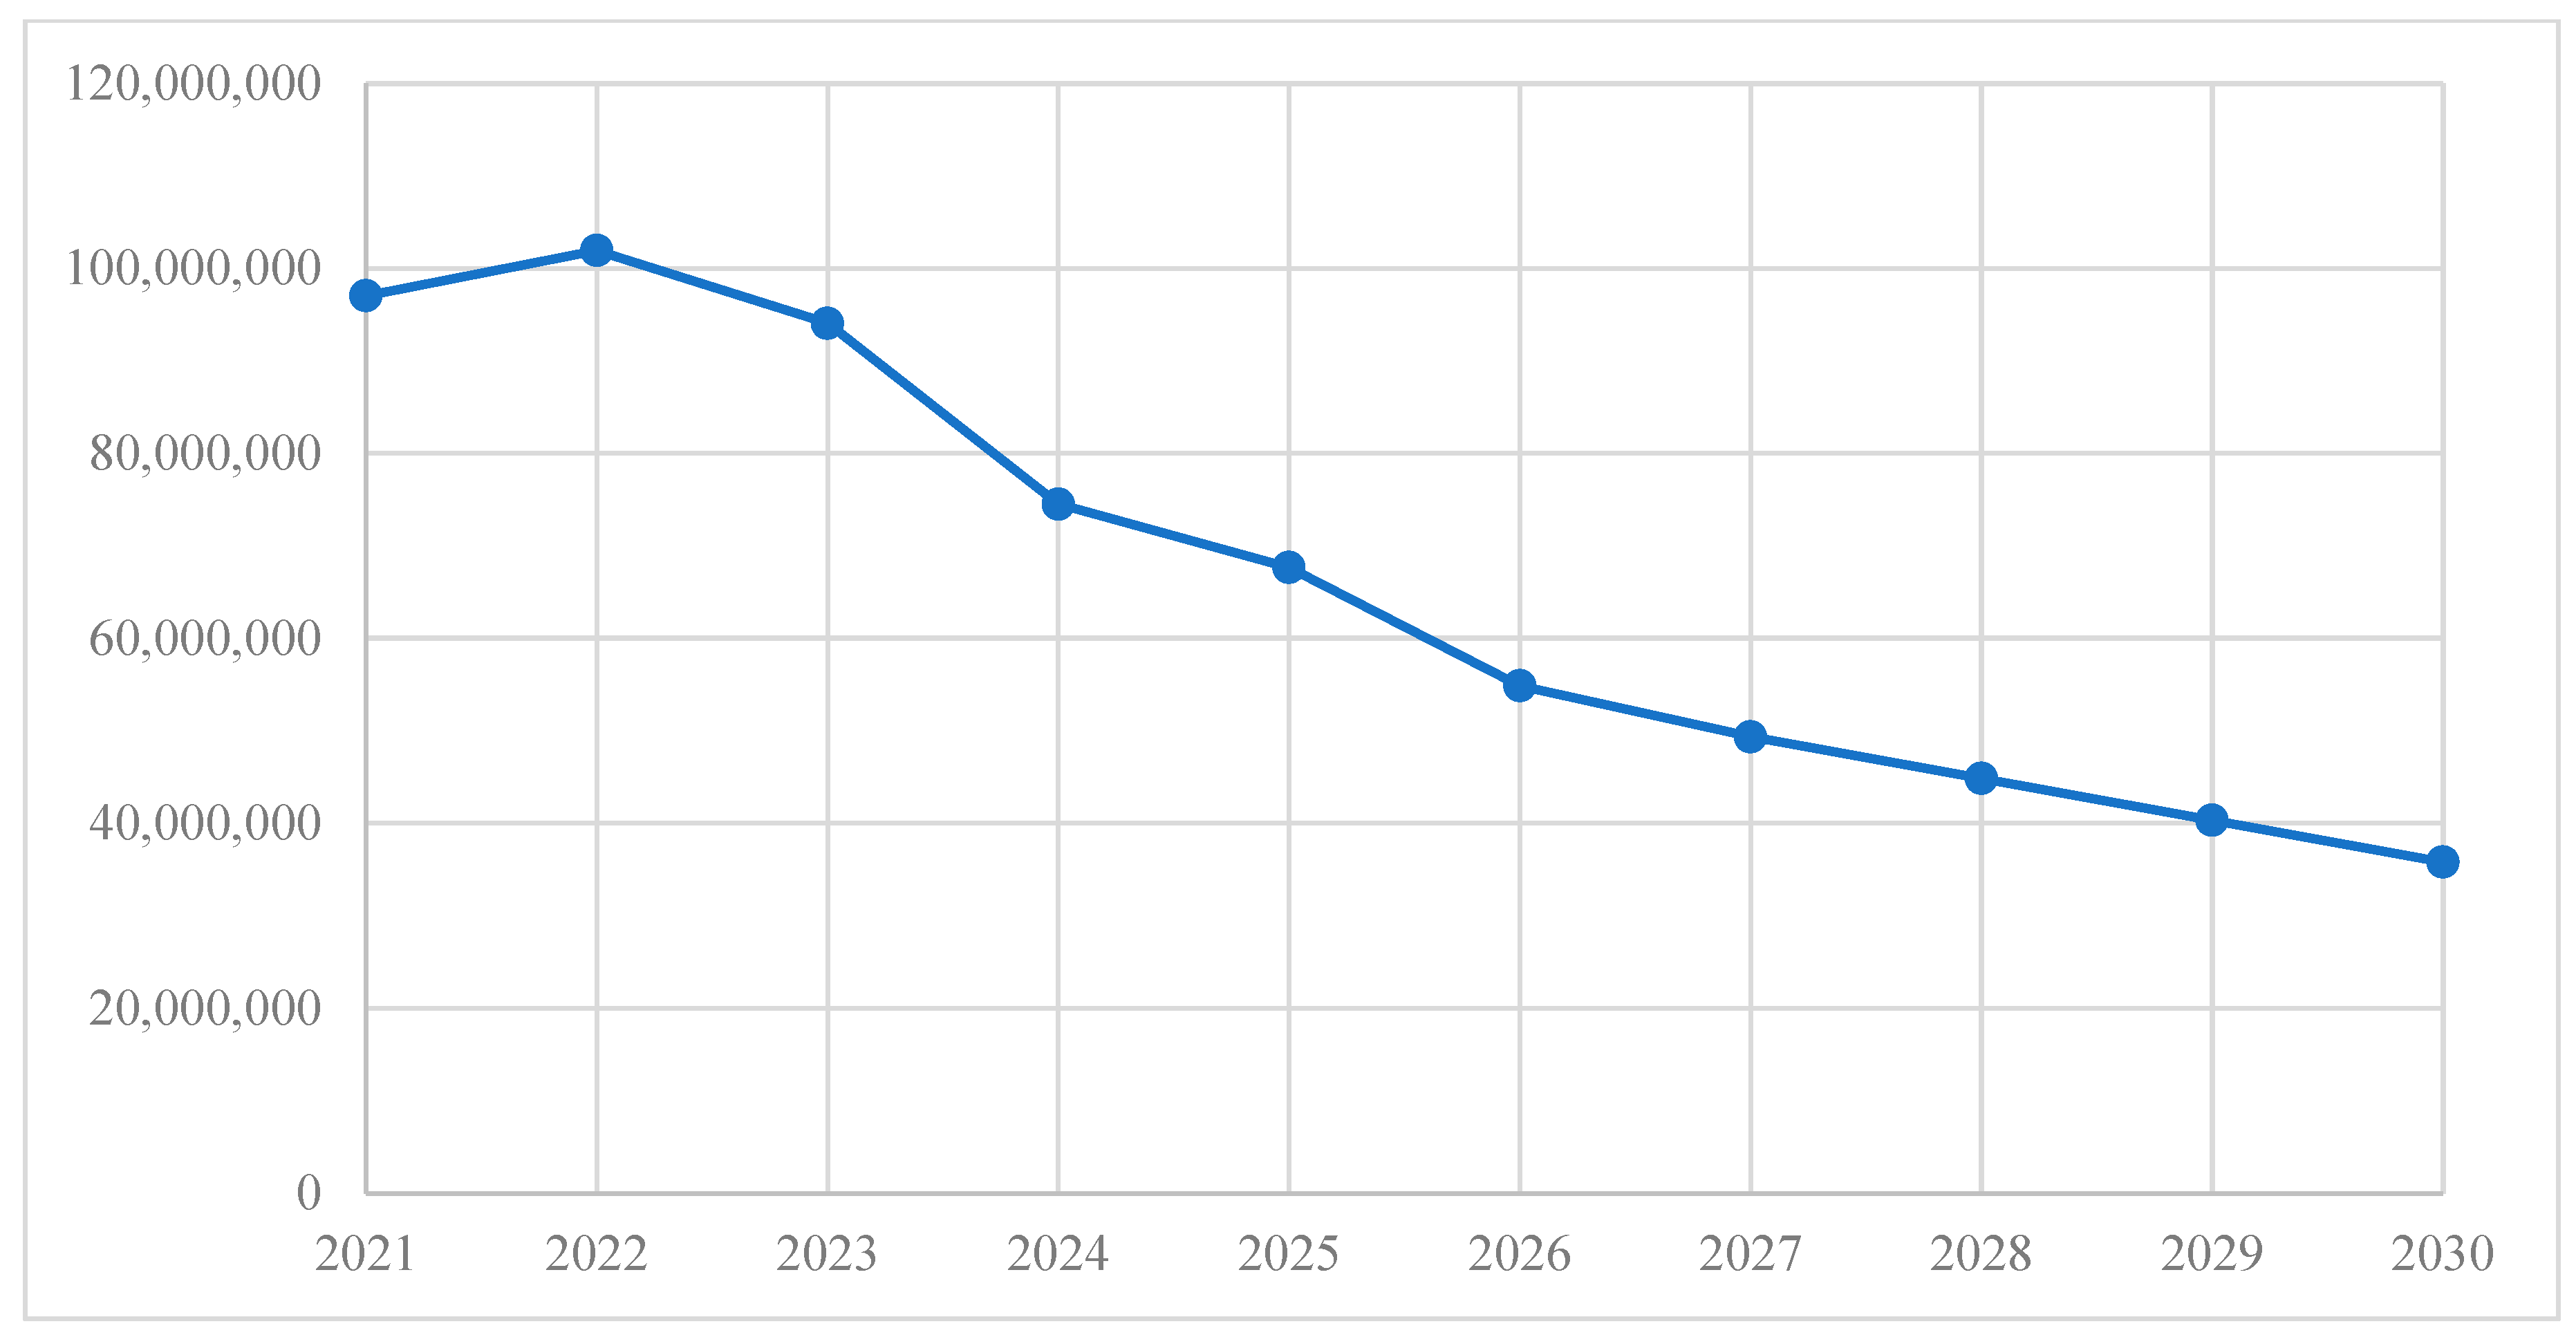
Finally, Figure 2 depicts the total emissions from all power plants. As can be seen, emissions decrease over the planning horizon after a slight increase. This is because the contribution of renewable resources is increasing while the contribution of fossil fuels is decreasing. As a result, emissions decrease over time in tandem with the strategic goals.
Table 4 displays the number of power plants that will be operational between 2020 and 2040. In general, the number of fossil power plants is decreasing, while the number of renewable power plants is increasing. Specifically, coal power plants (Elbistan lignite, fluidized lignite, hard coal, and imported coal) and natural gas power plants are scheduled to close within the next 20 years. On the other hand, the number of renewable options, such as wind, solar, and hydroelectric power plants, is increasing. Geothermal power plants, the other renewable option, are scheduled to close within the planning horizon. Additionally, between 2024 and 2032, five preplanned nuclear power plant modules are put into service and used within the planning interval. In general, due to strategic goals, such as renewable share constraints and emission limits, the renewable share is increasing.
The total installed capacity of power plants follows a similar pattern to the number of power plants. Table 5 shows that the shares of wind, solar, hydroelectric, and nuclear power plants are increasing, while the share of other power plants is dropping. Along with strategic goals, the total share of fossil fuel power plants drop dramatically.
During the planning horizon, the overall supply of natural gas and other coal power plants is reduced to zero. Wind, solar, and hydroelectric solutions, on the other hand, contribute much more. Finally, as additional power plants are built, nuclear will make a consistent contribution from 2024 to 2032 and from 2032 to 2040. Solar, hydroelectric, wind, and nuclear power plant choices are listed in decreasing order of contribution in 2040.
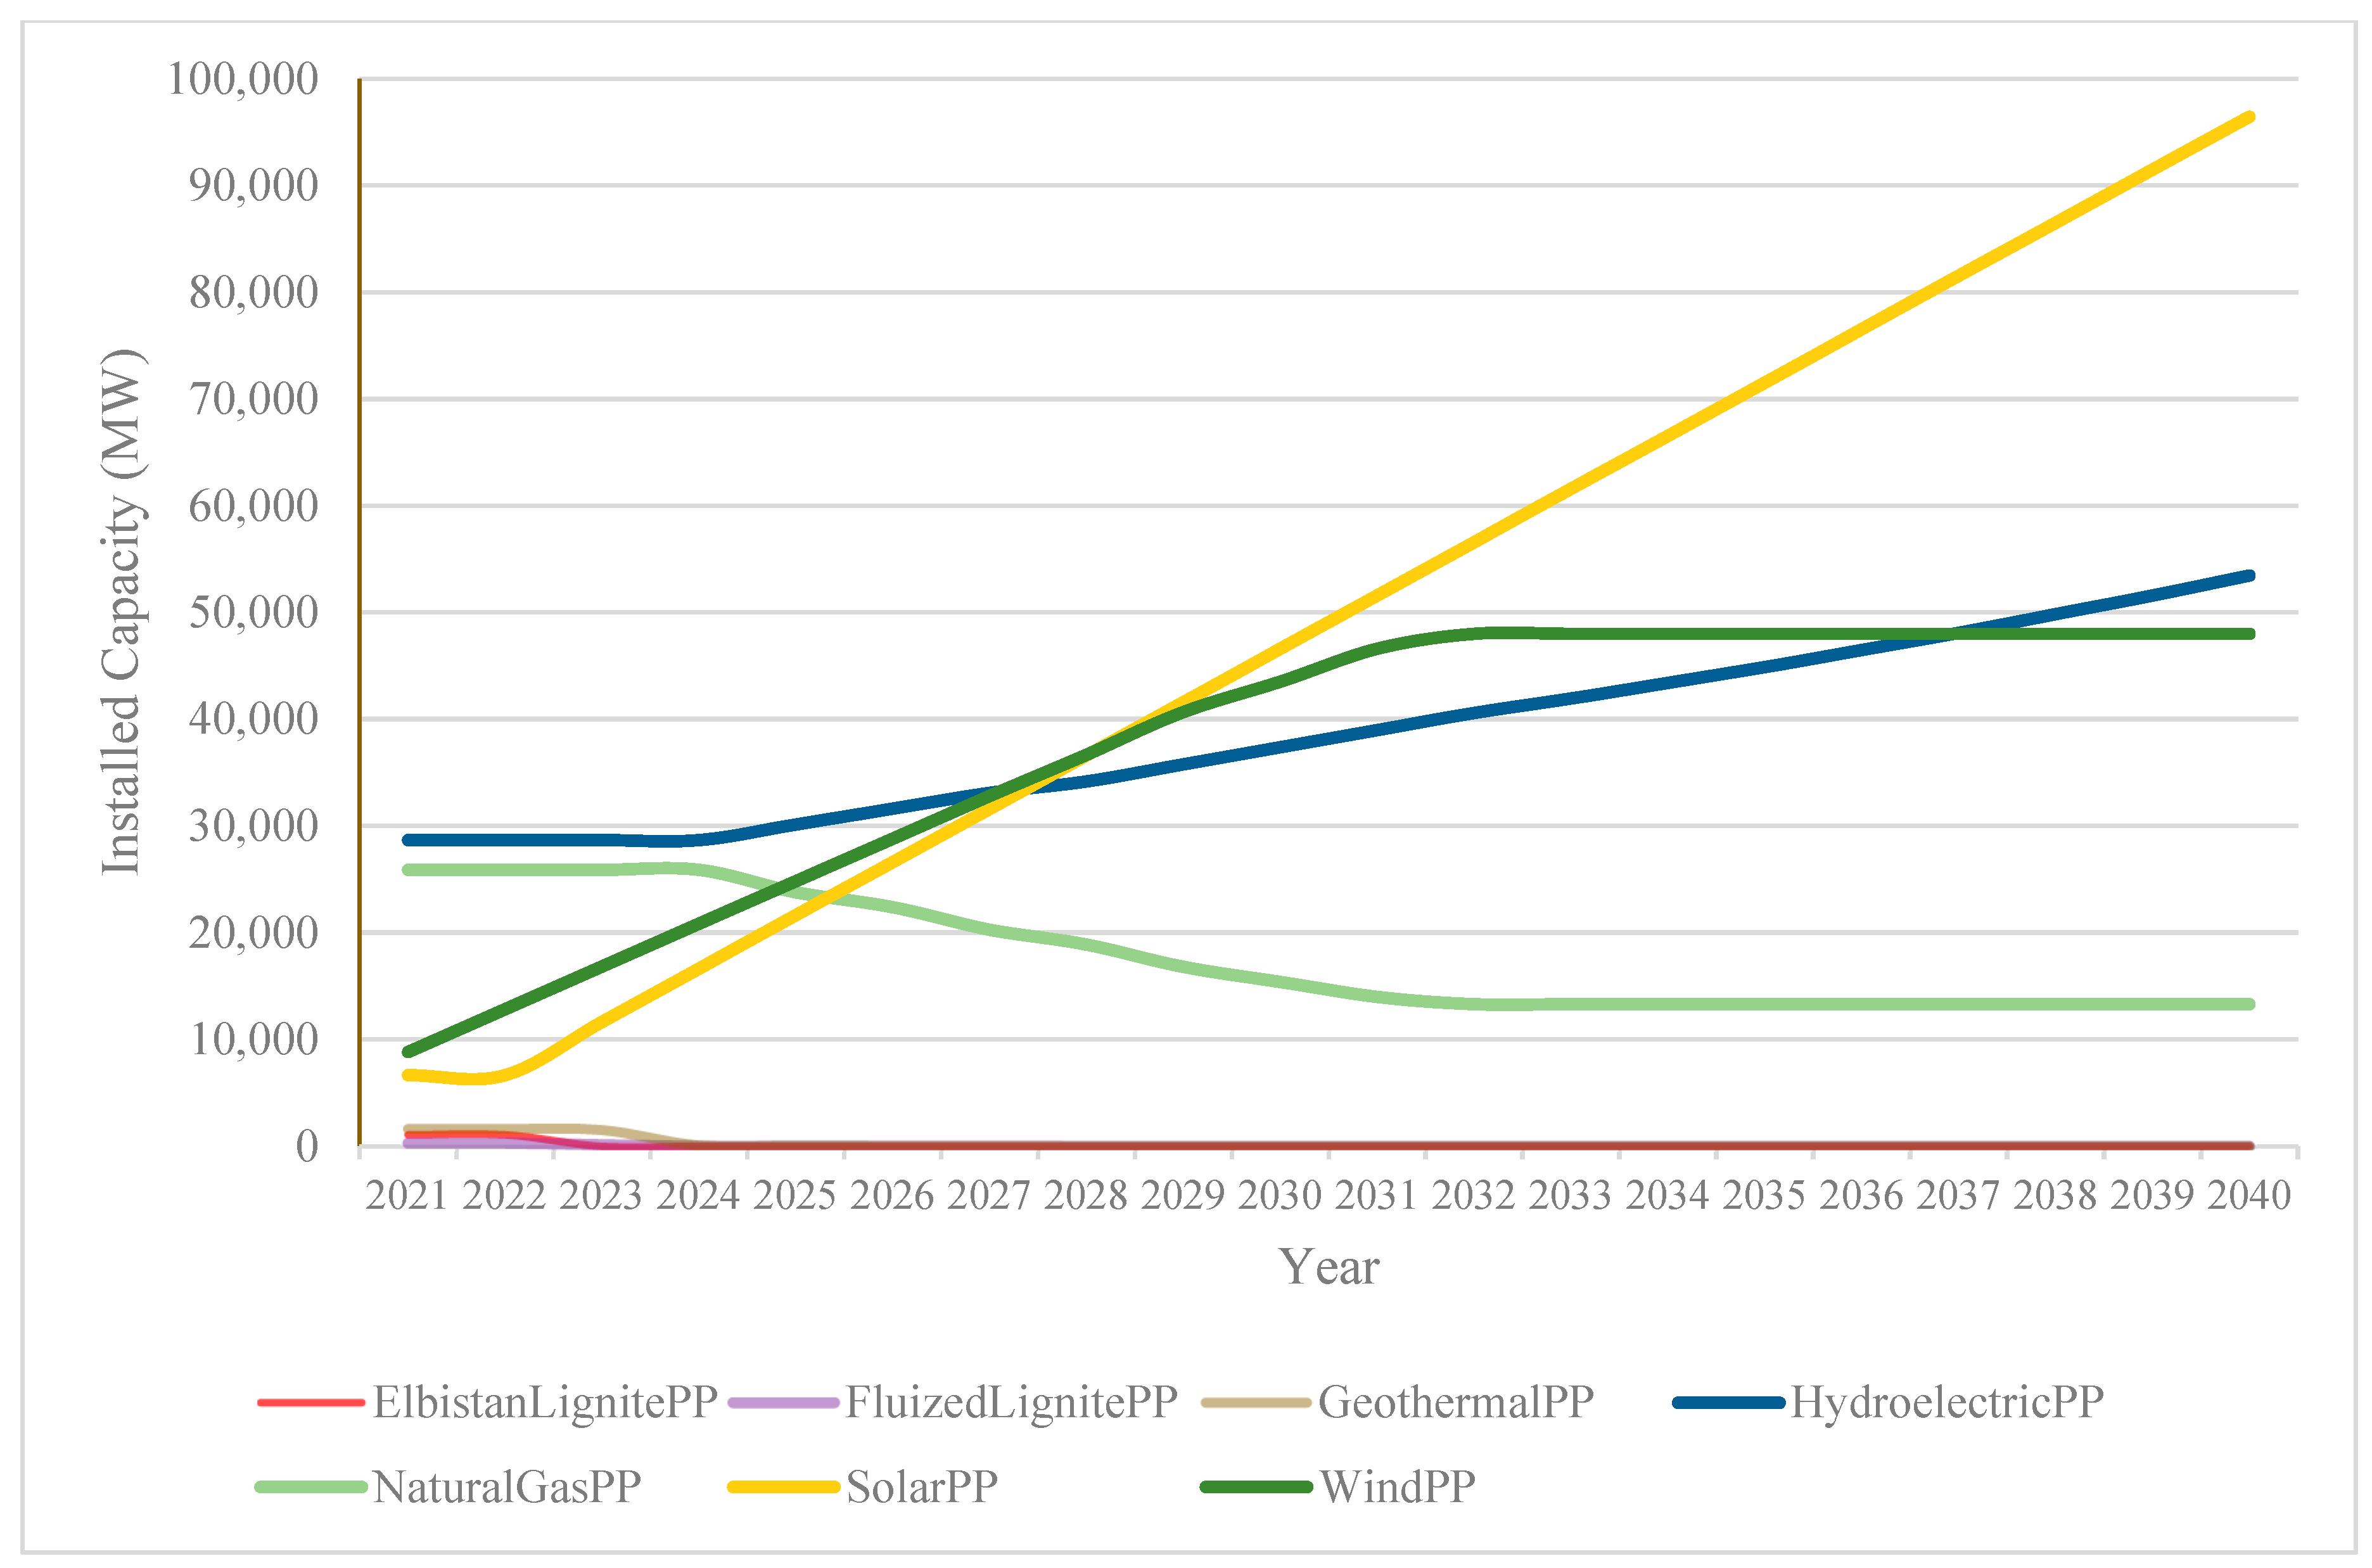
Figure 3 shows the total emissions from all power stations. As can be observed, emissions drop across the planning horizon following a minor increase caused by increased demand. This is because the contribution of renewable resources is increasing while the contribution of fossil fuels is declining. As a result, emissions decrease over time in tandem with the strategic goals.
As the last step in the mathematical model sensitivity analysis and validations are conducted and we found no evidence of disruptions in the model. Additionally, scenario analyses are completed, and they are summarized in the following paragraphs.
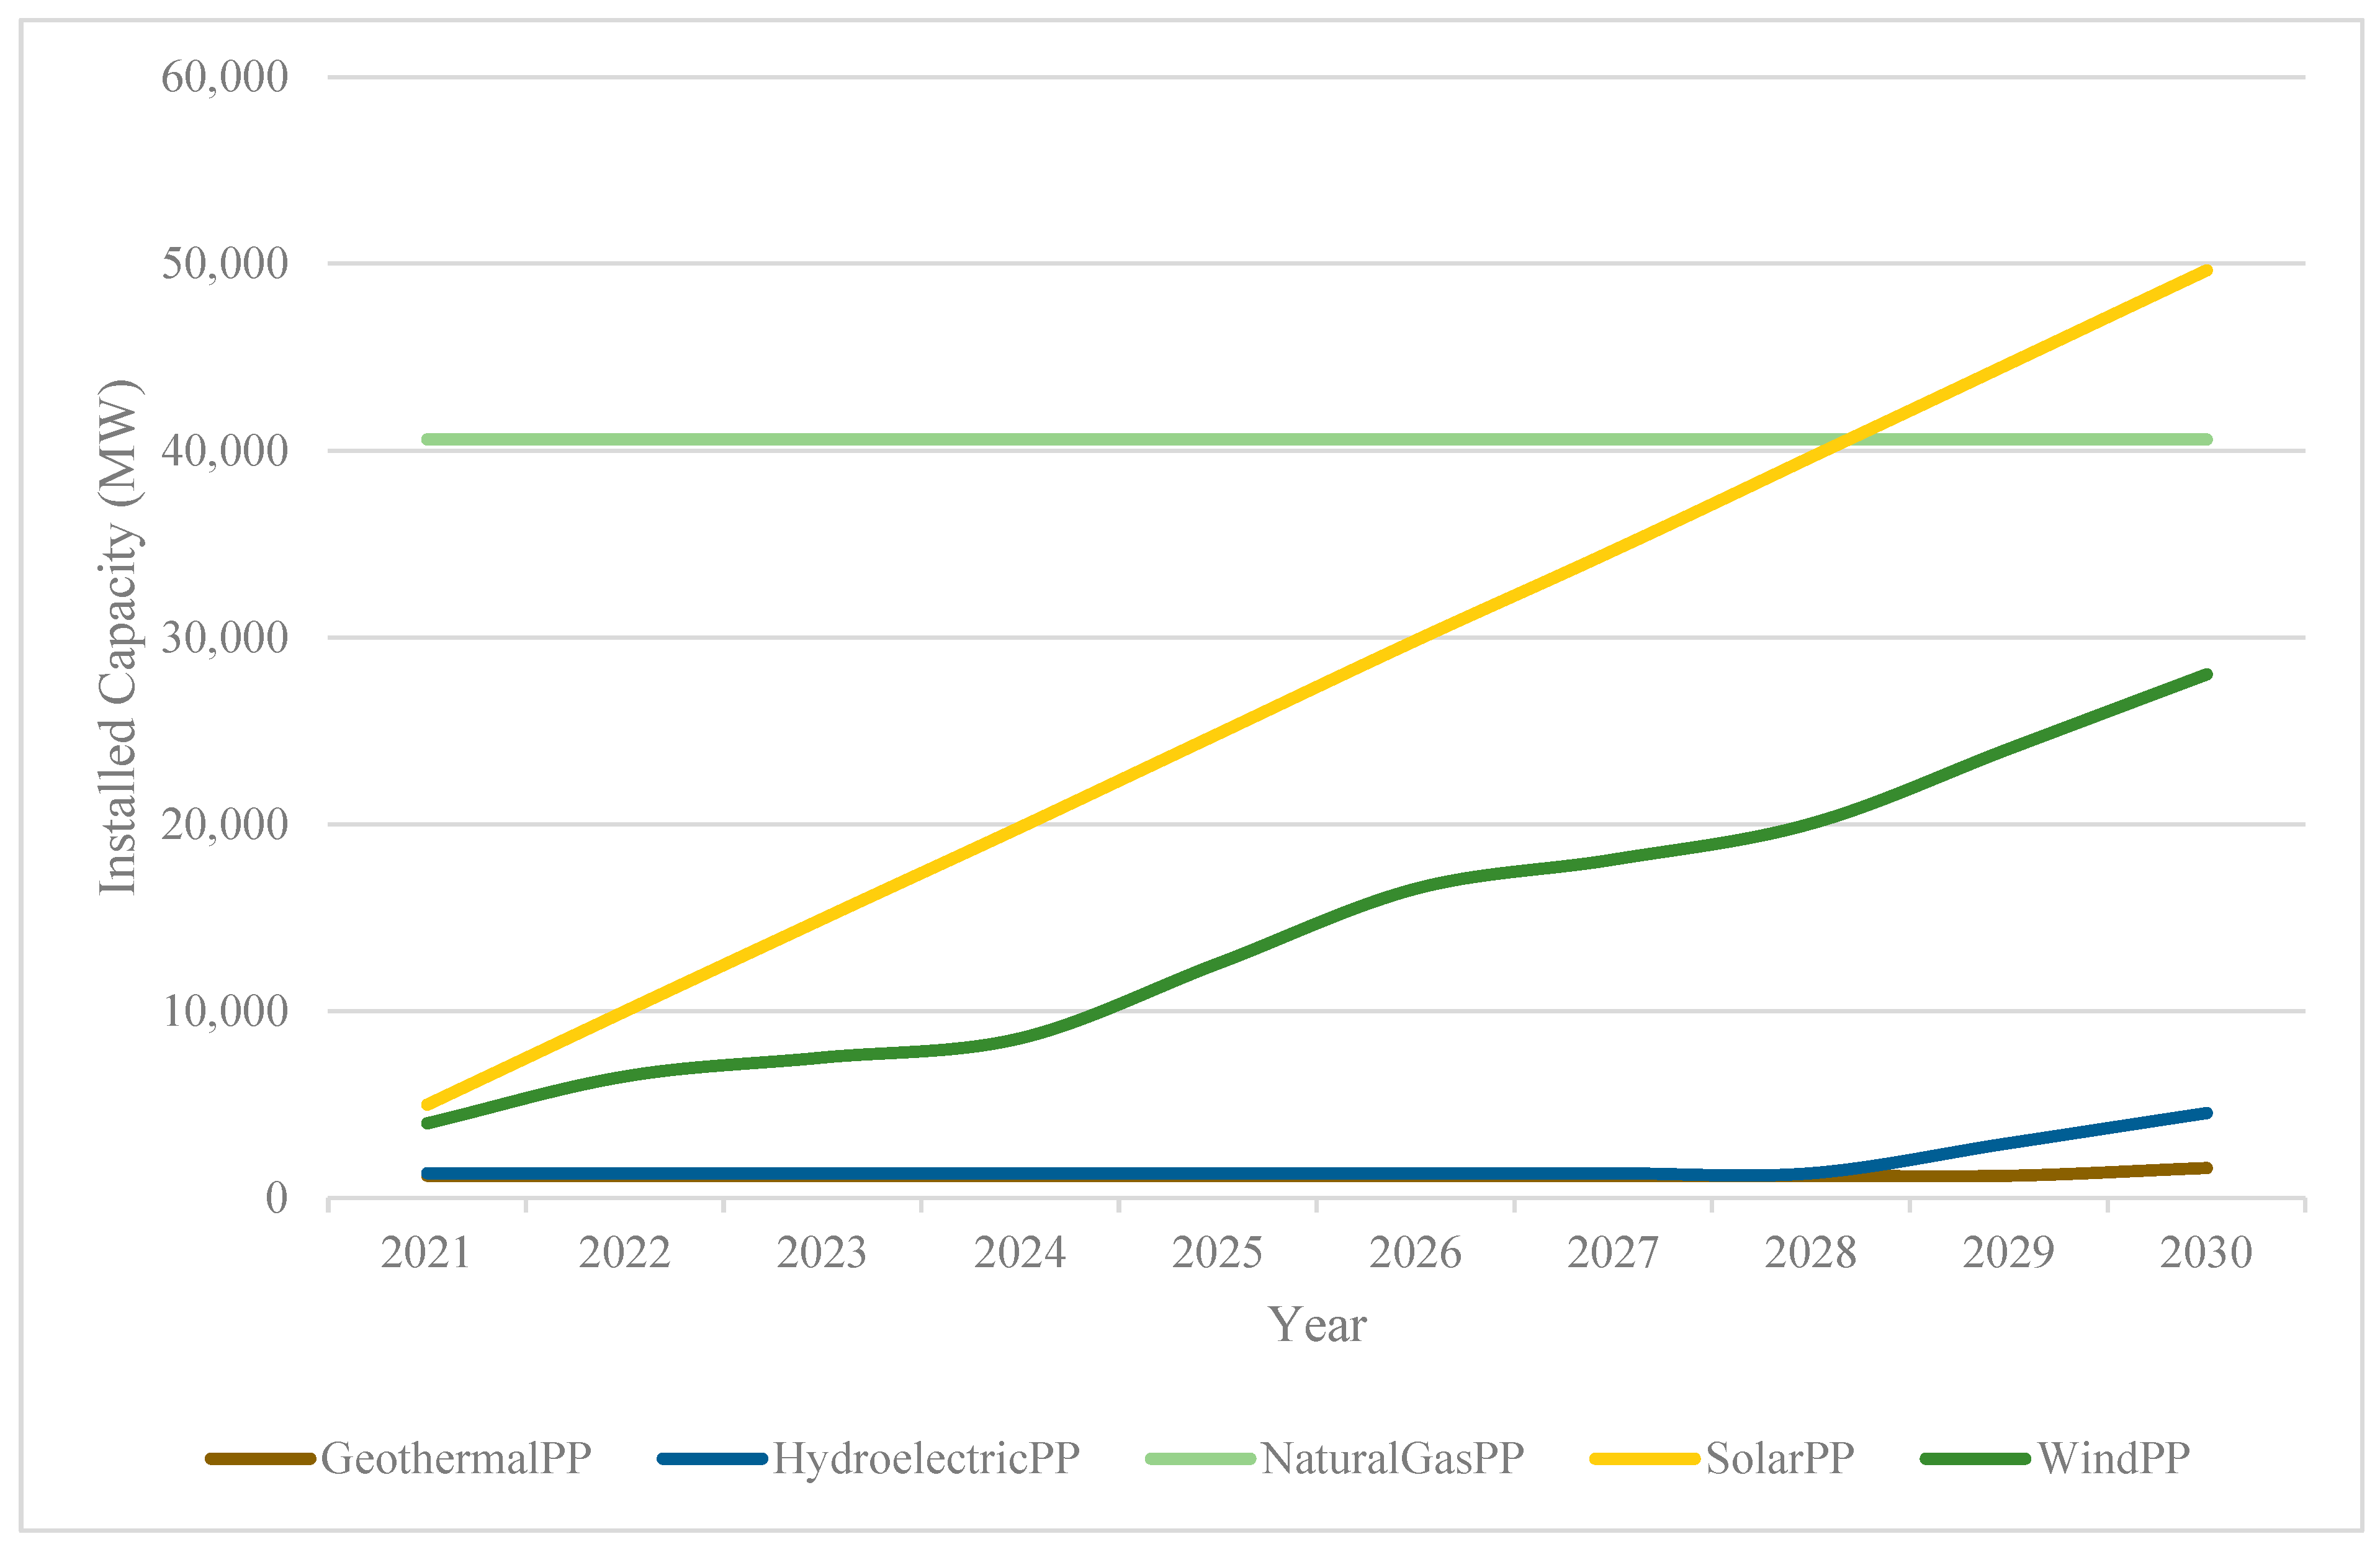
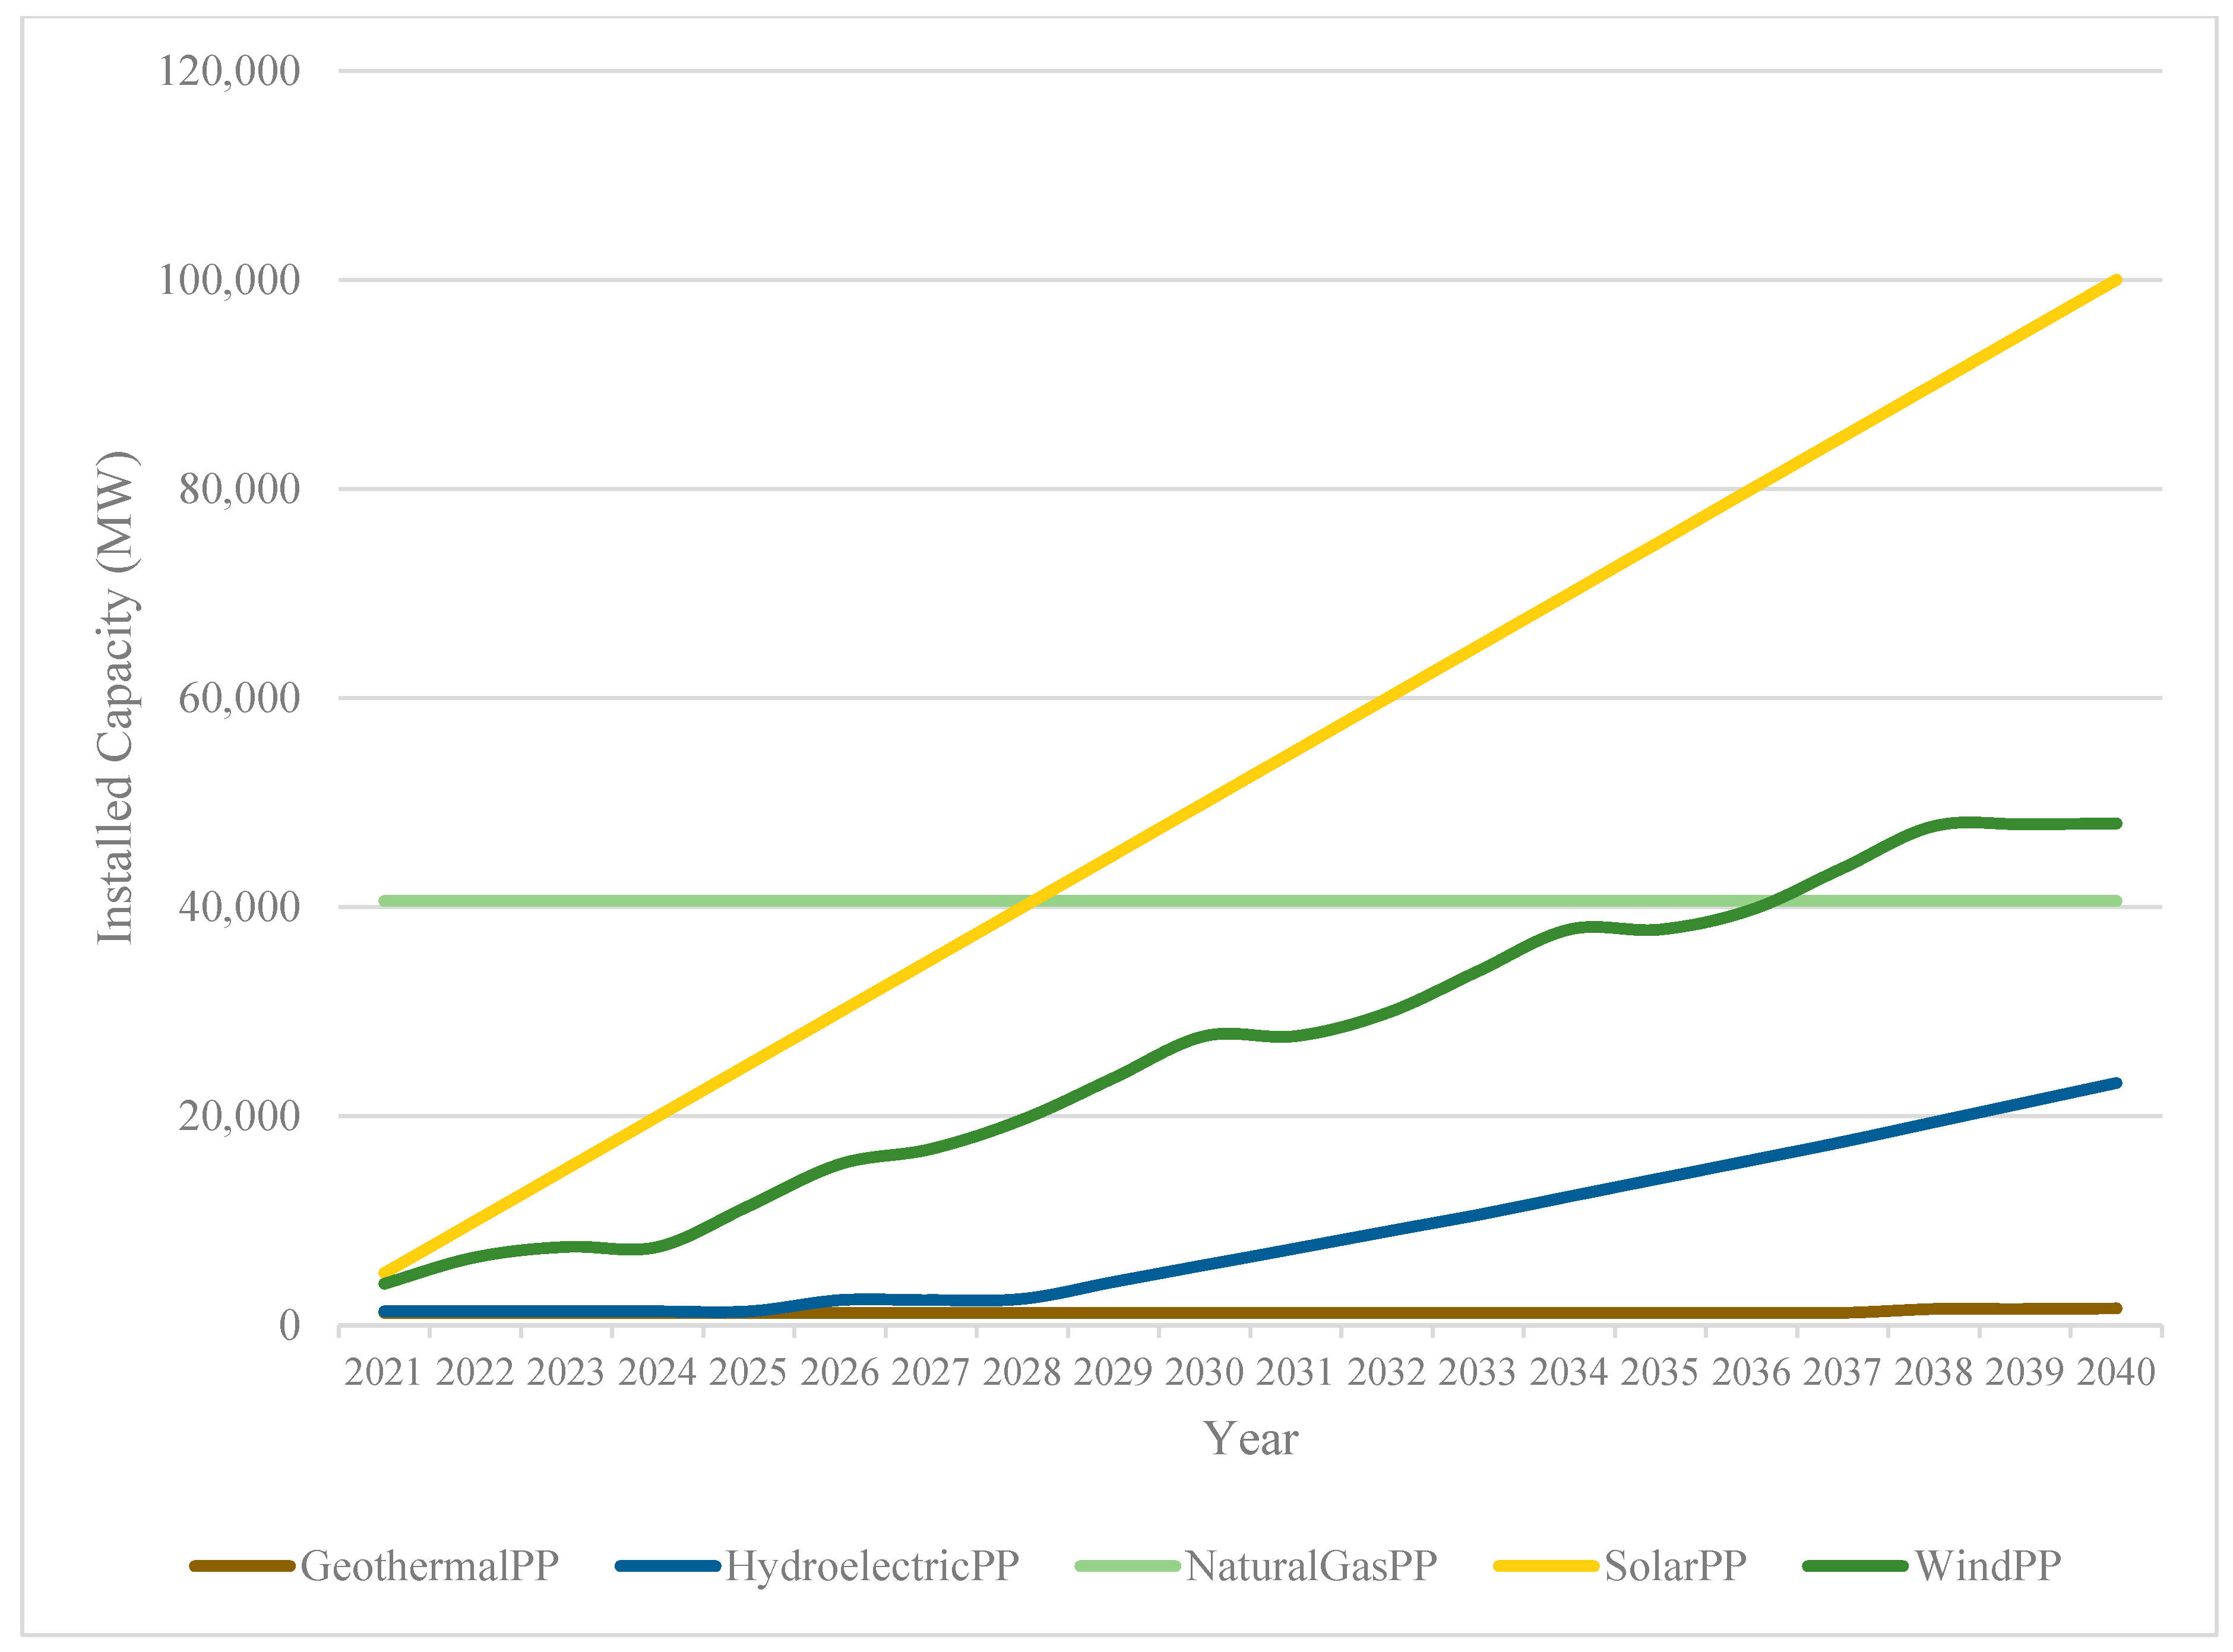
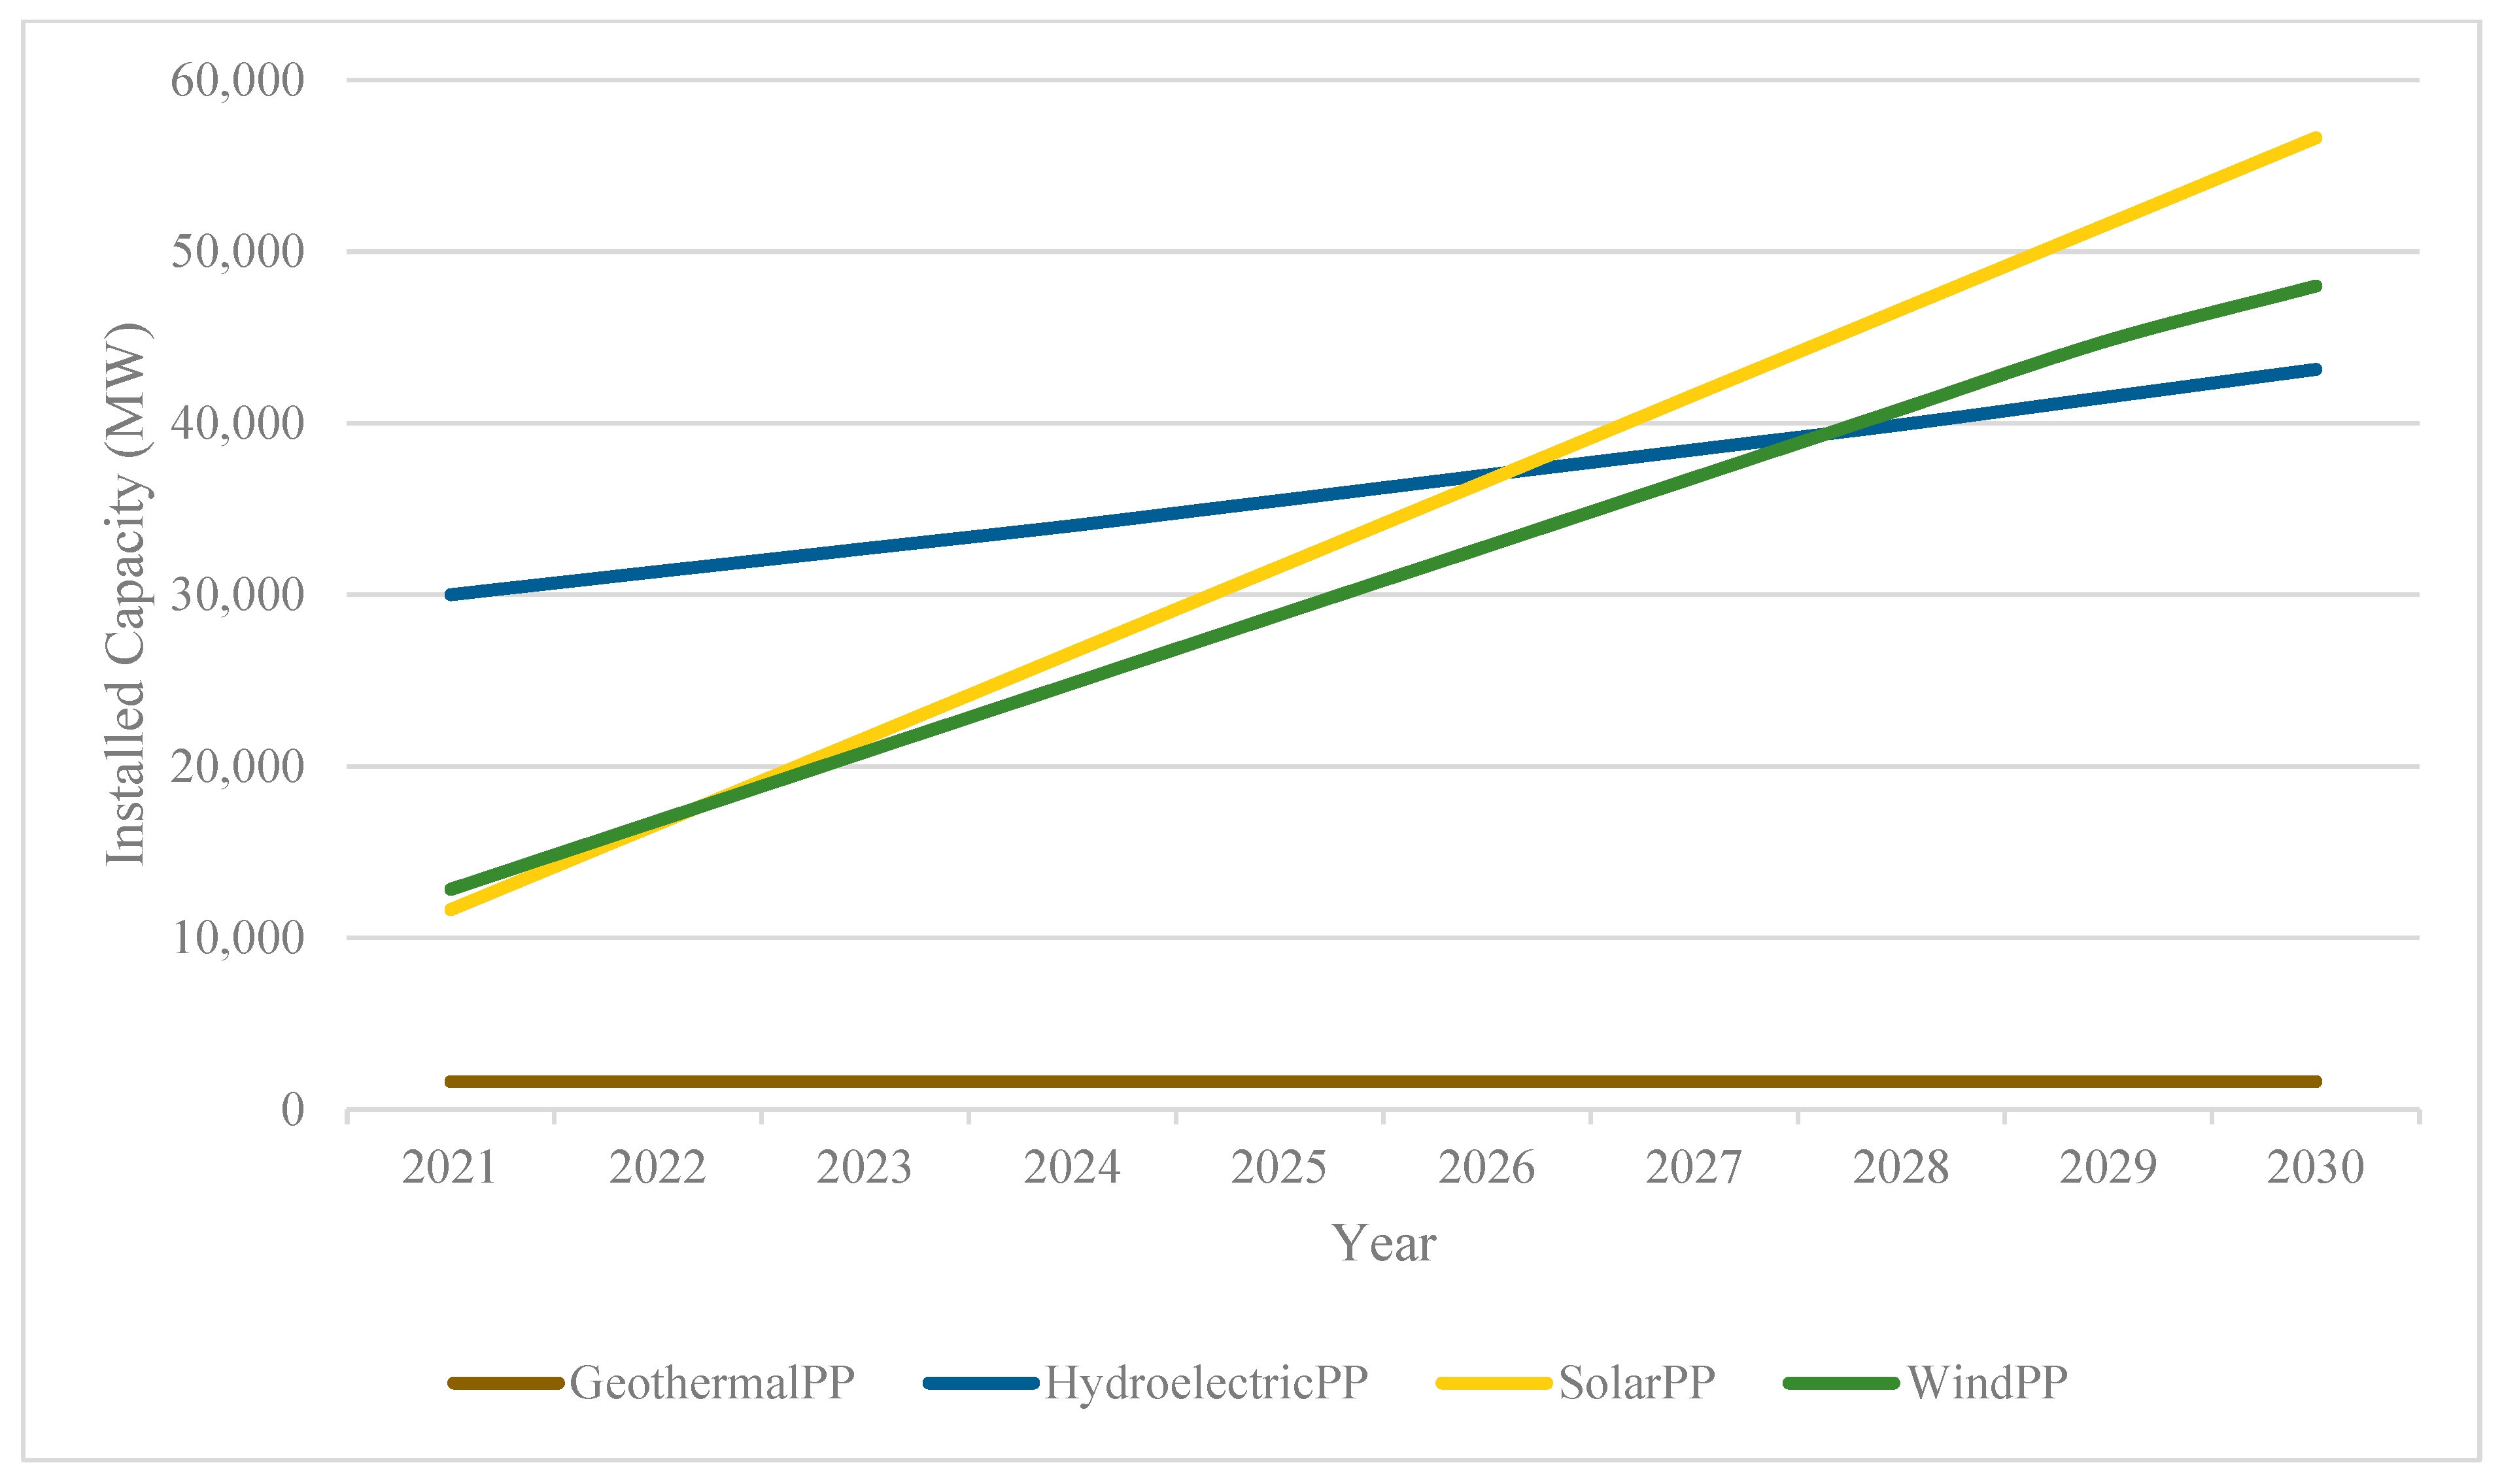
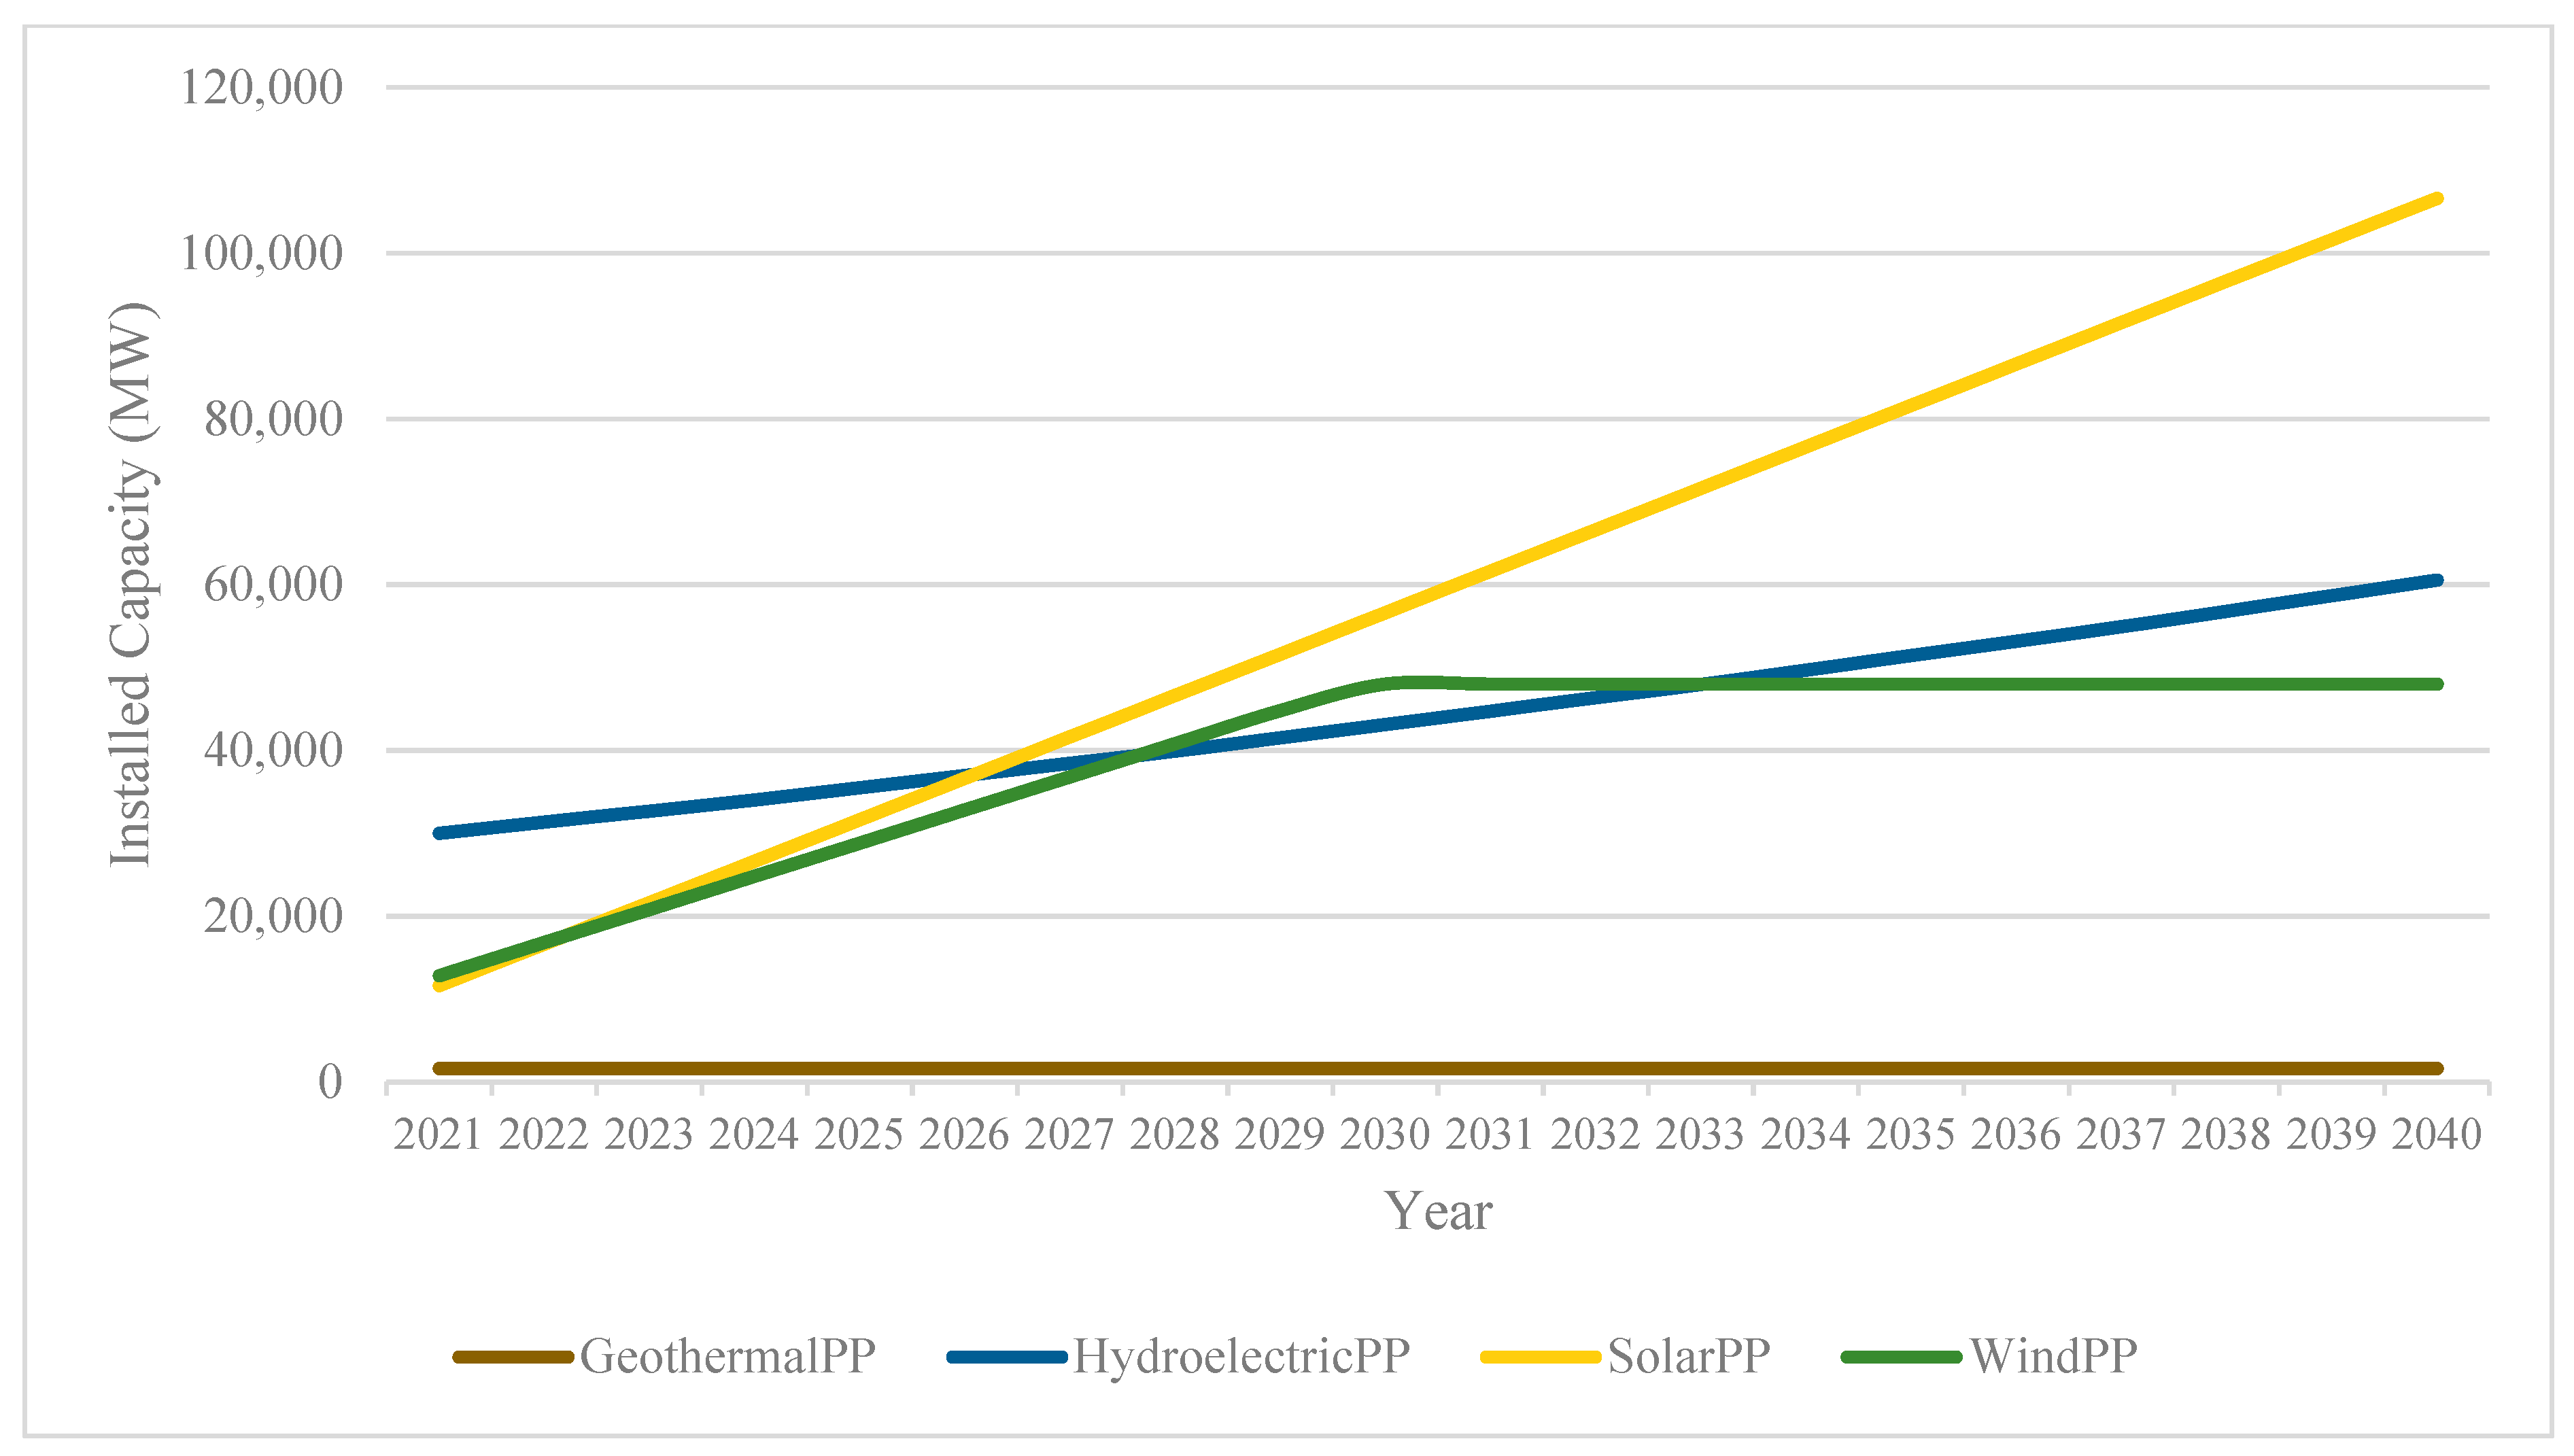
The first scenario is the case with no preplanned plants. In contrast to the base scenario, it is envisaged that no preplanned power plants will be operational within the planning horizon. The goal here is to see the model’s ideal selections considering the available power plants at the beginning of the planning horizon. For example, in the base scenario, it is envisaged that several nuclear power reactors will be operational in different years. In this scenario, the model determines the number of new power plants to be built, and it will be possible to see whether or not these preplanned power plants are chosen. Results regarding the installed capacities of power plants for the first scenario are visualized as shown in Figure 4 and Figure 5 for 2021–2030 and 2021–2040 planning horizons, respectively. According to this scenario, wind and solar power plant capabilities do not differ much from the baseline scenario for the same period. Natural gas power plants are utilized instead of nuclear energy, which was used in the base scenario, hence the percentage of natural gas in 2030 is 6.7% greater than in the base scenario. In contrast, the share of hydroelectric power plants declined by 3.7% by 2030 when compared to base scenario. Wind and solar power plant capabilities do not differ much from the baseline scenario for the same period. Natural gas had a 0% share in the base scenario, whereas nuclear power plants had a 4.6% share. However, in this situation, nuclear power plants are not used, and natural gas plants are not completely shut down. Natural gas capacity will account for 6.2% of total capacity by 2040. Finally, the share of hydroelectric power plants falls by roughly 2%.
The starting capacity of each power plant type was supplied in the base scenario, and the new power plant requirements were estimated based on this initial capacity. In the second scenario, we want to explore what happens when the model determines all power plant types and their capacities. Furthermore, as in the first scenario, it is anticipated that no power plant openings are planned. To summarize, the model determines all power plant types and capacities in this scenario. Since there is no available capacity at time zero, the requisite number of power plants should be opened to meet demand throughout the first period. As a result, we abandoned the power plant building schedule limits. Otherwise, because no power plants can be operational in the early stages, demand cannot be met, and the model becomes unsustainable. Furthermore, we remove the renewable capacity restriction constraint to check if the model selects only renewable resources or not. Installed capacities for 2021–2030 and 2021–2040 planning horizons under the assumptions of the second scenario are visualized in Figure 6 and Figure 7, respectively. The main power plant types chosen in the second scenario for the period 2021–2030 are solar, wind, and natural gas power plants. In comparison to the base scenario, solar share climbs to 39.9% (7.4% higher), wind share decreases to 22.5% (9.3% lower), and natural gas share remains same at around 32%. Hydroelectric and geothermal power plants are also used, but their contributions are less than 4%. When compared to the baseline scenario, the geothermal potential is fully utilized, while hydroelectric capacity is significantly reduced. Wind and solar power plant shares are close to the base scenario for the period 2021–2040. Natural gas capacity remains unchanged, but hydropower capacity drops by 17% towards the end of the planning horizon compared to the base scenario, and geothermal potential is utilized to maximum capacity.
In the third scenario, we considered the case that all power plants are renewable. The goal of this scenario is to examine what occurs when all capacity is constrained to renewable sources. We will also be able to determine whether the current renewable potential is sufficient to meet the available demand. In this scenario, the available capacity of renewables is stated as the beginning capacity, and additional power plants other than renewables are not included. Furthermore, prospective nonrenewable power projects are not considered. Construction time limits are dropped, as in the second scenario. In addition to satisfy demands, import limits are removed. Findings under the assumptions of the third scenario are shown in Figure 8 and Figure 9 for 2021–2030 and 2021–2040 planning horizons, respectively. All electricity demand is met by renewable power plants and imports. As existing renewable potential is insufficient to fulfill demand, the import option is adopted. The majority of the demand is met by solar, wind, and hydroelectric power sources. Furthermore, geothermal power plants are utilized to their utmost capability. Solar, hydroelectric, wind, and geothermal power plants, and imports, provide the demand. The average import contribution is around 19%. Solar power plants supply around 49% of energy, 28% of hydropower, 22% of wind, and 1% of geothermal energy.

5. Conclusions

This study examines Turkey’s strategic level electrical energy planning challenge from various perspectives, including the strategic plan, energy policy, capacity planning, and environmental policies of the government. To tackle the given problem, a mixed integer mathematical programming model that takes into account alternative power plant categories, such as fossil fuels, renewable energy, nuclear energy, and so on, is proposed. As several energy resources are included, the defined problem is characterized as a “general electricity planning problem”. In addition to lowering electricity generation costs, a variety of alternative policies, such as lowering CO2 emissions, limiting energy resource share regulations (such as limiting the use of fossil fuels), and promoting renewable energy, are taken into account in this study. This study is also falling under the “energy policy analysis” category in this regard. Two different planning horizons are considered, namely 2021–2030 and 2021–2040, and it is observed that the share of renewable resources increases while the share of fossil fuels declines with time.
As a result of this research, various key insights and outcomes involving power investment and production planning have been achieved. Due to the highest levelized costs of all choices, the first nuclear energy option is not chosen if the model is not required to do so. If nuclear energy is required by government regulations, all fossil fueled power facilities must be shut down during the planning horizon. Otherwise, coal power facilities are shut down, while natural gas power plants are up and running. Hydroelectric power plants are the least appealing renewable energy source because they have a higher levelized cost than wind and solar power plants and a lower availability factor than geothermal power plants.
The findings of this study indicate the trend toward renewable energy. Although nuclear energy is perceived as an effective energy resource, it is shown that renewable energy resources are more cost effective under the determination of CO2 emissions and generation capabilities. These results can be used as a guide to update strategic energy generation plans to improve the long-term effectiveness of future investments in power plants. It is advocated in this research to steadily boost renewable energy expenditures (particularly solar, wind, and geothermal) and eventually replace fossil fuel alternatives. The proposed energy plan not only saves investment, operation, and maintenance expenses, but also cuts emissions. Nuclear energy can also be used as an alternate and reliable source of energy, but the possible risks and greater costs must be addressed. Additionally, more renewable energy resources, such as hydrogen power can be included in the analysis, and minimization of total emission can be introduced as an additional goal in the objective function in future research. Additionally, the suggested model is deterministic, and it is assumed that the parameter values are known precisely. However, in reality, this is not the case, and the values of various factors may fluctuate based on economic, political, environmental, and strategic aims. The renewable shares, import and export limits, demand, and levelized cost parameters can also be modeled as stochastic variables in future studies. Moreover, as in [53] microstructure of Turkey’s renewable electricity sources can be studied in the future to create cost efficiency and reduce carbon emissions. This type of study may provide insights into developing countries. In conclusion, ARIMA is used as a statistical time series model. Although statistical estimation methods are used in optimization algorithms in some studies, the integration of forecasting results from the ARIMA model to the mixed integer linear programming is a new and recently evolving area of interest [54,55]. In addition to that, the contribution to energy planning is especially appropriate for developing countries, such as Turkey, in which switching to renewable energy resources is in the early phases. The findings of this study may serve as a guideline to prioritize energy resource preferences in developing countries during the planning phase since it is shown that optimization is required before the preparation of any regulations since these regulations have a considerable effect on the distribution of plants used.
The results show that the use of renewable energy generation options is the most preferable source of energy as expected. However, it is found that some regulations and not optimized plans may prevent the effective use of these resources. As seen in the results of the scenario analyses geothermal and hydroelectric alternatives are found as better options when compared to nuclear power plants when current plans are neglected which causes the shutdown of geothermal plants and inefficient increase in hydropower facilities. In this context, it should be added that if there are not any existing hydropower facilities it is found that building many new ones is not a feasible option. Furthermore, it is observed that natural gas power plants are preferred to nuclear power plants and even as an alternative to hydropower facilities. Even though natural gas is a fossil fuel-based resource, this alternative is used to support renewable energy plants in optimal scenarios since CO2 emission rates can still be fulfilled. Finally, solar power plants are found to be the best energy generation option, especially in long term plans as they become more feasible than wind power plants, whereas geothermal resources are found to be used at full capacity even though they are much scarcer than solar and wind options.

Author Contributions

Conceptualization, G.Y., U.B. and K.D.Ü.; methodology, G.Y., U.B. and F.Y.-Ö.; software, G.Y., U.B. and F.Y.-Ö.; validation, G.Y., U.B., F.Y.-Ö. and K.D.Ü.; formal analysis, G.Y., U.B. and F.Y.-Ö.; investigation, G.Y., U.B., F.Y.-Ö. and K.D.Ü.; resources, G.Y.; data curation, G.Y.; writing—original draft preparation, K.D.Ü.; writing—review and editing, U.B., F.Y.-Ö. and K.D.Ü.; visualization, G.Y.; supervision, U.B. and F.Y.-Ö. All authors have read and agreed to the published version of the manuscript.

Funding

This research received no external funding.

Data Availability Statement

Publicly available datasets were analyzed in this study. This data can be found here: https://www.teias.gov.tr/tr-TR/turkiye-elektrik-uretim-iletim-istatistikleri (accessed on 15 May 2020).

Acknowledgments

We appreciate the associate editor’s and four anonymous reviewers’ helpful comments and revisions.

Conflicts of Interest

The authors declare no conflict of interest.

References

  1. IEA. World Energy Outlook. Available online: https://www.iea.org/reports/world-energy-outlook-2019 (accessed on 1 December 2022).
  2. Zhou, P.; Ang, B.W.; Poh, K.L. Decision analysis in energy and environmental modeling: An update. Energy 2006, 31, 2604–2622. [Google Scholar] [CrossRef]
  3. Lazard. Lazard’s Annual Levelized Cost of Energy Analysis (LCOE 12.0). Available online: https://www.lazard.com/ (accessed on 1 December 2022).
  4. Baños, R.; Manzano-Agugliaro, F.; Montoya, F.G.; Gil, C.; Alcayde, A.; Gómez, J. Optimization methods applied to renewable and sustainable energy: A review. Renew. Sustain. Energy Rev. 2011, 15, 1753–1766. [Google Scholar] [CrossRef]
  5. Yörük, G. Strategic Energy Production Planning of Turkey Using Mixed Integer Programming Based on Electricity Demand Forecasting. Master’s Thesis, Atilim University, Ankara, Turkey, 2021. [Google Scholar]
  6. Ramanathan, R.; Ganesh, L.S. Energy alternatives for lighting in households: An evaluation using an integrated goal programming-AHP model. Energy 1995, 20, 63–72. [Google Scholar] [CrossRef]
  7. Pokharel, S.; Chandrashekar, M. A multiobjective approach to rural energy policy analysis. Energy 1998, 23, 325–336. [Google Scholar] [CrossRef]
  8. Mavrotas, G.; Diakoulaki, D.; Papayannakis, L. An energy planning approach based on mixed 0-1 multiple objective linear programming. Int. Trans. Oper. Res. 1999, 6, 231–244. [Google Scholar] [CrossRef]
  9. Agrawal, R.K.; Singh, S.P. Energy allocations for cooking in UP households (India): A fuzzy multi-objective analysis. Energy Convers. Manag. 2001, 42, 2139–2154. [Google Scholar] [CrossRef]
  10. Antunes, C.H.; Martins, A.G.; Brito, I.S. A multiple objective mixed integer linear programming model for power generation expansion planning. Energy 2004, 29, 613–627. [Google Scholar] [CrossRef] [Green Version]
  11. San Cristóbal, J.R. A goal programming model for the optimal mix and location of renewable energy plants in the north of Spain. Renew. Sustain. Energy Rev. 2012, 16, 4461–4464. [Google Scholar] [CrossRef]
  12. Özcan, E.C.; Erol, S. A multi-objective mixed integer linear programming model for energy resource allocation problem: The case of Turkey. Gazi Univ. J. Sci. 2014, 27, 1157–1168. [Google Scholar]
  13. Şengül, Ü.; Eren, M.; Eslamian Shiraz, S.; Gezder, V.; Sengül, A.B. Fuzzy TOPSIS method for ranking renewable energy supply systems in Turkey. Renew. Energy 2015, 75, 617–625. [Google Scholar] [CrossRef]
  14. Cormio, C.; Dicorato, M.; Minoia, A.; Trovato, M. A regional energy planning methodology including renewable energy sources and environmental constraints. Renew. Sustain. Energy Rev. 2003, 7, 99–130. [Google Scholar] [CrossRef]
  15. Ai, Y.P.; Huang, G.H.; Yang, Z.F.; Lin, Q.G.; Bass, B.; Tan, Q. Development of an optimization model for energy systems planning in the Region of Waterloo. Int. J. Energy Res. 2008, 32, 988–1005. [Google Scholar]
  16. Huang, Y.H.; Wu, J.H. A portfolio risk analysis on electricity supply planning. Energy Policy 2008, 36, 627–641. [Google Scholar] [CrossRef]
  17. Daniel, J.; Dicorato, M.; Forte, G.; Iniyan, S.; Trovato, M. A methodology for the electrical energy system planning of Tamil Nadu state (India). Energy Policy 2009, 37, 904–914. [Google Scholar] [CrossRef]
  18. Arnette, A.; Zobel, C.W. An optimization model for regional renewable energy development. Renew. Sustain. Energy Rev. 2012, 16, 4606–4615. [Google Scholar] [CrossRef]
  19. Pina, A.; Silva, C.A.; Ferrão, P. High-resolution modeling framework for planning electricity systems with high penetration of renewables. Appl. Energy 2013, 112, 215–223. [Google Scholar] [CrossRef]
  20. Zhang, Q.; Mclellan, B.C.; Tezuka, T.; Ishihara, K.N. An integrated model for long-term power generation planning toward future smart electricity systems. Appl. Energy 2013, 112, 1424–1437. [Google Scholar] [CrossRef]
  21. Habib, M.A.; Chungpaibulpatana, S. Electricity generation expansion planning with environmental impact abatement: Case study of Bangladesh. Energy Procedia 2014, 52, 410–420. [Google Scholar] [CrossRef] [Green Version]
  22. Moret, S.; Bierlaire, M.; Maréchal, F. Strategic Energy Planning under Uncertainty: A Mixed-Integer Linear Programming Modeling Framework for Large-Scale Energy Systems. Comput. Aided Chem. Eng. 2016, 38, 1899–1904. [Google Scholar]
  23. Santos, M.J.; Ferreira, P.; Araújo, M. A methodology to incorporate risk and uncertainty in electricity power planning. Energy 2016, 115, 1400–1411. [Google Scholar] [CrossRef] [Green Version]
  24. Kachoee, M.S.; Salimi, M.; Amidpour, M. The long-term scenario and greenhouse gas effects cost-benefit analysis of Iran’s electricity sector. Energy 2018, 143, 585–596. [Google Scholar] [CrossRef]
  25. Shen, W.; Qiu, J.; Dong, Z. Electricity network planning targeting Low-Carbon energy transition. Glob. Energy Interconnect. 2018, 1, 487–499. [Google Scholar]
  26. Walmsley, M.R.W.; Walmsley, T.G.; Atkins, M.J. Linking greenhouse gas emissions footprint and energy return on investment in electricity generation planning. J. Clean. Prod. 2018, 200, 911–921. [Google Scholar] [CrossRef]
  27. Senatla, M.; Nchake, M.; Taele, B.M.; Hapazari, I. Electricity capacity expansion plan for Lesotho—Implications on energy policy. Energy Policy 2018, 120, 622–634. [Google Scholar] [CrossRef]
  28. Levin, T.; Kwon, J.; Botterud, A. The long-term impacts of carbon and variable renewable energy policies on electricity markets. Energy Policy 2019, 131, 53–71. [Google Scholar] [CrossRef]
  29. Anderson, D. Models for Determining Least-Cost Investments in Electricity Supply. Bell J. Econ. 2008, 3, 267–299. [Google Scholar] [CrossRef]
  30. Trotter, P.A.; McManus, M.C.; Maconachie, R. Electricity planning and implementation in sub-Saharan Africa: A systematic review. Renew. Sustain. Energy Rev. 2017, 74, 1189–1209. [Google Scholar] [CrossRef]
  31. Melikoglu, M. Vision 2023: Scrutinizing achievability of Turkey’s electricity capacity targets and generating scenario based nationwide electricity demand forecasts. Energy Strateg. Rev. 2018, 22, 188–195. [Google Scholar] [CrossRef]
  32. Calikoglu, U.; Koksal, M.A. Green electricity and Renewable Energy Guarantees of Origin demand analysis for Türkiye. Energy Policy 2022, 170, 113229. [Google Scholar] [CrossRef]
  33. Ünal, B.B.; Onaygil, S.; Acuner, E.; Cin, R. Application of energy efficiency obligation scheme for electricity distribution companies in Turkey. Energy Policy 2022, 163, 112851. [Google Scholar] [CrossRef]
  34. Selçuklu, S.B.; Coit, D.W.; Felder, F.A. Electricity generation portfolio planning and policy implications of Turkish power system considering cost, emission, and uncertainty. Energy Policy 2023, 173, 113393. [Google Scholar] [CrossRef]
  35. Singh, A.K.; Khatoon, S. An Overview of Electricity Demand Forecasting Techniques. Natl. Conf. Emerg. Trends Electr. Instrum. Commun. Eng. 2013, 3, 38–48. [Google Scholar]
  36. Srinivasan, D.; Lee, M.A. Survey of hybrid fuzzy neural approaches to electric load forecasting. Proc. IEEE Int. Conf. Syst. Man Cybern. 1995, 5, 4004–4008. [Google Scholar]
  37. Jiang, W.; Wu, X.; Gong, Y.; Yu, W.; Zhong, X. Holt–Winters smoothing enhanced by fruit fly optimization algorithm to forecast monthly electricity consumption. Energy 2020, 193, 116779. [Google Scholar] [CrossRef]
  38. Al-Musaylh, M.S.; Deo, R.C.; Adamowski, J.F.; Li, Y. Short-term electricity demand forecasting with MARS, SVR and ARIMA models using aggregated demand data in Queensland, Australia. Adv. Eng. Inform. 2017, 35, 1–16. [Google Scholar] [CrossRef]
  39. Yukseltan, E.; Yucekaya, A.; Bilge, A.H. Forecasting electricity demand for Turkey: Modeling periodic variations and demand segregation. Appl. Energy 2017, 193, 287–296. [Google Scholar] [CrossRef]
  40. Abd Jalil, N.A.; Ahmad, M.H.; Mohamed, N. Electricity load demand forecasting using exponential smoothing methods. World Appl. Sci. J. 2013, 22, 1540–1543. [Google Scholar]
  41. Lee, C.M.; Ko, C.N. Short-term load forecasting using lifting scheme and ARIMA models. Expert Syst. Appl. 2011, 38, 5902–5911. [Google Scholar] [CrossRef]
  42. Dilaver, Z.; Hunt, L.C. Modelling and forecasting Turkish residential electricity demand. Energy Policy 2011, 39, 3117–3127. [Google Scholar] [CrossRef] [Green Version]
  43. Taylor, J.W. Triple seasonal methods for short-term electricity demand forecasting. Eur. J. Oper. Res. 2010, 204, 139–152. [Google Scholar] [CrossRef] [Green Version]
  44. Shin, S.-Y.; Woo, H.-G. Energy Consumption Forecasting in Korea Using Machine Learning Algorithms. Energies 2022, 15, 4880. [Google Scholar] [CrossRef]
  45. Leite Coelho da Silva, F.; da Costa, K.; Canas Rodrigues, P.; Salas, R.; López-Gonzales, J.L. Statistical and Artificial Neural Networks Models for Electricity Consumption Forecasting in the Brazilian Industrial Sector. Energies 2022, 15, 588. [Google Scholar] [CrossRef]
  46. Ünlü, K.D. A Data-Driven Model to Forecast Multi-Step Ahead Time Series of Turkish Daily Electricity Load. Electronics 2022, 11, 1524. [Google Scholar] [CrossRef]
  47. Akbal, Y.; Ünlü, K.D. A univariate time series methodology based on sequence-to-sequence learning for short to midterm wind power production. Renew. Energy 2022, 200, 832–844. [Google Scholar] [CrossRef]
  48. Akdi, Y.; Gölveren, E.; Okkaoğlu, Y. Daily electrical energy consumption: Periodicity, harmonic regression method and forecasting. Energy 2020, 191, 116524. [Google Scholar] [CrossRef]
  49. Kazancık, L.B. Türkiye Elektrik Enerji Sektöründe Robust Optimizasyon Modeli. Ph.D. Thesis, Department of Statistics, Ankara Üniversitesi, Ankara, Turkey, 2016. [Google Scholar]
  50. İncekara, Ç.Ö. Türkiye’nin Sürdürülebilir Stratejik Enerji Politikalarının Oluşturulması için Optimizasyon Modellerinin Geliştirilmesi ve Uygulama Adımları. Master’s Thesis, Department of Ind. Eng., Çukurova Üniversitesi, Adana, Turkey, 2007. [Google Scholar]
  51. Box, G.; Jenkins, G. Time Series Analysis; Forecasting and Control; Holden-Day: San Francisco, CA, USA, 1970. [Google Scholar]
  52. TEİAŞ. Electric Generation and Transfer Statistics 2018, Electric Statistics. 2020. Available online: https://www.teias.gov.tr/tr-TR/turkiye-elektrik-uretim-iletim-istatistikleri (accessed on 29 January 2021).
  53. Cosic, A.; Stadler, M.; Mansoor, M.; Zellinger, M. Mixed-integer linear programming based optimization strategies for renewable energy communities. Energy 2021, 237, 121559. [Google Scholar] [CrossRef]
  54. Meier, A.; Kramer, O. Recurrent neural network-predictions for PSO in dynamic optimization. In Proceedings of the Genetic and Evolutionary Computation Conference, Kyoto, Japan, 15–19 July 2018; Volume 29, p. 36. [Google Scholar]
  55. Ordu, M.; Demir, E.; Tofallis, C.; Gunal, M.M. A novel healthcare resource allocation decision support tool: A forecasting-simulation-optimization approach. J. Oper. Res. Soc. 2021, 72, 485–500. [Google Scholar] [CrossRef]
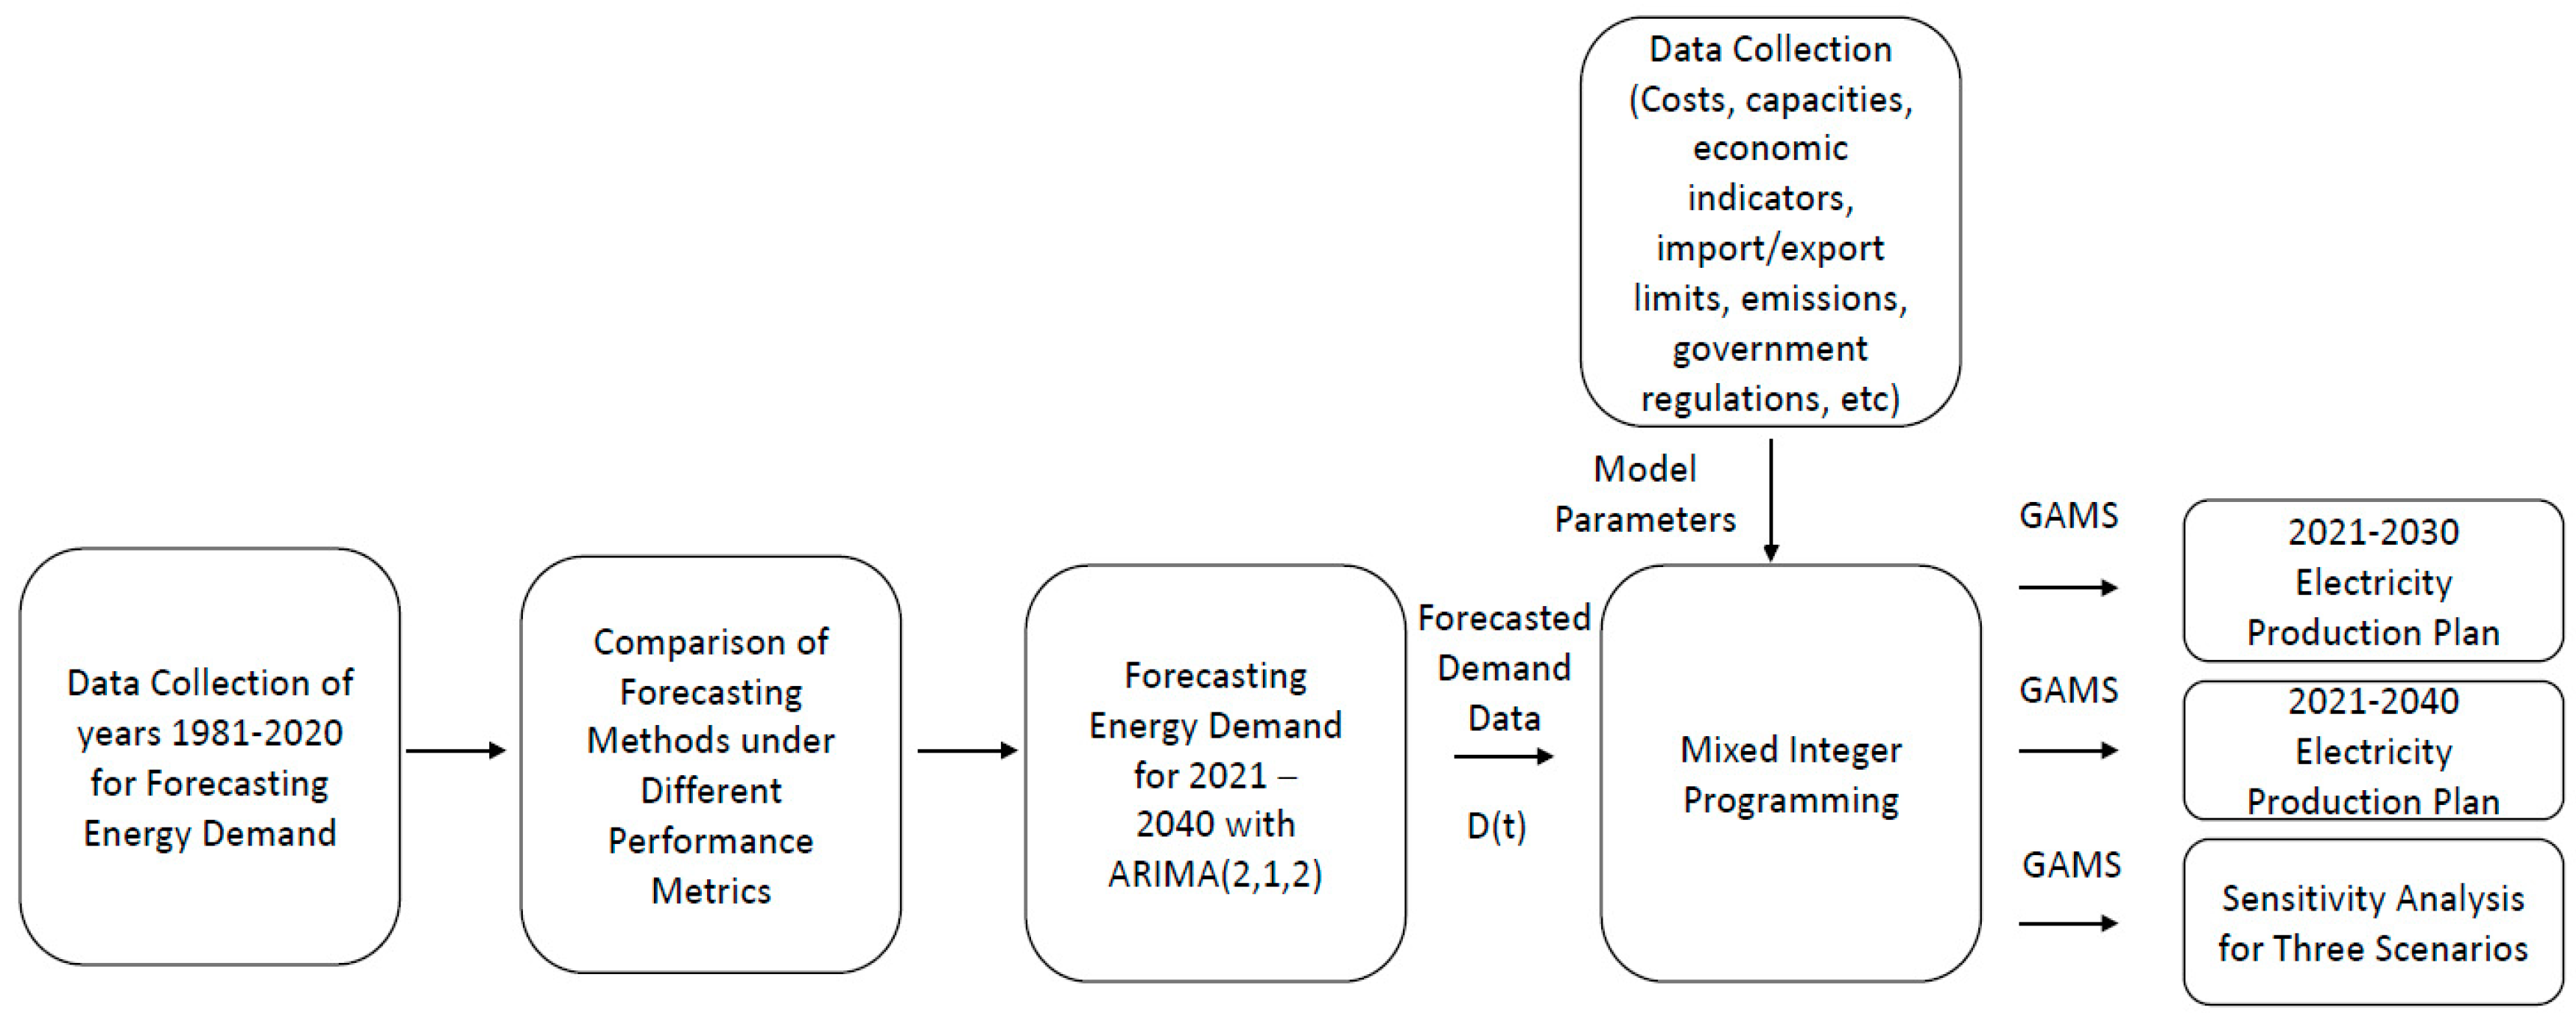
Figure 1. Framework of the Proposed Methodology.
Mathematics 11 01865 g001
Figure 2. CO2 Emissions between 2021–2030 (tons).
Mathematics 11 01865 g002
Figure 3. CO2 emissions between 2021–2040 (tons).
Mathematics 11 01865 g003
Figure 4. Installed capacities for the first scenario in the 2021–2030 horizon.
Mathematics 11 01865 g004
Figure 5. Installed capacities for the first scenario in the 2021–2040 horizon.
Mathematics 11 01865 g005
Figure 6. Installed capacities for the second scenario in the 2021–2030 horizon.
Mathematics 11 01865 g006
Figure 7. Installed capacities for the second scenario in the 2021–2040 horizon.
Mathematics 11 01865 g007
Figure 8. Installed capacities for the third scenario in the 2021–2030 horizon.
Mathematics 11 01865 g008
Figure 9. Installed capacities for the third scenario in the 2021–2040 horizon.
Mathematics 11 01865 g009
Table 1. Comparison of Forecasting Methods.
Performance MetricsNonlinear Regression (Third Order Polynomial)Exponential (Double)Holt–Winters (Additive)Holt–Winters (Multiplicative)Holt–Winters (Linear)ARIMA (2,1,2)
RMSE398449865600532947713236
MAPE2.160%3.162%3.541%3.247%2.844%1.702%
MAE277636894181384235192322
99.82%99.69%99.62%99.65%99.72%99.87%
Table 2. Number of Power Plants (Njt) for the 2020–2030 Period.
Power Plant (j)20202021202220232024202520262027202820292030
Elbistan Lignite83300000000
Fluized Lignite480000010000
Geothermal545454334321100
Hard Coal31100000000
Hydroelectric214214214214214225277285288291295
Imported Coal180000000000
Natural Gas3737373728251917151311
Nuclear00005555555
Solar133133133233352452552652752852950
Wind22122132146456466476486496410641164
Table 3. Installed Capacities of Power Plants (MW) for the 2021–2030 Period.
Power Plant (j)2021202220232024202520262027202820292030
Elbistan Lignite1080108000000000
Fluidized Lignite000001500000
Geothermal162016209901209060303000
Hard Coal30030000000000
Hydroelectric28,67628,67628,67628,67630,15037,11838,19038,59238,99439,530
Imported Coal0000000000
Natural Gas25,90025,90025,90019,60017,50013,30011,90010,50091007700
Nuclear0005000500050005000500050005000
Solar6650665011,65017,60022,60027,60032,60037,60042,60047,500
Wind884012,84018,56022,56026,56030,56034,56038,56042,56046,560
Table 4. Number of Power Plants (Njt) for the 2020–2040 Period.
Power Plant (j)20202021202220232024202520262027202820292030
Elbistan Lignite83300000000
Fluidized Lignite480000010000
Geothermal545454334330000
Hard Coal31100000000
Hydroelectric214214214214214225277288299311335
Imported Coal180000000000
Natural Gas373737372825191715128
Nuclear00005555555
Solar1331331332333524525526527528521052
Wind22122132146456366376285694010401188
Power Plant (j)2031203220332034203520362037203820392040
Elbistan Lignite0000000000
Fluized Lignite0000000000
Geothermal0000000000
Hard Coal0000000000
Hydroelectric347357367378390402415428442456
Imported Coal0000000000
Natural Gas0000000000
Nuclear10101010101010101010
Solar1152125213521452155216521752185219512050
Wind1198119812001200120012001200120012001200
Table 5. Installed Capacities of Power Plants (MW) for the 2021–2040 Period.
Power Plant (j)2021202220232024202520262027202820292030
Elbistan Lignite1080108000000000
Fluidized Lignite000001500000
Geothermal1620162099012090900000
Hard Coal30030000000000
Hydroelectric28,67628,67628,67628,67630,15037,11838,59240,06641,67443,282
Imported Coal0000000000
Natural Gas25,90025,90025,90019,60017,50013,30011,90010,50084007000
Nuclear0005000500050005000500050005000
Solar6650665011,65017,60022,60027,60032,60037,60042,60047,600
Wind884012,84018,56022,52026,52030,48034,24037,60041,60044,440
Power Plant (j)2031203220332034203520362037203820392040
Elbistan Lignite0000000000
Fluidized Lignite0000000000
Geothermal0000000000
Hard Coal0000000000
Hydroelectric44,89046,49847,83849,17850,65252,26053,86855,61057,35259,228
Imported Coal0000000000
Natural Gas5600000000000
Nuclear500010,00010,00010,00010,00010,00010,00010,00010,00010,000
Solar52,60057,60062,60067,60072,60077,60082,60087,60092,60097,550
Wind47,52047,92047,92048,00048,00048,00048,00048,00048,00048,000
Disclaimer/Publisher’s Note: The statements, opinions and data contained in all publications are solely those of the individual author(s) and contributor(s) and not of MDPI and/or the editor(s). MDPI and/or the editor(s) disclaim responsibility for any injury to people or property resulting from any ideas, methods, instructions or products referred to in the content.