Article

Capacity-Raising Reversible Data Hiding Using Empirical Plus–Minus One in Dual Images

by
Cheng-Ta Huang
1,2,
Chi-Yao Weng
3,* and
Njabulo Sinethemba Shongwe
1
1
International Bachelor Program in Informatics, Yuan Ze University, Taoyuan 32003, Taiwan
2
Department of Information Management, Yuan Ze University, Taoyuan 32003, Taiwan
3
Department of Computer Science and Artificial Intelligence, National Pingtung University, Pingtung 90003, Taiwan
*
Author to whom correspondence should be addressed.
Mathematics 2023, 11(8), 1764; https://doi.org/10.3390/math11081764
Submission received: 2 March 2023 / Revised: 5 April 2023 / Accepted: 5 April 2023 / Published: 7 April 2023

Abstract

:
Electronic records of a patient’s health history are often shared among healthcare providers, and patient data must be kept secure to maintain the privacy of patients. One way of doing this is through data hiding, and this paper demonstrates a scheme to achieve this. This paper proposes a capacity-raising reversible data-hiding scheme using an empirical rules table in dual images. The aim of this research is to avoid drawing awareness to the transmission of information by providing a steganographic technique capable of embedding high-capacity data into an image while maintaining the good quality of the image. To hide the secret message(s), a rules table containing 13 entries is presented. This rules table is extendable to a table of up to 262,133 entries (with each entry containing one distinct character) that are related to the 13 entries in terms of the rules. The rules of this table are used during the embedding and extraction procedures. In the proposed method, 512 × 512 images are divided into 1 × 2 blocks where adjacent pixels are represented using x and y for both embedding and extraction, respectively. Recovery of the cover image from the stego image is also achievable during the extraction process. Conducted experiments show that the proposed method has an average pixel-to-signal noise ratio of 52.65 dB, which is higher than that achieved with the methods discussed in this paper. Additionally, the proposed method can embed a wider range of characters (depending on the image size) as compared to the rest of the methods, hence its high embedding capacity of 4.25 bpp. The proposed method can also withstand security attacks such as RS, pixel value difference, entropy, and chi-square attacks. The proposed method is also undetectable under visual attack analyses such as the difference histogram, pixel difference histogram, and visual inspection. Based on the higher embedding capacity, pixel-to-signal noise ratio, the ability of this method to be undetected under visual attack analysis, and the ability of this method to withstand security attacks, it can be concluded that the proposed method is superior to the other methods.

1. Introduction

The information age era has marked the development of a vast number of technologies all across the network. Therefore, in today’s digital age, the importance of information security cannot be overstated. The proliferation of technology and the internet has made it easier than ever to access, transmit, and store vast amounts of data. However, with this convenience comes increased risk, as cyber threats continue to grow in frequency and sophistication [1]. The consequences of a security breach can be severe, ranging from financial loss to damage, reputation, legal liabilities, and even national security risks. In recent years, there have been numerous high-profile data breaches, where sensitive information has been compromised, and personal data have been stolen, including credit card information, social security numbers, and patient medical records [2].
Organizations of all types and sizes are vulnerable to cyber attacks [3], including governments, financial institutions, healthcare providers, and retailers. Thus, protecting sensitive information and ensuring the security of systems and networks has become a top priority for individuals, businesses, and governments alike. In addition to the financial and reputational risks associated with a security breach, there are also legal and regulatory requirements that organizations must comply with, such as the General Data Protection Regulation (GDPR) in Europe and the California Consumer Privacy Act (CCPA) in the United States [4].
Therefore, it is essential to implement robust information security measures to safeguard sensitive data and prevent unauthorized access, especially when it is being transmitted across networks. One way to safeguard information is through the use of cryptography.
Cryptography [5] is the practice of protecting information by transforming it into an unreadable format to prevent unauthorized access. This involves using mathematical algorithms and protocols to ensure the confidentiality, integrity, and authentication of data. Cryptography has become increasingly important in the digital age, where sensitive information is constantly being transmitted and stored electronically.
There are several types of cryptography [6,7], including symmetric-key cryptography, public-key cryptography, and hash functions. Symmetric-key cryptography uses the same key for both encryption and decryption, while public-key cryptography uses two different keys, one for encryption and one for decryption. Hash functions, on the other hand, use a one-way algorithm to generate a fixed-size output from a given input, which is used to verify the integrity of data.
Another way of safeguarding data is through information hiding. Information hiding, also known as steganography [8], is the art and science of concealing a message within another message without drawing any attention to the existence of the hidden message. Steganography uses different types of media, such as images, videos, and audio [9,10], to conceal sensitive information. The most popular media used in steganography are images [11], where secret messages are concealed within the image using different algorithms that may alter the pixels of the image. Image steganography involves embedding a secret message within an image file without affecting its visual appearance or quality. The image used to hide information is usually referred to as the original image. In some cases, preprocessing of the original image is vital before embedding the secret information, and this preprocessing uses the original image to produce another image referred to as the cover image. The cover image or the original image can be used to hide information following different algorithms to produce stego images. A stego image, therefore, is an image that contains secret information. Steganography has two main domains for data hiding: the spatial domain and the frequency domain.
The spatial domain [12] is the most straightforward domain for image steganography, where the secret data are embedded directly into the pixel values of the cover image. There are several techniques in the spatial domain, including the least significant bit (LSB), histogram shifting, and pseudo-random number (PRN). In LSB [13], the least significant bit of the cover image is replaced with the bit of the secret data. In PRN [14], a pseudo-random sequence is generated, and the bits of the secret data are embedded into the cover image based on the sequence. The strength of spatial domain techniques lies in their simplicity and ease of implementation. The proposed method falls under this domain.
The frequency domain is another domain used in image steganography, where the secret data are embedded into the coefficients of the image transform. The most commonly used image transforms in frequency domain techniques are the discrete cosine transform (DCT) and the discrete wavelet transform (DWT). In DCT-based techniques [15], the image is divided into non-overlapping blocks, and the DCT is applied to each block. The secret data are then embedded into the DCT coefficients using techniques such as quantization or matrix mapping.
Image encryption [15] has become more popular because some image encryption methods can be combined with different data-hiding methods from both the spatial domain and the frequency domain to make the methods more robust to attacks by hackers.
Image steganography has several domains of application, each with its strengths and limitations. One of the domains of application is digital forensics. Digital forensics involves the use of steganography to embed and transmit sensitive information within images. In this domain, steganography can be used to embed digital watermarks within images, which can be used to identify the source and ownership of images. Digital watermarks can also be used for copyright protection by embedding ownership information within images, which can be used to identify the owners of copyrighted materials.
Another example of the use of image steganography in digital forensics is the hiding of sensitive information within images during forensic investigations. Another domain where image steganography is frequently used is in the military and intelligence sectors. In this domain, steganography is used for covert communication and information exchange between agencies. Image steganography can be used to hide information within images transmitted over insecure networks. Image steganography is also used in the context of social media to hide sensitive information within images. For example, political activists may use image steganography to share information about their cause without attracting the attention of the authorities.
Steganography can also be used in the field of medical image processing. Medical images, such as magnetic resonance imaging (MRI) and computed tomography (CT) scans, contain sensitive patient information, such as medical history and diagnosis. Such information normally needs to be shared across healthcare providers. Steganography can help to keep the patients’ private information hidden from any attackers.
A steganographic system that incorporates the latest and most advanced techniques and technologies available at the time of its development is known as a state-of-the-art stegosystem. In the context of steganography, state of the art means that the system utilizes the most current and advanced algorithms, methods, and tools available for embedding and extracting hidden information, as well as for securing and protecting that information. State-of-the-art stegosystems are typically designed to be highly secure and resistant to detection and analysis by potential adversaries. To ensure security, the secret message is first encrypted using a cryptographic algorithm to ensure that the message is secure and cannot be easily decrypted by anyone who does not have the decryption key. This encryption is usually carried out in the preprocessing phase. The proposed method introduces an algorithm to cipher the secret message before embedding it to increase security. The proposed preprocessing-stage ciphering algorithm prevents the inclusion of too much auxiliary information in the form of an encryption/decryption key.
The remainder of this paper is divided into five sections. Section 2 discusses related work and the literature. Section 3 describes the proposed method, emphasizing the embedding and extraction procedure. Section 4 details the experimental results of the proposed method. In Section 5, the application of this proposed method is discussed. Section 6 presents the conclusion of the proposed method.

2. Related Work

2.1. Reversible Data-Hiding Scheme Based on Dual Stegano Images Using Orientation Combinations

Lee et al. [16] proposed a scheme based on dual stego images and orientation combinations to achieve high-capacity data hiding while preserving image quality. The embedding process starts with the generation of two stego images. The secret binary message is converted into a base 5 number before the embedding procedure, but this is carried out in two parts. The first five most significant binary bits of the secret message are considered the first secret data. The remaining binary bits are the second secret data. Both of these need to be converted to base 5 numbers, and then the embedding process can take place. A pixel pair is used to embed the secret message following the rules of the embedding tree. Since the key is known, the major and auxiliary pixel pairs can be identified. The first image pixels follow the first part of the tree while the second stego image pixels follow the second part of the tree in terms of the embedding process. The second secret datum is embedded similarly; however, the key is different.
On the receiver side, keys and two stego images are received. The first pairs of pixels are selected on both stego images first. Based on the value of the key, the major pixel pair can be identified and then the auxiliary pixel pair can be identified. Values o and e are then calculated. The rules tree is searched following this calculation. First, o is used and then e follows to identify the value of the base 5 number from the tree. The base 5 number is then converted to binary, and the first secret is achieved. Since the secret was divided during the embedding stage, the second secret message needs to be achieved following the same fashion as the first secret message but using a different key and different pixel pairs. Finally, the first and second secret messages can be combined into one binary number.

2.2. A Square-Lattice-Oriented Reversible Information-Hiding Scheme with Reversibility and Additivity for Dual Images

Su et al. [17] introduced a square-lattice-oriented reversible information-hiding scheme with reversibility and additivity for dual images. In this method, they use a pixel pair to determine the maximum distortion that will be caused by the embedding process. From there, an embedding rule that combines a selected square lattice and the operation rounding is constructed to embed secret messages into two stego images. In this method, the embedding rule is only able to produce 49 characters (between 0 and 48) for the embedding process. Consequently, 1 of 49 different possibilities is embedded into the image. Since 49 different possibilities of embedding can be embedded in two images with two pixels per block, the embedding capacity is log2(49)/4 = 1.4. For both pixels (x, y) of the pixels, the resulting stego pixels can be x − 2, x − 1, x, and x + 1 (the same thing goes for the y pixels).
The recovery process uses the ceiling function to recover the pixels and then uses the recovered pixel to extract the message by subtracting the recovered pixels from the stego pixels. The embedding rule that was used can be derived after this. The embedding rule can be used to look up the value of the secret message from their rules table. It should be noted that in their method, the lattice is used to determine the size of their table with the maximum size being 49. Another thing to note is that the highest distortion that can be caused by this method is 10. Equation (1) is the ceiling function used during the recovery process to recover the image pixels from the stego pixels.
x = x 1 + x 2 2                                 y = y 1 + y 2 2
where x and y are the recovered pixels, and x1, y1, and x2, y2, are the stego pixel 1 and stego pixel 2 pixels, respectively. The two x pixels from the two stego images are first added together and then divided. The recovered x pixel is the x pixel after using the ceiling function. The same thing goes for the y pixel. For example, suppose x1 = 49, y1 = 48, and x2 = 50, y2 = 48; the recovered pixels would be
x = 49 + 50 2 = 50                                 y = 48 + 48 2 = 48

3. Proposed Method

In the proposed method, the original image is divided into 1 × 2 blocks and the secret message is given by the sender. The secret message is used to calculate two values which are then used to figure out which rule to use from Table 1 in embedding the secret messages. The extraction process tries to reverse the embedding process by using the average value of two stego images and the ceiling function to recover image pixels and then using this recovered image and Table 1 to retrieve the secret message. The remainder of this section discusses in detail the framework of the proposed method, preprocessing, embedding, and extraction procedures.

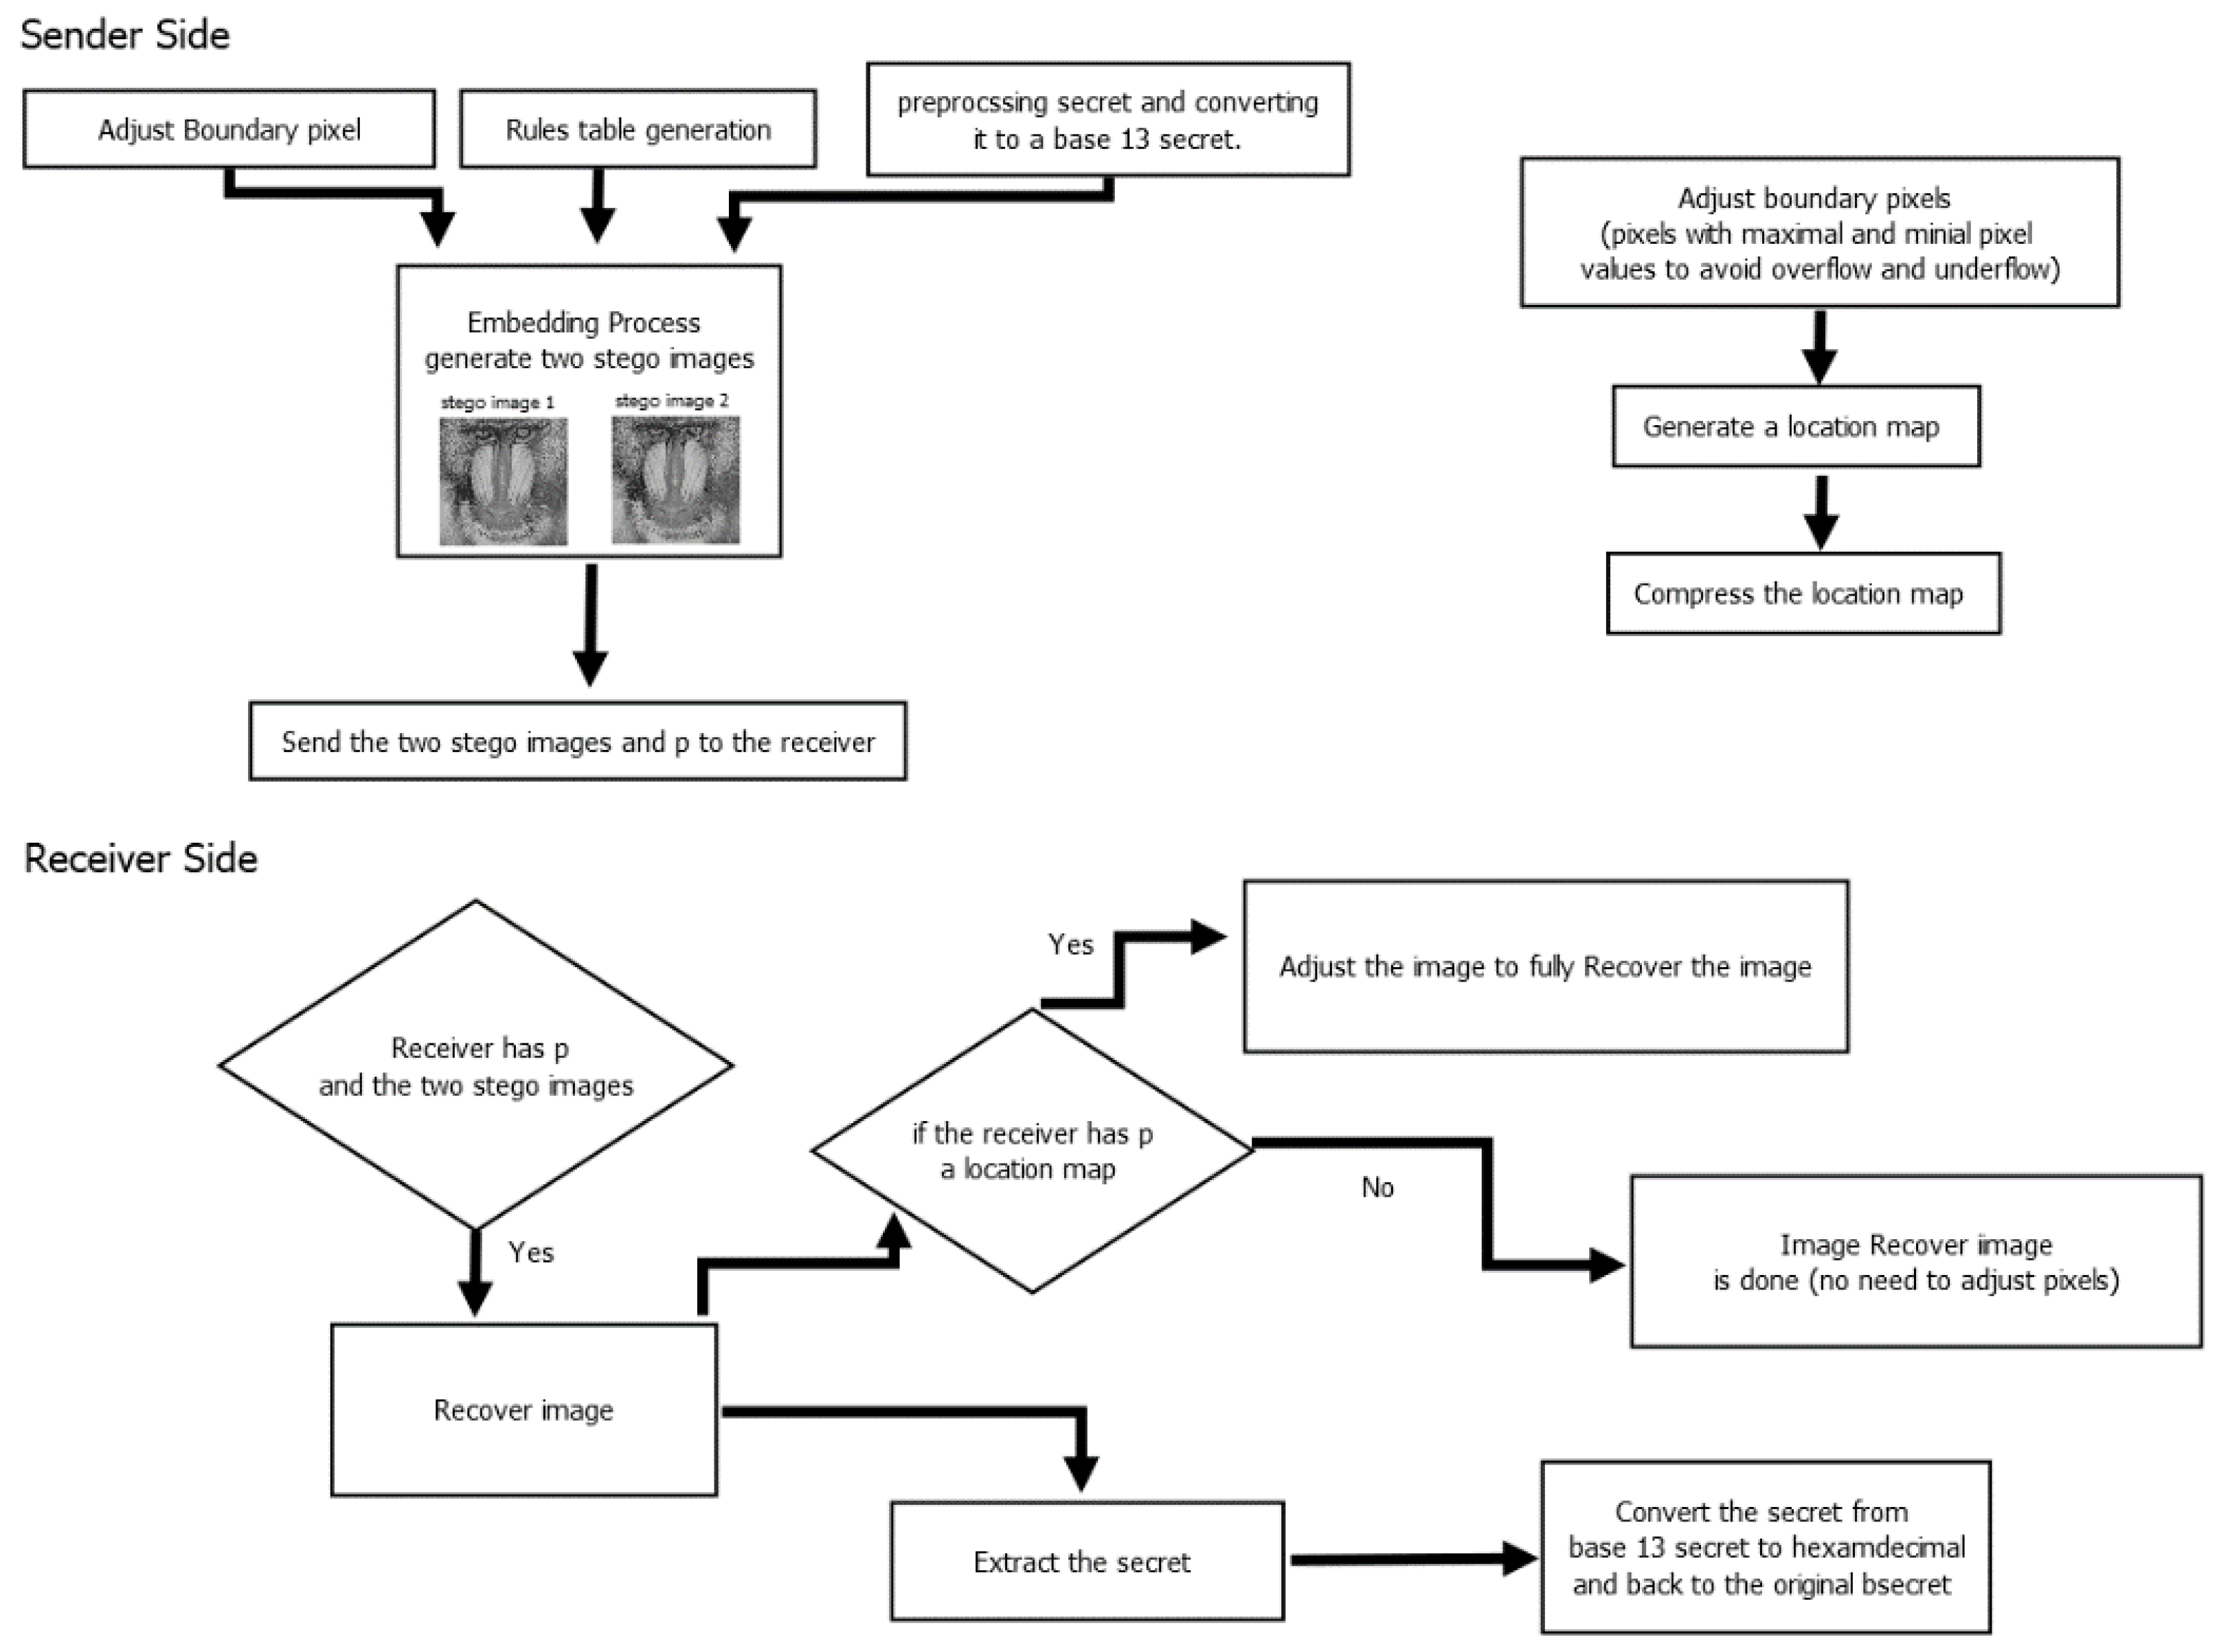
3.1. Proposed Method Framework

Figure 1 is a demonstration of the proposed method framework. As can be seen from Figure 1, first, the images are preprocessed by adjusting boundary pixels to avoid overflow and underflow problems in pixels 0 and 255. During preprocessing, a location map is generated, and the location map is then compressed. A rules table is then presented. Following the algorithm of the proposed method and the rules table, the secret message is embedded, producing two stego images. The two stego images, p, and the compressed location map generated during preprocessing are sent to the receiver. On the receiver side, image recovery is carried out. Using the recovered image, the two stego images, and the rules table, the secret message is extracted from the stego images. A detailed explanation of preprocessing and rules table generation can be found in Section 3.2 and Section 3.3, respectively. The embedding procedure can be found in Section 3.4, while the extraction procedure can be found in Section 3.5.

3.2. Preprocessing

It should be noted that the proposed method can lead to underflow/overflow between the minimal or maximal pixel px values 0 or 255, respectively. These pixels may become −1 or 256, respectively, leading to underflow or overflow. To avoid this problem, preprocessing of the image is carried out whereby the pixel values 0 and 255 are adjusted by 1, i.e., 0 is adjusted to 1, and 255 is changed to 254. A location map lm is generated to represent the location of the adjusted pixels whereby 1 represents the changed pixels and 0 represents the pixels that have not been changed. Equation (2) is used to demonstrate this.
p x n = 254                           if   p x = 255     1                                   if   p x = 0               p x                                       else                                           l m = 1                           if   p x = 255   o r   0   0                               else                                                      
where pxn is the adjusted pixel, and lm is the location map value. Given an image size of V × W, the upper limit representation of the location map size is ls = log2(V × W). In the case of the proposed method (512 × 512), the location map size upper limit is 18. Because not many pixels can have an underflow or overflow problem, the location map will have a large string of zeros, and therefore it can be compressed by using arithmetic coding.

3.2.1. Secret Preprocessing

Secret message preprocessing (sender side):
Step 1: Find the original secret Oms,
i.e., Oms = 11111010110111100000001100001111.
Step 2: Divide the secret into blocks of 16 bits,
i.e., block1 = 1111101011011110, block2 = 0000001100001111.
Step 3: divide each block into two equal sub-blocks sb1 and sb2,
i.e., for block 1, sb1 = 11111010, sb2 = 11011110.
Step 4: Change the order of the secret, allowing sb2 to be the eight most significant bits and sb1 to be the eight least significant bits,
i.e., 11111010 11011110 → 11011110 11111010
Step 5: Perform an exclusive or (XOR) operation on all the bits for each sub-block. The exclusive OR calculation should be the sub-block ⊕ bt where bt = 11111111,
i.e., 11011110 ⊕ 11111111 = 00100001, 11111010 ⊕ 11111111 = 00000101.
Step 6: Convert each sub-block 8-bit binary number to a base 13 number,
i.e., 00100001 = 2713, 00000101 = 513.
The base 13 secret is then hidden in the image following the embedding algorithm.
Secret processing after extraction (receiver side)
Assuming the secret has been extracted following the extraction algorithm, to obtain the original secret, the following steps should be followed:
Step 1: Convert the base 13 secrets back to binary. It should be noted that two blocks from the image need to be used each time to regenerate the secret because of the exchange between sub-blocks that occurred during secret preprocessing from the sender side., i.e., 2713 = 00100001, 513 = 00000101.
Step 2: Perform an exclusive or (XOR) operation for both sub-blocks of the secret just as was done on the receiver side (sub-block ⊕ bt, where bt = 11111111),
i.e., 00100001 ⊕ 11111111 = 11011110, 00000101 ⊕ 11111111 = 11111010.
Step 3. Exchange the two sub-blocks,
i.e., 11011110 11111010 → 11111010 11011110 = the block of 16 bits.
The same process is repeated until the whole secret has been recovered. The 16-bit blocks are concatenated to make the whole secret.
It should be noted that this method ciphers the secret while avoiding overhead information such as an encryption key, which is usually needed to decrypt cipher text on the receiver side. Where more advanced security is necessary, the sender and receiver may decide to use another encryption algorithm, such as AES, to encrypt the secret; however, the cipher text should be converted to a base 13 number prior to embedding. For example, if the hexadecimal cipher text produced after encryption is 1205f616, then the sender and receiver may divide the cipher text into blocks of two digits each, i.e., block 1 = 1216 block 2 = 0516, and block 3 = f616. Each hexadecimal number on each block can then be converted to a base 13 number such that block 1 = 1216 = 2713 and block 2 = 0516 = 513. The converted base 13 number can then be embedded following the embedding process. After extraction, the cipher text can be recovered by converting the extracted base 13 number to a hexadecimal number. Decrypting the message depends upon the encryption algorithm used by the sender and also the decryption key.

3.3. Rules Table Generation

The rules table is presented by finding pairs that add up to a 0 or are at least closer to 0. For instance, considering the rules (x, y − 1), (x, y + 1), the results can be zero-sum. Considering (x, y), (x − 1, y), it can be seen that the result is a −1. This rule is acceptable because the resultant value is closer to zero. The rules table considers value ranges [−1, 1] to change the x and y pixels. The result of such a table is a lower distortion (ds), as can be seen in Table 1. It should be noted that x and y are not coordinates but they represent adjacent pixels. S from Table 1 represents base 13 numbers. Therefore, before using Table 1, each character in the secret needs to be converted to a base 13 number.

3.4. Embedding Process

In the proposed method, the embedding is carried out following the rules from Table 1. For 512 × 512 images, the range of characters that can be embedded is 0 to 262,132. This means that there can be a total of 262,133 entries in the table, with each entry containing one distinct character. In simple terms, although Table 1 shows 13 entries with different characters that can be embedded, this table is extendable to fit a maximum of 262,133 entries, with each entry specifying how all the 512 × 512 pixels can be modified by 0, +1, and −1 for stego image 1 (column 1) and stego image 2 (column 2), such that:
  • In any entry, the difference in the modifications of the two stego images at neighboring pixels is at most 2 (low distortion ds), as seen in Table 1.
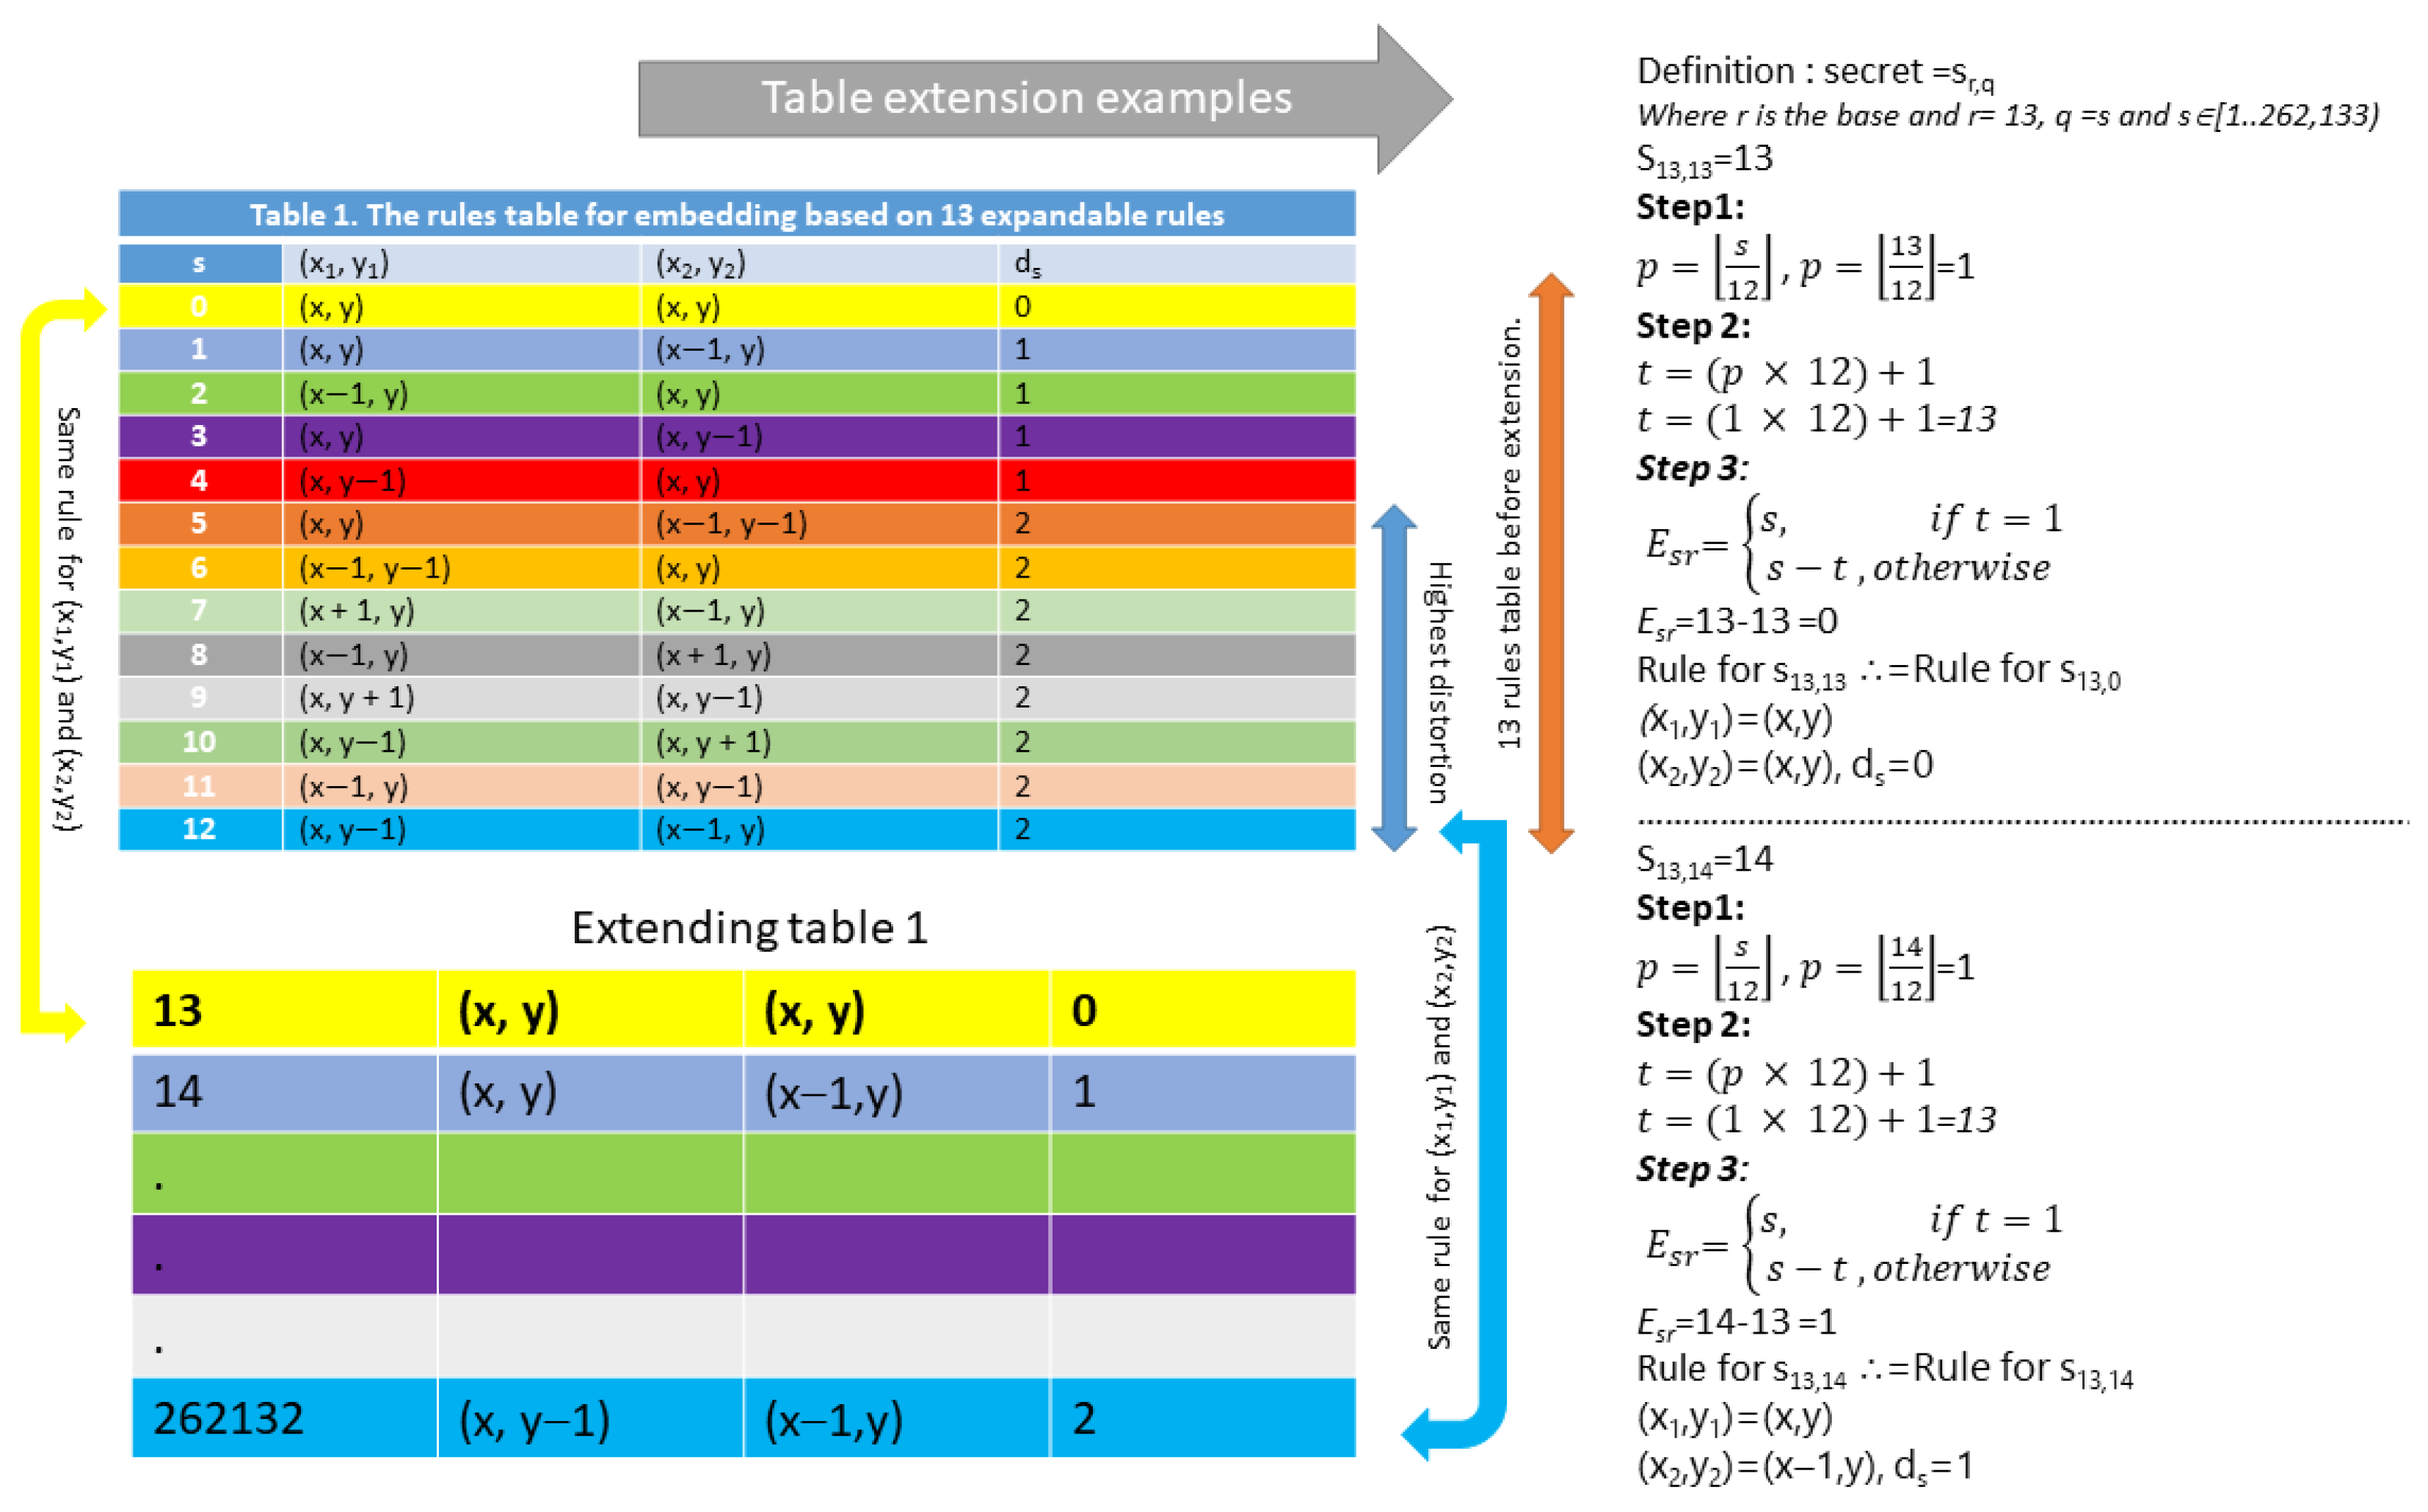
  • The modification entry can be determined uniquely from stego image 1 and stego image 2 (hence extracting the hidden message). For example, during the extraction process, the rules used for embedding can be found, and these rules can be used to look up from the EQUATION to uniquely identify the entry. It should be noted that an additional value p (as defined in Equation (3)) is necessary to determine the actual entry used in the extended table. Figure 2 shows an example of how Table 1 can be extended to a table with 262,133 entries. Examples of the fourteenth and fifteenth entries (s = 13 and s = 14, respectively) are shown. From this figure, it is demonstrated that the table can be extended without altering the 13 rules. Each rule can be used for multiple table entries, and therefore the difference between neighboring pixels does not change when the table size increases. The maximum difference between neighboring pixels (distortion) is 2. Each next entry in the table references an entry that is already in Table 1; however, it should be noted that the table size increases to accommodate cases where the secret has more than 13 distinct characters. The table size depends on the size of the images used. For instance, the proposed method used 512 × 512 image sizes; therefore, the highest multiple of 13 (262,132) that was less than 262,144 (512 × 512) was found to be the maximum secret number, as can be seen in the last row (colored in blue) of the extended table in Figure 2. In Figure 2, the different colors represent entries that use different rules, while the same colors represent entries that use the same rule. Figure 3 demonstrates the embedding procedure. Figure 4 and Table 1 demonstrate the extraction procedure and how the entries alongside p are uniquely used during the extraction process.
All secrets need to be preprocessed prior to the embedding procedure. The preprocessing of the secrets is discussed in Section 3.2.1. The secret to be embedded is the secret in base 13 number format. The rest of the embedding process is described as follows:
Step 1: Divide the 512 × 512 images into 1 × 2 block sizes where each pixel in the block is represented by x and y, respectively, such that we have (x, y), which are adjacent pixels in each block.
Step 2: Divide the given base 13 number secret s by 12 to obtain quotient p, which is to be used in the next calculation. It should be noted that p shall also be used during the extraction procedure. Equation (3) is used in this calculation of p:
p = s 12
where the quotient p is the starting multiple and s is the secret.
Step 3: Since the embedding process only uses Table 1 for embedding, values greater than 12 ultimately have to have an assumed starting value p. The starting value p for Table 1 is 0, and for a secret s less than 12, starting values will always be considered to be zero. However, for a secret s greater than 12, t needs to be calculated by multiplying the quotient p by 12 and then adding 1. Equation (4) is used to complete this calculation.
t = p × 12 + 1
Step 4: After finding t, the next thing to do is to compute which rule from Table 1 should be used in the embedding process. To find the embedding rule Esr to be used, t should be subtracted from the secret s. Equation (5) is used in this calculation:
  E s r = s ,                   i f   t = 1             s t   , o t h e r w i s e
The rules corresponding to the calculated Esr are used to adjust the x, and y pixels for both sets of x and y are employed to obtain the pixel values of the two new stego images. The stego images and p are sent to the receiver side for extraction and recovery. The embedding algorithm pseudocode of the proposed method is shown in algorithm 1.

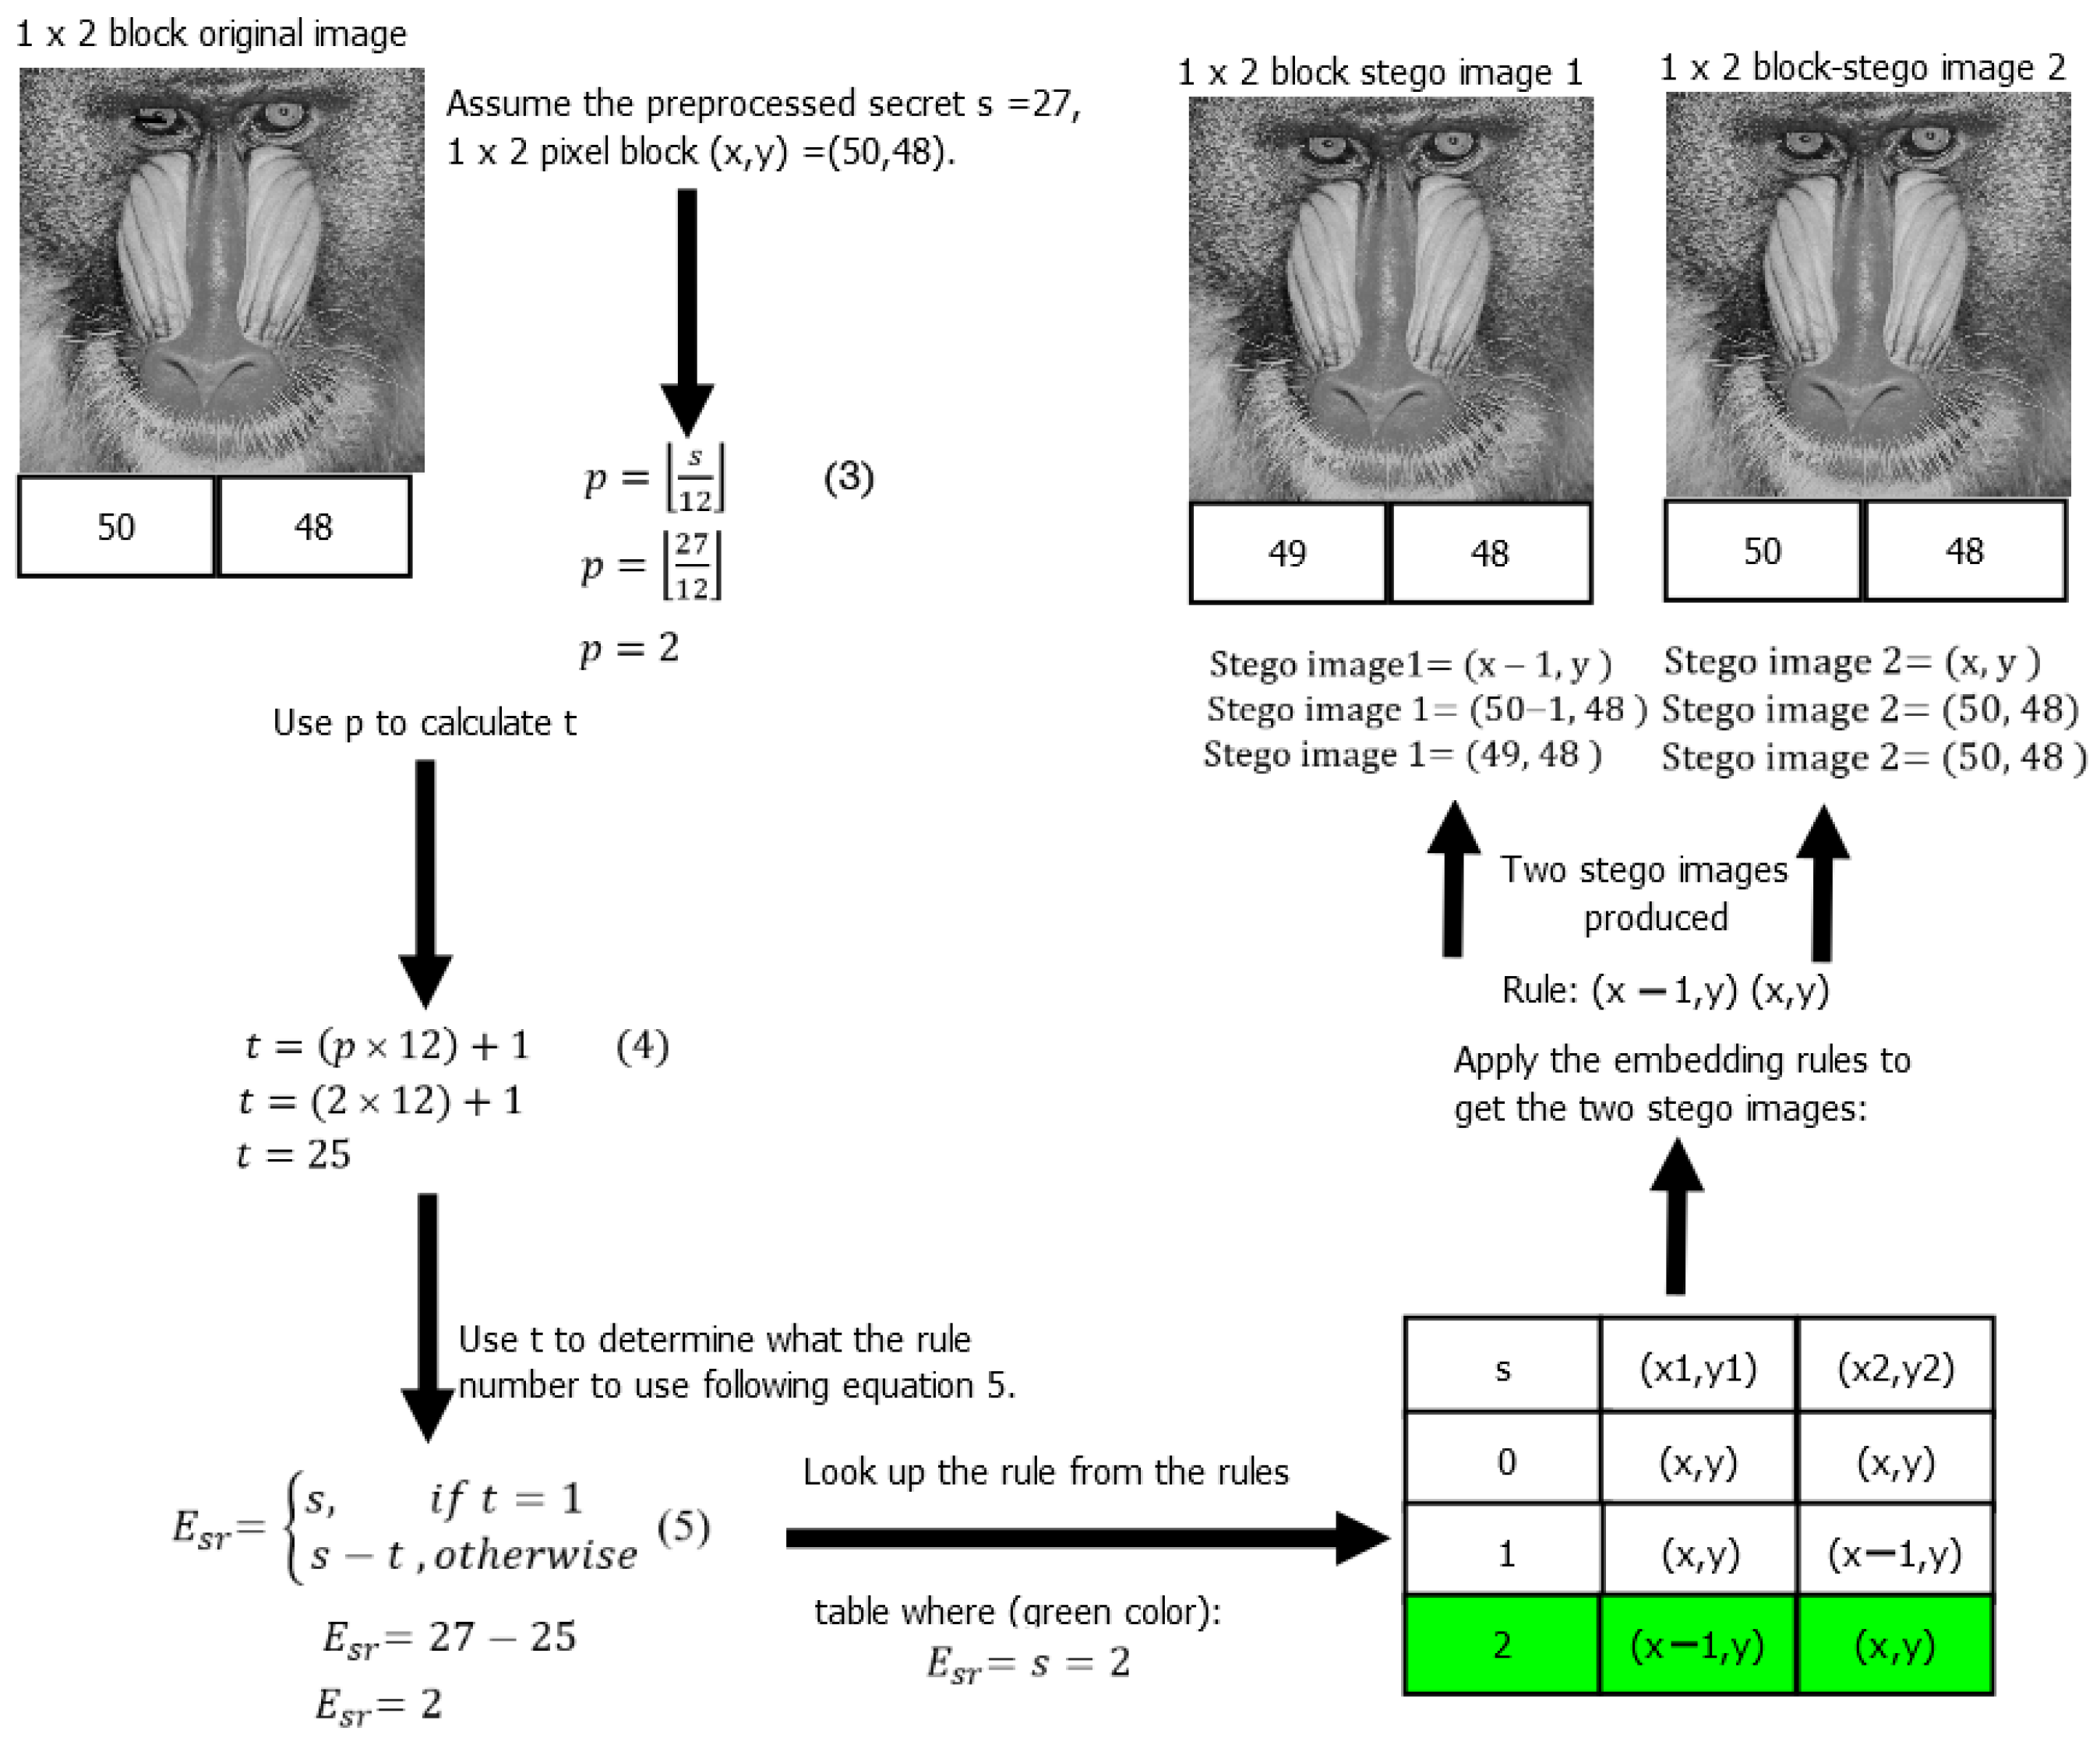
3.5. Embedding Example

Figure 3 provides an example of the embedding process, assuming that the given secret s (after conversion to the base 13 number format) is 27 and the given block pixels (x, y) are (50, 48). After applying rule 3, p = 2 is realized. Since 27 is greater than 12, t needs to be calculated, and after applying Equation (4), t = 25. From there Esr can be calculated by using t = 25 and the secret s = 27. After applying Equation (5), Esr = 2. Using the rules corresponding to secret s = 2 in Table 1, the two stego image pixels can be calculated as follows:
  • Stego image 1 = (x − 1, y), stego image 2 = (x, y)—From Table 1.
  • Stego image 1 = (50 1, 48), stego image 2 = (50, 48).
  • Stego image 1 = (49, 48), Stego image 2 = (50, 48).
The embedding algorithm of the proposed method is summarized below (Algorithm 1):
Algorithm 1 Embedding Algorithm Pseudocode.
Input: secret data s, cover image CI.
Output: 2 stego images
for i = 0 …H − 1 do
    For j = 0 …W − 2 do
       block = [(x, y), (x, y + 1)
       p = floor(s/12)
       if s < 12 then
           t = 1;
       else
           t = p × 12 + 1;
       end if
       if t = 1 then
           Esr = s;
       else
           Esr = s − t;
       end if
       stego1_block=[];
       stego2_block=[];
       for pixel in block do
           adjust stego1_pixel &stego2_pixel using rules;
           stego 1_block.append(stego1_pixel);
           stego2_block.append(stego2_pixel);
       end for
     end for
end for

3.6. Extraction and Recovery Process

After receiving p and the two stego images, the next thing to do on the receiver side is to recover the original image and extract the secret message.
The recovery process is carried out via the following steps:
Step 1: Divide the two stego images into 1 × 2 blocks. Obtain the two stego image pixel values for both (x, y) as (x1, y1) and (x2, y2) and use Equation (1) to recover the image.
Step 2: After the recovery process, the recovered adjacent pixel values (x, y) can be subtracted from the two stego pixel values to generate the rule that was used in the embedding process. This can be realized using Equation (6).
x 1 r = x 1 x ,   y 1 r = y y ,   x 2 r = x 2 x ,   y 2 r = y 2 y
Step 3: Once the rule has been established, the next thing to do would be to look up the rule from Table 1 to find out which secret number was used during the hiding process.
Step 4: Since p is known by the receiver, p can be used to calculate t using Equation (4).
Step 5: Once t has been calculated, the next thing to do would be to add t to the secret number from Step 3 to obtain the secret message. The secret message achieved from this step has to be further processed, as discussed in Section 3.2.1, to recover the message fully after extracting it from the image. The exctaction process pseudocode is shown in algorithm 2.
The extraction and recovery algorithm is summarized as follows (Algorithm 2):
Algorithm 2 Extraction and Recovery Algorithm Pseudocode.
Input: p, stego_image_1, stego_image_2.
Output: secret data s, cover image CI.
lookup_table = {table used during embedding process};
recovered_image = …;
rule = {};
  for i in range(stego_image_1.width):
    for j in range(stego_image_1.height):
    x1, y1 = stego_image_1.get_pixel(i, j);
    x2, y2 = stego_image_2.get_pixel(i, j);
    x = (x1 + x2 + 1)//2;    y = (y1 + y2 + 1)//2;
    recovered_image.set_pixel(i, j, (x, y));
    rule[(i, j)] = (x1 − x, y1 − y, x2 − x, y2 − y);
  end for
end for
secret_message = ‘ ’;
for i in range(stego_image_1.width):
  for j in range(stego_image_1.height):
    key = (rule[(i, j)][0], rule[(i, j)][1]);
    secret_number = lookup_table[key];
    t = p × 12 + 1;
    secret_message + = t+secret_number;
  end for
end for

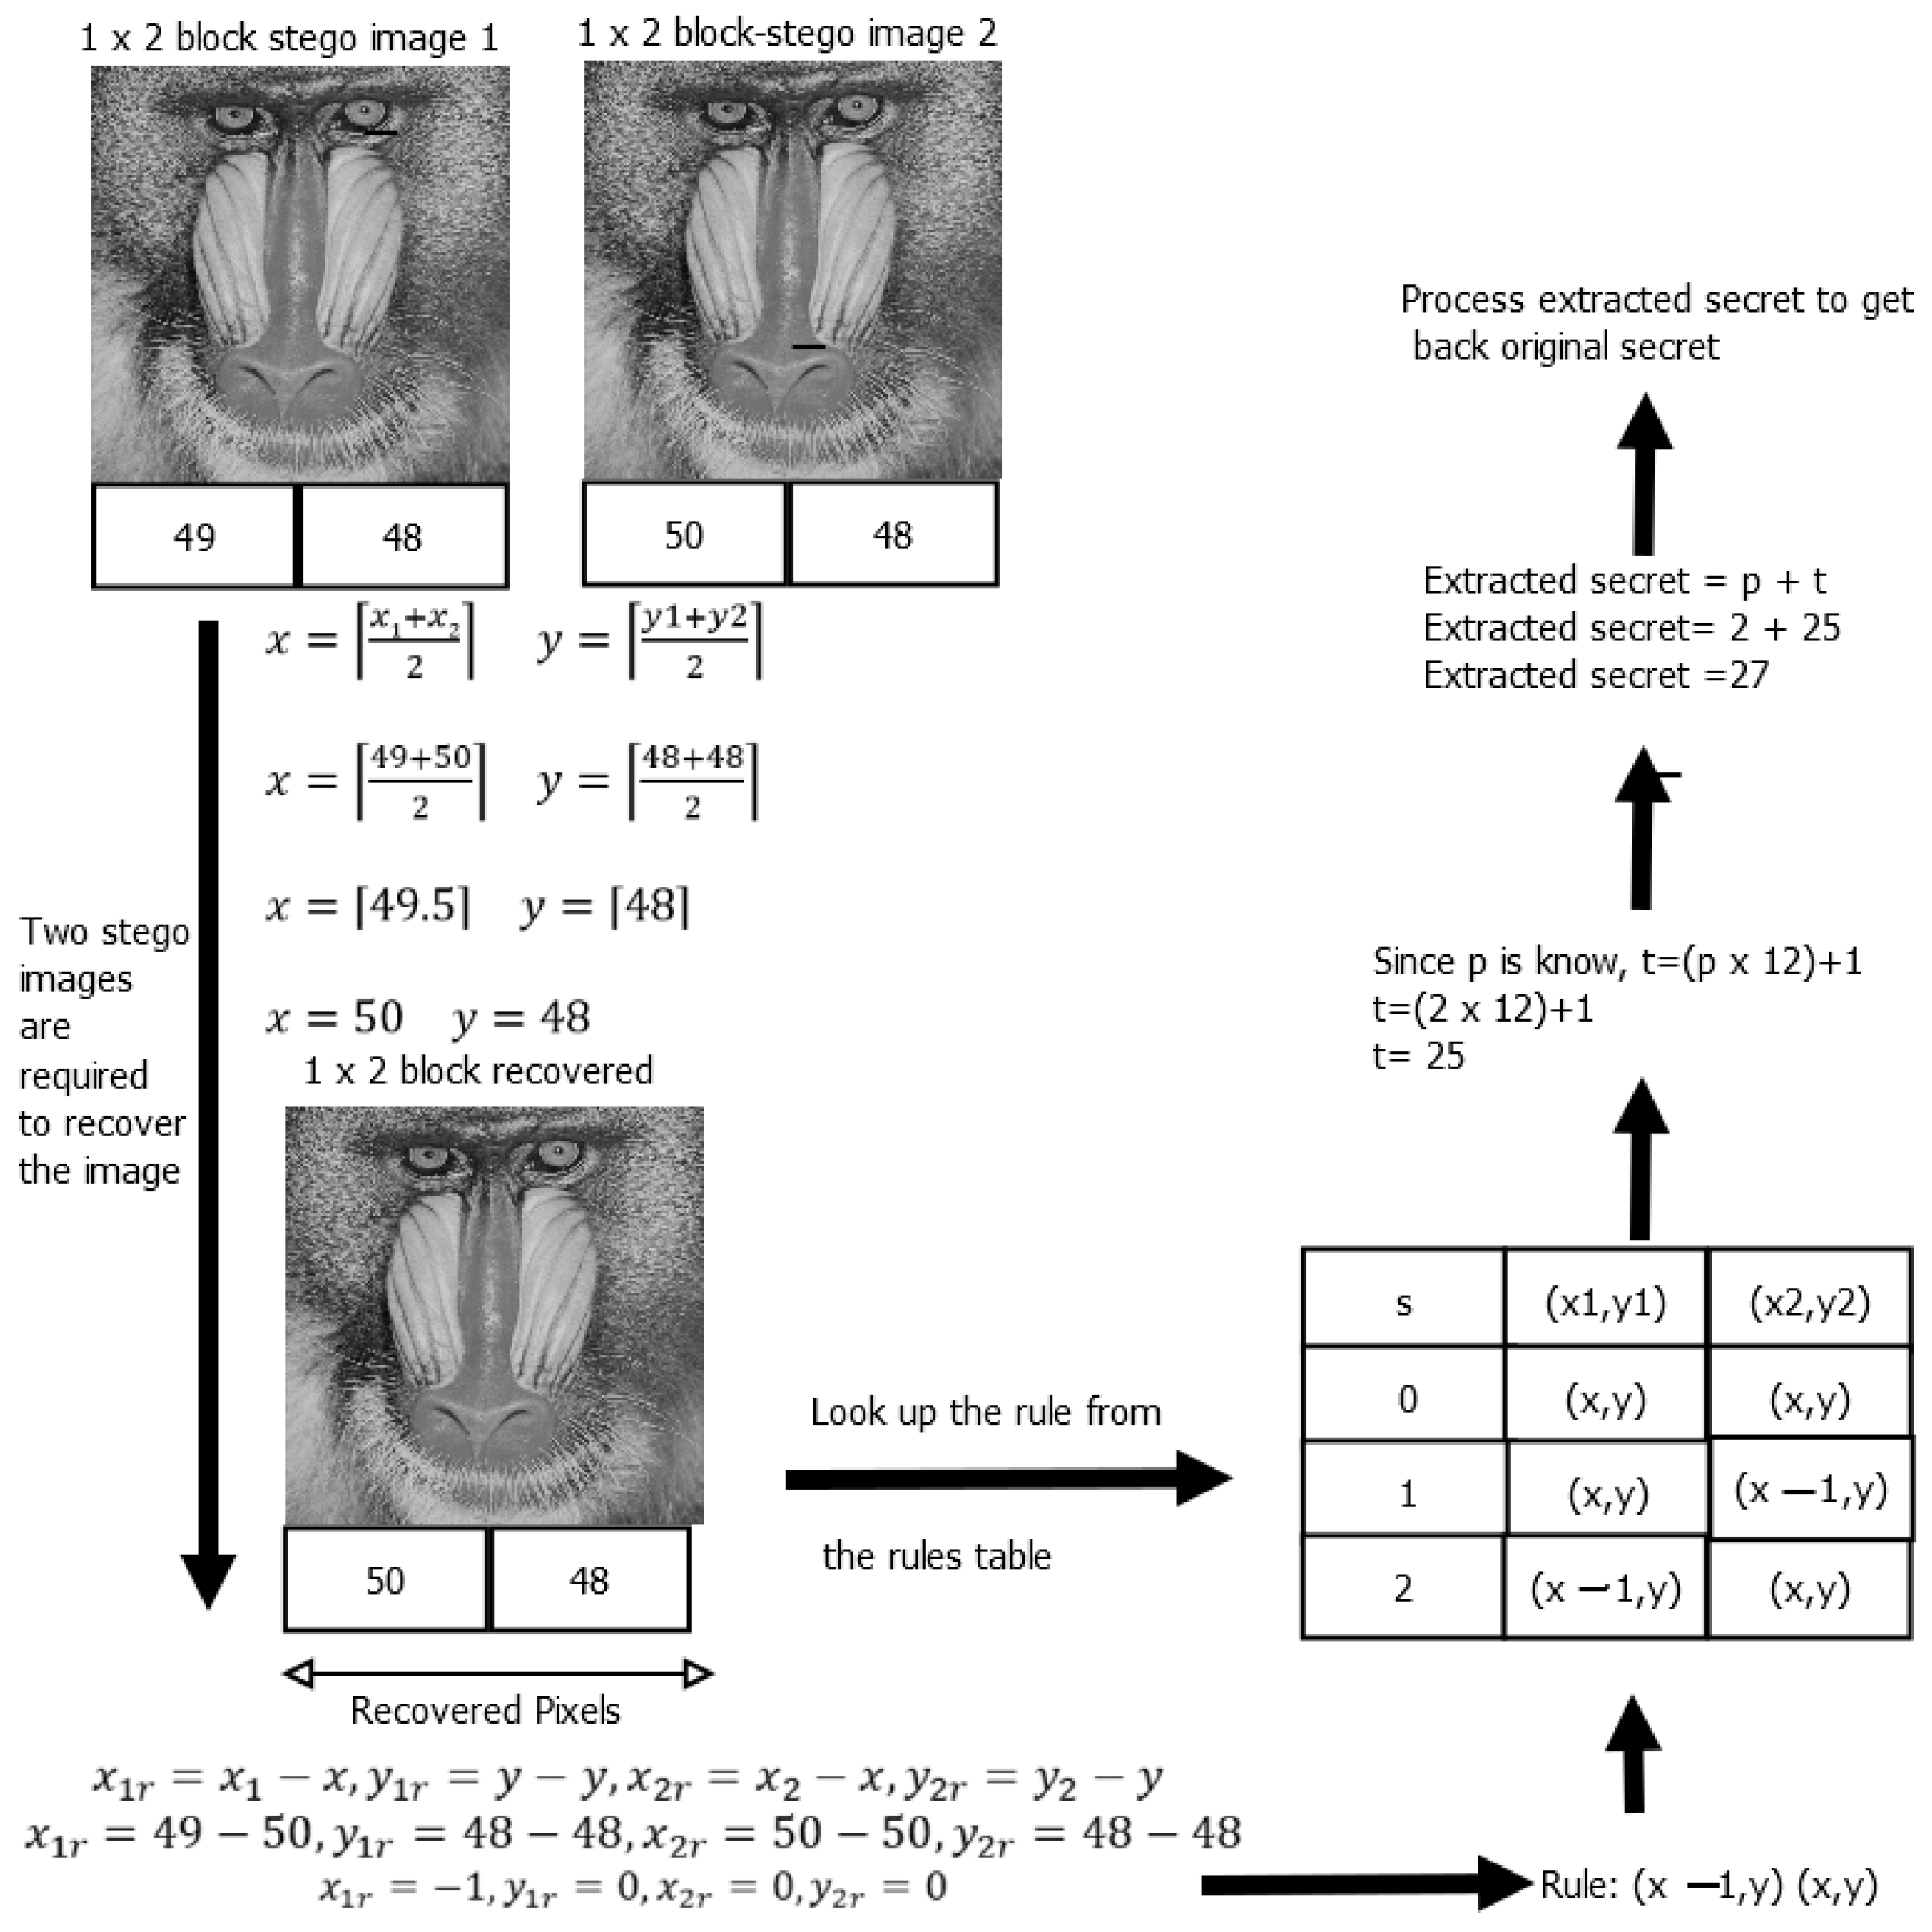
3.7. Extraction and Recovery Example

Figure 4 provides an example of the extraction and recovery process. Assuming that the two stego image pixels are (49, 48) and (50, 48), respectively, as per the embedding process, the first thing to do would be to try and recover the pixels by using Equation (1). The recovered pixel values would be (50, 48). Using Equation (6), the embedding rule can be found as such: (49 − 50, 48 − 48), (50 − 50, 58 − 58) = (−1, 0), (0, 0) = (x − 1, y), (x, y). The rule can be looked up in Table 1 to find the secret s = 2. The given p is 2; therefore, t can be calculated using Equation (4), such that t = (2 × 12) + 1. The final step would be to add the secret and t to determine the extracted secret (extracted secret = 25 + 2). The extracted secret value is therefore 2713.

3.8. Additional Information

It should be noted that p can be compressed using Huffman coding before sending it to the receiver to decrease the amount of auxiliary information. A randomized p array size of 18,648 bytes was compressed to 632 bytes using Huffman coding in this method. This, therefore, means that the auxiliary information sent to the receiver will not necessarily be large.

4. Experimental Results

To demonstrate the proposed method, experiments were performed regarding imperceptibility, image quality, and security analysis. The experiments were conducted on a MacBook Pro M1 with 8 GB RAM. All the experiments were conducted using python 3 running on Spyder. Nine classic grayscale images with a size of 512 × 512 were used as test images during the experiments, and these were adapted from the USC-SIPI [18] database. The time complexity of the proposed algorithm is O(N2), where N is the dimension of the image used. The space complexity of the proposed algorithm is O(N), where N is the number of pixels in the original image. Two statistical analyses were used to determine the superiority of the proposed method, and these are the peak signal-to-noise ratio (PSNR) and the embedding rate (ER). To demonstrate the security of the proposed method, an RS steganalysis was conducted. Some of the images that were used in the experiment include Lena, Baboon, Elaine, Lake, Boat, Peppers, Barbara, and Goldhill. Figure 5 shows some of the grayscale images used in the experiments.
The peak signal-to-noise ratio, PSNR, is an expression for the ratio between the maximum (MAX) possible value of a signal and the power of distorting noise that affects the quality of representation. It is used to carry out a quantitative comparison of images or signals. It is a mathematical equation that expresses the ratio between the power of a signal and the actual distortion noise that may affect its quality demonstration. The PSNR is used to measure the distortion of images in image steganography.
A low PSNR value relates to a distorted image. The human eye cannot detect PSNR values greater than 30, so good steganography schemes will produce values greater than 30 dB. The PSNR value depends on the mean square error, MSE. The mean square error (MSE) shows the average of the squares of the errors between a noisy image and the actual image. Equation (7) is the general equation for calculating the PSNR.
P S N R = 10 · l o g 10 M A X 2 M S E
where MAX is the maximum signal value that exists in the original image and MSE is the mean square error.
In the case of the proposed scheme, 8-bit grayscale images were used, and therefore the MAX value used was 255. The PSNR equation used is Equation (8).
P S N R = 10 · l o g 10 255 2 M S E
The SSIM index is used to evaluate the quality of the stego image(s). A stego image with a value closer to 1 denotes a good-quality image. The SSIM can be computed using Equation (9).
S S I M = 2 μ x μ y + c 1   2 σ x y + c 2 μ x 2 + μ y 2 + c 1   σ x 2 + σ y 2 + c 2
where   μ x ,   μ x 2 ,   σ x 2 , and   μ y ,   μ y 2 , σ y 2 are the mean pixel number, variance, and the standard deviation of the original image and the stego image, respectively. 2σ μ x μ y is the covariance for the original and stego images. It should be noted that c 1   and c 2   are constants, where c 1    = k1L and c 2    = k2L. The value of k1 = 0.01, k2 = 0.03, and L is 255.
Refs. [16,17] and refs. [19,20,21] are dual stego methods previously proposed by other researchers. The experimental results of the proposed method were compared to the experimental results of these above-mentioned methods. The embedding capacity relates to the total number of bits that can be embedded in each pixel (bit per pixel; bpp). Guo et al. [9] produced an average EC of 1.4 bpp, Lee et al. [19] demonstrated an average EC value of 0.74 bpp, and Lee and Huang [16] demonstrated an EC value of 1.04 bpp. Liu and Chang [20] produced an EC value of 1 bpp, while Lin et al. [21] produced an EC value of 1.25 bpp. The embedding capacity relates to how much data can be hidden in the image using the proposed algorithm. A higher embedding capacity relates to the algorithm being able to conceal more data in the image. This is to say that a higher embedding capacity is preferred over a lower embedding capacity. The number of bits (secret bits) that the proposed method can hide in each pixel is 4.25 bpp. This 4.25 bpp embedding capacity is greater than the number of bits that the rest of the compared methods can hide in each pixel. The proposed method performs better than all the compared methods in terms of embedding capacity. It should be noted that Guo et al.’s method [9] is more similar to the proposed method but the number of table entries it can produce is really low, as already explained in the Related Works section. The proposed method produces a significantly high EC value of 4.25 =( l o g 2 262133 2 4 ) bpp. This is because, while the proposed method uses a simple algorithm, the embedding rules shown in Table 1 can be replicated to make a table with many entries (each entry has a distinct character, as mentioned before). This, therefore, shows that the proposed method is superior to the other compared methods.
Dual stego image methods result in two stego images, and as such, two PSNR values can be expected. The experimental results show the proposed method demonstrated an average PSNR value of 52.65 dB, justifiably so, as the proposed method has the least distortion. Lee et al.’s [19] method had an average PSNR value of 52.48 dB. Huang [8] demonstrated an average PSNR value of 49.38 dB, while Guo [9] demonstrated a PSNR value of 47.62 dB. Liu [20] showed a PSNR value of 48.71dB, and Lin [21] had a PSNR value of 47.47 dB. It should be noted that the average PSNR value was calculated by first combining the two PSNR values (PSNR 1 for stego image 1, and PSNR 2 for stego image 2). All these compared PSNR values are lower than the PSNR value demonstrated by the proposed method. Based on this comparison, it can be concluded that the proposed method outperforms the compared methods.

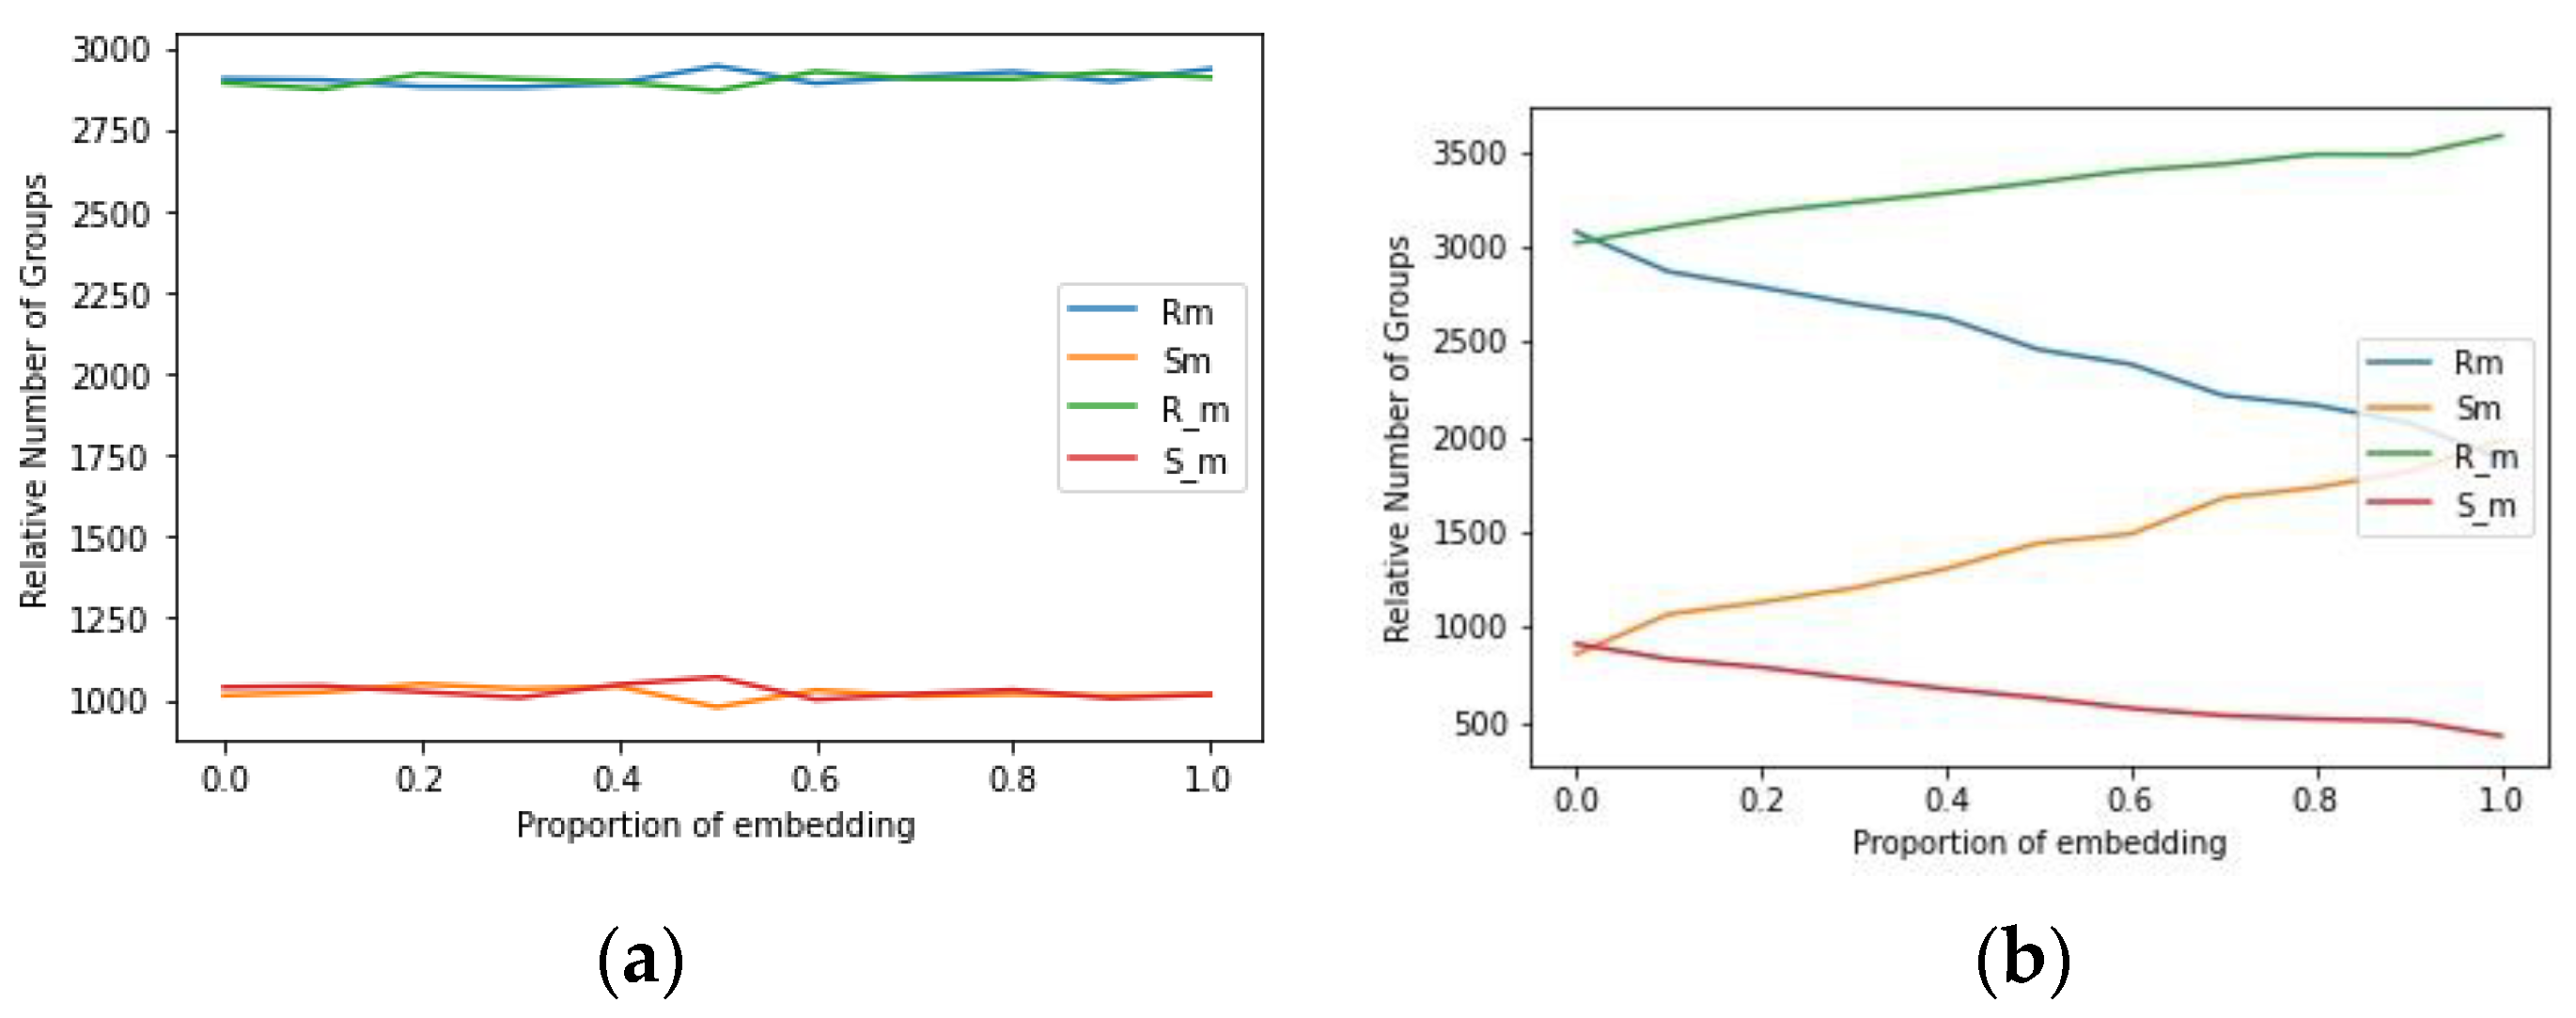
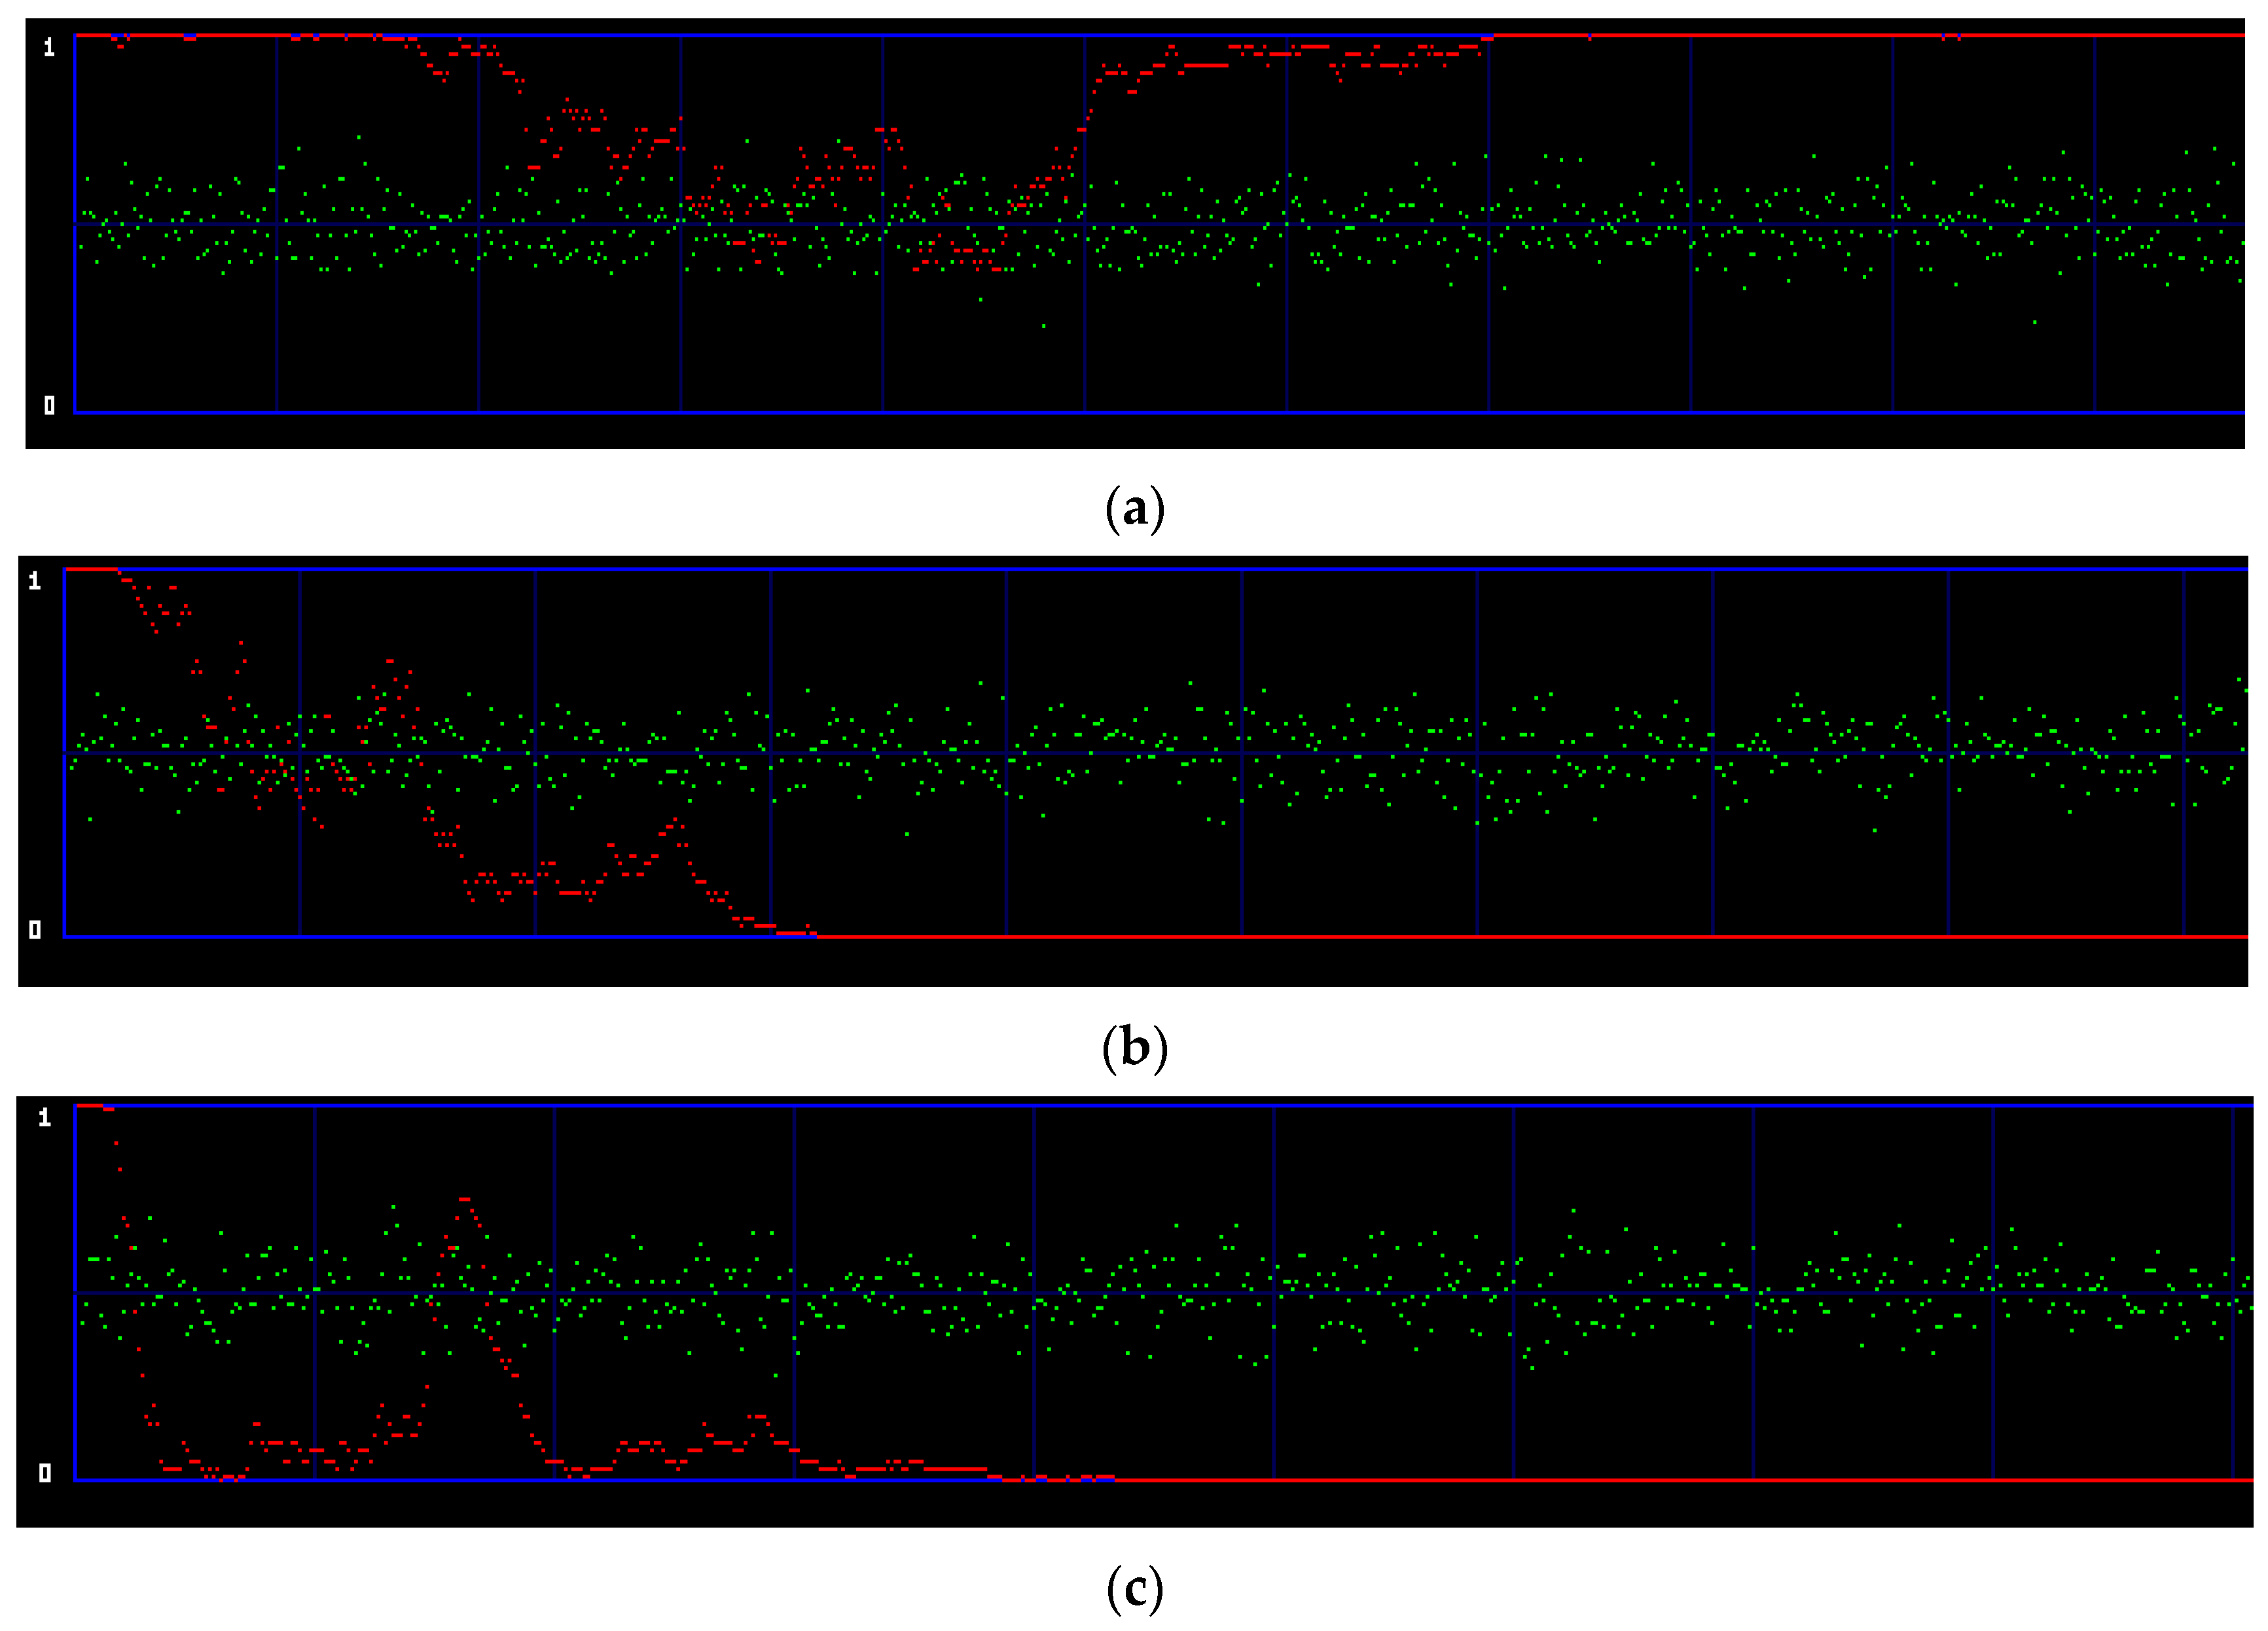
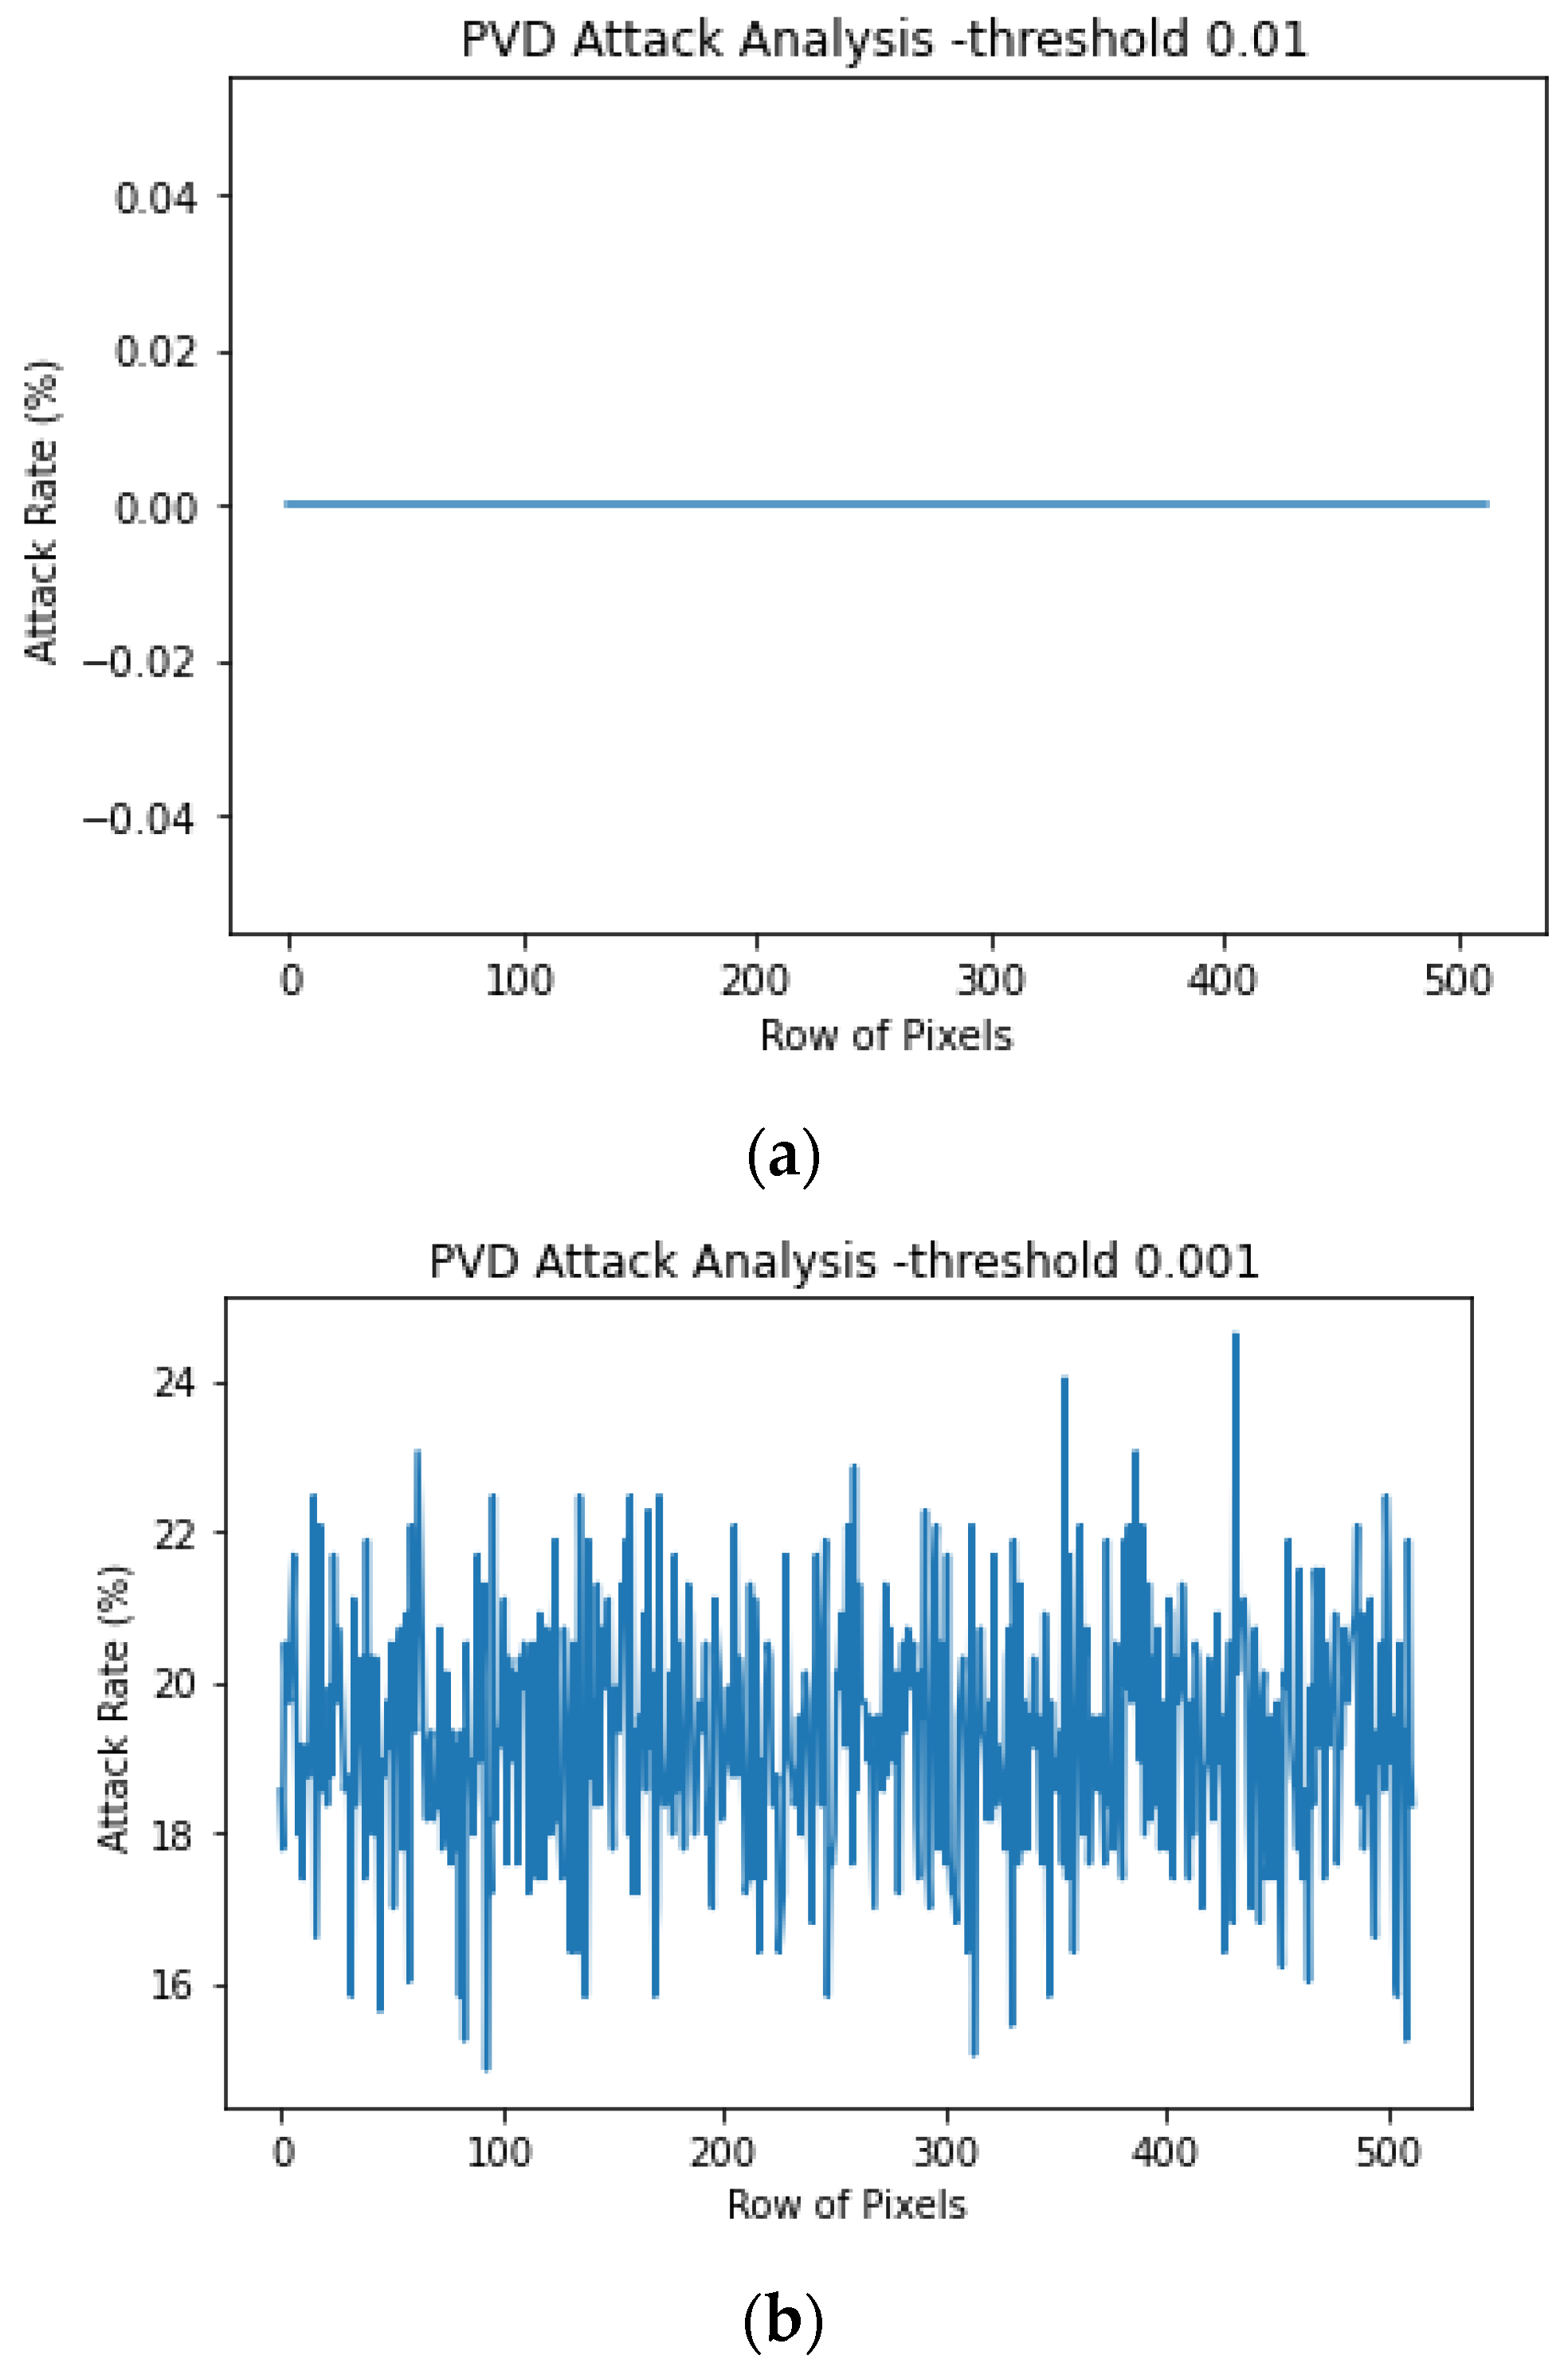
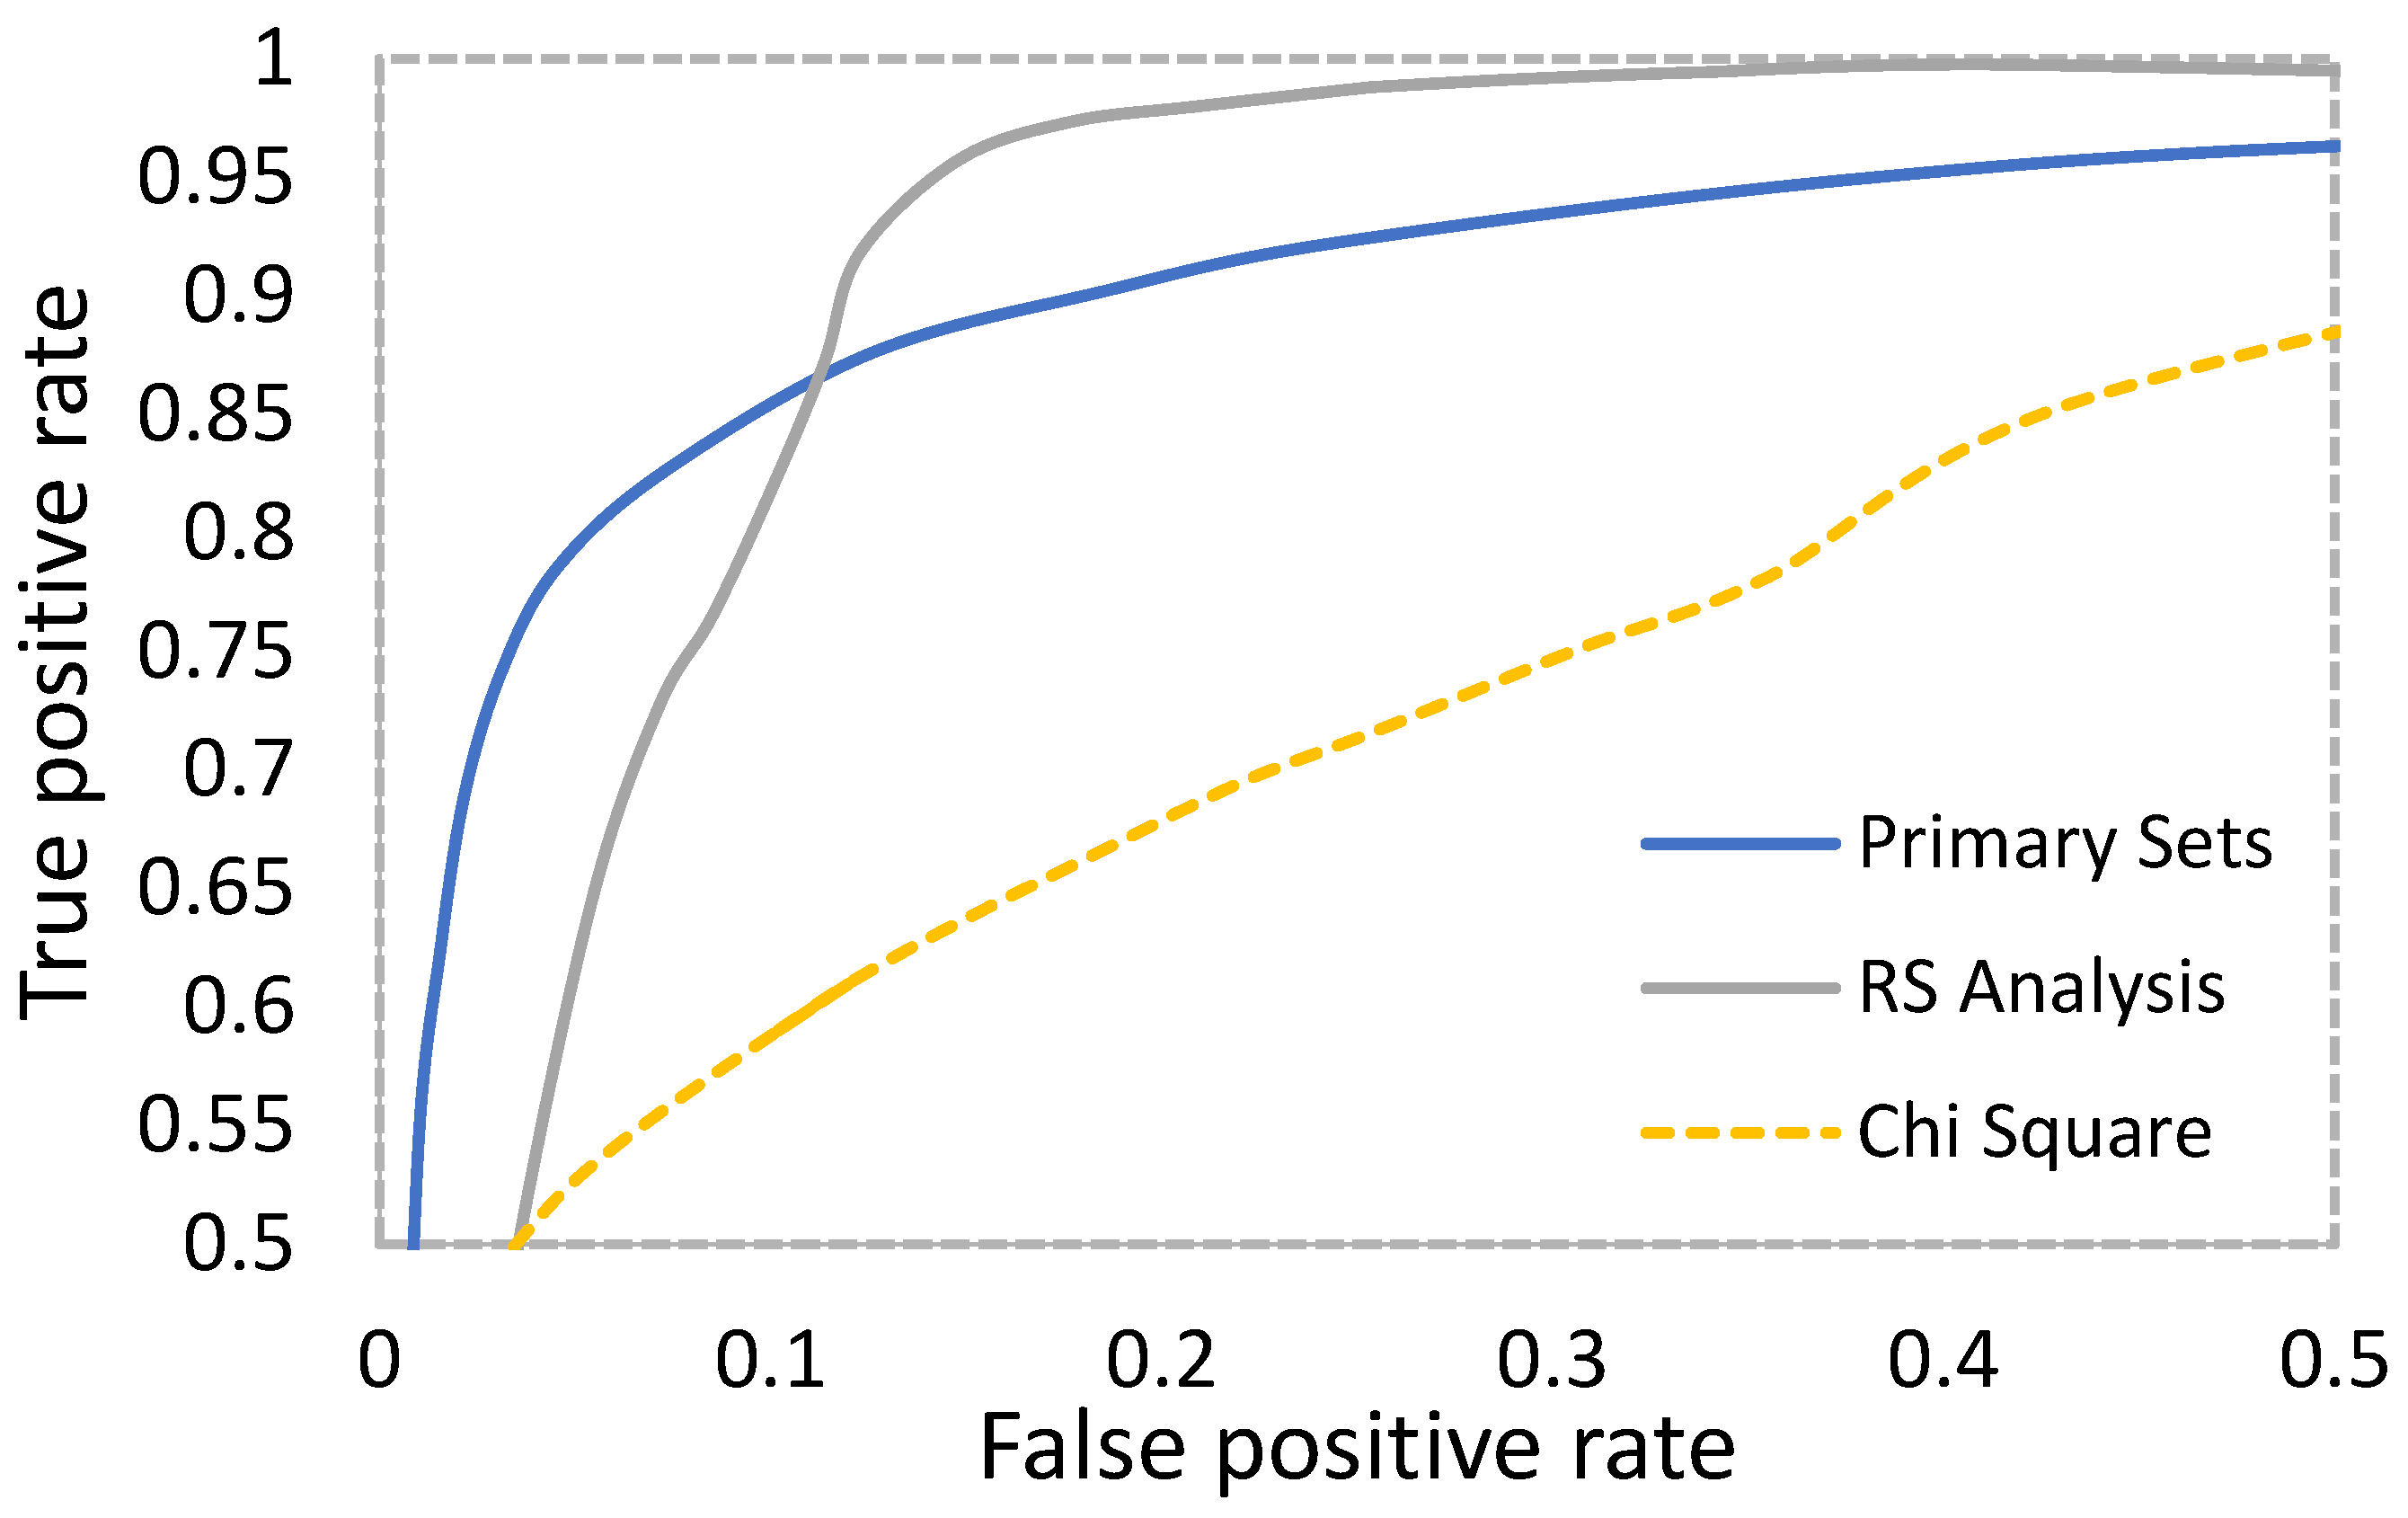
4.1. Security Analysis

In this section, the security of the proposed techniques against (1) Reed–Solomon and (2) chi-square steganalysis is presented. Analysis against RS is carried out to show the resistance to attacks of the proposed technique. The RS (Reed–Solomon) attack test in image steganography is a type of cryptographic attack that attempts to detect the presence of hidden information within an image by exploiting the properties of the Reed–Solomon error correction code. The RS attack test works by generating a set of test patterns and embedding them within the image using the same steganographic technique as the one used to hide the information. The test patterns are designed in such a way that they introduce specific errors in the image that can be detected by the Reed–Solomon code. The presence of these errors indicates that the image has been modified, and there may be hidden information present. RS analysis is therefore a method to detect changes in the regular and singular groups with an increase in the embedding capacity. An explanation of the singular and regular groups can be found in ref. [22]. The proposed method stego images can only pass the RS steganalysis attack if the differences between the two groups are limited to a minimum value; otherwise, it fails. To conduct the RS analysis, initially, the pixels are classified into three groups, as follows:
(a)
The regular groups with RM and R-M;
(b)
The singular group with SM and S-M;
(c)
The unusable group.
Generally, in RS steganalysis, neighboring pixels can be divided into two groups, and then a discrimination function can be applied to each of these groups to measure their noisiness. Larger differences between pixels in a group result in higher noisiness. Simulated noise can be added and then a discrimination function may be applied to modify the noise and compare the results to those of the same unmodified group. Represented as (a) is the group where noisiness increases while (b) represents the group where noisiness decreases. The groups where the noisiness is not varied are represented as (c). The discrimination function (DF) is used to find the magnitude of the respective pixel blocks for parameters RM, R-M, SM, and S-M. The x-axis of the RS plot represents the percentage of EC and the y-axis represents the percentage of regular or singular groups. The condition RMR-M > SMS-M suggests that the approach successfully resists the RS attack. In contrast, however, the condition RMSM > R-M – S-M exposes the approach against RS attacks. Figure 6 shows the RS plot for the Zelda image. It can be observed from the curves of the RS graphs that the condition RMR-M > SMS-M is satisfied for all images in Figure 6a. This means there is no presence of the RS code errors using the proposed technique. Therefore, this technique proves to be undetectable by RS analysis, unlike the 1-bit LSB method shown in Figure 6b. Figure 6 shows the RS analysis experimental results of the proposed method and the 1-bit LSB.
Chi-square attack is a statistical method used to detect the presence of hidden data in an image using steganography. In image steganography, data are embedded within the image by modifying the pixel values in a way that is not easily noticeable to the human eye.
The chi-square test is based on the statistical principle that the observed frequency of occurrence of a particular event should be close to the expected frequency of occurrence if there are no hidden data in the image. If the observed frequency deviates significantly from the expected frequency, it indicates that there is a high probability of hidden data in the image. The most common result of embedding information into images using algorithms such as least significant bit (LSB) sequential embedding is an increased likelihood of creating pairs of values (POVs). In LSBs, this happens because only the first bit is changed to 0 or 1 for all pixels, creating a sequence. In short, while embedding the secret information into an image using an algorithm that creates POVs, the frequencies of 2k and 2k + 1 become more equal or close to being equal.
The chi-square attack was designed to detect these near-equal POVs in images (stego images). In simpler terms, the chi-square attack is a method of testing the security and robustness of the image after embedding information compared with the probability analysis of the original image to check and assess the difference between them. If the difference is near 0 or is 0, then that means there is no information inside the image, whereas if the difference is closer or equal to 1, that means there is some information inside the image. In image steganography, it is best that no one knows or detects that there is secret information hidden in the image, so the difference for a good algorithm that can withstand chi-square attacks should be much closer to zero for most, if not all, the pixels in the image.
The process of calculating the chi-square is as follows:
  • Find out the total number of POVs of the image.
  • Sort the pixel values and calculate the average of the j-th group of pixels to the total concurrencies using Equation (10).
n j * = T o t a l   n u m b e r s   i n d e x   2 j + 2 j + 1 2
3.
Compute the representative number of pixel value pairs in the j group, where nj = numbers of index 2j.
4.
Compute the chi-square statistics using Equation (11).
x k 1 2 = j = 1 k n j n j * 2 n j *
5.
Use the chi-square distribution characteristics to compute the image-hiding probability p using (12).
p = 1 1 2 2 k 1 2 Γ k 1 2 0 x k 1 2 e x 2   x k 1 2 1 d x
Figure 7 shows the chi-square attack analysis for the 1-bit LSB method and the proposed method using the Zelda image. To properly show an extended view of the differences, the graphs shown in the figure were flipped horizontally. It should be noted that tests regarding this attack were not only carried out on the image (Zelda) shown in Figure 7, but Figure 7 is enough to reflect that which was also reflected while using different images in the experiments. The red line in the graph represents the difference. The line can be between the range of 0 to 1 to reflect whether or not the images have information. As can be seen in Figure 7a, the red line on the graph is much closer to 1, which means that the differences are closer to 1 and therefore reflects that there is information hidden in the image. In other words, it means the observed frequency deviates significantly from the expected frequency. This, therefore, means that the 1-bit LSB method is not able to withstand the chi-square attack. Figure 7b,c show the proposed method under the chi-square attack for stego image 1 and image 2 using Zelda. As can be observed here, the red line is mostly closer to zero for both of these graphs, and therefore the chi-square attack cannot detect any hidden information in these images since the observed frequencies do not deviate significantly from the expected frequency. Therefore, the proposed method can withstand chi-square attacks.
PVD (pixel value differencing) attack analysis is a steganalysis technique that aims to detect the presence of hidden information in a stego image by analyzing the differences between adjacent pixel values. It is based on the fact that most steganographic algorithms modify the pixel values in a way that is imperceptible to the human eye, but creates detectable patterns when analyzed statistically.
The basic idea of PVD attack analysis is to calculate the differences between adjacent pixel values in the image, and then analyze the statistical properties of these differences to detect any patterns that may indicate the presence of hidden information. The formula for calculating the PVD value between two adjacent pixels (x, y) and (x + 1, y) is
P V D x , y = I x , y I x + 1 , y
where I(x,y) is the intensity of the pixel (x, y) in the image.
To perform PVD attack analysis, the PVD values for all adjacent pixel pairs in the image are calculated, and then statistical analysis techniques are applied to detect any patterns or anomalies in these values that may indicate the presence of hidden information. Figure 8 shows the PVD attack of the stego image produced by the proposed method on two different threshold values, 0.01 and 0.001. A threshold of 0.01 produces an attack rate of 0.00, which means that the proposed method is robust against PVD attacks, as shown in Figure 8a. However, when the threshold is set to be smaller than 0.01, some regions of the stego image may have an absolute difference that exceeds the threshold, indicating that these regions are more vulnerable to PVD attacks. Therefore, any threshold lower than 0.01 produces a maximum attack rate of 24%, as shown in Figure 8b. Regions with PVD attack rates under 50% are considered to be more robust to PVD attacks. Therefore, based on this, it can be concluded that the proposed method is robust against PVD attacks.
An entropy graph represents the entropy values of two images or distributions. Entropy is a measure of uncertainty or randomness in a signal, image, or distribution. The higher the entropy value, the more uncertain or random the signal, image, or distribution. In an entropy graph, the entropy values are plotted on the y-axis, and the joint probability of the two images or distributions is plotted on the x-axis. The joint probability is the probability of two events occurring concurrently. The entropy graph can reveal important information about the relationship between two images or distributions. If the entropy values of the two images are similar, it suggests that they have a similar degree of randomness or uncertainty. On the other hand, if the entropy values are significantly different, it suggests that the two images have different degrees of randomness or uncertainty and may be significantly different from each other. In image steganography, entropy can identify the color, texture, brightness, and contrast of an image. Greater disorders in an image entropy increase entropy, and this can be identified by the hacker. Figure 9 shows the entropy of the Lena image and its stego image using the proposed method. Image 1 is the original image and image 2 is the stego image. The Lena original image entropy is 7.43 while the stego image entropy is 7.43006. The slight difference in the entropy means that it would be difficult for the hacker to identify whether there is information hidden in the stego image.

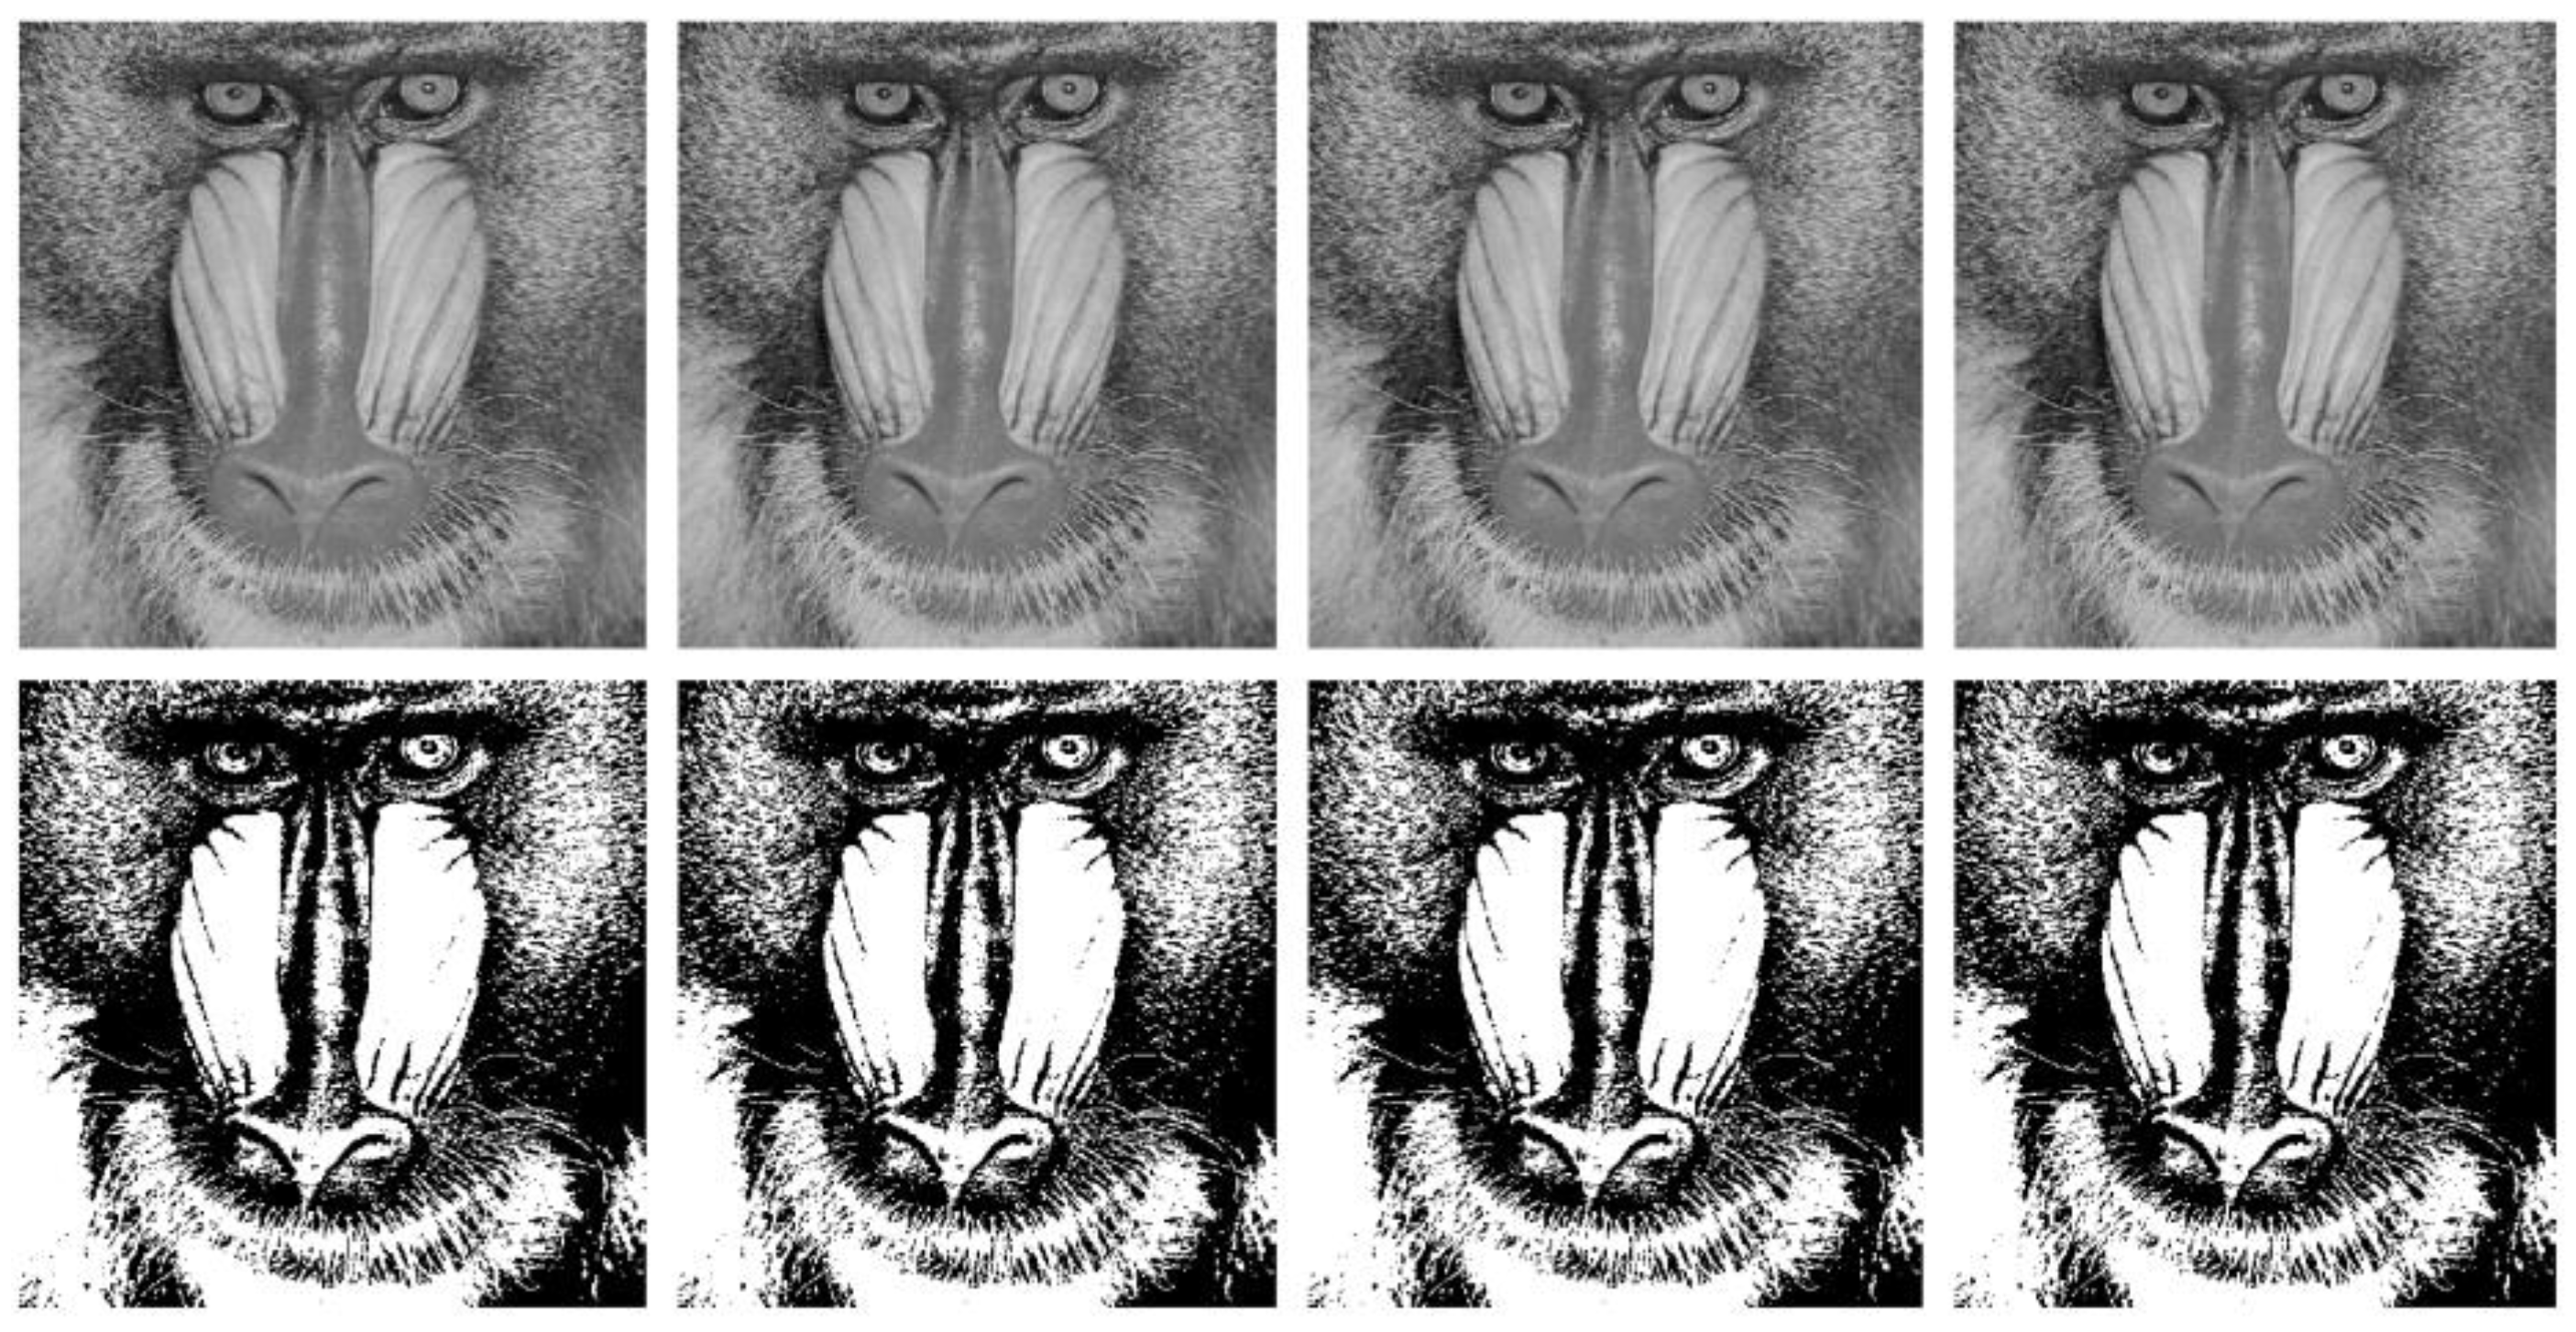
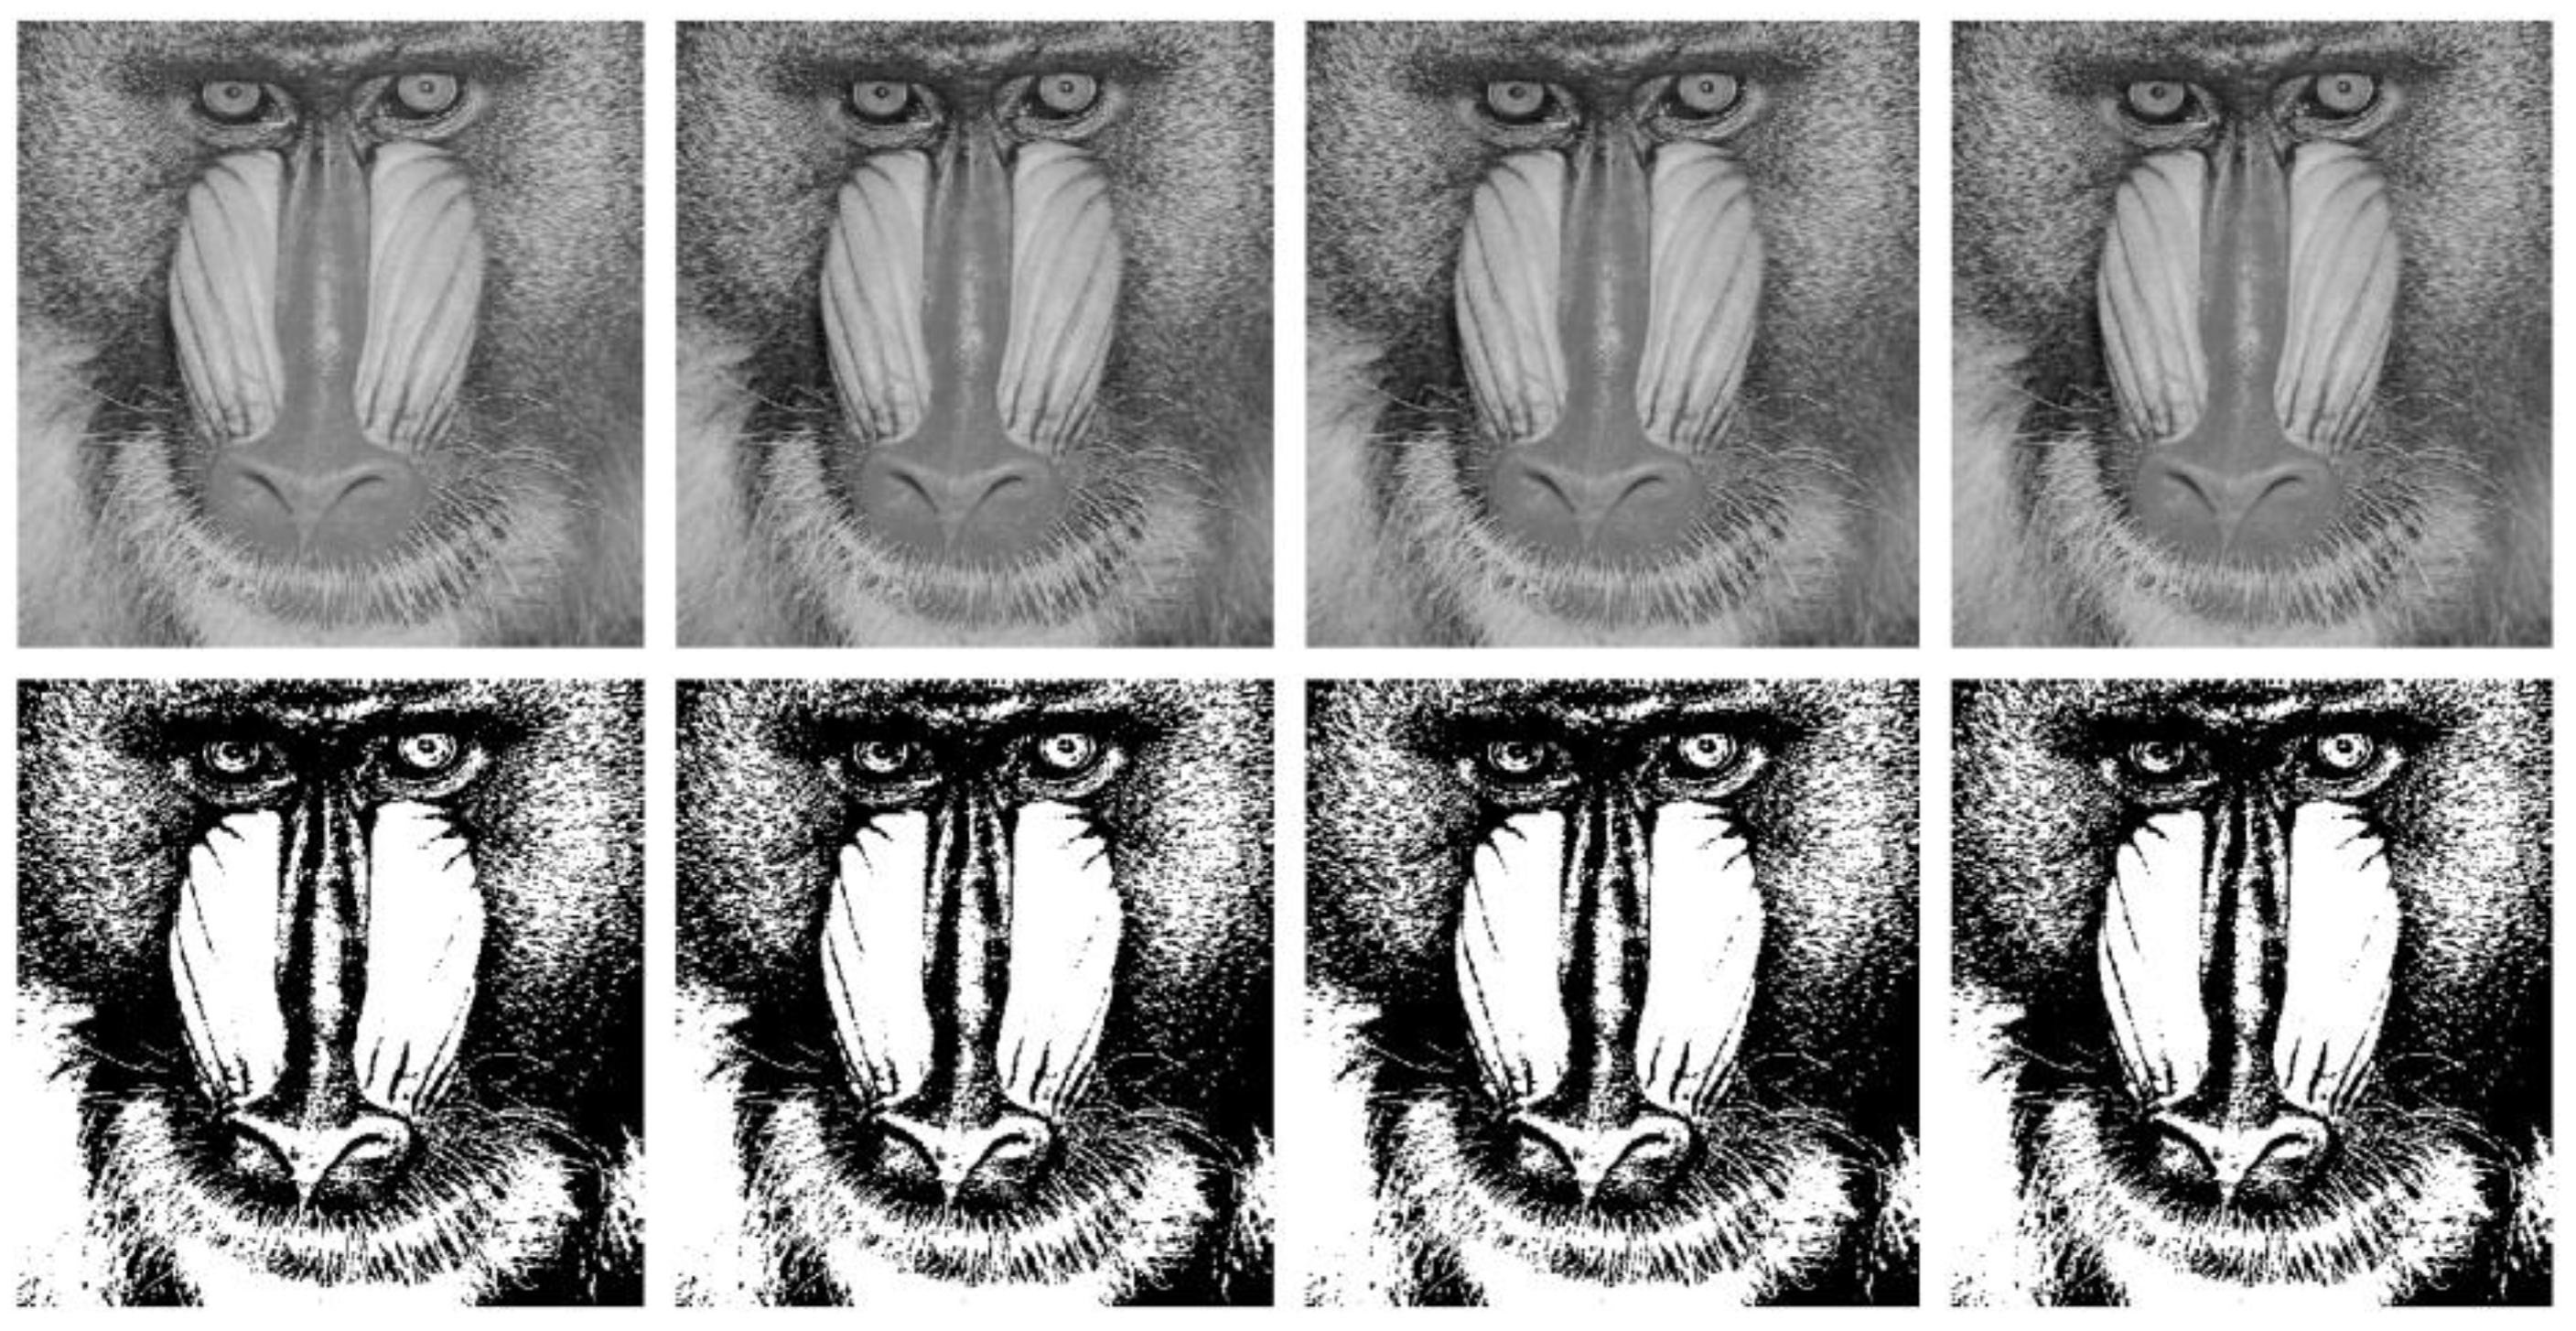
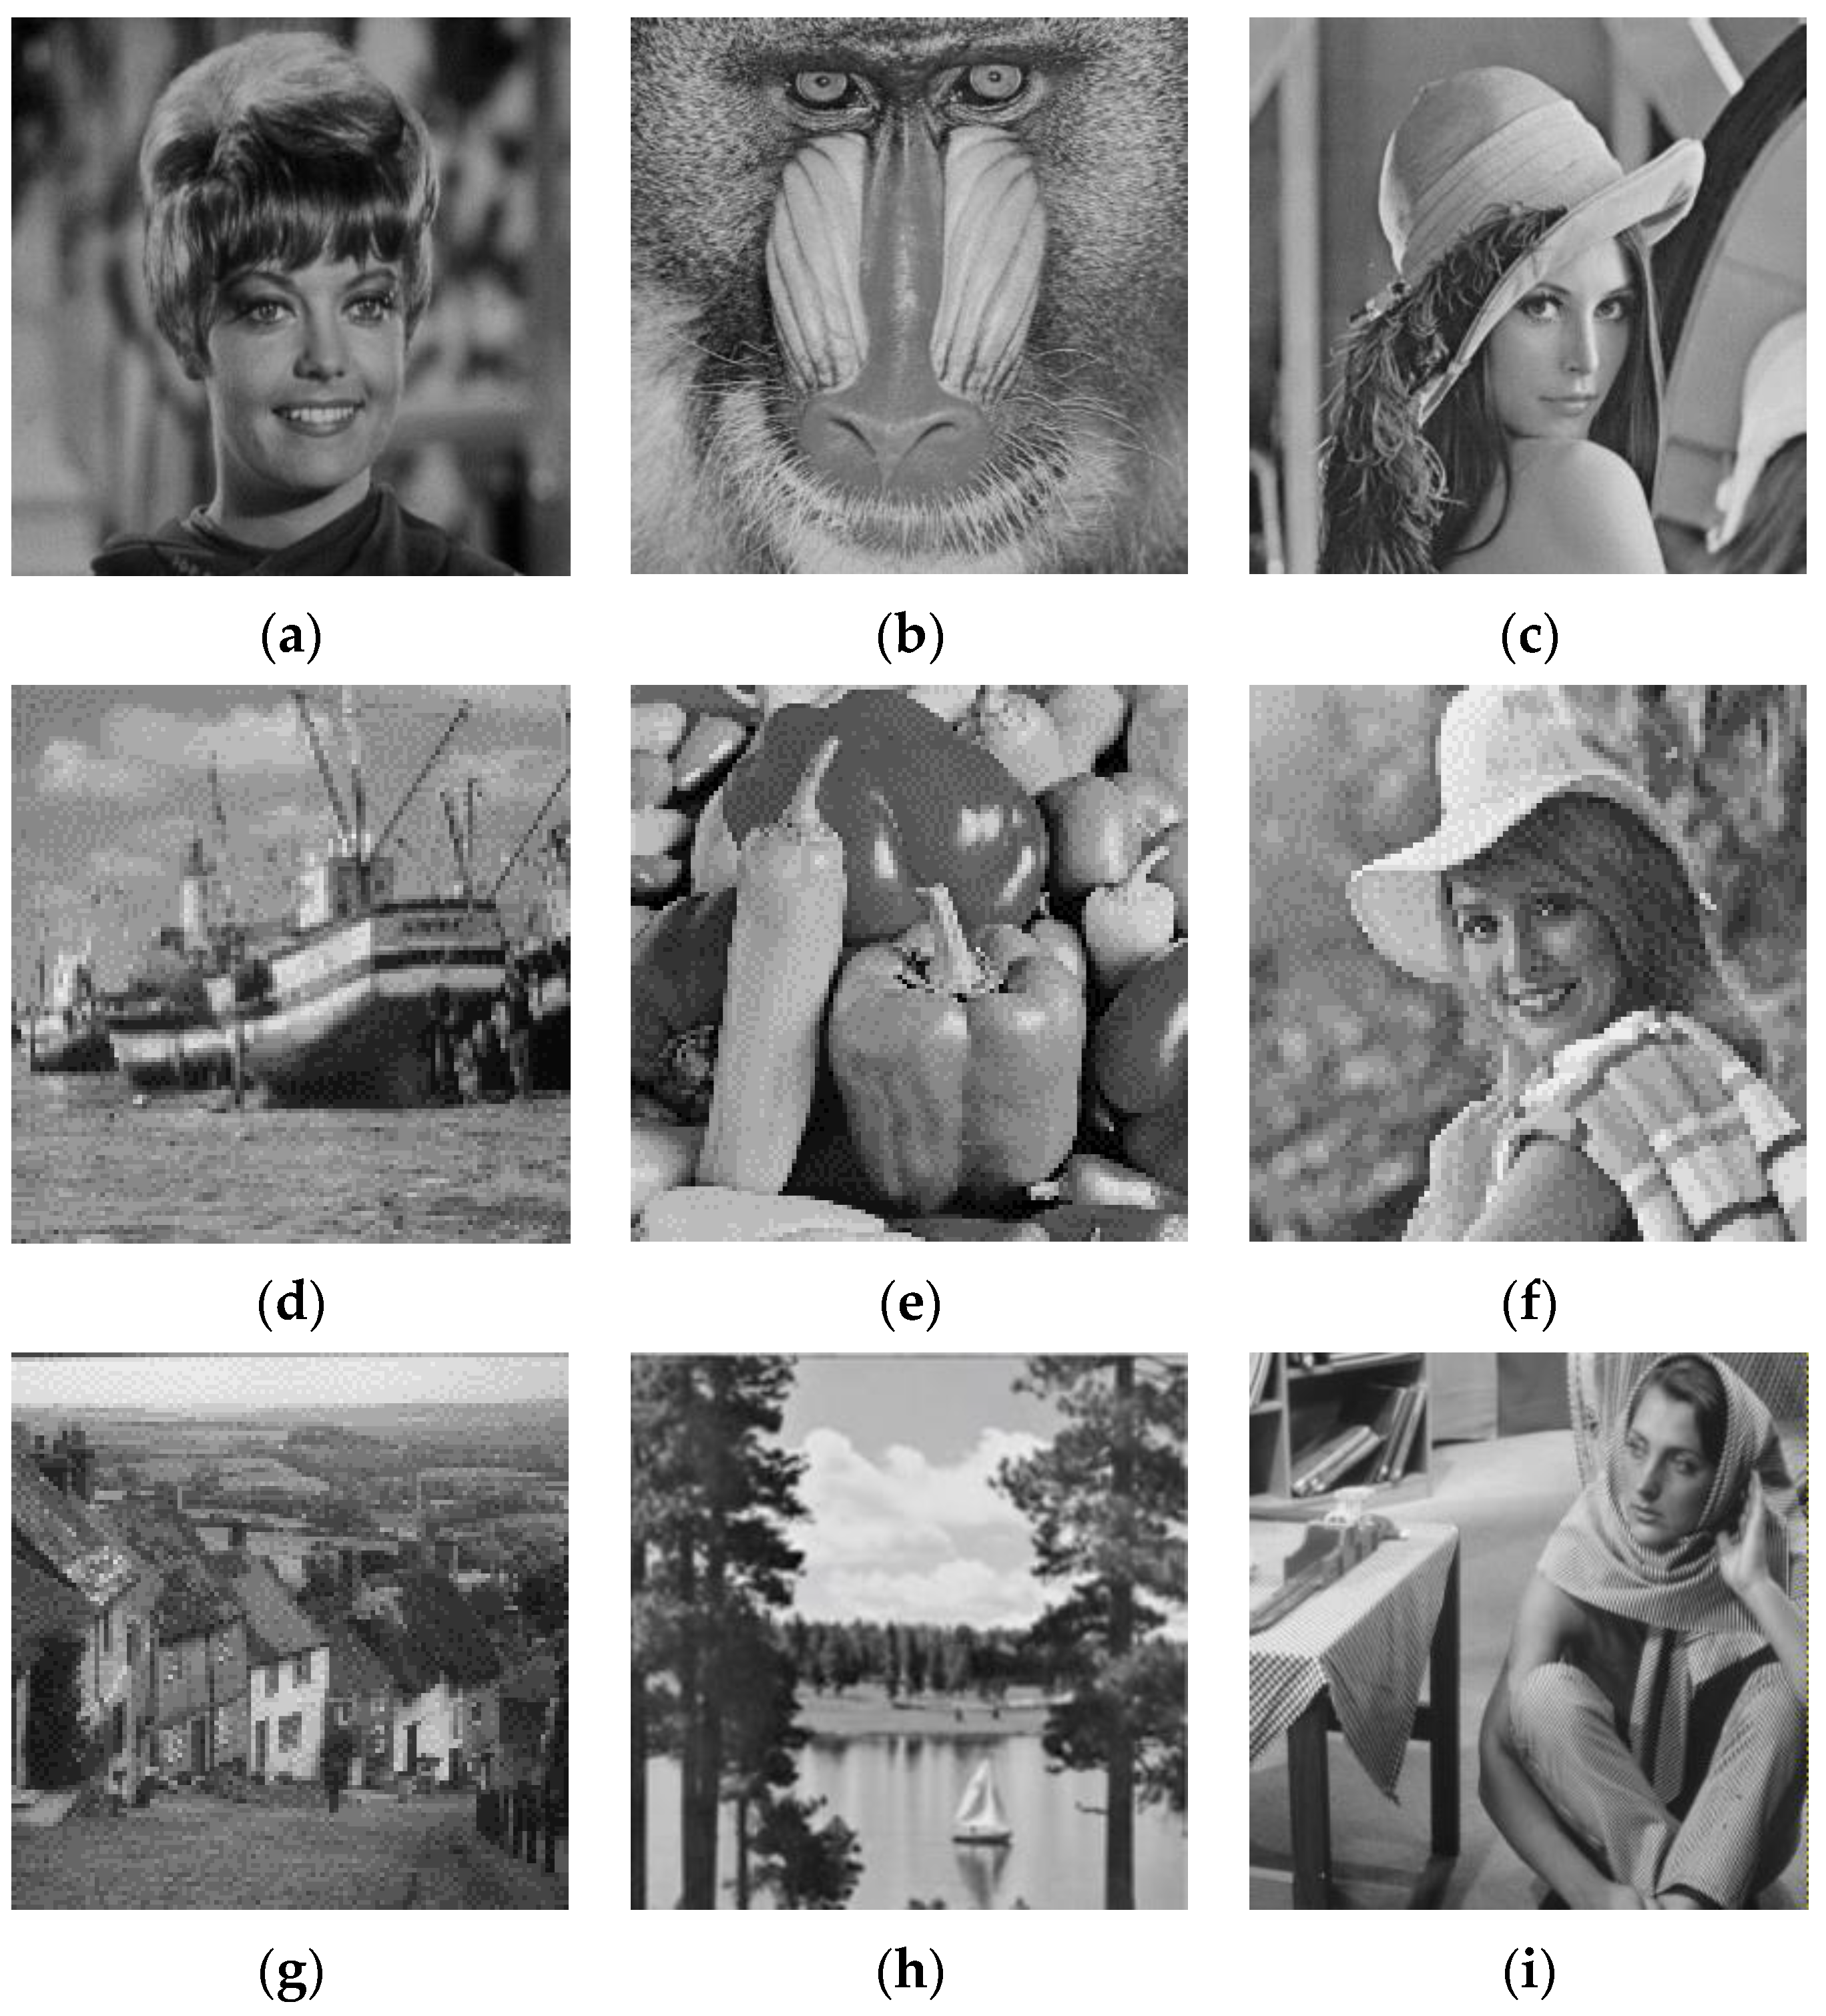
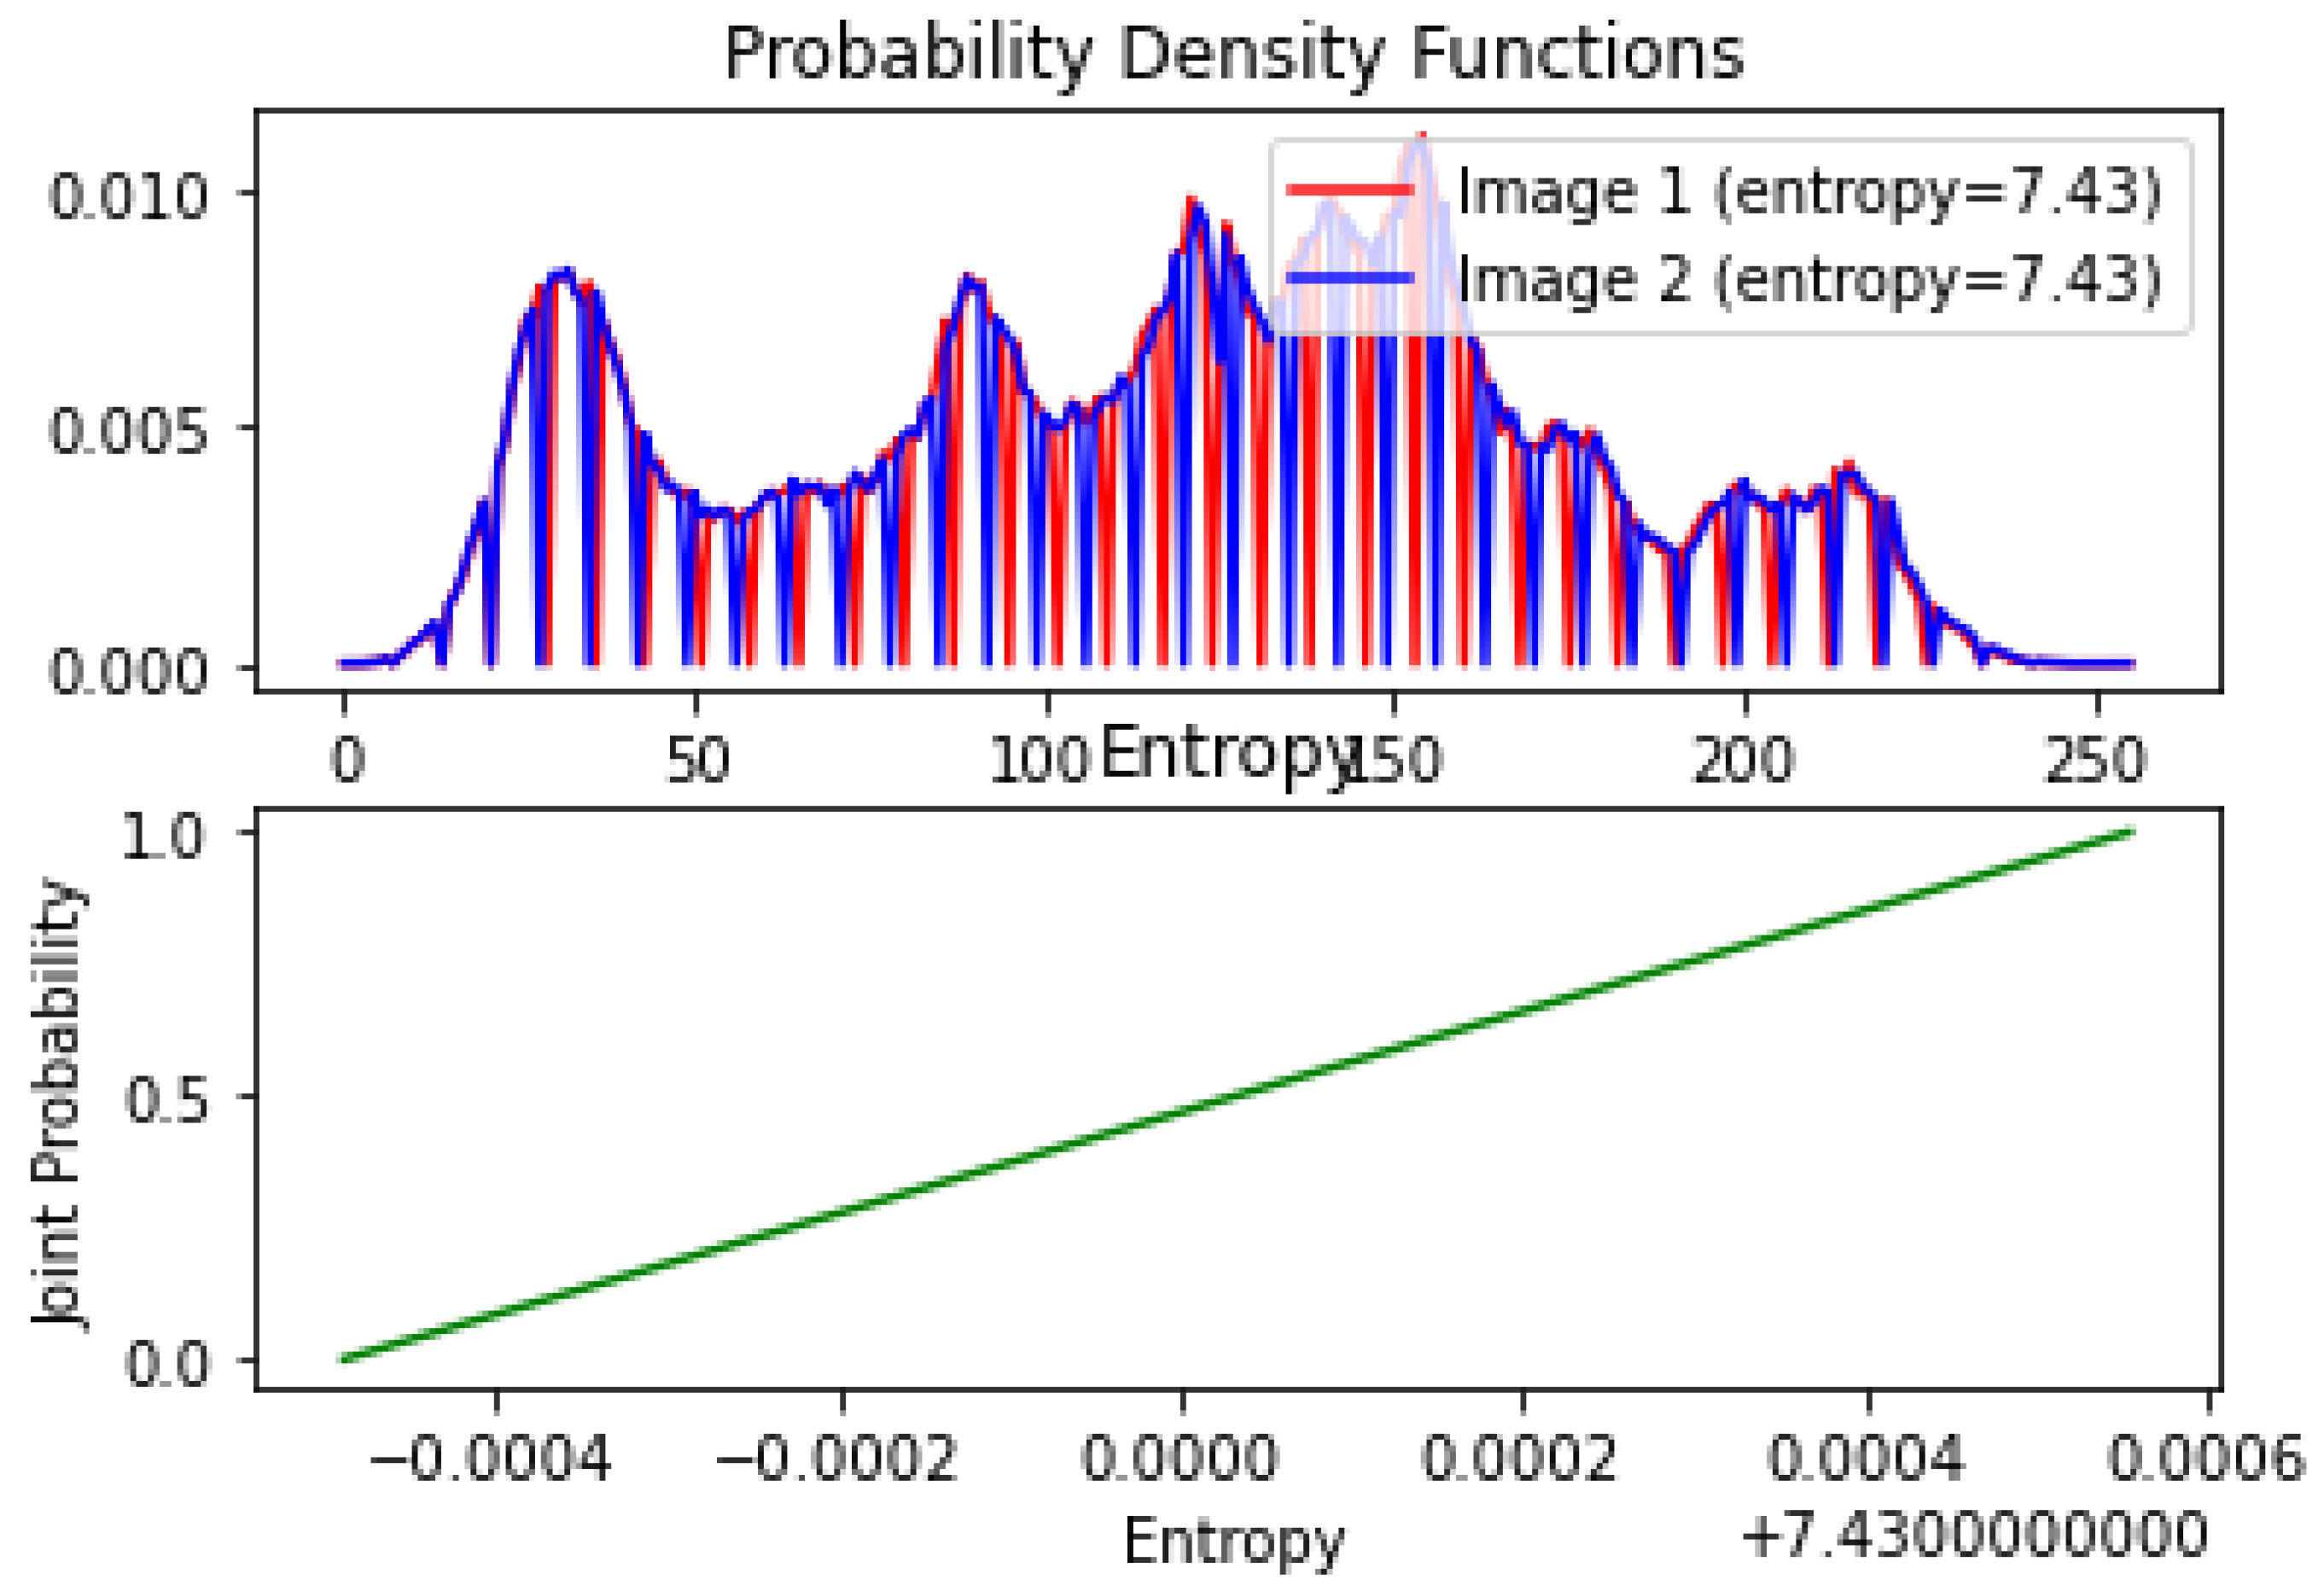
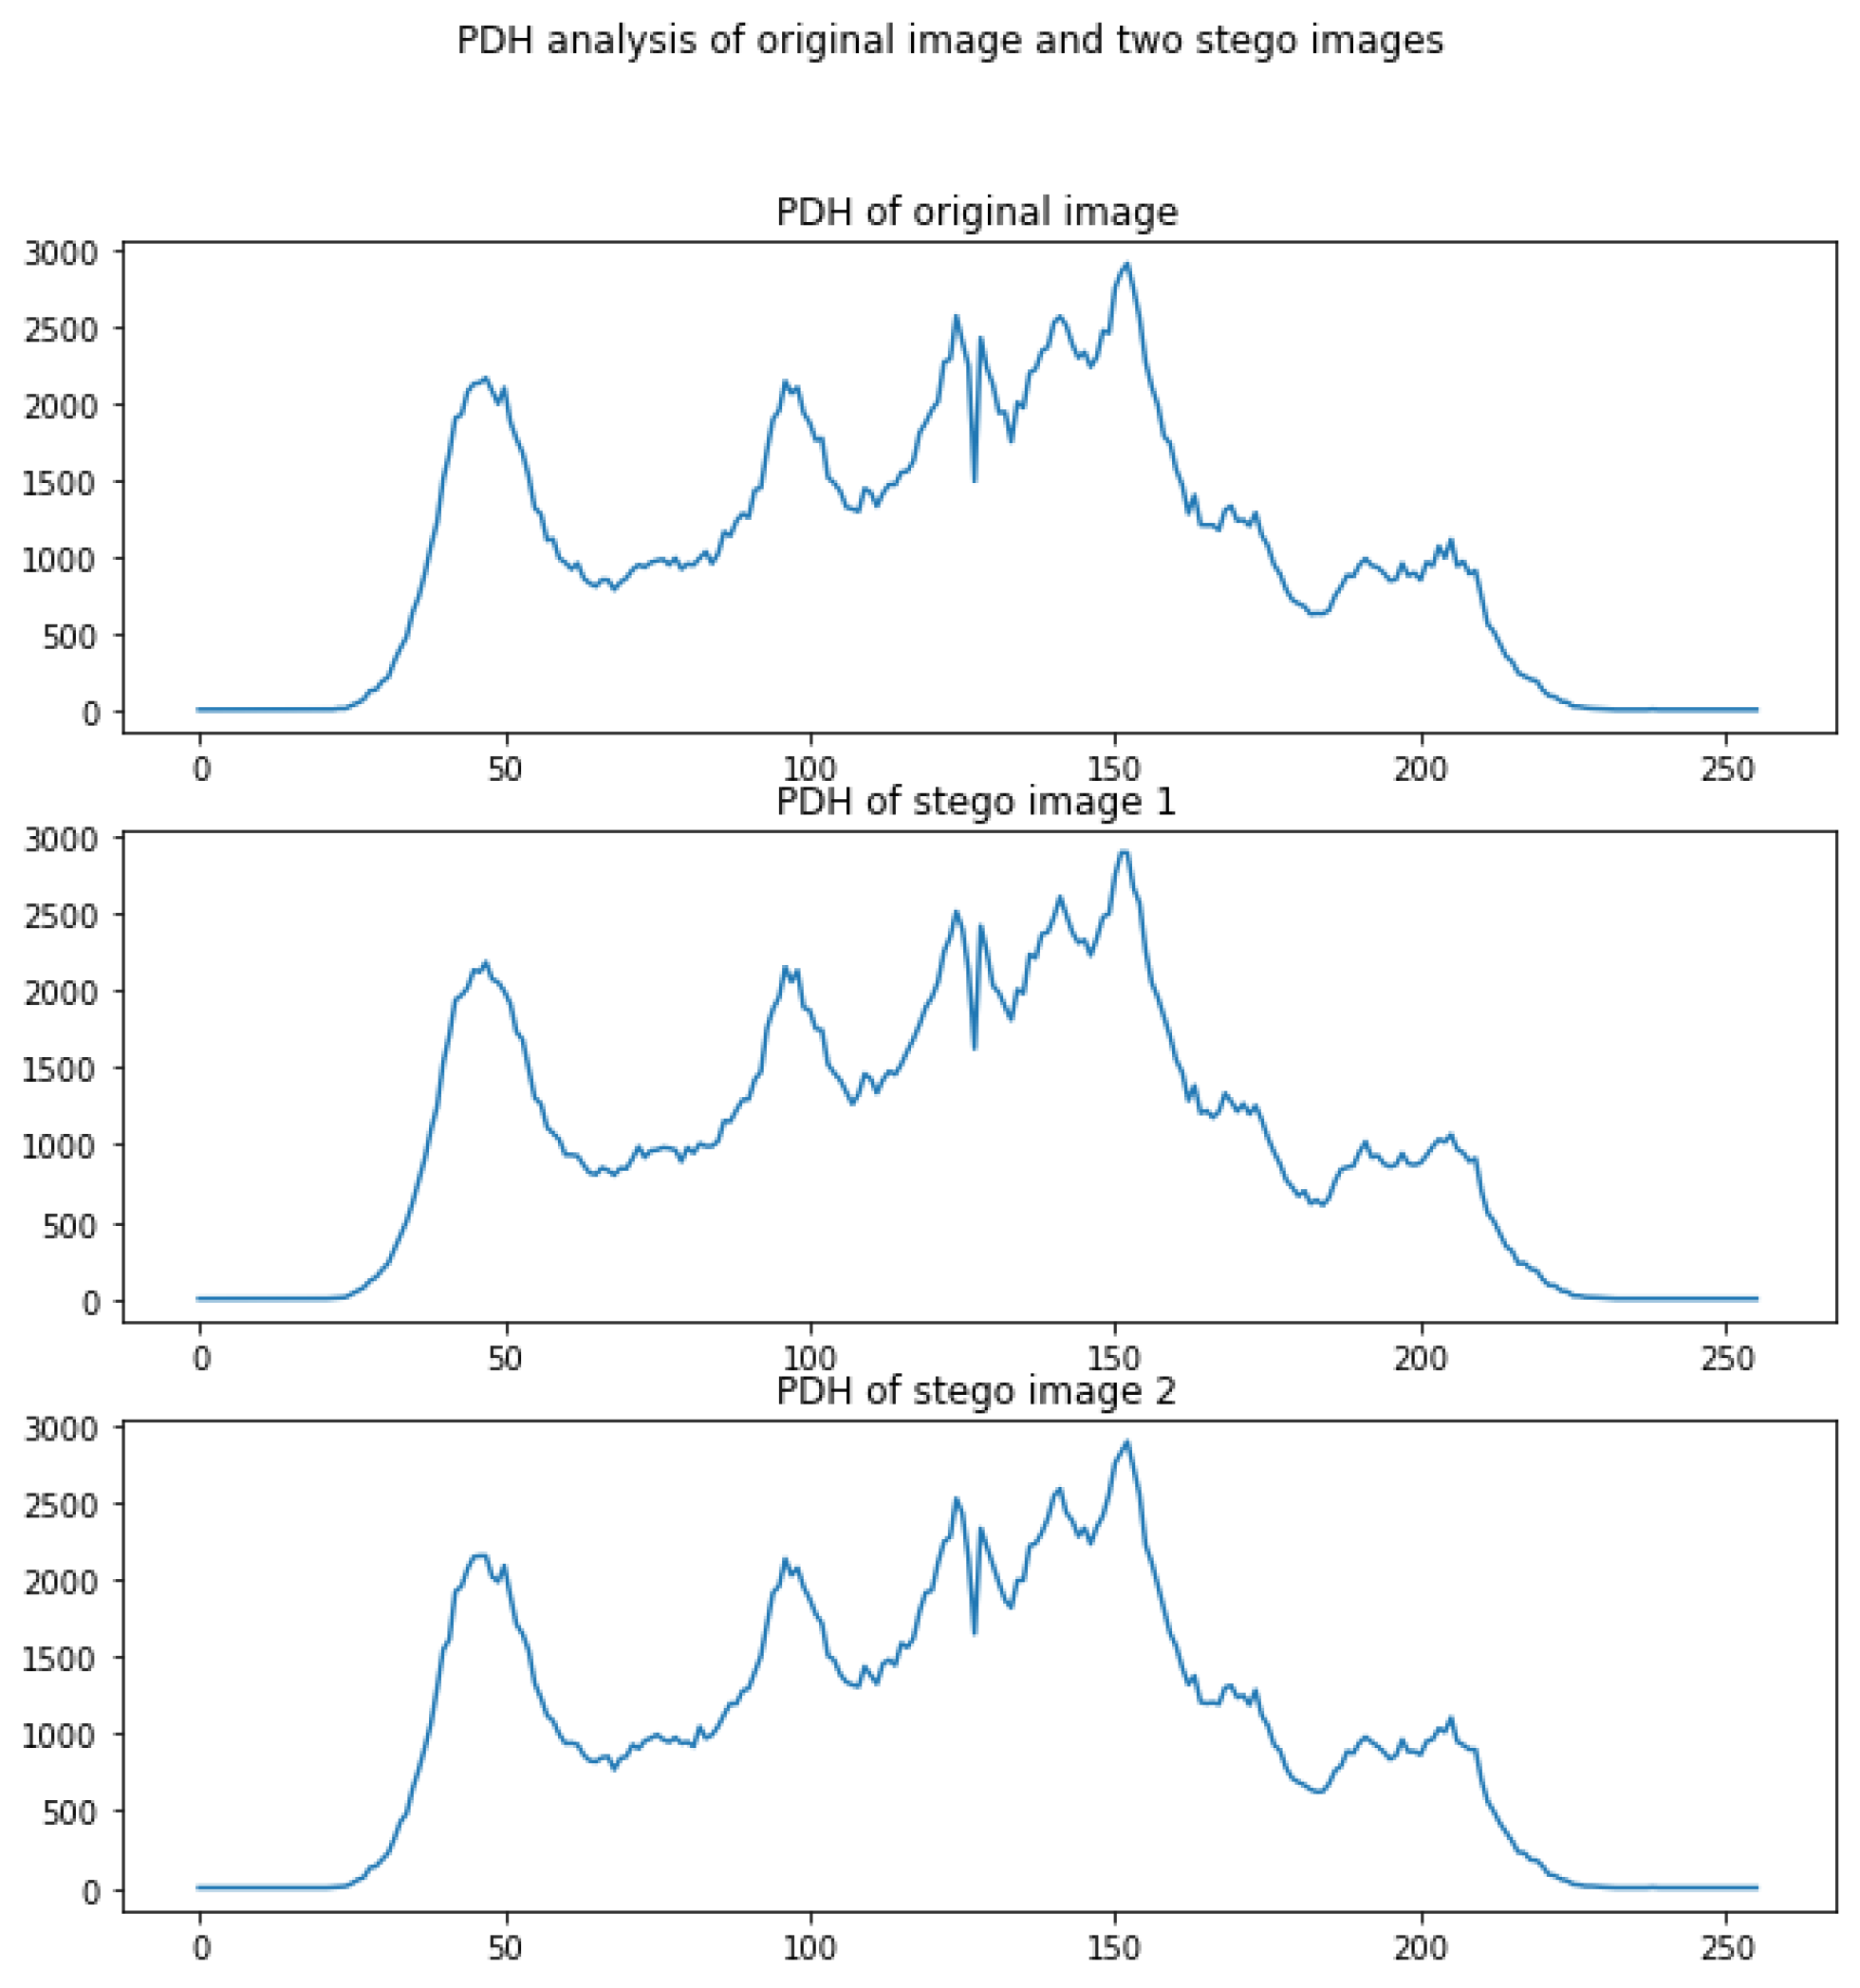
4.2. Visual Analysis

Visual analysis is carried out to determine the ease or difficulty of identifying an image with hidden secret data. This subsection highlights the visual analysis based on the difference histogram and visual inspection.
Difference histograms [23] are a type of visualization method used in steganography to compare the intensity values of two images. The two images compared are usually the original image and the stego image, which is the original image with hidden data embedded in it. To create a difference histogram, the intensity values of the two images are subtracted from each other, resulting in a new image that shows the difference in intensity between the two images. Equation (14) demonstrates how the difference is calculated.
D i f f e , q = O r i g i n a l e , q S t e g o e , q
where Original(e,q) and Stego(e,q) represent the intensity values of the original image and the stego image at position (e,q), respectively. Diff(e,q) represents the intensity value of the difference image at position (e,q).
The histogram of this difference image is then calculated, which shows the frequency of each intensity value in the difference image. The histogram is calculated as shown in Equation (15).
D i f f H i s t i = c y   w i t h   i
where cy is the number of pixels and i is the intensity.
The difference histogram can be used to detect the presence of hidden data in the stego image, as the histogram of the stego image should differ from the histogram of the original image if there are hidden data present. By comparing the two histograms [24], it is possible to detect whether hidden data have been embedded in the stego image and to extract that data if necessary. Figure 10a,b show the difference histogram of the proposed method stego image with the original image baboon. Figure 10a shows the difference between stego image 1 with the original baboon image while Figure 10b shows the difference between stego image 2 with the original image baboon. In the plots shown in Figure 10a,b, the x-axis represents the intensity values (−255 to 255) and the y-axis represents the frequency of each intensity value in the difference image. The blue line represents the difference histogram of the stego image compared to that of the original image.
A good difference histogram plot should show a relatively flat and uniform distribution of intensity values, indicating that there is no significant difference between the original and stego images. Any spikes or peaks in the histogram may indicate the presence of hidden data. From Figure 10a,b, it can be seen that the intensity values are uniformly distributed and the difference between each stego image with the original image is insignificant. Based on this, it can be concluded that the proposed method can withstand histogram analysis attacks.
Visual inspection is a type of visual attack in steganography that involves examining an image to detect the presence of hidden information. In the context of grayscale images, visual inspection typically involves looking for areas of uniform texture or shading that are not present in the original image. The basic idea of visual inspection is to compare the stego image with the original image and visually inspect any areas of the image that appear unusual or inconsistent with the original. For example, in a grayscale image, areas of uniform texture or shading that do not correspond to any visible features in the original image could indicate the presence of hidden data. Another approach might be to compare the stego image with a set of reference images that are known to be free of hidden data, and look for any differences or discrepancies. Visual inspection can be conducted on both grayscale and color images. The visual inspection experiments were carried out on grayscale images. To come up with the figures, the contrast and the texture of the image were adjusted. To modify the contrast, the pixel values were stretched using a linear transformation. To modify texture is to add noise to the image. One simple type of noise is Gaussian noise, which can be added to each pixel independently. Suppose i is the input image, n(x,y) is a noise value sampled from a Gaussian distribution with mean μ   =   0 and standard deviation   σ , and O is the output image. Then, the formula can be defined as:
O x , y = i x , y + n x , y
where n(x,y) = f(x). The Gaussian distribution can be defined as
f x = 1 σ 2 π e 1 2 x μ σ 2
where f(x) is the Gaussian distribution (probability density function), σ   is the standard deviation, and μ   is the mean. Figure 11 and Figure 12 show four columns. The rows show the images on different bit planes. Figure 11 and Figure 12 are the same, although Figure 11 shows the original image while Figure 12 shows the stego image. Since the texture and shading of Figure 11 and Figure 12 are the same, it can be deduced that the proposed method can withstand visual attacks and passes the visual inspection.
Pixel distribution histogram analysis is a technique used in steganography to analyze the statistical properties of an image before and after the embedding of hidden information. It is a type of steganalysis involving a process of detecting the presence of hidden information in an image. A pixel distribution histogram (PDH) is a plot that shows the frequency distribution of the gray levels in an image. In a grayscale image, each pixel has a gray-level value ranging from 0 to 255, where 0 represents black and 255 represents white. The PDH plot shows how many pixels in the image have each gray-level value. For example, a peak at the gray-level value 128 means that there are many pixels in the image with a gray-level value of 128.
In PDH analysis, the PDH plot for the original image is compared to the PDH plot for the stego image, which is the original image with hidden information embedded in it. If the steganographic algorithm is well designed, the PDH plot for the stego image should be similar to the PDH plot for the original image, since the hidden information should be embedded in a way that minimizes changes to the overall statistical properties of the image.
However, if the steganographic algorithm is not well designed, the PDH plot for the stego image may show significant differences from the PDH plot for the original image. These differences may be visible as peaks or valleys in the plot, indicating that certain gray-level values have been modified to embed the hidden information.
Steganalysis algorithms can analyze the PDH plots for stego images to detect the presence of hidden information. If the deviation from the original PDH is large, this may indicate that the image has been modified to embed hidden information, making it vulnerable to detection by steganalysis algorithms. Therefore, PDH analysis is an important technique for evaluating the robustness of steganographic algorithms against steganalysis attacks. Figure 13 shows the PDH analysis of the proposed method. The x-axis of the graph represents the gray levels of the image, ranging from 0 to 255. The y-axis represents the frequency of pixels at each gray level, which is the count of pixels with that gray level in the image. The blue line plot shows the PDH of each image. The height of each bar in the plot represents the frequency of pixels with the corresponding gray level in the image. From Figure 13 it can be seen that the PDH of the two stego images is similar to that of the original image. Since a similar PDH means steganalysis algorithms cannot detect the presence of hidden information, it can be concluded that the proposed method is robust against PDH attacks.

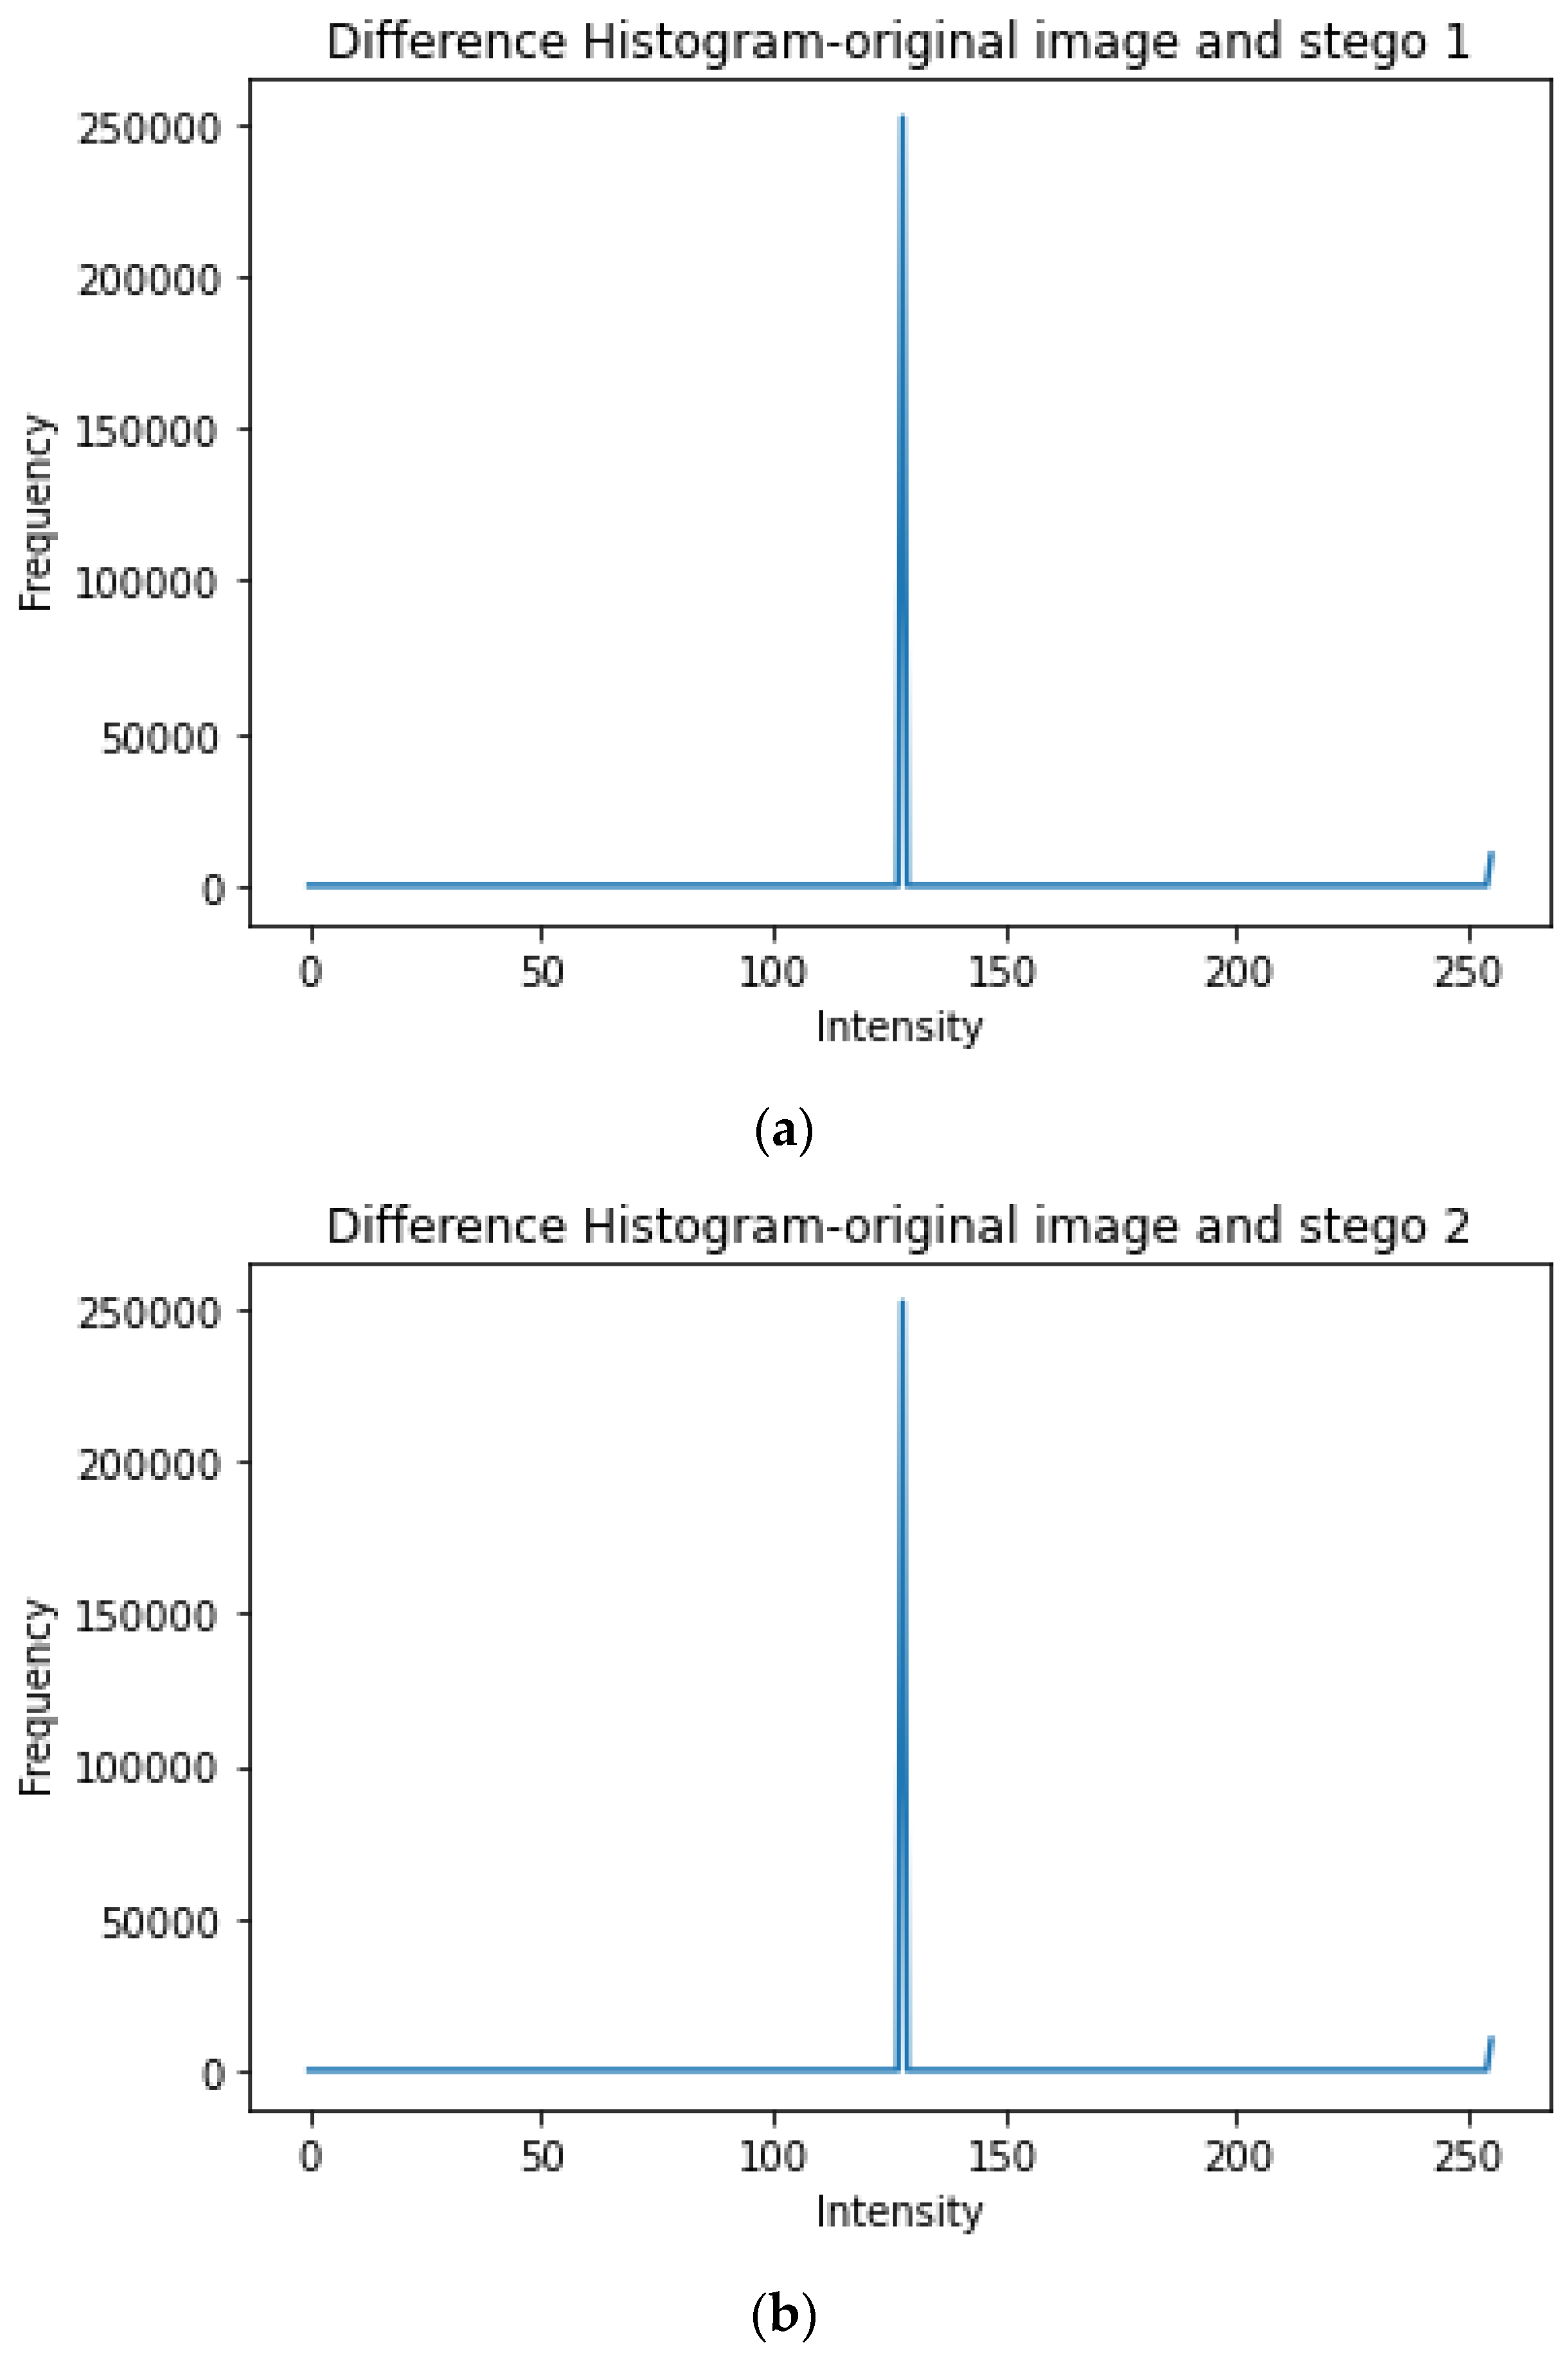
4.3. Stego Analysis Using StegoExpose

To further test the robustness of the proposed method against security attacks, the StegoExpose steganalysis tool was used [25]. StegoExpose is a steganalysis tool that uses statistical features to detect steganographic content in digital media. The tool produces a ROC (receiver operating characteristic) graph to visualize the performance of the steganalysis methods, such as chi-square and RS, in analyzing stego images. The ROC graph produced by StegoExpose plots the true-positive rate (TPR) on the y-axis and the false-positive rate (FPR) on the x-axis as shown in Figure 14. The TPR is the fraction of stego samples that are correctly detected as stego, while the FPR is the fraction of non-stego samples that are incorrectly classified as stego. Using StegoExpose, the total size of the secret message in a stego image can be obtained if there is any secret message in the image. Experiments conducted show that StegoExpose was able to find the size of some secret messages in the images, but, for some of the images, this size was wrong. During the experiments, some original images (with no secret message) were used alongside stego images. This was done so that the true-positive rate and the false-positive rate could be calculated. If the true-positive value is always high and the false-positive value is low, it can be assumed that the method is not robust against security attacks. As seen in Figure 14, the primary set has an increasing false-positive rate. This means there is a high possibility of StegoExpose detecting secret messages where there are no secret messages. Additionally, the chi-square and RS analysis also have high false-positive rates. The curves on the ROC graph represent the trade-off between the TPR and FPR for different threshold values. The area under the curve (AUC) is a measure of the overall performance of the steganalysis method. The area under all the curves shown in Figure 14 is small, especially for the chi-square analysis curve. Based on this, it can be concluded that hackers cannot be sure of whether there is a secret message or even be sure about the size of the secret message because of the false-positive rates for both chi-square and RS steganalysis. Therefore, the proposed method can withstand security attacks carried out using StegoExpose.

5. Application

Due to the ever-growing health data security risks, steganography can be used in the medical field to conceal patients’ data to ensure patient security and privacy. Steganography can also be used for authentication in health institutions. When data are transmitted between different institutions, there is a risk that they could be altered or corrupted. Steganography can be used to embed a digital signature within the data, which can be used to verify their authenticity. Steganography can also be used to embed important medical information within medical images or videos. For example, a doctor could embed a patient’s medical history within an X-ray image, so that it is always available to other healthcare providers. The proposed method can be used to protect patients’ data by hiding the information in two stego images. Since using two images is a necessity in the extraction of secret data, methods that use two stego images can be considered secure, especially if they can withstand different security attacks, such as RS attacks and chi-square attacks.
This is to say the proposed method can be used in healthcare systems in order to strengthen patient data privacy and authentication. Due to the demonstrated high embedding capacity, the proposed method can be applied to all types of images, including medical images such as CT scans (a combination of X-ray images). These images can be used by health personnel to conceal important patient data to store them for future use, sending them to other medical personnel, and keeping the patient data private and secure.
Apart from being used in healthcare systems, the proposed method can be used on any basic systems that require data hiding, especially those that send data over networks in bulk because of the proposed method’s high embedding capacity.
Figure 15 shows experimental medical images adapted from the kaggle [26] database. As can be seen, the proposed method has a great performance in regard to the PSNR on medical images. The medical images produce a higher PSNR value than the other images because medical images embed fewer data than other images mainly because they have greater maximum and minimum pixel values, 255 and 0, respectively. This demonstrates how the proposed method can be applied to medical images.

6. Conclusions

In this paper, a capacity-raising reversible data-hiding scheme using an empirical rules table in dual images is proposed. The main advantage of the proposed method is its ability to produce high-quality images while embedding a high number of data. The proposed method can embed a wide range of characters depending on the image size. Previous methods have not explored any way to expand rules tables without increasing distortion. The proposed method introduced a novel algorithm to expand the rules table without increasing distortion. Furthermore, the proposed method introduced a novel algorithm to preprocess and cipher secret messages before embedding, without the need for an encryption key, which usually increases overhead. The novel data-hiding scheme introduced can produce images of good quality because the lower amount of distortion. Since the experiments were carried out on 512 × 512 images, a total of 262,133 distinct characters (different entries from the extended table) can be embedded. The proposed method has an average pixel-to-signal noise ratio of 52.65 dB, which is higher than that of other compared methods, as discussed in this paper, proving that the proposed method performs better than the other methods and is also imperceptible. Additionally, the proposed method has a high embedding capacity of 4.25 bpp. The proposed method can also withstand security attacks such as RS, PVD, entropy, and chi-square attacks. It is also undetectable under visual attack analyses including the difference histogram, PDH, and visual inspection. Based on the higher embedding capacity, pixel-to-signal noise ratio, reversibility, the ability of this method to be undetectable under visual attack analysis, and the ability of this method to withstand security attacks, it can be concluded that the proposed method is superior to the other methods.
Adding to the strength of the proposed method is its ability to withstand attacks by other tools, such as StegoExpose. However, more tests can be carried out using other steganalysis tools, such as Stegohunt. Stegohunt is a powerful tool for identifying and detecting steganography techniques in digital media files, and it can be used by digital forensics professionals, security researchers, and other investigators to uncover hidden information and potential threats. Stegohunt works by analyzing the file structure and metadata of digital media files and detecting patterns that are indicative of steganography techniques. The tool employs a variety of algorithms and statistical analysis techniques to detect the presence of hidden information, such as LSB (least significant bit) steganography, which hides information in the least significant bits of image or audio files.
In future work, we will improve this method to make sure no location map is necessary to keep the embedding capacity of the proposed method on medical images as high as possible. The embedding capacity for medical images with the location map would be a minimum of 3.25 bpp, while it can reach up to 4.25 bpp without the location map. Medical images have too many maximal and minimal pixel value points; hence, the size of the map, even after compression, can be large, leading to a lower embedding capacity of 3.25 bpp on medical images as compared to other images. Additionally, Stegohunt, among other powerful tools, will be used to test the proposed method against attacks to further confirm its security.

Author Contributions

Conceptualization, C.-T.H.; Methodology, C.-T.H. and N.S.S.; Software, C.-Y.W.; Validation, N.S.S.; Writing—original draft, N.S.S.; Writing—review & editing, C.-Y.W.; Supervision, C.-Y.W. All authors have read and agreed to the published version of the manuscript.

Funding

This work was partially supported by the National Science and Technology Council of the Republic of China under grant nos. MOST 110-2221-E-153-002-MY2, MOST 111-2221-E-155-038, and MOST 111-2218-E-218-004-MBK-.

Acknowledgments

The authors extend their appreciation to the National Science and Technology Council of the Republic of China under grant nos. MOST 110-2221-E-153-002-MY2, MOST 111-2221-E-155-038, and MOST 111-2218-E-218-004-MBK-.

Conflicts of Interest

The authors declare that they have no known competing financial interests or personal relationships that could have appeared to influence the work reported in this paper.

References

  1. Al-Suqri, M.N.; Gillani, M. A Comparative Analysis of Information and Artificial Intelligence Toward National Security. IEEE Access 2022, 10, 64420–64434. [Google Scholar] [CrossRef]
  2. Sun, N.; Li, C.-T.; Chan, H.; Le, B.D.; Islam, Z.; Zhang, L.Y.; Islam, R.; Armstrong, W. Defining Security Requirements with the Common Criteria: Applications, Adoptions, and Challenges. IEEE Access 2022, 10, 44756–44777. [Google Scholar] [CrossRef]
  3. Semertzis, I.; Rajkumar, V.S.; Stefanov, A.; Fransen, F.; Palensky, P. Quantitative Risk Assessment of Cyber Attacks on Cyber-Physical Systems using Attack Graphs. In Proceedings of the 10th Workshop on Modelling and Simulation of Cyber-Physical Energy Systems (MSCPES), Milan, Italy, 3 May 2022; pp. 1–6. [Google Scholar] [CrossRef]
  4. Skendžić, A.; Kovačić, B.; Tijan, E. General data protection regulation—Protection of personal data in an organization. In Proceedings of the 41st International Convention on Information and Communication Technology, Electronics and Microelectronics (MIPRO), Opatija, Croatia, 21–25 May 2018; pp. 1370–1375. [Google Scholar]
  5. Wahab, O.F.A.; Khalaf, A.A.M.; Hussein, A.I.; Hamed, H.F.A. Hiding Data Using Efficient Combination of RSA Cryptography, and Compression Steganography Techniques. IEEE Access 2021, 9, 31805–31815. [Google Scholar] [CrossRef]
  6. Wang, J.; Cheng, L.-M.; Su, T. Multivariate Cryptography Based on Clipped Hopfield Neural Network. IEEE Trans. Neural Networks Learn. Syst. 2016, 29, 353–363. [Google Scholar] [CrossRef] [PubMed]
  7. Han, D.; Li, Z.; Wang, M.; Xu, C.; Sharif, K. Privacy Preservation Authentication: Group Secret Handshake with Multiple Groups. Mathematics 2023, 11, 532. [Google Scholar] [CrossRef]
  8. Verma, N.; Singh, M. Steganography techniques in network security. Int. J. Adv. Comput. Sci. Appl. 2021, 12, 1–7. [Google Scholar]
  9. Satrio, T.A.; Prabowo, W.A.; Yuniati, T. Hiding Document Format Files Using Video Steganography Techniques with Least Significant Bit Method. In Proceedings of the IEEE International Conference on Communication, Networks and Satellite (COMNETSAT), Solo, Indonesia, 3–5 November 2022; pp. 399–406. [Google Scholar] [CrossRef]
  10. Adhiyaksa, F.A.; Amrulloh, M.M.; Mustaqim, T.; Tsaniya, H.; Studiawan, H.; Shiddiqi, A.M. Reversible Audio Data Hiding using Samples Greatest Common Factor and Audio Interpolation. In Proceedings of the IEEE 12th Annual Computing and Communication Workshop and Conference (CCWC), Las Vegas, NV, USA, 26–29 January 2022; pp. 659–666. [Google Scholar] [CrossRef]
  11. Xie, J.; Wang, H.; Wu, D. Adaptive Image Steganography Using Fuzzy Enhancement and Gray Wolf Optimizer. IEEE Trans. Fuzzy Syst. 2022, 30, 4953–4964. [Google Scholar] [CrossRef]
  12. Hu, X.; Ni, J.; Shi, Y.-Q. Efficient JPEG Steganography Using Domain Transformation of Embedding Entropy. IEEE Signal Process. Lett. 2018, 25, 773–777. [Google Scholar] [CrossRef]
  13. Horng, J.-H.; Chang, C.-C.; Li, G.-L. Steganography Using Quotient Value Differencing and LSB Substitution for AMBTC Compressed Images. IEEE Access 2020, 8, 129347–129358. [Google Scholar] [CrossRef]
  14. Gutiérrez-Cárdenas, J.M. Secret Key Steganography with Message Obfuscation by Pseudo-random Number Generators. In Proceedings of the IEEE 38th International Computer Software and Applications Conference Workshops, Vasteras, Sweden, 21–25 July 2014; pp. 164–168. [Google Scholar]
  15. Wang, X.; Zhang, X.; Gao, M.; Tian, Y.; Wang, C.; Iu, H.H.-C. A Color Image Encryption Algorithm Based on Hash Table, Hilbert Curve and Hyper-Chaotic Synchronization. Mathematics 2023, 11, 567. [Google Scholar] [CrossRef]
  16. Lee, C.-F.; Huang, Y.-L. Reversible data hiding scheme based on dual stegano-images using orientation combinations. Telecommun. Syst. 2011, 52, 2237–2247. [Google Scholar] [CrossRef]
  17. Su, G.-D.; Liu, Y.; Chang, C.-C. A square lattice oriented reversible information hiding scheme with reversibility and adaptivity for dual images. J. Vis. Commun. Image Represent. 2019, 64, 102618. [Google Scholar] [CrossRef]
  18. USC-SIPI Image Database. Available online: https://sipi.usc.edu/database/ (accessed on 29 September 2022).
  19. Lee, C.F.; Wang, K.H.; Chang, C.C.; Huang, Y.L. A reversible data hiding scheme based on dual steganographic images. In Proceedings of the 3rd International Conference on Ubiquitous Information Management and Communication, Suwon, Republic of Korea, 15–16 January 2009; pp. 228–237. [Google Scholar]
  20. Liu, Y.; Chang, C.-C. A turtle shell-based visual secret sharing scheme with reversibility and authentication. Multimedia Tools Appl. 2018, 77, 25295–25310. [Google Scholar] [CrossRef]
  21. Lin, J.-Y.; Liu, Y.; Chang, C.-C. A real-time dual-image-based reversible data hiding scheme using turtle shells. J. Real-Time Image Process. 2019, 16, 673–684. [Google Scholar] [CrossRef]
  22. Hameed, M.A.; Hassaballah, M.; Aly, S.; Awad, A.I. An Adaptive Image Steganography Method Based on Histogram of Oriented Gradient and PVD-LSB Techniques. IEEE Access 2019, 7, 185189–185204. [Google Scholar] [CrossRef]
  23. Zhou, N.; Zhang, M.; Wang, H.; Ke, Y.; Di, F. Separable Reversible Data Hiding Scheme in Homomorphic Encrypted Domain Based on NTRU. IEEE Access 2020, 8, 81412–81424. [Google Scholar] [CrossRef]
  24. Jhong, C.-L.; Wu, H.-L. Grayscale-Invariant Reversible Data Hiding Based on Multiple Histograms Modification. IEEE Trans. Circuits Syst. Video Technol. 2022, 32, 5888–5901. [Google Scholar] [CrossRef]
  25. StegoExpose Steganalysis Tool. Available online: https://www.wetstonetech.com/products/stegohunt-steganography-detection/ (accessed on 31 March 2023).
  26. Kaggle Database. Available online: https://www.kaggle.com/datasets/vbookshelf/computed-tomography-ct-images (accessed on 15 March 2023).
Figure 1. The framework of the proposed method.
Mathematics 11 01764 g001
Figure 2. Table 1 extension example.
Mathematics 11 01764 g002
Figure 3. Embedding example of the proposed method.
Mathematics 11 01764 g003
Figure 4. Extraction example of the proposed method.
Mathematics 11 01764 g004
Figure 5. The 512 × 512 grayscale images used in the experiments. (a) Zelda, (b) Baboon, (c) Lena, (d) Boat (e) Peppers, (f) Elaine, (g) Goldhill, (h) Lake, and (i) Barbara.
Mathematics 11 01764 g005
Figure 6. RS analysis experimental results between our method and the 1-bit LSB method: (a) the proposed method; (b) 1-bit LSB.
Mathematics 11 01764 g006
Figure 7. Chi-square attack for 1 bit-LSB and the proposed method using Zelda stego images. (a) 1-bit LSB Zelda. (b) Proposed Zelda stego 1. (c) Proposed Zelda stego 2.
Mathematics 11 01764 g007
Figure 8. PVD attack analysis using different threshold values: (a) 0.01 threshold, (b) 0.001 threshold.
Mathematics 11 01764 g008
Figure 9. Information entropy analysis of the proposed method.
Mathematics 11 01764 g009
Figure 10. Difference histograms. (a) Stego image 1 and original image difference histogram. (b) Stego image 2 and original image difference histogram.
Mathematics 11 01764 g010
Figure 11. Visual analysis (forensics) of the baboon original image.
Mathematics 11 01764 g011
Figure 12. Visual analysis (forensics) of the baboon stego image.
Mathematics 11 01764 g012
Figure 13. PDH analysis of the original image and the two stego images.
Mathematics 11 01764 g013
Figure 14. Security test using StegoExpose on stego images and original images.
Mathematics 11 01764 g014
Figure 15. Application example of the proposed method on medical images and their different PSNR values: (a) Brain, (b) Bone 1, (c) Bone 2, and (d) Bone 3.
Mathematics 11 01764 g015
Table 1. The rules table for embedding based on 13 expandable rules.
s(x1, y1)(x2, y2)ds
0(x, y)(x, y)0
1(x, y)(x − 1, y)1
2(x − 1, y)(x, y)1
3(x, y)(x, y − 1)1
4(x, y − 1)(x, y)1
5(x, y)(x − 1, y − 1)2
6(x − 1, y − 1)(x, y)2
7(x + 1, y)(x − 1, y)2
8(x − 1, y)(x + 1, y)2
9(x, y + 1)(x, y − 1)2
10(x, y − 1)(x, y + 1)2
11(x − 1, y)(x, y − 1)2
12(x, y − 1)(x − 1, y)2
Disclaimer/Publisher’s Note: The statements, opinions and data contained in all publications are solely those of the individual author(s) and contributor(s) and not of MDPI and/or the editor(s). MDPI and/or the editor(s) disclaim responsibility for any injury to people or property resulting from any ideas, methods, instructions or products referred to in the content.

