Article

Multi-Method Diagnosis of Histopathological Images for Early Detection of Breast Cancer Based on Hybrid and Deep Learning

by
Mohammed Al-Jabbar
1,*,
Mohammed Alshahrani
1,*,
Ebrahim Mohammed Senan
2,* and
Ibrahim Abdulrab Ahmed
1
1
Computer Department, Applied College, Najran University, Najran 66462, Saudi Arabia
2
Department of Artificial Intelligence, Faculty of Computer Science and Information Technology, Alrazi University, Sana’a, Yemen
*
Authors to whom correspondence should be addressed.
Mathematics 2023, 11(6), 1429; https://doi.org/10.3390/math11061429
Submission received: 15 February 2023 / Revised: 1 March 2023 / Accepted: 13 March 2023 / Published: 15 March 2023

Abstract

:
Breast cancer (BC) is a type of cancer suffered by adult females worldwide. A late diagnosis of BC leads to death, so early diagnosis is essential for saving lives. There are many methods of diagnosing BC, including surgical open biopsy (SOB), which however constitutes an intense workload for pathologists to follow SOB and additionally takes a long time. Therefore, artificial intelligence systems can help by accurately diagnosing BC earlier; it is a tool that can assist doctors in making sound diagnostic decisions. In this study, two proposed approaches were applied, each with two systems, to diagnose BC in a dataset with magnification factors (MF): 40×, 100×, 200×, and 400×. The first proposed method is a hybrid technology between CNN (AlexNet and GoogLeNet) models that extracts features and classify them using the support vector machine (SVM). Thus, all BC datasets were diagnosed using AlexNet + SVM and GoogLeNet + SVM. The second proposed method diagnoses all BC datasets by ANN based on combining CNN features with handcrafted features extracted using the fuzzy color histogram (FCH), local binary pattern (LBP), and gray level co-occurrence matrix (GLCM), which collectively is called fusion features. Finally, the fusion features were fed into an artificial neural network (ANN) for classification. This method has proven its superior ability to diagnose histopathological images (HI) of BC accurately. The ANN algorithm based on fusion features achieved results of 100% for all metrics with the 400× dataset.
MSC:
68T07

1. Introduction

Cancer is an abnormal growth of cells where cells divide without stopping to form new abnormal cells called benign or malignant tumors [1]. Thus, normal cells die while the abnormal (cancerous) cells continue to grow, crowding out normal cells [2]. BC is the second most common cancer in adult women [3]. Early detection of this type is necessary to receive appropriate treatment to cure and reduce the number of deaths. BC begins with benign tumors, which progress to malignant if there is no early diagnosis. There are different types of BC according to the type of cells and the area that affects the breast. The primary breast formation areas are the lobules, connective tissue, and ducts [4]. Milk is produced by the lobule glands, while milk is transferred to the nipple by the ducts. Connective tissue maintains the lobules and ducts and forms the natural breast. In general, BC cells begin to grow from ducts and lobules, and over time they develop and invade breast tissue and then spread to lymph nodes or other body organs [5]. According to a World Health Organization report, in 2020, 2.3 million cases of BC were diagnosed and 685,000 people died [6]. Symptoms differ from one person to another, but there are some essential warning symptoms, such as the presence of a breast lump or thickening, a tumor in a part of the breast, redness of the breast tissue, an abnormal change in the nipple area, or breast pain [7]. A lump inside the breast can be painful or painless; therefore, any lump in the breast should be examined immediately by a specialist. BC constitutes a public health concern because one out of every eight females experiences these symptoms and faces a diagnosis [8], and one out of every thirty-seven confirmed cases of BC dies. Thus, early diagnosis of BC is vital to a patient’s survival. Several techniques for detecting BC in clinical practice include mammography, thermal imaging, and histopathological images (biopsy). The biopsy is a highly efficient diagnostic approach that can determine whether an area is cancerous [9]. Several biopsy techniques are most common: necessary needle biopsy, fine needle aspiration, vacuum-assisted, and SOB [10]. Pathologists diagnose a biopsy by examining a slice of tissue under a microscope, which is the gold standard for BC detection and diagnosis [11]. The histopathological images are divided into benign and malignant lesions. Pathologists make their diagnostic decisions based on the triple assessment approach. However, manual diagnosis is time-consuming and requires an extensive workload from pathologists; moreover, inexperienced pathologists diagnosing pathological tissues is subject to misdiagnosis. Thus, computer-aided diagnostic techniques (CAD) are essential in diagnosing histopathological images [12]. The CAD techniques diagnose histopathological images and support doctors and experts with more efficient and accurate diagnostic results. Many studies have been conducted on the early diagnosis of BC. The presented [13] CNN model for diagnosing mammograms consisted of 21 benign, 17 malignant, and 183 images, which achieved an accuracy of 90.50%. The study [14] also found the highest accuracy of 85% for diagnosing malignant tumors. Experiments were conducted to evaluate the BreakHis dataset at 40× magnification, which achieved an accuracy of 92.1%. Researchers aim to achieve high diagnostic accuracy to help pathologists support their diagnostic decisions. This study aimed to develop many different systems methods and methodologies, which are hybrid techniques between deep and machine models and which involve feature extraction techniques using deep learning combined with handcrafted features.
The main contributions to this study are as follows:
  • Overlapping filters were applied: one to remove artifacts and the second to show the edges of regions of interest;
  • A hybrid method of CNN was applied for feature extraction and machine learning (SVM) to classify deep features with high accuracy;
  • Vectors of fusion features were produced using combining CNN and handcrafted features;
  • Automatic systems were developed that assist pathologists in making their decisions using diagnostic techniques.
The remainder of the paper is structured as follows: Section 2 reviews several previous studies. Section 3 describes the methods used to analyze and diagnose histopathological images of BC. Section 4 summarizes the evaluation findings of the methods. Section 5 discusses all the methods. Section 6 concludes the paper.

2. Related Work

Pin et al. [15] proposed using a method called CapsNet to diagnose histopathological images for the detection of BC. The methodology worked to extract the deep features, and the spatial and semantic information features were also extracted to obtain more representative features. The proposed method achieved good results, as it reached an accuracy of 92.71% with images with a magnification of 40×. Zahangir et al. [16] presented a CNN with a recurrent residual (RRCNN) method that combines ResNet, Inception-v4, and RCNN for BC diagnosis. The RRCNN method had good results compared to machine learning, which achieved an accuracy of 97.5%. Chuang et al. [17] proposed assembling multiple compact CNN models to classify BC images. First, by developing a hybrid CNN model from the global and local branches. Second, by embedding the squeeze-excitation-pruning into their hybrid model. The method yielded good results for diagnosing the BreakHis dataset, which reached a kappa of 74.8% and a PPV of 84.6%. Shweta et al. [18] used a hybrid ML model to classify the unbalanced BisQue and BreakHis datasets. In solving the imbalance of the two datasets using the ResNet50 model, the model performed well in diagnosing both minority and majority classes. Mesut et al. [19] proposed a new CNN called BreastNet for classifying BC images. BreastNet’s architecture is based on attention modules, in which data augmentation is processed for a dataset before it is fed into a model. Each image region is processed by attention modules and categorized by a hyper-column technique. The model achieved an accuracy of 88.36%, a precision of 90.29%, and a recall of 95.59%. Manisha et al. [20] proposed a method that involved transfer learning with deep convolution to classify the BreakHis dataset for BC diagnosis. The data in the minority class is first augmented and the pre-trained VGG16 model classifies the dataset; the model achieved an accuracy of 94% and an F1 score of 94% for both malignant and benign histology, respectively. Sudharshan et al. [21] proposed multiple instance algorithms to classify BC. The method produced good results for classifying the BreakHis dataset, which achieved 92.1% and 87.2% accuracy for pathological tissue classification with the magnification factors 40× and 200×, respectively. Maulana et al. [22] proposed several CNNs to extract features of histopathological images from the BreakHis dataset; then, these features were classified using SVM. The models produced good results for classifying the entire BreakHis dataset, where the linear SVM achieved an accuracy of 88%, an AUC of 93.99%, and a precision of 89.83%. Mahesh et al. [23] proposed a CNN based on residual learning from 152 layers called ResHist to diagnose the BreakHis dataset. The ResHist network classified the extracted features as malignant or benign images; the network achieved an accuracy of 84.34%. Heba et al [24]. presented an approach for extracting Hl features of BC by nondominated genetic algorithm and ant colony optimization and classified them using PNN. The system achieved an accuracy of 82.5% when the features were extracted by nondominated genetics and classified using PNN. Zhan et al. [25] introduced a CNN to extract features of BC images for the BreakHis dataset; they applied data augmentation techniques to eliminate the problem of overfitting. The system achieved an accuracy of 92.8% with the original dataset and an accuracy of 94.6% with the expanded dataset of 94.6%. Yun et al. [26] proposed a SE-ResNet model that represented an improvement when combining a squeeze block and a residual block. The system reached an accuracy of 98.87% for classifying binary classes. Budak et al. [27] presented a FCN model with Bi-LSTM for histological diagnosis. The FCN encoder extracts the features; then, the features’ dimensions were converted to one dimension and fed into Bi-LSTM for high-accuracy classification. The AlexNet reached an accuracy of 95.69% and 96.32 for histopathological images for magnification factors of 40× and 200×, respectively. Yasin et al. [28] proposed two deep transfer models based on DCNN pre-trained models to classify the BC dataset. The weights of the pre-trained CNN models were transferred as preliminary weights for diagnosing histopathological images of BC as malignant and benign tumors. The ResNet50 reached an accuracy of 96.94%, 98.1%, 96.15%, and 94.95% for histopathological images for magnification factors of 40×, 100×, 200×, and 400×, respectively.
Many researchers have devoted their efforts to reaching satisfactory results regarding the histopathological images diagnosis of BC. However, the shortcomings in getting promising results with the diversity of methods and methodologies are still lacking. What distinguishes our study is the application of several algorithms to extract the features of color, texture, and shape in a hybrid way and then combine them with the features extracted by deep learning and then classify them by using an ANN algorithm.

3. Materials and Methods

This section presents various methodologies and materials for diagnosing histopathological images of the BC dataset with four MF, 40×, 100×, 200×, and 400×, as described in Figure 1. The first step is enhancing the histopathological images of the dataset to remove noise and artifacts. Two proposed methods were presented: The first system is a hybrid technology of CNN and SVM. The second system diagnoses the dataset by using an ANN algorithm based on fusion features. Then, fusion features were reduced using the PCA.

3.1. Dataset Description

The most efficient method for diagnosing BC is taking biopsies from the patient’s breast. Biopsies are slices of pathological tissue surgically removed from the breast area. The proposed systems were evaluated in this study using the BreakHis dataset consisting of 7909 histopathological images. This dataset was collected from the P&D laboratory in Brazil in 2014 [29]. The dataset is split into two main parts: benign tumors, which consist of 2480 histopathological images and malignant tumors, which consist of 5429 histopathological images. The dataset contains histopathological images magnified under the microscope by magnification of 40×, 100×, 200×, and 400×, as shown in Table 1. Figure 2a shows a set of histopathological samples for malignant and benign classes of MF of 40×, 100×, 200×, and 400×.

3.2. Enhancing Histopathological Images

The histopathological images contain noises and artifacts resulting from blood staining and mixing with some medical solutions, and therefore this noise affects the accuracy of the diagnosis. Therefore, optimization techniques must be applied to obtain accuracy in the next stages of pretreatment. This study enhanced the images with the same techniques for all the proposed systems [30]. The color mean of each satisfactory histological image was set in RGB color space; then, scaling was set to achieve color consistency for each histological image. The pre-processing is performed by average and Laplacian filters, respectively. In the first step, the average filter is applied with a size of 6 × 6 pixels, which replaces the pixel with an average of 35 pixels. The filter continues to work until all the image pixels are targeted, thus obtaining an enhanced image with high contrast, as in Equation (1).
f m = 1 L i = 0 M 1 y m i  
where f m refers to the input, y m i   refers to the prior input, and M refers to the pixels in the images.
In the second step, a Laplacian filter is applied to the images of the pathological tissue. Equation (2) describes how the Laplacian filter works on each image in the dataset.
  2   f =   2   f   2   x +   2   f   2   y
where     2   f represents the second-order differential equation and x, y represents the location of pixels of the matrix.
Finally, the image obtained from the average filter overlaps with the image enhanced by the Laplacian filter to obtain the final enhanced image, as shown in Equation (3).
I m a g e   e n h a n c e d = f m   2   f  
Figure 2b shows the images of BC after the improvement from all amplification factors.

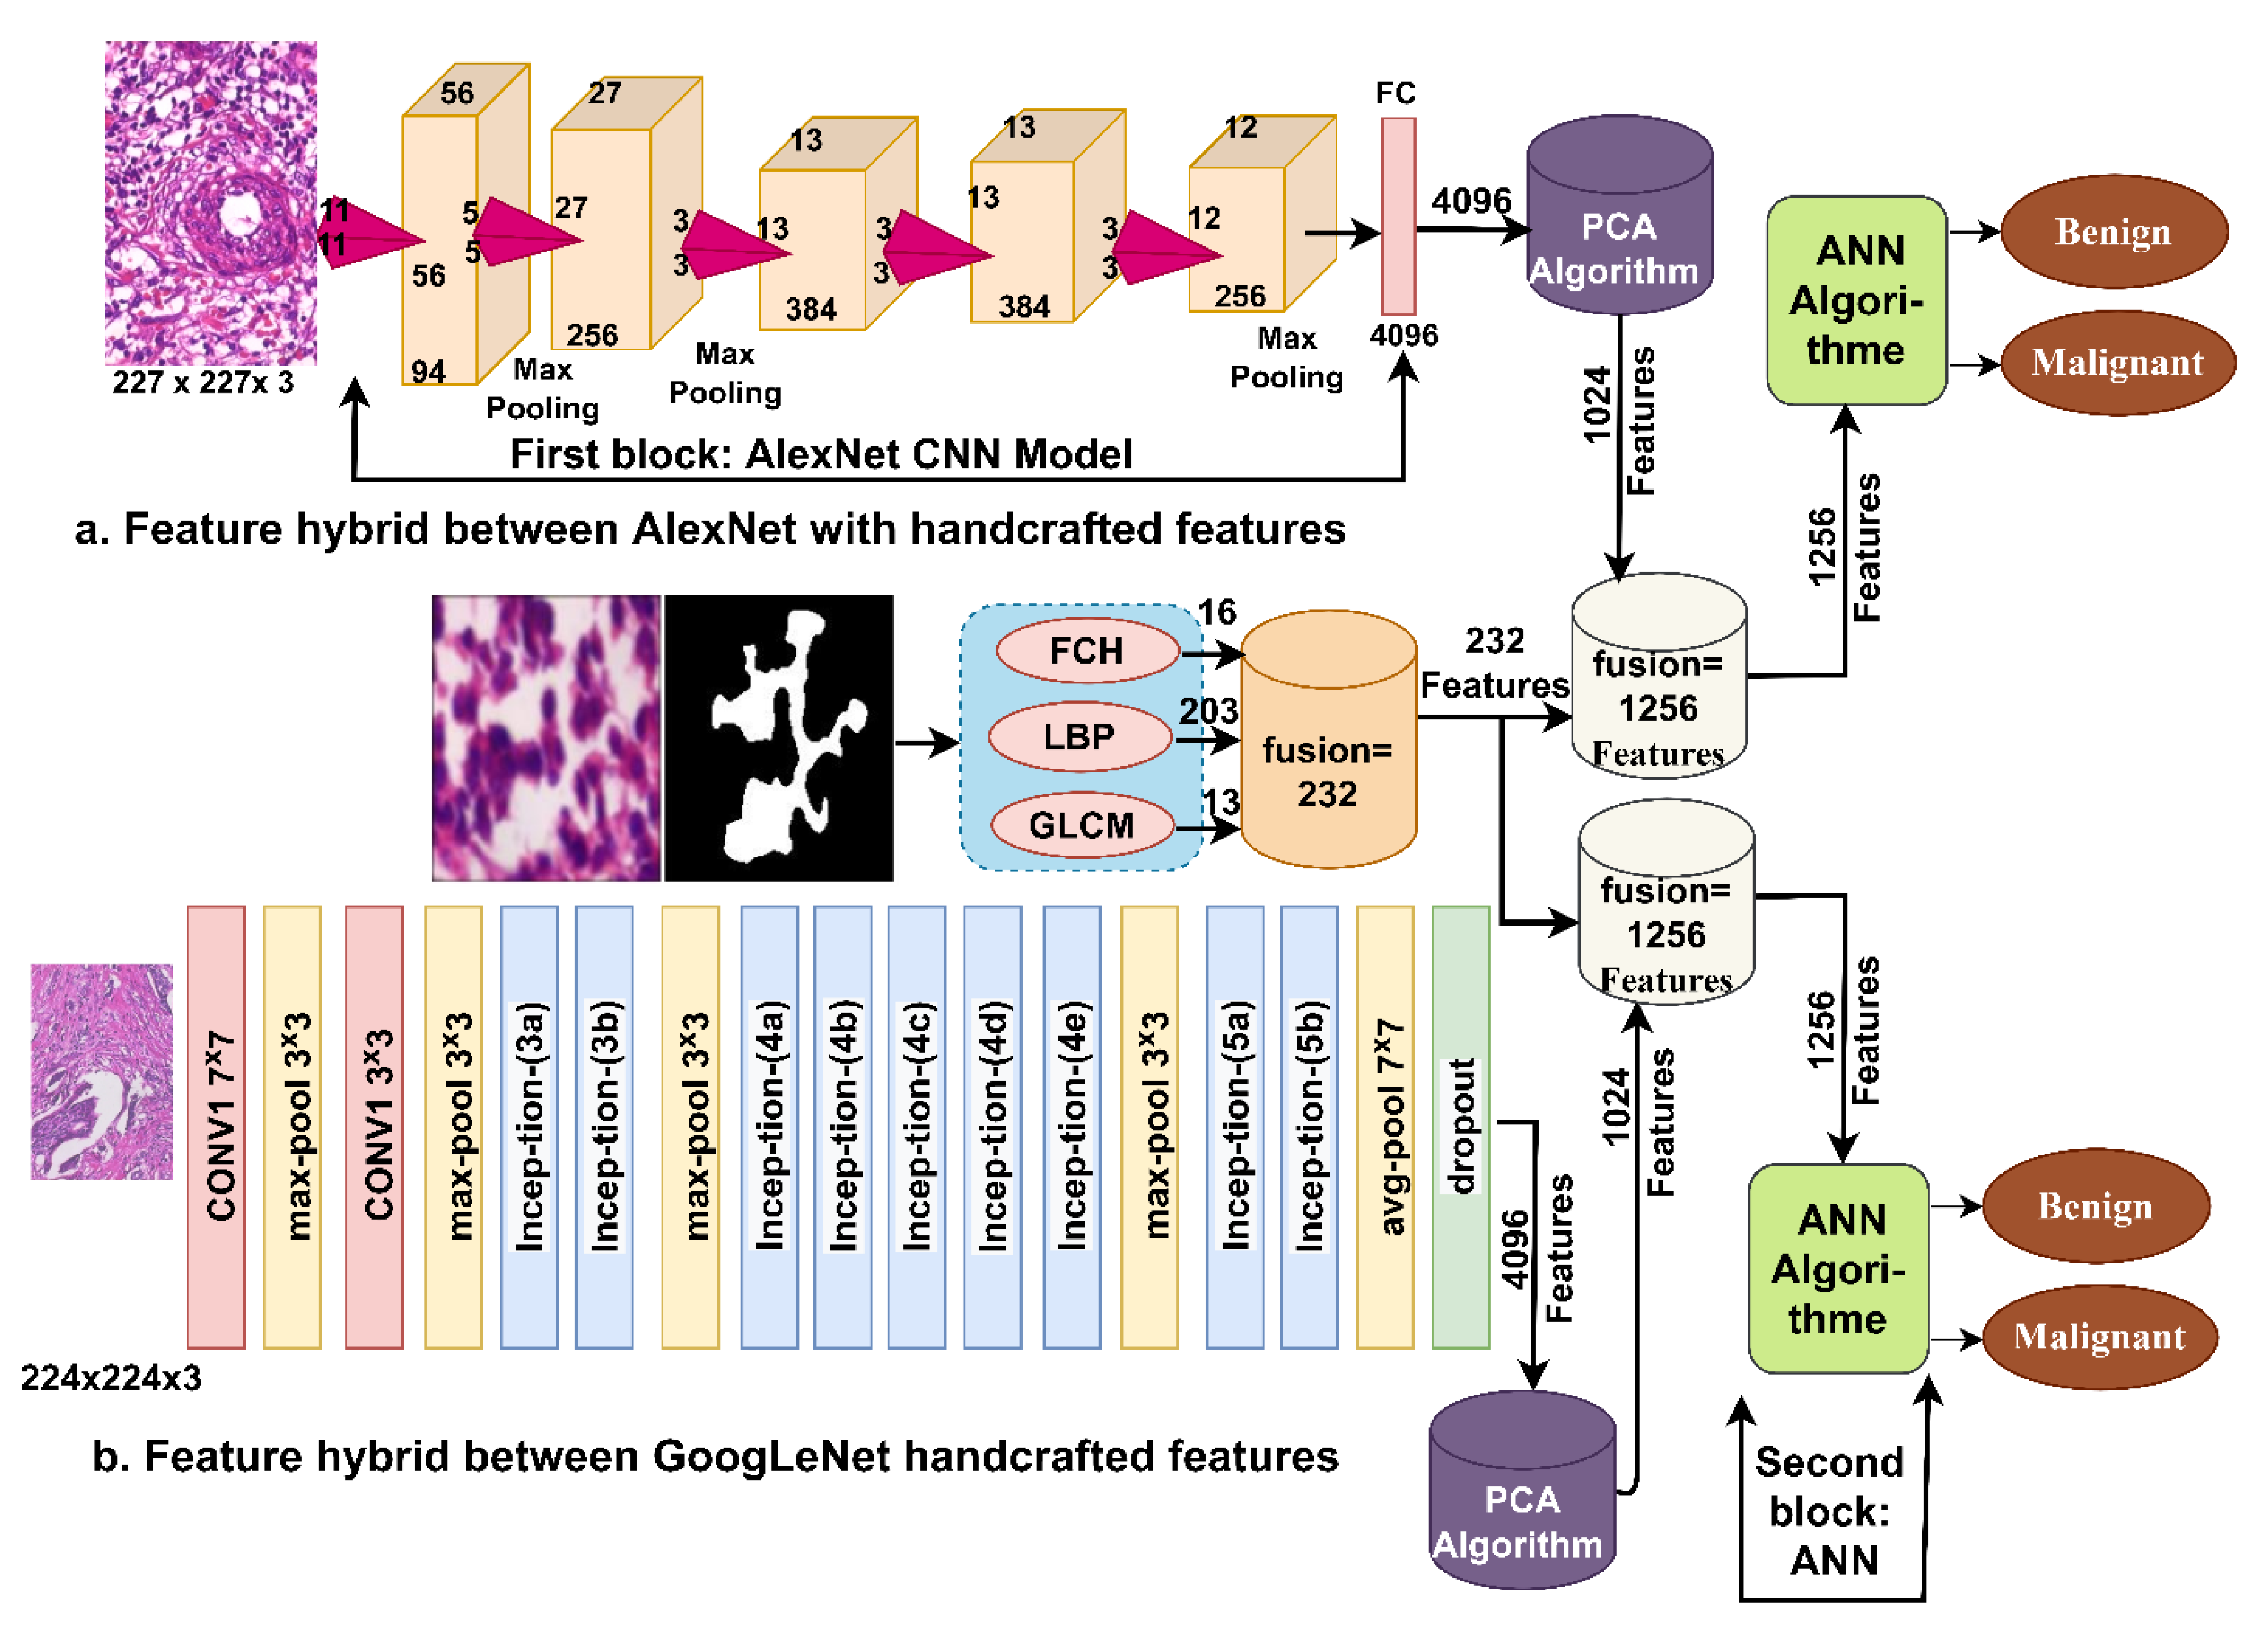
3.3. Hybrid of CNN and SVM

This section presents a modern hybrid technology of deep and machine models. The first block represents AlexNet and GoogLeNet models; the task of these models is to extract features and save them in feature vectors [31]. The second block is the SVM algorithm, which classifies the features. Many reasons prompted us to use this technique, where the most important of which was to improve the accuracy of diagnosing the BC dataset. In addition, the CNN requires high computer specifications and is time-consuming in training the dataset, so this proposed technique solves this challenge.

3.3.1. Feature Extraction

Deep learning models have many layers that extract highly accurate features and eliminate the need for manual feature extraction. The CNN extracts the features and trains them in the training stage. Deep learning models have a superior ability to extract features with high accuracy and efficiency that distinguishes them from other types of models. The CNN extracts the features in many levels and layers [32]. Each layer extracts certain features and performs a special task involved in extracting features.
This section will supply a brief explanation of the essential layers that were used in this study as follows:
Convolutional layers (CL): Deep learning models contain many CLs. The CLs are one of the essential layers of convolutional neural networks. Three parameters supervise the tasks of the CL: filter size, p-step, and zero padding [33]. Each CL has a specific filter size. The filter f (t) wraps around a particular region of the target image x (t). The filter moves around the image each time according to the p-step parameter. The task of zero padding is to preserve the edges of the original image. Equation (4) shows how the filter wraps around the image.
y t = x f t = x a f t a   d a  
where f (t) refers to the filter, y(t) is the output, and x(t) represents the image input.
Pooling layer (PL): Convolutional layers produce millions of parameters and thus pose a computational problem. Therefore, deep learning models provide PLs that decrease the dimensions of the input images represented by the deep features. Two methods of pooling are max pooling and average pooling [34].
First, max-pooling layers choose a set of image pixels and replace all chosen values with a single max value from the chosen values, as shown in Equation (5). Second, average-pooling layers select a set of image pixels and work to calculate the average of these specified values and replace them, as shown in Equation (6).
P i ;   j = m a x m , n = 1 . k   A i 1 p + m ;     j 1 p + n
P i ;   j = 1 k 2 m , n = 1 . k A i 1 p + m ;     j 1 p + n
where A refers to the pixels of the filter; m, n represent the location of the matrix; k represents the matrix size; and p is the filter move (step).
There are auxiliary layers like the rectified linear unit (ReLU), which follow the CLs for further processing. These layers pass positive values while changing negative values to zero as is shown in Equation (7).
ReLU x = max   0 ,   x   = x ,             x 0 0 ,           x < 0  
Thus, in this part, the deep features are extracted and stored in the feature matrix. In this study, the deep features of AlexNet [35] and GoogLeNet [36] models were extracted.

3.3.2. SVM Classifier

This section uses the SVM algorithm to classify features of AlexNet and GoogLeNet quickly and with high accuracy.
The SVM algorithm is one of the supervised algorithms that is a part of machine learning. Each feature value represents a specific coordinate value. When the classification starts, the algorithm finds a space between the two classes called hyper-plane. The SVM algorithm aims to detect the best hyper-plane that separates extracted features into appropriate classes so that in the future, any new features (data points) can easily be categorized into their appropriate class. The algorithm selects points that assist it in finding the best hyper-plane [37]. These points are called support vectors, and they are data points that form the maximum margin between the two classes and are close to the hyper-plane. The SVM has two types: linear and nonlinear. Linear SVM is used when the dataset is separable, which means that the data points are categorized by a straight line separating the two classes. nonlinear SVM is used when the dataset is not separable [38]. In our study, the algorithm uses the linear SVM method, which separates the BC dataset into two classes as features of malignant tumors and features of benign tumors.
This study used AlexNet and GoogLeNet models to extract the features with high accuracy and save them in the features matrix, which is the second block for classification using SVM, as shown in Figure 3.

3.4. ANN Based on the Fusion Features

This section presents a hybrid feature extraction method in which the features of CNN are combined with features extracted by FCH, LBP, and GLCM. Then, these fusion features are classified by the ANN algorithm. This method is characterized by achieving superior diagnostic accuracy in addition to its speed in training the dataset, as it requires medium-cost computer resources.
The underlying working of this proposed method is as follows: First, the dataset is enhanced for all MF: (40×, 100×, 200×, and 400×) before being fed into CNN models (AlexNet and GoogLeNet); then, it is fed into CNN for feature extraction. The last layer in the two CNN models produced the most important representative features: 4096 features for both models. Thus, four feature matrices with size 1995 × 4096, 2081 × 4096, 2013 × 4096, and 1820 × 4096 for the dataset with magnification 40×, 100×, 200×, and 400×, respectively.
Second, it is noted that the deep features extracted by CNN are high-dimensional, where 4096 features were produced for each histological image. Therefore, PCA was used to reduce the dimensions. The PCA algorithm decreases the dimensions and extracts each histological image’s most important representative features [39]. Thus, the feature matrix after reducing the dimensions becomes 1995 × 1024, 2081 × 1024, 2013 × 1024, and 1820 × 1024 for the dataset with magnification 40×, 100×, 200×, and 400×, respectively.
Third, the features were extracted by FCH, LBP, and GLCM, and all the features were fused. The FCH algorithm extracts 16 color features [40], the LBP extracts 203 texture features [41], and the GLCM extracts 13 texture features [42]. Then, all the features were combined in a hybrid method; after the merger, it resulted in 232 features. Thus, it became a features matrix with size 1995 × 232, 2081 × 232, 2013 × 232, and 1820 × 232 for the dataset with magnification 40×, 100×, 200×, and 400×, respectively.
The reason for choosing the FCH algorithm is because color is a strong characteristic in diagnosing histopathological images of BC and for its ability to extract the chromatic features based on the histogram bin for each color given in the image. The LBP algorithm was chosen for its ability to distinguish pixels by examining each pixel with its neighbors and thus previewing the image density. Finally, the GLCM algorithm measures the relationship of each pixel to its neighbors according to the angle and distance of each adjacent pixel to the central pixel. Thus, the spatial relationship and texture discrimination are set because the pixels with similar values have a smooth texture. In contrast, the pixels with very different values have a rough texture.
Fourth, the fusion features are obtained by merging the features extracted by AlexNet and GoogLeNet with the handcrafted features extracted by FCH, LBP, and GLCM; thus, after merging, each histopathological image has 1256 features. Finally, the fusion features are stored in a new feature matrix with sizes 1995 × 1256, 2081 × 1256, 2013 × 1256, and 1820 × 1256 for the dataset with magnification 40×, 100×, 200×, and 400×, respectively.
The fusion features were finally fed to ANN. The ANN contains an input layer with input units with the same number as the number of features extracted, which is 1256 features. There are many hidden layers in which complex computations are performed to perform the required tasks; in this study, the ANN was set to 10 hidden layers. The output layer with two units was malignant and benign tumors.
Figure 4 describes the methodology structure for diagnosing breast cancer by ANN based on fusion features.

4. Results

4.1. Splitting Dataset

This study aimed at early and reliable diagnosis of histopathological images of BC by using diverse and hybrid methods and methodologies. The dataset contains 7909 images distributed over four MF: 40×, 100×, 200×, and 400×, with each containing two classes: malignant and benign tumors. The dataset was split into 80% for training and validation data and 20% for testing new data. Table 2 describes the dataset’s distribution during the implementation of all phases of the system. The performance of the systems was applied on a computer with the specifications of the Intel® i5 processor 6th, generation GPU 4 GB, and RAM 12 GB.

4.2. Evaluation Metrics

In this work, two proposed systems have been applied; each with more than one model as a hybrid technology approach between CNN and SVM. Moreover, the method of merging the features extracted using CNN (AlexNet and GoogLeNet) with handcrafted features was also employed. Several computational criteria evaluated the performance of these systems, which are described in Equations (8)–(12). The information on the variables in the equations was acquired from the confusion matrix produced by the systems. The confusion matrix contains all correctly classified (TP and TN) and incorrectly classified (FP and FN) images [43].
Accuracy = TN + TP TN + TP + FN + FP     100 %  
Precision = TP TP + FP     100 %
Sensitivity = TP TP + FN     100 %  
Specificity = TN TN + FP     100  
AUC   = True   Positive   Rate False   Positive   Rate = Sensitivity Specificity  
where TP are histopathological images properly classified as malignant tumors, TN are histopathological images properly classified as benign tumors, FP are histopathological images of benign tumors classified as malignant, and FN are histopathological images of malignant tumors classified as benign tumors.

4.3. Data Augmentation Method

The dataset contains two unbalanced classes, where it is noted that the histopathological images of the malignant tumors are much more obvious than that of the benign tumors. Therefore, accuracy tends to favor the majority class (i.e., malignant tumors), which is a challenge that CNN models face [44]. In addition, a CNN demands a massive dataset to avert the problem of overfitting. Therefore, CNN models solve these problems by artificially increasing the number of images during the training phase using various operations such as rotating to obtain many different angles as well as shifting and flipping. This method also addresses the problem of the unbalanced dataset by generating more images of the minority class than of the majority class. Table 3 summarizes the dataset of histopathological images before and after the data augmentation method. It is noted that the pictures of the minority classes increased in number by more than the majority classes.

4.4. Results of Hybrid of CNN and SVM

In this section, we review the performance of the hybrid technology, which consists of two parts: First, AlexNet and GoogLeNet extract deep features of HI. Second, the SVM classifies features with high accuracy. The latter technique is characterized by excellent results and speed in training the dataset, as it is implemented on a medium-cost computer. Table 4 summarizes the performance of hybrid networks for histopathological images diagnosis with MF of 40×, 100×, 200×, and 400× for early detection of BC.
It is noted that the best accuracy achieved by hybrid technologies was from the AlexNet + SVM technique with a dataset with a magnification of 100×, which achieved an accuracy of 98.8%, precision of 98.5%, sensitivity of 98.67%, specificity of 98.74%, and AUC of 99.39%.
It is noted that the AlexNet + SVM technique outperformed the GoogLeNet + SVM technique with a dataset of 40×, 100×, and 200× magnification. While the GoogLeNet + SVM technique outperformed the AlexNet + SVM technique when using images with a magnification of 400×.
Figure 5 shows the performance of hybrid technology for evaluating histopathological images of the BC dataset with MF: 40×, 100×, 200×, and 400×.
Figure 6 shows the confusion matrix of AlexNet + SVM and GoogLeNet + SVM of a dataset with a magnification of 40×. AlexNet + SVM and GoogLeNet + SVM yielded an accuracy of 97.2% and 95.2%, respectively. The two techniques also yielded an accuracy of 96.8% and 92% for diagnosing benign tumors, while they yielded an accuracy of 97.4% and 96.7% for diagnosing malignant tumors.
Figure 7 shows the performance results of the AlexNet + SVM and GoogLeNet + SVM methods for evaluating the BC dataset with a magnification of 100×, where AlexNet + SVM and GoogLeNet + SVM reached an accuracy of 98.8% and 95.4%, respectively. These two hybrid technologies yielded an accuracy of 98.4% and 90.2% for diagnosing benign tumors, while they yielded an accuracy of 99% and 97.6% for diagnosing malignant tumors.
Figure 8 describes the confusion matrix yielded by performing the AlexNet + SVM and GoogLeNet + SVM hybrid technologies on a dataset with a magnification of 200×. AlexNet + SVM and GoogLeNet + SVM reached an accuracy of 97.5% and 96.3%, respectively. The two techniques also yielded an accuracy of 93.6% and 91.2% for diagnosing benign tumors, while they yielded an accuracy of 99.3% and 98.6% for diagnosing malignant tumors.
Figure 9 shows the results of the AlexNet + SVM and GoogLeNet + SVM hybrid methods for BC dataset evaluation with a magnification factor of 400×, where AlexNet + SVM and GoogLeNet + SVM reached an accuracy of 95.9% and 96.7%, respectively. These two hybrid technologies reached an accuracy of 94.1% and 94.1% for diagnosing benign tumors, while they yielded an accuracy of 96.7% and 98% for diagnosing malignant tumors.

4.5. Results of the ANN Based on the Fusion Features (CNN with Handcrafted)

This section discusses the results of evaluating the histopathological images of BC using ANN based on fusion features. This method extracts the essential features of each HI, merging them in the same feature vectors, and classifying them with high accuracy [45]. The parameters of the ANN algorithm were set to the best performance by trial and error. There are several evaluation tools through which the performance of an ANN was evaluated based on the fusion features, as shown below.

4.5.1. Best Validation Performance

The cross-entropy is one of the performance measures of the ANN network for diagnosing histopathological images for the early detection of BC. The dataset is evaluated in each epoch by obtaining the minimum square error (MSE) between the actual and expected values measured during each of the epoch’s phases [46]. Table 5 describes the performance of the ANN of the BC dataset for four magnifications: 40×, 100×, 200×, and 400×. The best validation performance with epoch was achieved by ANN based on the fusion features of AlexNet with FCH, LBP, and GLCM, and additionally of GoogLeNet with FCH, LBP, and GLCM with magnifications 40×, 100×, 200×, and 400×.

4.5.2. Error Histogram

The error histogram is an ANN execution measure for diagnosing the histopathological images of the BC dataset. The dataset is evaluated during all phases; the algorithm continues until it reaches the MSE between the target and output values [47]. Table 5 summarizes the error histogram values achieved by the ANN algorithm based on the fusion features of AlexNet with FCH, LBP, and GLCM, and additionally of GoogLeNet with FCH, LBP, and GLCM with magnification 40×, 100×, 200× and 400×.

4.5.3. Gradient

The gradient is also an ANN evaluation tool for classifying the BC dataset. The gradient tool finds the error rate between the expected and actual values [48]. Table 5 summarizes the best epoch gradient values achieved by the ANN algorithm based on the fusion features of AlexNet with FCH, LBP, and GLCM, and additionally of GoogLeNet with FCH, LBP, and GLCM with magnification 40×, 100×, 200×, and 400×.

4.5.4. Receiver Operating Characteristic (ROC)

The ROC is one of the important performance measures of ANN for diagnosing the histopathological images of BC. The BC dataset is evaluated during all phases by finding all true positive samples on the y-axis and false-positive samples on the x-axis [49]. Table 5 describes the performance of the ANN on the BC dataset; it is noted from the table that the ROC values, which is also referred to as the area under the curve (AUC), that the ANN achieved based on the fusion features of AlexNet with FCH, LBP, and GLCM, and additionally of GoogLeNet with FCH, LBP, and GLCM with magnifications 40×, 100×, 200×, and 400×.

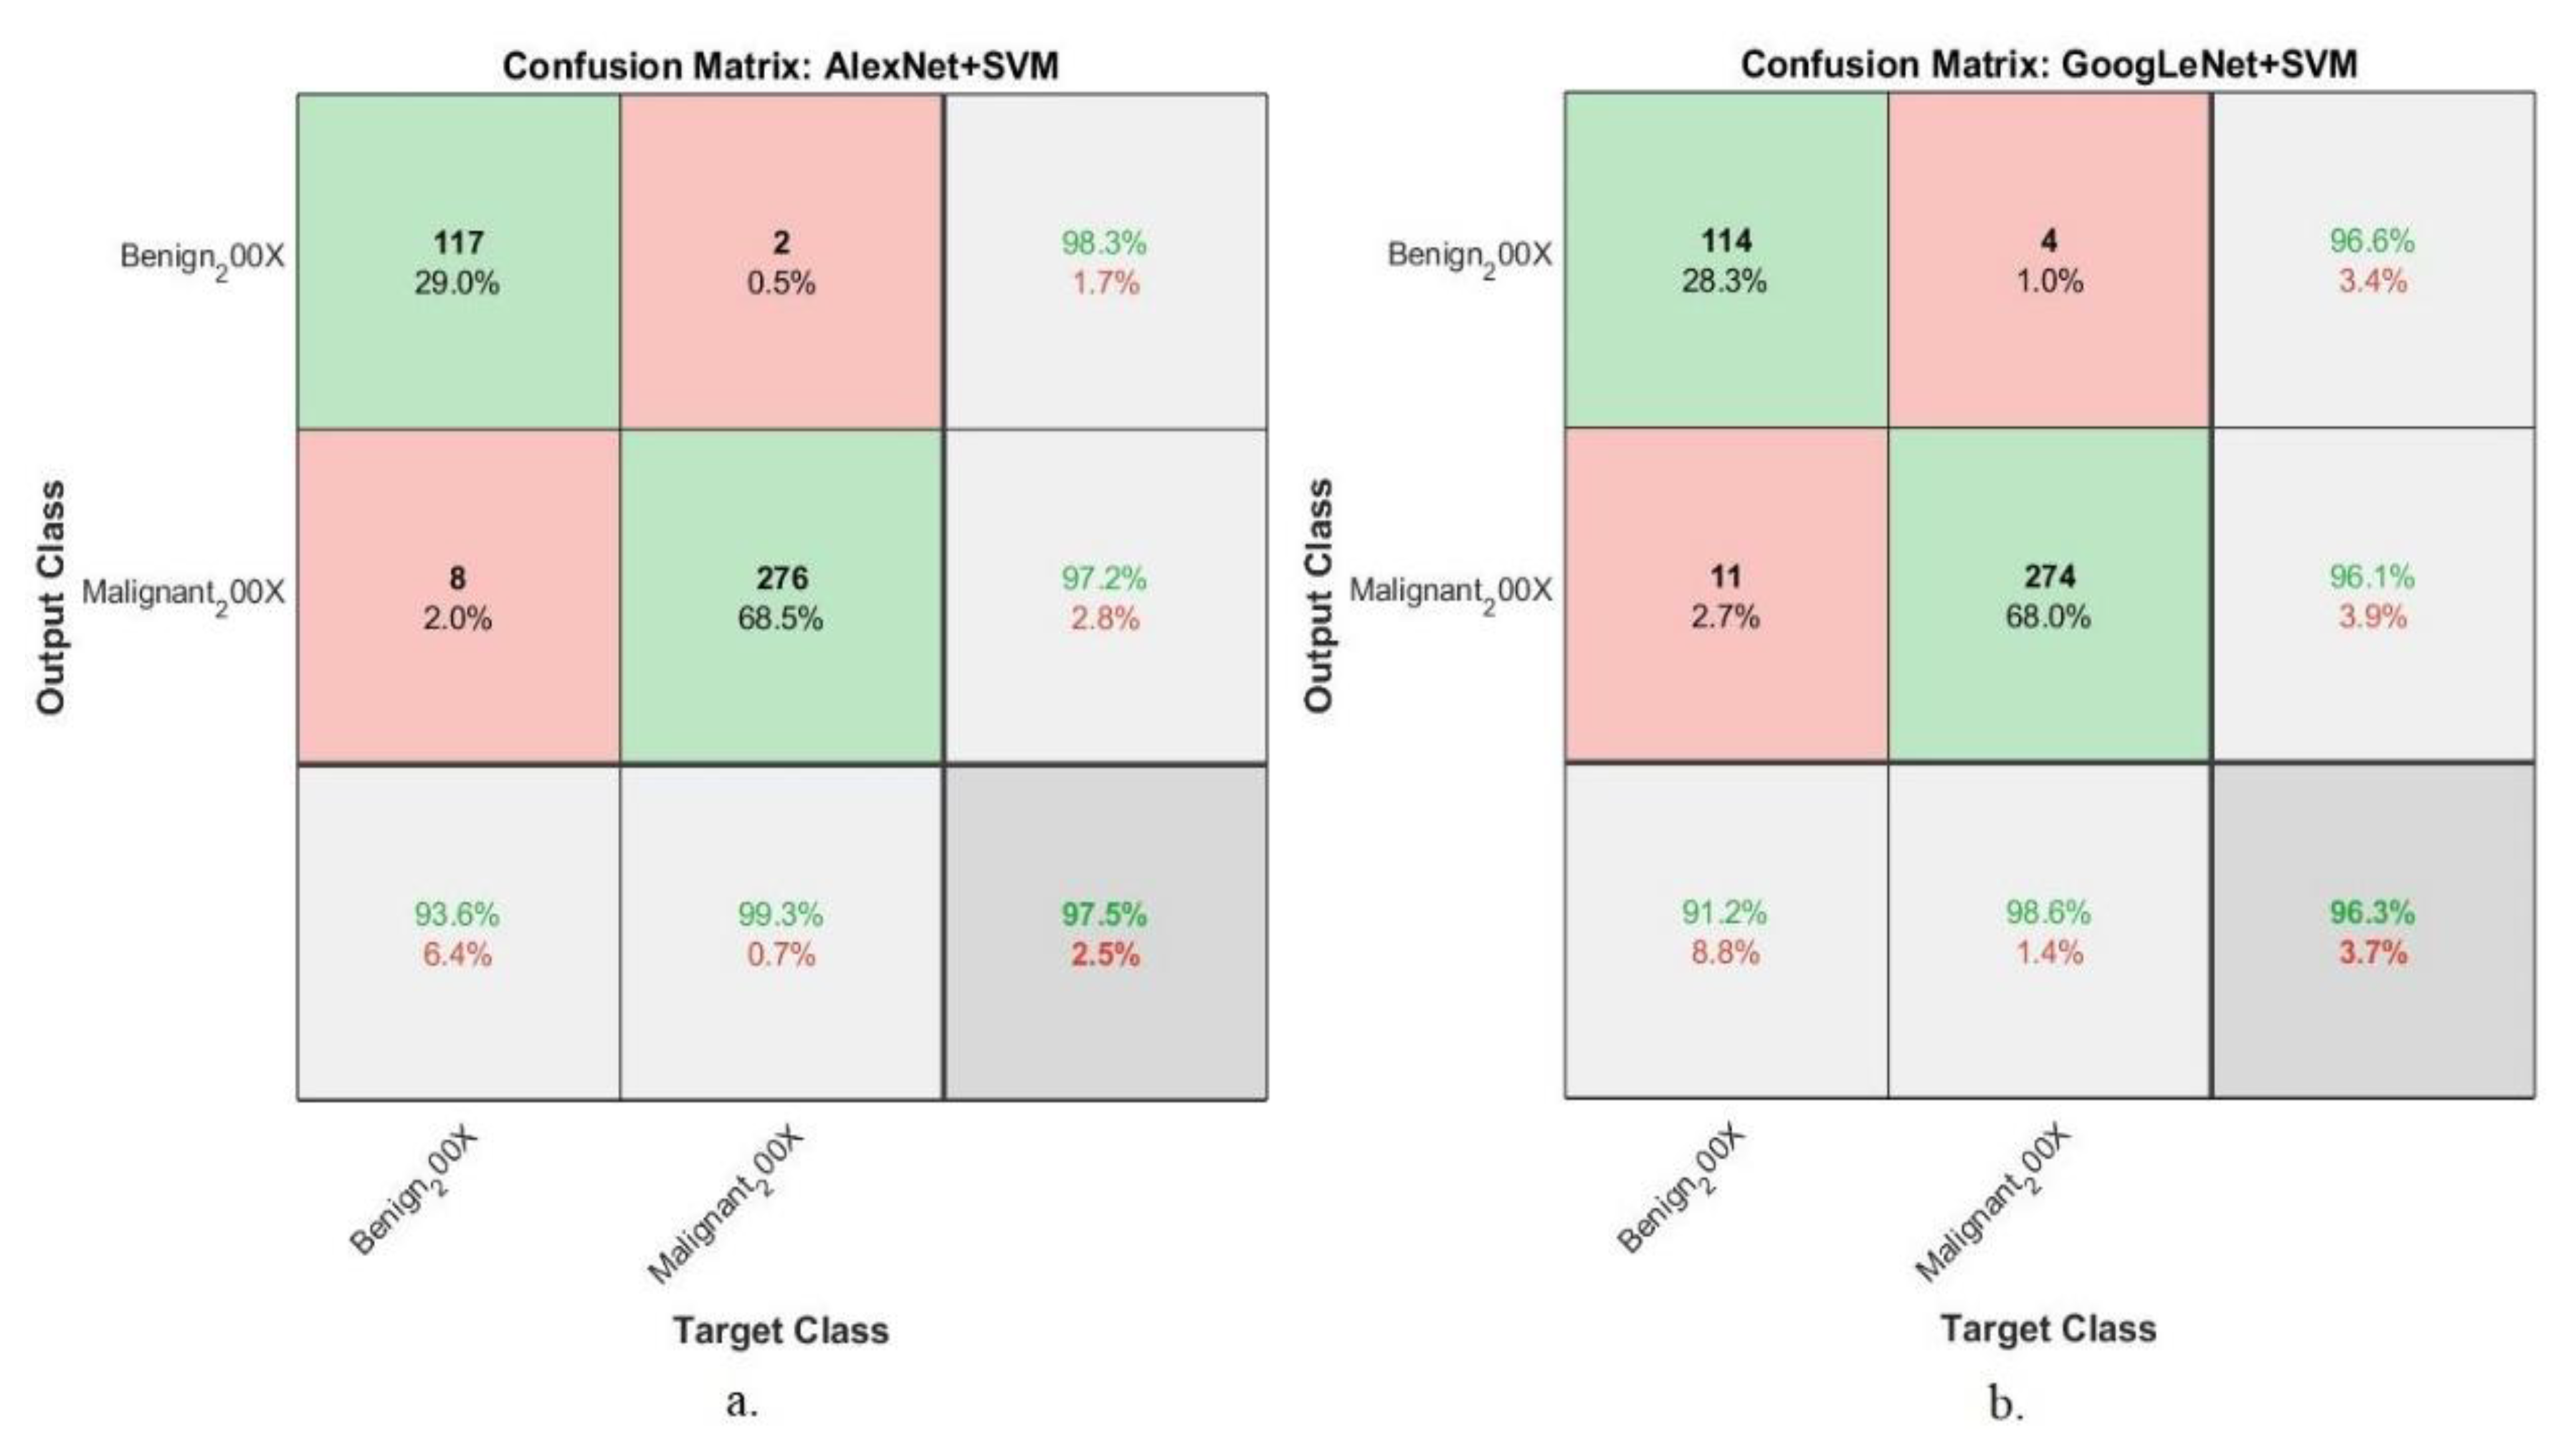
4.5.5. Confusion Matrix

The confusion matrix is the primary metric for evaluating all systems. This study diagnosed the histopathological images of BC by ANN algorithm based on the fusion features. The fusion Features are extracted using the AlexNet and handcrafted features and a hybrid method between the GoogLeNet and handcrafted features. These fusion features were extracted from the BC dataset with MF 40×, 100×, 200×, and 400× and fed to ANN for high-efficiency diagnosis.
Table 6 and Figure 10 summarizes the results of the ANN based on the fusion features. The ANN has achieved promising results when fed with fusion features. It is worth noting that the BC dataset was acquired with MF, which are 40×, 100×, 200×, and 400×, and the fusion features of the dataset were extracted with all MF.
First, with the dataset at 40× magnification, the ANN based on the fusion features of the AlexNet and handcrafted approaches yielded an accuracy of 99.2%, precision of 99.5%, sensitivity of 99.42%, specificity of 99.23%, and AUC of 99.69%. In contrast, the ANN based on the fusion features of the GoogLeNet and handcrafted approaches yielded an accuracy of 99.5%, precision of 99.72%, sensitivity of 99.21%, specificity of 99.43%, and AUC of 99.62%.
Second, with the dataset with a magnification factor of 100×, an ANN based on the fusion features of the AlexNet and handcrafted approaches yielded an accuracy of 99.8%, a precision of 100%, a sensitivity of 99.82%, a specificity of 99.67%, and AUC of 98.84%. In contrast, an ANN based on the fusion features of the GoogLeNet and handcrafted approaches yielded an accuracy of 99.5%, precision of 99.64%, sensitivity of 99.11%, specificity of 99.23%, and AUC of 99.28%.
Third, with the dataset with a 200× magnification factor, an ANN based on the fusion features of the AlexNet and handcrafted approaches yielded an accuracy of 99.5%, precision of 99.58%, sensitivity of 99.75%, specificity of 99.34%, and AUC of 99.11%. In contrast, an ANN based on the fusion features of the GoogLeNet and handcrafted approaches yielded an accuracy of 99.8%, precision of 99.81%, sensitivity of 100%, specificity of 100%, and AUC of 99.03%.
Fourth, with the dataset with a magnification factor of 400×, an ANN based on the fusion features of the AlexNet and handcrafted approaches yielded an accuracy of 100%, a precision of 100%, a sensitivity of 100%, a specificity of 100%, and AUC of 100%. In contrast, an ANN based on the fusion features of the GoogLeNet and handcrafted approaches yielded an accuracy of 99.7%, precision of 99.78%, sensitivity of 100%, specificity of 100%, and AUC of 99.75%.
Figure 11 shows the confusion matrix of the ANN for diagnosing histopathological images of the BC dataset at a 40× magnification factor. The ANN algorithm was fed with fusion features, which produced the confusion matrix as Figure 11a, which reached an overall accuracy of 99.2% and an accuracy of diagnosing benign tumors of 97.6%; in contrast, it reached an accuracy of 100% for diagnosing malignant tumors. The ANN was fed with fusion features, which produced the confusion matrix as shown in Figure 11b, which reached an overall accuracy of 99.5% and an accuracy of diagnosing benign tumors of 98.4%; in contrast, it reached an accuracy of 100% for diagnosing malignant tumors.
Figure 12 shows the confusion matrix of the ANN for classifying histopathological images of a BC dataset at a magnification factor of 100×. The ANN algorithm was fed with fusion features, which produced the confusion matrix as shown in Figure 12a, which reached an overall accuracy of 99.8% and an accuracy of 99.2% in diagnosing benign tumors; in contrast, the diagnostic accuracy reached 100% in diagnosing malignant tumors. The ANN algorithm was fed with fusion features, which produced the confusion matrix as in Figure 12b, which reached an overall accuracy of 99.5% and an accuracy of 98.4% in diagnosing benign tumors; in contrast, it obtained an accuracy of 100% for diagnosing malignant tumors.
Figure 13 shows the confusion matrix of the ANN for classifying a BC dataset with a magnification factor of 200×. The ANN algorithm was fed with fusion features, which produced the confusion matrix as in Figure 13a, which reached an overall accuracy of 99.5% and an accuracy of 98.4% in diagnosing benign tumors; in contrast, the diagnostic accuracy reached 100% in diagnosing malignant tumors. The ANN algorithm was fed with fusion features, which produced the confusion matrix as in Figure 13b, which reached an overall accuracy of 99.8% and an accuracy of 100% in diagnosing benign tumors; in contrast, it obtained an accuracy of 99.6% for diagnosing malignant tumors.
Figure 14 shows the confusion matrix of the ANN algorithm for classifying a BC dataset with a magnification factor of 400×. The ANN algorithm was fed with fusion features, which produced the confusion matrix as in Figure 14a, which reached an overall accuracy of 100% and an accuracy in diagnosing benign tumors of 100%; in contrast, the diagnostic accuracy reached 100% in diagnosing malignant tumors. The ANN algorithm was fed with fusion features, which produced the confusion matrix as in Figure 14b, which reached an overall accuracy of 99.7% and an accuracy of 100% in diagnosing benign tumors; in contrast, it obtained an accuracy of 99.6% for diagnosing malignant tumors.

5. Discussion and Comparison of the Systems

In this study, several proposed methods with various methodologies and methods aimed at early diagnosis of histopathological images of BC dataset with MF of 40×, 100×, 200×, and 400×. The proposed systems include hybrid technologies between CNN and SVM models; moreover, proposed systems by ANNs based on the fusion features extracted first by using AlexNet with FCH, LBP, and GLCM, and second by using GoogLeNet with FCH, LBP, and GLCM. The systems achieved superior results in the early diagnosis of BC. Since the dataset is a surgical biopsy, it contains blood smears and noise; therefore, all dataset images were optimized with two overlapping filters: average and Laplacian. To avoid the problem of overfitting, the data augmentation approach was implemented to create images from the same dataset artificially.
Several previous related studies focused on the classification of the BreakHis breast cancer dataset by using pre-trained CNN models or by machine learning algorithms based on feature extraction by conventional methods. Instead, this study focused on extracting features of tissue images of the BreakHis dataset using AlexNet and GoogLeNet models, selecting the most important features, deleting duplicates by PCA, and classifying them by ANN and SVM networks. Moreover, this study focused on extracting the features of shape, color, and texture by means of FCH, LBP, and GLCM methods, and integrating them into feature vectors. The other approaches of this study and the most important contributions were by fusion between features of CNN models and FCH, LBP, and GLCM methods. Thus, each image was represented by highly representative features mixed between the features of CNN models and the features of shape, color, and texture, and this was not found in the previous literature. Thus, the proposed systems achieved superior results due to a focus on integrating features from more than one method.
Muhammad et al. [50] developed a methodology to extract features by using 6B-Net and combining that with features of ResNet50 and then selecting features by entropy-based selection (EBS) to classify the BreakHis dataset. The model achieved an accuracy of 86.90% in diagnosing the BreakHis dataset. Roseline et al. [51] developed a hybrid MobileNet-SVM model for classifying histopathological images the BreakHis breast cancer dataset, reaching an accuracy of 91%. David et al. [52] developed three models to extract a bag of deep multi-resolution convolutional features (BoDMCF) and classify them by SVM. Based on the BoDMCF histology characteristics, Renent18 achieved a magnification factor of 200×, an accuracy of 89.4%, a sensitivity of 86.1%, a precision of 80.9%, and an AUC of 88.49%. Marwa et al. [53] employed an arithmetic optimization algorithm with the histopathological breast dance (AOA-HBCC) based on noise removal and contrast enhancement. Feature vectors were derived using the SqueezeNet model and classified using the deep belief network. The AOA-HBCC achieved an accuracy of 96.40%, a sensitivity of 95.93%, and a specificity of 95.93%. Manar et al. [54] proposed the use of the bald eagle model with a deep learning model to diagnose histopathological images of breast cancer. The images were processed by the median filter, features extracted by synergic deep learning, and classified by LSTM. The model reached an accuracy of 98.67%, a sensitivity of 92.19%, a specificity of 99.18%, and a precision of 92.79%.
Table 7 and Figure 15 describe the experimental results of the system’s performance for histopathological images diagnosis for detection of BC in the BC dataset with four histological magnifications. Based on the fusion features, the ANN network achieved superior results, which were better than the hybrid technologies. It is worth noting that the ANN was fed with fusion features extracted using AlexNet with FCH, LBP, and GLCM, as well as using GoogLeNet with FCH, LBP, and GLCM. Therefore, these features are the most critical representative features for each histological image. Based on the fusion features of AlexNet with FCH, LBP, and GLCM, the ANN reached an accuracy of 100% in diagnosing benign and malignant tumors and an overall accuracy of 100% with the dataset at a magnification of 400×. The hybrid technologies of CNN with SVM achieved diagnostic accuracy ranging from 95.2% using GoogLeNet + SVM with 40× magnification to the accuracy of 98.8% using AlexNet + SVM with 400× magnification factor. In comparison, the ANN based on the fusion features achieved an accuracy ranging from 99.5% with the dataset at 100× magnification factor to 100% at 400× magnification factor.

6. Conclusions

In this study, many different methods and methodologies were implemented to diagnose histopathological images for the early detection of BC for a dataset with magnifications 40×, 100×, 200×, and 400×. This work aimed to develop highly efficient systems for detecting BC early. Images were enhanced with interfering filters to improve HI. The data augmentation method addressed the lack of datasets. This study consists of two approaches, each of which has two systems for diagnosing the dataset with magnifications 40×, 100×, 200×, and 400×. The first approach was a hybrid technology of CNN and SVM. Deep learning models (AlexNet and GoogLeNet) were first applied to extract the features and then classified by machine learning (SVM). These AlexNet + SVM and GoogLeNet + SVM techniques were used in the dataset with four magnifications. These hybrid AlexNet + SVM and GoogLeNet + SVM techniques have resulted in histopathological images diagnosis of BC.
The second approach used an ANN based on the fusion features of CNN models and FCH, LBP, and GLCM (handcrafted features). First, in this method, the deep features were extracted from both AlexNet and GoogLeNet. Then, the PCA was used to reduce the high dimensions and select the most critical features. Second, the features were extracted by FCH, LBP, and GLCM and combined into a features vector. Third, the features were combined with each other to obtain fusion features. The fusion features became represented as follows: (1) AlexNet with FCH, LBP, and GLCM and (2) GoogLeNet with FCH, LBP, and GLCM, which were fed into the ANN network for classification. The fusion features were extracted from the 40×, 100×, 200×, and 400× datasets. This method achieved promising results with high accuracy in diagnosing histopathological images for early detection of BC. Based on the fusion features of the AlexNet and handcrafted features, the ANN obtained an accuracy of 100%, precision of 100%, sensitivity of 100%, specificity of 100%, and AUC of 100% with the dataset at 400× magnification.
The limitations faced are that the size of the dataset is insufficient to train the system so well that the system can classify the test data. The data augmentation technique overcame this limitation during the training phase.
In future studies, these proposed systems will be generalized to classify another dataset. Moreover, it will also generalize the proposed systems for the multiclass classification of benign and malignant breast cancer types.

Author Contributions

Conceptualization, M.A.-J., E.M.S., M.A., and I.A.A.; methodology, M.A.-J., E.M.S., and M.A.; software, E.M.S., M.A.-J., and M.A.; validation, I.A.A., M.A., E.M.S., and M.A.-J.; formal analysis, M.A.-J., I.A.A., M.A., and E.M.S.; investigation, M.A.-J., E.M.S., and M.A.; resources, M.A., E.M.S., and M.A.-J.; data curation, M.A.-J., I.A.A., and M.A.; writing—original draft preparation, E.M.S.; writing—review and editing, M.A.-J. and M.A.; visualization, M.A., I.A.A., and M.A.-J.; supervision, M.A.-J., M.A., and E.M.S.; project administration, M.A.-J. and M.A.; funding acquisition, M.A.-J. and M.A. All authors have read and agreed to the published version of the manuscript.

Funding

This research was funded by the Deputy for Research and Innovation—Ministry of Education, Kingdom of Saudi Arabia through project code: NU/IFC/2/SERC/-/53.

Data Availability Statement

The data supporting the results of the methods proposed in this study were collected from the BreakHis dataset available at this link: https://www.kaggle.com/ambarish/breakhis (accessed on 20 November 2022).

Acknowledgments

The authors would like to acknowledge the support of the Deputy for Research and Innovation—Ministry of Education, Kingdom of Saudi Arabia for this research through a grant (NU/IFC/02/002) under the Institutional Funding Committee at Najran University, Kingdom of Saudi Arabia.

Conflicts of Interest

The authors declare no conflict of interest.

References

  1. Sibbering, M.; Courtney, C.A. Management of breast cancer: Basic principles. Surgery 2016. 34, 25. [CrossRef]
  2. Wang, L. Early Diagnosis of Breast Cancer. Sensors 2017, 17, 1572. [Google Scholar] [CrossRef] [PubMed] [Green Version]
  3. Moo, T.A.; Sanford, R.; Dang, C.; Morrow, M. Overview of breast cancer therapy. PET Clin. 2018, 13, 339–354. [Google Scholar] [CrossRef] [PubMed]
  4. Gonzalez-Hernandez, J.L.; Recinella, A.N.; Kandlikar, S.G.; Dabydeen, D.; Medeiros, L.; Phatak, P. Technology, application and potential of dynamic breast thermography for the detection of breast cancer. Int. J. Heat Mass Transf. 2019, 131, 558–573. [Google Scholar] [CrossRef]
  5. Waks, A.G.; Winer, E.P. Breast cancer treatment: A review. JAMA 2019, 321, 288–300. [Google Scholar] [CrossRef]
  6. Breast Cancer. Available online: https://www.who.int/news-room/fact-sheets/detail/breast-cancer (accessed on 2 March 2022).
  7. Sibbering, M.; Courtney, C.A. Management of breast cancer: Basic principles. Surgery 2019, 37, 157–163. [Google Scholar] [CrossRef]
  8. Łukasiewicz, S.; Czeczelewski, M.; Forma, A.; Baj, J.; Sitarz, R.; Stanisławek, A. Breast Cancer—Epidemiology, Risk Factors, Classification, Prognostic Markers, and Current Treatment Strategies—An Updated Review. Cancers 2021, 13, 4287. [Google Scholar] [CrossRef]
  9. Rustam, Z.; Hapsari, V.A.W.; Solihin, M.R. Optimal cervical cancer classification using Gauss-Newton representation based algorithm. In Proceedings of the 4th International Symposium on Current Progress in Mathematics and Sciences (ISCPMS2018), Depok, Indonesia, 30–31 October 2018. [Google Scholar] [CrossRef]
  10. Ibraheem, A.M.; Rahouma, K.H.; Hamed, H.F. 3PCNNB-net: Three parallel CNN branches for breast cancer classification through histopathological images. J. Med. Biol. Eng. 2021, 41, 494–503. [Google Scholar] [CrossRef]
  11. Das, K.; Conjeti, S.; Roy, A.G.; Chatterjee, J.; Sheet, D. Multiple instance learning of deep convolutional neural networks for breast histopathology whole slide classification. In Proceedings of the 2018 IEEE 15th International Symposium on Biomedical Imaging, Washington, DC, USA, 4–7 April 2018; IEEE: New York, NY, USA, 2018; pp. 578–581. [Google Scholar]
  12. Zewdie, E.T.; Tessema, A.W.; Simegn, G.L. Classification of breast cancer types, sub-types and grade from histopathological images using deep learning technique. Health Technol. 2021, 11, 1277–1290. [Google Scholar] [CrossRef]
  13. Ting, F.F.; Tan, Y.J.; Sim, K.S. Convolutional neural network improvement for breast cancer classification. Expert Syst. Appl. 2019, 120, 103–115. [Google Scholar] [CrossRef]
  14. Spanhol, F.A.; Oliveira, L.S.; Petitjean, C.; Heutte, L. A dataset for breast cancer histopathological image classification. IEEE Trans Biomed. Eng. 2015, 63, 1455–1462. Available online: https://ieeexplore.ieee.org/abstract/document/7312934/ (accessed on 20 November 2022). [CrossRef]
  15. Wang, P.; Wang, J.; Li, Y.; Li, P.; Li, L.; Jiang, M. Automatic classification of breast cancer histopathological images based on deep feature fusion and enhanced routing. Biomed. Signal Process. Control 2021, 65, 102341. [Google Scholar] [CrossRef]
  16. Gaber, H.; Mohamed, H.; Ibrahim, M. Breast cancer classification from histopathological images with separable convolutional neural network and parametric rectified linear unit. In Proceedings of the International Conference on Advanced Intelligent Systems and Informatics, Cairo, Egypt, 19–21 October 2020; Springer: Berlin/Heidelberg, Germany, 2021; pp. 370–382. [Google Scholar] [CrossRef]
  17. Zhu, C.; Song, F.; Wang, Y.; Dong, H.; Guo, Y.; Liu, J. Breast cancer histopathology image classification through assembling multiple compact CNNs. BMC Med. Inform. Decis. Mak. 2019, 19, 1–17. [Google Scholar] [CrossRef] [Green Version]
  18. Saxena, S.; Shukla, S.; Gyanchandani, M. Breast cancer histopathology image classification using kernelized weighted extreme learning machine. Int. J. Imaging Syst. Technol. 2021, 31, 168–179. [Google Scholar] [CrossRef]
  19. Toğaçar, M.; Özkurt, K.B.; Ergen, B.; Cömert, Z. BreastNet: A novel convolutional neural network model through histopathological images for the diagnosis of breast cancer. Phys. A Stat Mech. Appl. 2020, 545, 123592. Available online: https://www.sciencedirect.com/science/article/pii/S0378437119319995 (accessed on 20 November 2022). [CrossRef]
  20. Saini, M.; Susan, S. Deep transfer with minority data augmentation for imbalanced breast cancer dataset. Appl. Soft Comput. 2020, 97, 106759. [Google Scholar] [CrossRef]
  21. Sudharshan, P.J.; Petitjean, C.; Spanhol, F.; Oliveira, L.E.; Heutte, L.; Honeine, P. Multiple instance learning for histopathological breast cancer image classification. Expert Syst. Appl. 2019, 117, 103–111. Available online: https://www.sciencedirect.com/science/article/pii/S0957417418306262 (accessed on 20 November 2022). [CrossRef]
  22. Saxena, S.; Shukla, S.; Gyanchandani, M. Pre-trained convolutional neural networks as feature extractors for diagnosis of breast cancer using histopathology. Int. J. Imaging Syst. Technol. 2020, 30, 577–591. [Google Scholar] [CrossRef]
  23. Gour, M.; Jain, S.; Sunil Kumar, T. Residual learning based CNN for breast cancer histopathological image classification. Int. J. Imaging Syst. Technol. 2020, 30, 621–635. [Google Scholar] [CrossRef]
  24. Afify, H.M.; Mohammed, K.K.; Hassanien, A.E. Multi-images recognition of breast cancer histopathological via probabilistic neural network approach. J. Syst. Manag. Sci. 2020, 1, 53–68. [Google Scholar] [CrossRef]
  25. Xiang, Z.; Ting, Z.; Weiyan, F.; Cong, L. Breast cancer diagnosis from histopathological image based on deep learning. In Proceedings of the 2019 Chinese Control and Decision Conference, Nanchang, China, 2–5 June 2019; IEEE: New York, NY, USA, 2019; pp. 4616–4619. [Google Scholar] [CrossRef]
  26. Jiang, Y.; Chen, L.; Zhang, H.; Xiao, X. Breast cancer histopathological image classification using convolutional neural networks with small SE-ResNet module. PLoS ONE 2019, 14, e0214587. [Google Scholar] [CrossRef] [PubMed] [Green Version]
  27. Budak, Ü.; Cömert, Z.; Rashid, Z.N.; Şengür, A.; Çıbuk, M. Computer-aided diagnosis system combining FCN and Bi-LSTM model for efficient breast cancer detection from histopathological images. Appl. Soft Comput. 2019, 85, 105765. Available online: https://www.sciencedirect.com/science/article/pii/S1568494619305460 (accessed on 20 November 2022). [CrossRef]
  28. Yari, Y.; Nguyen, T.V.; Nguyen, H.T. Deep learning applied for histological diagnosis of breast cancer. IEEE Access 2020, 8, 162432–162448. [Google Scholar] [CrossRef]
  29. BreakHis|Kaggle. Available online: https://www.kaggle.com/datasets/ambarish/breakhis (accessed on 13 February 2023).
  30. Abunadi, I.; Senan, E.M. Deep Learning and Machine Learning Techniques of Diagnosis Dermoscopy Images for Early Detection of Skin Diseases. Electronics 2021, 10, 3158. [Google Scholar] [CrossRef]
  31. Mohammed, B.A.; Senan, E.M.; Rassem, T.H.; Makbol, N.M.; Alanazi, A.A.; Al-Mekhlafi, Z.G.; Almurayziq, T.S.; Ghaleb, F.A. Multi-Method Analysis of Medical Records and MRI Images for Early Diagnosis of Dementia and Alzheimer’s Disease Based on Deep Learning and Hybrid Methods. Electronics 2021, 10, 2860. [Google Scholar] [CrossRef]
  32. Adeniyi, A.A.; Adeshina, S.A. Automatic Classification of Breast Cancer Histopathological Images Based on a Discriminatively Fine-Tuned Deep Learning Model. In Proceedings of the 2021 1st International Conference on Multidisciplinary Engineering and Applied Science (ICMEAS), Abuja, Nigeria, 15–16 July 2021; IEEE: New York, NY, USA, 2021; pp. 1–5. [Google Scholar] [CrossRef]
  33. Zahoor, S.; Shoaib, U.; Lali, I.U. Breast Cancer Mammograms Classification Using Deep Neural Network and Entropy-Controlled Whale Optimization Algorithm. Diagnostics 2022, 12, 557. [Google Scholar] [CrossRef]
  34. Kassani, S.H.; Kassani, P.H.; Wesolowski, M.J.; Schneider, K.A.; Deters, R. Breast cancer diagnosis with transfer learning and global pooling. In Proceedings of the 2019 International Conference on Information and Communication Technology Convergence (ICTC), Jeju, Republic of Korea, 16–18 October 2019; IEEE: New York, NY, USA, 2019; pp. 519–524. [Google Scholar] [CrossRef] [Green Version]
  35. Senan, E.M.; Jadhav, M.E.; Rassem, T.H.; Aljaloud, A.S.; Mohammed, B.A.; Al-Mekhlafi, Z.G. Early diagnosis of brain tumour mri images using hybrid techniques between deep and machine learning. Comput. Math. Methods Med. 2022, 2022, 8330833. Available online: https://www.hindawi.com/journals/cmmm/2022/8330833/ (accessed on 20 November 2022). [CrossRef]
  36. Abunadi, I.; Senan, E.M. Multi-Method Diagnosis of Blood Microscopic Sample for Early Detection of Acute Lymphoblastic Leukemia Based on Deep Learning and Hybrid Techniques. Sensors 2022, 22, 1629. [Google Scholar] [CrossRef]
  37. Senan, E.M.; Abunadi, I.; Jadhav, M.E.; Fati, S.M. Score and Correlation Coefficient-Based Feature Selection for Predicting Heart Failure Diagnosis by Using Machine Learning Algorithms. Comput. Math. Methods Med. 2021, 2021, 8500314. [Google Scholar] [CrossRef]
  38. Kaur, P.; Singh, G.; Kaur, P. Intellectual detection and validation of automated mammogram breast cancer images by multi-class SVM using deep learning classification. Inform. Med. Unlocked 2019, 16, 100151. [Google Scholar] [CrossRef]
  39. Mushtaq, Z.; Yaqub, A.; Hassan, A.; Su, S.F. Performance analysis of supervised classifiers using PCA based techniques on breast cancer. In Proceedings of the 2019 International Conference on Engineering and Emerging Technologies (ICEET), Lahore, Pakistan, 21–22 February 2019; IEEE: New York, NY, USA, 2019; pp. 1–6. [Google Scholar] [CrossRef]
  40. Senan, E.M.; Jadhav, M.E.; Kadam, A. Classification of PH2 images for early detection of skin diseases. In Proceedings of the 2021 6th International Conference for Convergence in Technology, Maharashtra, India, 2–4 April 2021; IEEE: New York, NY, USA, 2021; pp. 1–7. [Google Scholar] [CrossRef]
  41. Senan, E.M.; Jadhav, M.E. Techniques for the Detection of Skin Lesions in PH 2 Dermoscopy Images Using Local Binary Pattern (LBP). In International Conference on Recent Trends in Image Processing and Pattern Recognition; Springer: Singapore, 2020; pp. 14–25. [Google Scholar] [CrossRef]
  42. Senan, E.M.; Jadhav, M.E. Diagnosis of dermoscopy images for the detection of skin lesions using SVM and KNN. In Proceedings of the Third International Conference on Sustainable Computing; Springer: Singapore, 2022; pp. 125–134. [Google Scholar] [CrossRef]
  43. Mohammed, B.A.; Senan, E.M.; Alshammari, T.S.; Alreshidi, A.; Alayba, A.M.; Alazmi, M.; Alsagri, A.N. Hybrid Techniques of Analyzing MRI Images for Early Diagnosis of Brain Tumours Based on Hybrid Features. Processes 2023, 11, 212. [Google Scholar] [CrossRef]
  44. Ahmed, I.A.; Senan, E.M.; Rassem, T.H.; Ali, M.A.H.; Shatnawi, H.S.A.; Alwazer, S.M.; Alshahrani, M. Eye Tracking-Based Diagnosis and Early Detection of Autism Spectrum Disorder Using Machine Learning and Deep Learning Techniques. Electronics 2022, 11, 530. [Google Scholar] [CrossRef]
  45. Mohammed, B.A.; Senan, E.M.; Al-Mekhlafi, Z.G.; Alazmi, M.; Alayba, A.M.; Alanazi, A.A.; Alreshidi, A.; Alshahrani, M. Hybrid Techniques for Diagnosis with WSIs for Early Detection of Cervical Cancer Based on Fusion Features. Appl. Sci. 2022, 12, 8836. [Google Scholar] [CrossRef]
  46. Al-Mekhlafi, Z.G.; Senan, E.M.; Mohammed, B.A.; Alazmi, M.; Alayba, A.M.; Alreshidi, A.; Alshahrani, M. Diagnosis of Histopathological Images to Distinguish Types of Malignant Lymphomas Using Hybrid Techniques Based on Fusion Features. Electronics 2022, 11, 2865. [Google Scholar] [CrossRef]
  47. Ahmed, I.A.; Senan, E.M.; Shatnawi, H.S.A.; Alkhraisha, Z.M.; Al-Azzam, M.M.A. Multi-Techniques for Analyzing X-ray Images for Early Detection and Differentiation of Pneumonia and Tuberculosis Based on Hybrid Features. Diagnostics 2023, 13, 814. [Google Scholar] [CrossRef]
  48. Fati, S.M.; Senan, E.M.; Javed, Y. Early Diagnosis of Oral Squamous Cell Carcinoma Based on Histopathological Images Using Deep and Hybrid Learning Approaches. Diagnostics 2022, 12, 1899. [Google Scholar] [CrossRef]
  49. Fati, S.M.; Senan, E.M.; ElHakim, N. Deep and Hybrid Learning Technique for Early Detection of Tuberculosis Based on X-ray Images Using Feature Fusion. Appl. Sci. 2022, 12, 7092. [Google Scholar] [CrossRef]
  50. Umer, M.J.; Sharif, M.; Kadry, S.; Alharbi, A. Multi-Class Classification of Breast Cancer Using 6B-Net with Deep Feature Fusion and Selection Method. J. Pers. Med. 2022, 12, 683. [Google Scholar] [CrossRef]
  51. Ogundokun, R.O.; Misra, S.; Akinrotimi, A.O.; Ogul, H. MobileNet-SVM: A Lightweight Deep Transfer Learning Model to Diagnose BCH Scans for IoMT-Based Imaging Sensors. Sensors 2023, 23, 656. [Google Scholar] [CrossRef]
  52. Clement, D.; Agu, E.; Obayemi, J.; Adeshina, S.; Soboyejo, W. Breast Cancer Tumor Classification Using a Bag of Deep Multi-Resolution Convolutional Features. Informatics 2022, 9, 91. [Google Scholar] [CrossRef]
  53. Obayya, M.; Maashi, M.S.; Nemri, N.; Mohsen, H.; Motwakel, A.; Osman, A.E.; Alneil, A.A.; Alsaid, M.I. Hyperparameter Optimizer with Deep Learning-Based Decision-Support Systems for Histopathological Breast Cancer Diagnosis. Cancers 2023, 15, 885. [Google Scholar] [CrossRef] [PubMed]
  54. Hamza, M.A.; Mengash, H.A.; Nour, M.K.; Alasmari, N.; Aziz, A.S.A.; Mohammed, G.P.; Zamani, A.S.; Abdelmageed, A.A. Improved Bald Eagle Search Optimization with Synergic Deep Learning-Based Classification on Breast Cancer Imaging. Cancers 2022, 14, 6159. [Google Scholar] [CrossRef] [PubMed]
Figure 1. General structure for diagnosing HI of BC for the systems in this study.
Mathematics 11 01429 g001
Figure 2. Histological set of images for the BC dataset 40×, 100×, 200×, and 400× (a) before enhancement; (b) after enhancement.
Mathematics 11 01429 g002
Figure 3. An architecture for HI diagnosis of BC using a hybrid method.
Mathematics 11 01429 g003
Figure 4. An architecture for diagnosing BC by ANN based on fusion features.
Mathematics 11 01429 g004
Figure 5. Evaluation of the BC dataset with MF: 40×, 100×, 200×, and 400×.
Mathematics 11 01429 g005
Figure 6. Evaluation of a BC dataset with a magnification of 40× by the confusion matrix produced by (a) AlexNet + SVM and (b) GoogLeNet + SVM.
Mathematics 11 01429 g006
Figure 7. Evaluation of a BC dataset with a magnification of 100× by the confusion matrix produced by (a) AlexNet + SVM and (b) GoogLeNet + SVM.
Mathematics 11 01429 g007
Figure 8. Evaluation of a BC dataset with a magnification of 200× by the confusion matrix produced by (a) AlexNet + SVM and (b) GoogLeNet + SVM.
Mathematics 11 01429 g008
Figure 9. Evaluation of a BC dataset with a magnification of 400× by the confusion matrix produced by (a) AlexNet + SVM and (b) GoogLeNet + SVM.
Mathematics 11 01429 g009
Figure 10. The execution of the ANN algorithm based on the fusion features.
Mathematics 11 01429 g010
Figure 11. Confusion matrix for ANN for classifying a 40× dataset based on fusion features by (a) AlexNet with FCH, LBP, and GLCM and by (b) GoogLeNet with FCH, LBP, and GLCM.
Mathematics 11 01429 g011
Figure 12. Confusion matrix for ANN for classifying a 100× dataset based on fusion features by (a) AlexNet with FCH, LBP, and GLCM and by (b) GoogLeNet with FCH, LBP, and GLCM.
Mathematics 11 01429 g012
Figure 13. Confusion matrix for ANN for classifying a 200× dataset based on fusion features by (a) AlexNet with FCH, LBP, and GLCM and by (b) GoogLeNet with FCH, LBP, and GLCM.
Mathematics 11 01429 g013
Figure 14. Confusion matrix for ANN for classifying a 400× dataset based on fusion features by (a) AlexNet with FCH, LBP, and GLCM and by (b) GoogLeNet with FCH, LBP, and GLCM.
Mathematics 11 01429 g014
Figure 15. Diagnostic accuracy of HI of a BC dataset with all magnifications.
Mathematics 11 01429 g015
Table 1. Split of the BreakHis dataset by magnification and classes.
Magnification40×100×200×400×Total
Benign6256446235882480
Malignant13701437139012325429
Total19952081201318207909
Table 2. Splitting of the HI of BC during all phases.
MagnificationPhase(80:20)Testing (20%)
ClassesTraining (80%)Validation (20%)
40×Benign400100125
Malignant877219274
100×Benign412103129
Malignant920230287
200×Benign398100125
Malignant890222278
400×Benign37694118
Malignant846212265
Table 3. Data augmentation method to balance the dataset during the training phase.
PhaseTraining Phase
Magnification40×100×200×400×
Classes NameBenignMalignantBenignMalignantBenignMalignantBenignMalignant
Before-augm400877412920398890376846
After-augm24002631247227602388267022562538
Table 4. Results of the hybrid technology for HI diagnosis for early detection of BC.
MagnificationSystemsAccuracy %Precision %Sensitivity %Specificity %AUC %
40×AlexNet + SVM97.297.497.3297.1599.21
GoogLeNet + SVM95.294.594.694.597.89
100×AlexNet + SVM98.898.598.6798.7499.39
GoogLeNet + SVM95.49594.394.2198.54
200×AlexNet + SVM97.597.6196.596.7398.86
GoogLeNet + SVM96.396.59595.3297.92
400×AlexNet + SVM95.99595.595.6198.94
GoogLeNet + SVM96.796.59696.1198.23
Table 5. ANN algorithm evaluation tools based on the fusion features.
DatasetFusion FeaturesValidation
Performance
Error HistogramGradientROC %
40×AlexNet with handcrafted0.0039891 at epoch 41−0.9446 to 0.94460.00059127 at epoch 4799.69
GoogLeNet with handcrafted0.017289 at epoch 36−0.9373 to 0.93730.0025839 at epoch 4299.62
100×AlexNet with handcrafted0.041676 at epoch 27−0.9483 to 0.9483 0.030079 at epoch 3398.84
GoogLeNet with handcrafted0.040614 at epoch 33−0.9493 to 0.94930.0039246 at epoch 3999.28
200×AlexNet with handcrafted0.028025 at epoch 32−0.9181 to 0.9181 0.034159 at epoch 3899.11
GoogLeNet with handcrafted0.017914 at epoch 31−0.9496 to 0.94960.0027874 at epoch 3799.03
400×AlexNet with handcrafted0.003744 at epoch 21−0.42 to 0.420.00054491 at epoch 27100
GoogLeNet with handcrafted0.00703 at epoch 26−0.8325 to 0.83250.00029889 at epoch 3299.75
Table 6. ANN performance using fusion features for HI diagnosis of BC.
Datasets40×100×200×400×
Fusion FeaturesAlexNet with HandcraftedGoogLeNet with HandcraftedAlexNet with HandcraftedGoogLeNet with HandcraftedAlexNet with HandcraftedGoogLeNet with HandcraftedAlexNet with HandcraftedGoogLeNet with Handcrafted
Accuracy %99.299.599.899.599.599.810099.7
Precision %99.599.7210099.6499.5899.8110099.78
Sensitivity %99.4299.2199.8299.1199.75100100100
Specificity %99.2399.4399.6799.2399.34100100100
AUC %99.6999.6298.8499.2899.1199.0310099.75
Table 7. Accuracy for each class achieved by all proposed methods for diagnosing HI of the BC datasets with magnification.
TechniquesDatasetsProposed SystemsBenignMalignantAccuracy %
Hybrid CNN with SVM40×AlexNet +SVM96.897.497.2
GoogLeNet +SVM9296.795.2
100×AlexNet +SVM98.49998.8
GoogLeNet +SVM90.297.695.4
200×AlexNet +SVM93.699.397.5
GoogLeNet +SVM91.296.696.3
400×AlexNet +SVM94.196.795.9
GoogLeNet +SVM94.19896.7
ANN based on fusion features40×AlexNet and traditional97.610099.2
GoogLeNet and traditional98.410099.5
100×AlexNet and traditional99.210099.8
GoogLeNet and traditional98.410099.5
200×AlexNet and traditional98.410099.5
GoogLeNet and traditional10099.699.8
400×AlexNet and traditional100100100
GoogLeNet and traditional10099.699.7
Disclaimer/Publisher’s Note: The statements, opinions and data contained in all publications are solely those of the individual author(s) and contributor(s) and not of MDPI and/or the editor(s). MDPI and/or the editor(s) disclaim responsibility for any injury to people or property resulting from any ideas, methods, instructions or products referred to in the content.

