Abstract
In the context of carbon neutralization, the electric vehicle and energy storage market is growing rapidly. As a result, battery recycling is an important work with the consideration of the advent of battery retirement and resource constraints, environmental factors, resource regional constraints, and price factors. Based on the theoretical research of intelligent algorithm and mathematical models, an integer programming model of urban power battery reverse supply chain scheduling was established with the goal of the highest customer satisfaction and the least total cost of logistics and distribution, to study the influence of the resources and operation status of a built city recycling center and dismantling center on the power battery reverse supply chain. The model includes vehicle load, customer demand point satisfaction range, and service capacity constraints. This study collected regional image data, conducted image analysis, and further designed an improved Non-dominated Sorting Genetic Algorithm-II (NSGA-II) optimization algorithm suitable to solve the global optimization problem by introducing the improvement strategy of convergence rate, particle search, and the traditional elite individual retention. The results verified the practicability of the model, the global optimization ability of the algorithm to solve the problem, and the operation speed through comparing the results obtained from the basic algorithm. A reasonable comprehensive solution for the location and path optimization of the urban recycling center was also obtained. Multi-objective optimization was carried out in vehicle scheduling, facility construction, and customer satisfaction construction. The basic algorithm and integrated optimization software were compared. We found that the model and the scheme provided by the algorithm can significantly reduce the operation cost of the enterprise. This research provided new insights for enterprises to effectively utilize resources and optimize the reverse supply chain scheduling of an urban power battery.
MSC:
68T07
1. Introduction
With the development of the global new energy vehicle industry and the support of carbon neutrality policies, the market for electric vehicles and power batteries is expanding rapidly, and the power of lithium-ion batteries continues to maintain fast growth momentum. Taking China as an example, the new energy vehicle industry emerged in the early 21st century, and new energy vehicles were promoted and exempted from acquisition tax in 2013–2014 [1]. In 2022, annual auto sales of USD 26.8 million, including new energy vehicles, was estimated to be USD 6.7 million [2]. Logistics is a quite important part of the reverse supply chain system. When demand occurs, reverse logistics are required to respond in a timely manner and deliver power battery materials to the target location to meet the needs of local recycling as soon as possible. To ensure the power battery resources can reach the destination safely, stably, and in timely way along with reverse logistics, the recycling center location and vehicle scheduling and distribution should be optimized.
The reverse supply chain of a power battery not only involves multi-party joint game and decision-making problems, but also an operation problem in the specific operation process. In addition to significantly reducing environmental pollution caused by an untimely recycling and imperfect recycling process, it will also become the main business and profit growth point of the enterprise in the future. Based on the development and operation status of a real-world enterprise, this study formulates a multi-objective optimization scheme for the location-routing of power battery recycling, and constructs an image data application model for urban land planning and road utilization. The implementation plan is conducive to the coordinated development of multiple parties, which provides a complete and practical decision-making example for such enterprises.
In the recycling literature, scholars focus on the facility layout and vehicle routing optimization of power batteries, as well as the game decision-making in the reverse supply chain of power batteries [3,4,5,6,7,8,9]. The research subjects are mostly recycling enterprises, remanufacturing enterprises, and governments [10,11,12]. The research direction includes single-objective and multi-objective optimization [13,14,15,16]. Regarding the interconnection within the power battery market, the operation of the reverse supply chain is usually stabilized by government policies, inter-enterprise responses, etc. Nevertheless, because of the short development time of the electric vehicle industry, there are relatively few studies on the multi-objective optimization scheduling problem of the reverse supply chain of power batteries [9]. Most of the research is about the multi-party game of power battery recycling, without considering the efficient operation and optimization extension of the power battery reverse supply chain, such as how to build a feasible and efficient power battery reverse supply chain from the perspective of enterprises [13,17,18,19,20,21]. Few studies focus on the impact of the power battery scheduling for the reverse supply chain, and how enterprises affect reverse operation of the power battery through resource allocation.
In the reverse supply chain of the power battery, the priority objectives of different subjects are not consistent [22]. Enterprises mainly consider profit and cost, whereas governments focus on environmental benefits and consumer concerns about the sales price [23]. These objectives were considered separately in previous studies [24,25]. However, these decisions are interrelated and can affect each other. Thus, multi-objective optimization models and algorithms are adopted in this study to measure the comprehensive solutions generated by the interconnection of various subjects in the reverse supply chain [26].
This paper contributes to the literature in several ways. First, we provided corresponding solutions based on the current operating conditions of the company, vehicle, and personnel holdings, etc. Based on the power battery reverse supply chain network design and route optimization scheme, this study investigated the node location and quantity of the recycling center and the recycling quantity carried by each center, the transportation volume, and the number of vehicles. Second, this article mainly focused on the reverse supply chain location-path multi-objective optimization problem of electric vehicle power battery recycling. Considering the environmental and social factors of the power battery supply chain, our research designed an improved NSGA-II algorithm to analyze the image data such as land use, urban planning, and design based on the constraints of the actual conditions of the enterprise. The results provide a comprehensive solution for the location path optimization of the power battery reverse supply chain. This not only helps policy makers intuitively understand the relationship between the government, enterprises, and the recycling industry after the implementation of the policy, but also provides an important reference for other countries’ power battery recycling work and the formulation of relevant industrial policies.
The content of this paper is summarized as follows: Section 2 focuses on the literature review; Section 3 explains the variable definition and model establishment; Section 4 presents the image mining and empirical analysis results; Section 5 summarizes the results, draws discussion, conclusions, and describes the research limitation.
2. Literature Review
To better understand the literature on the reverse multi-objective scheduling and decision-making problems of power batteries, this paper summarizes the relevant research from three dimensions, including: (1) electric vehicles and power batteries, and their recycling, including game theory, and system engineering methods [27]; (2) reverse logistics scheduling, including scheduling modes (e.g., single objective and multi-objective optimization models) and algorithms [28].
2.1. Research on Electric Vehicles and Power Batteries
Because of the environmentally friendly properties of the electric vehicles (EV) and clean energy, the electric vehicle industry has been well regulated by the state and the government to promote norms. Contrarily, with the arrival of the peak period of the first batch of electric vehicle power batteries, the current power battery recycling market has not been strictly supervised by laws and regulations, resulting in chaos and decommissioning of power batteries to informal channels. Under the extended producer responsibility system, the current government and enterprises need to work together to rationally plan the recycling channels and methods of power batteries.
In the past decade, more and more vehicle routing problem (VRP) models and methods have been introduced in the field of electric vehicles (EVs). The EV routing problem and its variants are investigated. The relevant literature can be roughly divided into several categories based on Model Characteristics and Applicable Environment: electric vehicle traveling salesman problem, green VRP, electric vehicle VRP, hybrid electric vehicle VRP, electric vehicle location-routing problem, hybrid electric vehicle VRP, electric two-echelon VRP, and electric pickup and delivery problem. Wang et al. [29] proposed that the effective route planning of a battery electric commercial vehicle (ECV) fleet must take into account its limited autonomy and the possibility of accessing charging stations during the route, and “Four variants” of the electric vehicle routing problem with time windows are considered. The model and applicable method of path optimization are expounded from different angles. Electric Vehicle Routing Problem (EVRP) is an extension of VRP, which can be seen as an extension of the location routing problem. The difficulty of solving EVRP comes from the short mileage of EVs and the need for charging and discharging on the driving route. EVRP with time window (EVRPTW) is an extension of EVRP. When each customer has a time window, we can obtain a variant problem, namely EVRP with time window (EVRPTW). The goal of this problem is to find a route that can meet the needs of each group of customers while ensuring that the time window constraints are not violated and the battery power is always positive. Haghi, Arslan, and Laporte [3] present a literature review of the latest developments in EVRP, describing the challenges of delivering electric vehicles, as well as the characteristics of electric vehicles and recent energy consumption models with EVRP and several related variants. Yilmaz and Kalayci [30] adopted three battery depreciation methods to study and compare their effects on EVRPTW, including (1) the nonlinear function of DOD, (2) linear function of charge and discharge coil, and (3) linear function of total driving distance. Zan, et al. [31] conducted extensive computational experiments on benchmark instances of electric vehicle path optimization and recycling with shared charging facilities, and further evaluated the competitiveness of heuristic algorithms, and obtained new solutions for power battery recycling path optimization. Cao et al. [32] emphasized that because of the rapid development of new energy vehicles, there is still a need to improve the power battery recycling system and establish an environmental protection system. Shen and Hou [12] first analyzed the cost composition and the cost parameter sensitivity of the echelon energy storage system with the use of the leveling cost model, and then discussed the current situation of echelon utilization of retired batteries and the development trend of key technologies for echelon utilization. Finally, the boundary value of echelon energy storage in large-scale application under the condition of profit and better than new batteries is analyzed.
According to the above research contents, this paper takes into account the infrastructure construction of an enterprise and the actual operation of new energy vehicles in power battery recycling scheduling, and comprehensively considers the carrying capacity of the enterprise and the construction capacity of the new recycling facilities and the personnel deployment capacity, which fully reflects the operation of the power battery recycling scheme under realistic conditions.
2.2. Research on Reverse Logistics Recycling Scheduling
As the opposite direction of forward logistics, with reverse logistics, more and more attention has been paid by enterprises and scholars. In recycling, not only do we need to notice environmental pollution caused by the power battery, but we also need to pay attention to the impact of the recycling scheduling process. The scheduling of recycling logistics system generally covers two levels—one is the location and quantity of facilities (Location Allocation Problem, LAP), and the other is the construction of the corresponding vehicle routing optimization scheme (VRP) for operation [27,29,33]. Alamatsaz, Ahmadi, and Al-E-hashem [27] described the development of LRP in detail and introduced methods to solve the classic LRP and related extension problems. Rabbani, Mokarrari, and Akbarian-saravi [10] considered the model implemented in a case study in the southeast part of Tehran with time windows, and designed a bi-objective mathematical programming model and proposed a non-dominated sorting algorithm to solve sustainable municipal solid waste recycling. W, et al. [34] studied the LRP of urban fixed waste recycling and proposed an improved model and algorithm. Alamatsaz, Ahmadi, and Al-E-hashem [27] expanded a multi-objective mathematical model in the context of industrial hazardous waste management, covering integrated decision-making at three levels: facility location, routing optimization, and inventory management. The analysis of multiple decisions at the same time not only leads to a more efficient structure in the waste management network, but also reduces the potential risks of managing hazardous wastes. Dong and Liu [2] used the mixed integer linear programming method to design a sustainable reverse logistics network for power battery waste under uncertain risk conditions. Yu, Aloina, Susanto, Effendi, and Lin [33] made an efficient and fast improved genetic algorithm for a large-scale reverse logistics scheduling problem, which can be used for a variety of mixed integer linear programming models. Yang, Wang, Pan, Hu, Peng, Zhang, and Zhang [16] considered the recycling situation and recycling scale of reverse logistics, and drew different conclusions for different enterprise operations in the model construction. Oztas and Tus [35] established an LRP model considering time window and criticality, and proposed a multi-objective optimization strategy and improved algorithm.
As the logistics and supply chain environment constantly add new objectives and constraints on the original basis with the change of time and place, the scalability of the LRP model has been widely used in the literature to solve problems related to the multi-objective optimization strategy and algorithm design, such as the location-routing problem with capacity constraints [36,37], location-routing problem with simultaneous pickup and delivery constraints [14,30,35], and the two-stage location-vehicle routing problem [5,13,14,36,37,38,39].
In summary, the existing research established an LRP model with the goal of minimizing the total transportation cost and the total time spent by the system [16], with the consideration of factors and objectives such as delivery time, total system cost, and optimal path selection [20]. The research also introduced constraints such as demand point satisfaction, and adopted various algorithms to solve such problems, but they considered decision-making objectives from only the demand side, whereas the main participants of power battery reverse LRP involves consumers, governments, and enterprises, which means that decision-making objectives from various parties should be studied systematically and simultaneously [11].
To fill the research gap, this paper discussed the influence of government intervention on the reverse LRP of a power battery, taking into account the construction and resource allocation capacity of enterprises, the satisfaction of demand points, and designed a bi-level programming model of a facility location-transportation routing problem (LRP) with the sum of demand point satisfaction and total cost as the lower-level target. Based on the characteristics of independent decision-making and mutual influence between the upper and lower levels of the model, an improved NSGA-II optimization algorithm suitable for solving such multi-objective optimization scheduling problems was designed, and the operability and advancement of the algorithm were verified.
3. Model Establishment and Algorithm Design
3.1. Problem Description
Three research objects (i.e., single disassembly center, multiple recycling centers, and multiple customer demand points) are involved in this study. Owing to the business scope of an enterprise and the distribution of resource dominance power, the model includes service scope constraints, demand point capacity constraints, and economic capacity constraints. In the process of business operation, transportation cost constraints, time cost constraints, and vehicle loading constraints are also considered. In line with satisfaction functions, this study forms a facility positioning-transportation path problem in the power battery reverse supply chain logistics. When there is a need to respond to demand, certain recycling centers around the point of demand should be selected to facilitate more efficient operation of the reverse supply chain. The recyclable power battery is accurately recovered by each customer demand point, and transported back to the designated location through the unified scheduling of vehicles in the recycling center. The material is recycled and the power battery is remanufactured according to the recycling demand and disassembly demand of the location. The established bi-level programming model determines the location of the recycling center and the transportation route to each demand point on the basis of the specific coordinates of the demand point, so as to realize the rapid response and effective recycling of the power battery reverse supply chain system, as shown in Figure 1.
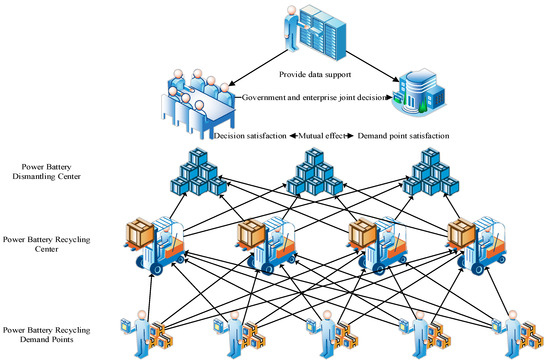
Figure 1.
Problem Description Diagram.
3.2. Model Assumptions
This study makes the following assumptions:
- (1)
- Each vehicle can be used to recycle and distribute the known demand points
- (2)
- The demand for power batteries remains sufficient and the number of vehicles are sufficient
- (3)
- There are feasible paths from the power battery recycling center to the demand point among the demand points
- (4)
- Power batteries at each point of demand can only be delivered by one vehicle
- (5)
- Each demand point has the best material delivery time
- (6)
- Delivery vehicles depart from a recycling center and should return to the center after delivery
- (7)
- Geographical coordinates and number of demand points for each region are known
- (8)
- The material distribution vehicle model and the load is consistent and the average transportation speed is the same;
- (9)
- In emergencies, the uncertain quantity of power battery demand and supply and travel time can be reasonably estimated
- (10)
- Once a material distribution plan is formed, it cannot be changed unless it is subjected to force majeure
- (11)
- Each demand point has a minimum, and there is no demand point discrimination.
3.3. Model Establishment
The model variables are set to:
, represents a collection of power battery recycling centers and a recycling center capacity limit;
, indicates the collection of power battery recycling demand points and the customer demand points ;
represents the set of all nodes;
, represents the set of vehicles that can be scheduled by the recycling center and the number of vehicles available;
indicates the lead time provided by the recycling center for the reverse supply chain operation;
indicates the time that the running vehicle is scheduled when loading and unloading materials;
denotes the time node that the demand point wants to reach within the time allowable range;
denotes the time node that does not want to arrive within the time allowed by the demand point ;
indicates the time when the customer requirement point is met by the running vehicle;
indicates the usual speed of the running vehicle on the road during task scheduling;
denotes the shortest scheduling distance from the node to ;
indicates the use cost of the recycling center before the start of the reverse supply chain operation;
represents the single task scheduling cost of running the vehicle ;
represents the material handling cost faced by the customer demand point in the face of task scheduling;
represents the unit distance transportation cost of the task running vehicle;
represents the penalty cost that is exceeded when a customer demand point is shipped;
represents the demand for customer demand points ;
represents the unit penalty cost for exceeding the expected time;
represents the total time limit of accidental loss caused during preparation and transportation time;
represents the minimum satisfaction requirement of the customer requirement point;
: if the vehicle is put into use, take 1, otherwise take 0;
: if the alternative recycling center is selected, take 1, otherwise take 0;
: when the demand point is assigned to the recycling center in use, it takes 1; otherwise, it takes 0.
: The vehicle from node to takes 1, otherwise 0.
represents the decision variable of the coefficient of the penalty cost changing with time in the time window.
The facility location-transportation route problem in the multi-objective scheduling system of the power battery reverse supply chain can be described by a bi-level multi-objective programming model.
Upper model:
In the above objective function and constraints, owing to the limitations of corporate disposable resources and business operations, the objective function formula (1) represents the minimum total consumption time limit, which is composed of four parts: the preparation time limit of the recycling center, the loading and unloading time limit in the material distribution process, and the total time limit of the accidental loss caused by the vehicle transportation time limit and period; Equation (2) represents the volume restriction of the recycling center; Equation (3) represents each service requirement point is and is only served once; Equation (4) represents the volume constraints of the distribution center vehicle; Formula (5) indicates that each vehicle is allocated to at most one recycling center; Formula (6) indicates that all recycling centers selected for use have disposable cars; Formula (7) indicates that there is no connection between any two recycling centers; constraint (8) indicates that a vehicle departing from a recycling center must finally return to the recycling center. Constraint (9) represents a 0–1 decision variable.
Lower model:
In addition, under the limitation of satisfaction function and cost, the constraints of the upper model are also constrained by the lower model. In the model, the objective Function (10) consists of the following six departments, which are the cost of the recycling center, the cost of vehicles and manpower dispatch, the cost of loading goods, the transportation cost of vehicles, the time window penalty cost and the satisfaction of customer demand points. The type (11) indicates the restriction of logistics vehicles, and the transportation service of vehicles can only appear when the vehicles can be used; Equation (12) indicates the time window constraints for vehicles leaving the recycling center; Equation (13) indicates the time limit for the vehicle in the itinerant handling process; Formula (14) indicates the time range of the vehicle reaching the customer demand point.
3.4. Algorithm Design and Calculation Process
In the multi-objective optimization problem, because of the influence among the objectives, the modicum of the target values is increased or decreased, so the Pareto optimal solution of the multi-objective optimization problem can provide information and result reference for decision makers with different needs. Non-dominated Sorting Genetic Algorithm II (NSGA-II) has a wide application range and strong robustness, which is suitable for solving multi-objective optimization problems, but its global search ability is easily weak to premature convergence. The problem proposed in this paper is the expansion of the basic location-routing problem, which is more complex and more difficult to solve. Combined with the multi-objective optimization model, an improved particle swarm optimization algorithm is built to improve NSGA-II, and the basic NSGA-II operation process includes gene coding, fitness function calculation, selection, and crossover and mutation operations. Through the improved population optimization strategy: 1. convergence speed improvement strategy. Mainly adjust the basic parameters of the algorithm, namely inertia weight and cognitive constants and inertia weight on the search range and the search accuracy will have a certain degree of impact. 2. Population search improvement strategy. The population optimization formula is introduced to search the optimal solution through the crossover of population with individual extremum and population extremum, the mutation of population itself and optimization. 3. Elite retention improvement strategy. The probability accepts the population that does not meet the constraints in the population crossover as a bad solution to help the population jump out of the local optimum [29,30].
The basic implementation steps of the algorithm are as follows:
Step 1: Population initialization module. To initialize the population, by setting the parameters of the improved NSGA-II algorithm, we assume that the number of populations is , the number of vehicles is , the number of demand points is , the number of iterations is , the cognitive constant is and , the population potential solution space is , and population velocity change is ; we initialize the position and speed of the population , the optimal position of the population is , and the optimal position of the population is . We generate the corresponding task number according to the requirement point , where is the vehicle number corresponding to each task, , and is the sorting of tasks by vehicle, . is the generation speed of the vehicle number, , is the speed of task sorting, and ; then, we set the initial solutions of various groups , , , , and skip to Step 2 [33].
Step 2: The fitness value calculation module calculates the fitness value of the individual population according to the coordinate position of the demand point to the recycling center, the distance between the two points, the vehicle speed, the vehicle load, the recycling center resource allocation, and the number and weight of the power battery that can be withstand, etc. Moreover, the algorithm can be used to perform non-dominated sorting, calculate the number of individuals dominated by each population and the set of solutions dominated by the individual, and traverse the entire population to calculate the parameter complexity until the population level is completely divided. Skip to Step 3.
Step 3: By adjusting the fitness assignment value of the objective function and importing the granularity optimization method, the granularity search range is expanded to find out the population and the whole granularity. Assuming that the current fitness is higher than the previous optimal prediction value, the granularity optimal prediction value and the global optimal prediction value are adjusted, that is, turn to Step 2; conversely, if the optimal value is not changed, go to Step 4.
Step 4: The evaluation value is saved and the next generation subgroup is generated. According to the fitness value of the particle, the individual optimal prediction particle and the group optimal prediction particle are updated. The location of the recycling center corresponding to each task and the speed and position of the vehicle receiving each task serial number are updated and the speed and position are corrected. If the particle speed at this time and particle position are better than before, it is updated. Jump to Step 5; otherwise remain unchanged, and go to Step 3.
Step 5: The location set of demand points and the order of particles and vehicles corresponding to the number of vehicles corresponding to the task are obtained. The penalty cost of goods and time transported by each vehicle and the location result of the recycling center are stored. After decoding the position and speed of each particle, the constraint conditions are judged. According to the rated load and capacity limit of each recycling center and each vehicle, whether it is a feasible solution is evaluated. Through the optimal crossover of the group, the population route and position are updated, and the objective function is calculated. Skip to Step 6.
Step 6: To make the distribution of the set of solutions more balanced in the solution space, the crowding degree operation is carried out. Firstly, the individuals of each level are arranged according to the objective function value, and the standard deviation and minimum value are marked. The operation is carried out according to the crowding degree formula to obtain the final objective function value. When the bad solution is less than or equal to the current solution, the current solution is received. When the bad solution is equal to the current solution, all the bad solutions are received at the probability. The receiver rate of the bad solution is: . With , the particle motion energy is weakened, and the probability of being subjected to a bad solution is gradually reduced. Finally, all bad solutions are not received and are expressed as the ratio of the bad solution to the current solution. Then, the comparison between the receiving probability and the random probability is used to determine the choice of the bad solution. When the receiving probability is equal to the random generation probability, accept. Populations read the bad solution and then regenerate new populations. Finally, perform particle decoding and turn to Step 4. Otherwise, refuse, and turn to Step 7.
Step 7: Determine whether the group performance meets the termination requirements, that is, whether the set maximum iteration frequency can be achieved. Output if satisfied, and return to Step 3 if not satisfied, and finally obtain the corresponding recycling center location plan and vehicle path optimization plan and target optimal value.
The algorithm running steps are shown in Figure 2.
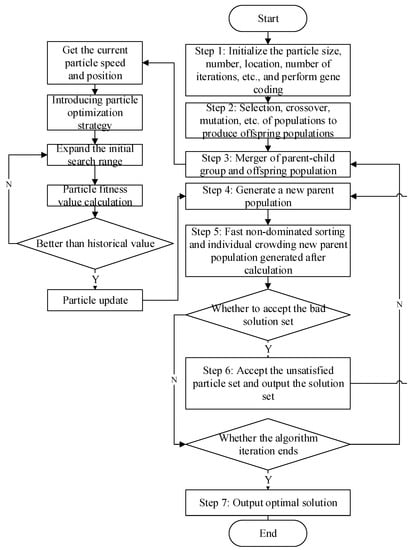
Figure 2.
Improved NSGA-II flowchart.
4. Simulation Analysis
4.1. Empirical Enterprise Development Status and Future Planning
Relatively complete reverse supply chains for power battery recycling were built in several international enterprises, which can be used as a reference for scholars and the industry. T enterprise, founded in 1992 and headquartered in Shanghai, is committed to research and development of green products, product development, production, sales, product recycling, recycling, and other integrated enterprises. The group has more than 30 domestic subsidiaries, with nearly 100,000 employees, including more than 10,000 R&D personnel, more than 30,000 technical workers, and more than 10 production bases globally. In 2009, five renewable resource bases were invested and constructed in Shanghai. Each base is equipped with a sort of storage and related environmental protection treatment facilities, covering the whole industry chain from upstream production to downstream recycling. In 2022, T enterprise established a technological innovation chain integrating power battery R & D, production, sales, and recycling and reuse, and realized the green ecological cycle and sustainable development of power battery industry chain.
As the scrapped new energy vehicle power battery contains a large amount of precious metal resources, every 100 million power batteries consume about 2000 tons of electrode active materials. It can provide rare metals and other important recycled materials. Recycling nickel, cobalt and rare earth and other valuable metals in power batteries is of great value for the effective utilization of metal resources and further reduces the production cost of batteries. T enterprises fulfill their responsibilities in accordance with the relevant regulations of the state on the recycling and utilization of power batteries for new energy vehicles. Through the recycling of rare metals and other materials of power batteries, the cost of material procurement can be effectively reduced. As the cost of remanufacturing power batteries is lower than that of producing new batteries, the manufacturing cost can also be reduced. T enterprises have built a closed ecosystem for power battery recycling. Power battery in accordance with the principle of recycling after echelon use and multi-level, multi-purpose rational use of waste power batteries can reduce overall energy consumption, improve energy efficiency, and thus achieve the economic, environmental, and social benefits of effective integration. The waste power batteries collected by T enterprises from consumers through various recycling channels will stay and store for a short time after entering the recycling center. After collecting a certain amount, they will be transported to the next processing factory. The recycling process of power batteries for new energy vehicles includes deep discharge, crushing, physical sorting, separation of cathode materials from aluminum foil, and subsequent metallurgical recycling process, as shown in Figure 3.

Figure 3.
Battery recycling process.
4.2. Power Battery Reverse Supply Chain Multi-Objective Optimization Scheduling Simulation–A Case Study of Shanghai
Shanghai is the first city in China with more than 100,000 new energy vehicles in 2016 [40,41], and has continued to maintain a leading position since then. In the future, the power battery recycling market will continue to expand. It is estimated that in 2025, China‘s retired power battery will be close to 800,000 tons, and a large-scale power battery will be gradually decommissioned [16]. Firms need to make better use of these resources for the profit growth. T enterprises have gradually constructed power battery reverse supply chains, including the construction of basic recycling centers.
The simulation example is based on the analogy operation of sample data from Shanghai New Energy Vehicle Public Data Acquisition and Monitoring Research Center in 2019, and the vehicle operation data and operation status of the year are shown as Table 1. Sample crawled data is shown in Table 2. Based on the vehicle operation situation, the vehicle driving distance and aggregation situation are estimated, and the customer aggregation point is selected. The recycling and collection work is carried out according to the recycling center built by T company.

Table 1.
Description of crawling data field.
Table 2.
Vehicle operation data crawling display.
4.3. Power Battery Recycling Network Image Processing and Numerical Calculation
The multi-element spatial data of site selection based on GIS needs to be built on the digital terrain model, so that the site selection-path optimization can combine qualitative and quantitative analysis at the same time. Abstract spatial data can be transformed into visual map vector data by ArcGIS, and the image visualization results can be used to assist decision-making. To select areas suitable for the construction of power battery recycling network nodes, the planning map and satellite base map are used to illustrate the general situation of land use in Shanghai, as shown in Figure 4. The information shown in the map includes residential land, demand points, road network, industrial land, waterway land, construction land, and the outline of Shanghai. Industrial land in the map is the area that conforms to the establishment of power battery recycling service center.
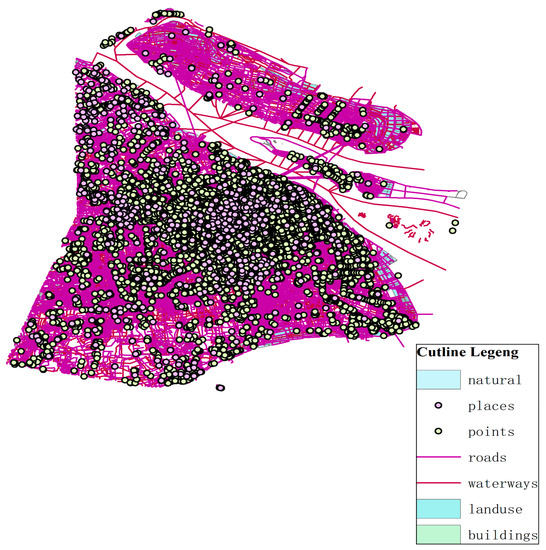
Figure 4.
Region function image recognition.
With the consideration of the traffic convenience factor of network node layout, BBBike https://extract.bbbike.org (accessed on 10 January 2023) is used to obtain the traffic geographic data of Shanghai, and Figure 5 shows the map of Shanghai traffic trunk road.
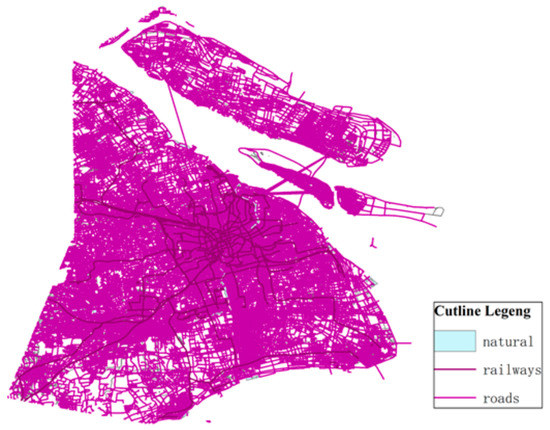
Figure 5.
Road function image recognition.
Buffer analysis is a method to analyze site selection problem based on ArcGIS. The establishment conditions of the buffer are mainly determined by the factors that affect the location of the facility site-path optimization. The buffers of traffic arteries, residential areas, water systems, and industrial land are analyzed as follows.
- (1)
- Road traffic buffer zone
The buffer zone of the traffic artery takes the area within 300 m of the main road and arranges the power battery recovery network node near the main road, as shown in Figure 6.
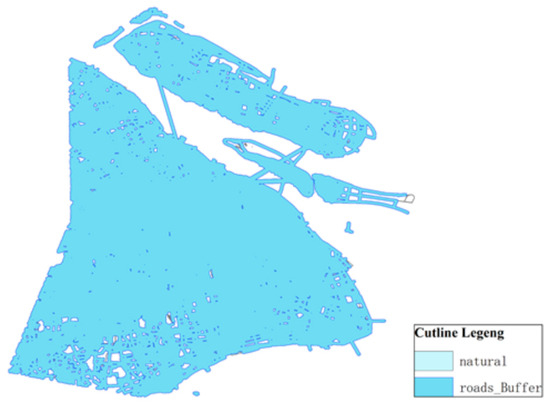
Figure 6.
Traffic artery buffer zone.
- (2)
- Residential buffer analysis
As illustrated in the Figure 7, the power battery service center requires a distance of at least 500 m from the residential area to avoid the huge power battery disassembly noise and other pollutants affecting the normal life of urban residents.
Figure 7.
Residential land buffer zone.
- (3)
- Industrial land buffer analysis
The power battery recycling service point should be close to the demand point distribution center, which causes the limitation of influence distance by ArcGIS and distinction between different color blocks. Thus, industrial land buffer 200 m was set up, as shown in Figure 8.
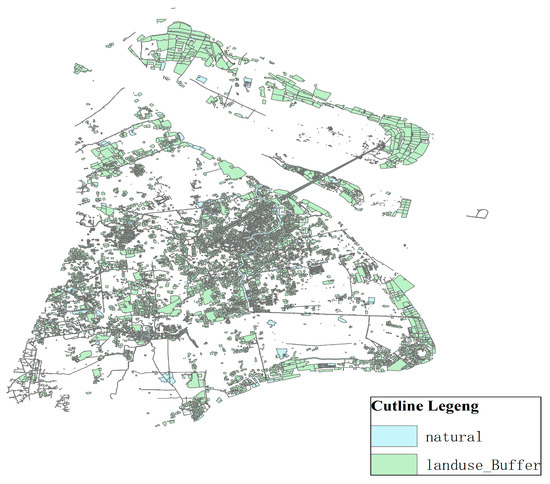
Figure 8.
Industrial land buffer zone.
- (4)
- Construction land buffer analysis
To reduce the impact of noise pollution, the power battery recycling service point should maintain a certain distance from other ordinary buildings, such as commercial buildings, hospitals, and communities through the setting of influence distance in ArcGIS software. Thus, industrial land buffer zone 100 m was set up, as shown in Figure 9.
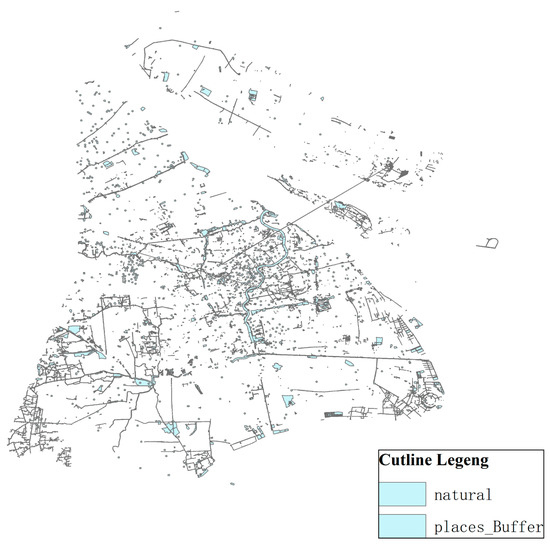
Figure 9.
Construction land buffer zone.
The overlay analysis of ArcGIS covers different thematic maps to produce a new data layer. The new layer not only produces a new spatial relationship, but also links the attribute relationships in the original layer to produce a new attribute relationship. This paper mainly uses three kinds of analysis: layer erasure, intersection operation, symmetrical difference analysis, and layer combination. The buffer zone of the main traffic road and the industrial map are overlapped, and the intersection part is taken as the operation of the new layer and used as the main source of the location; see Figure 10.
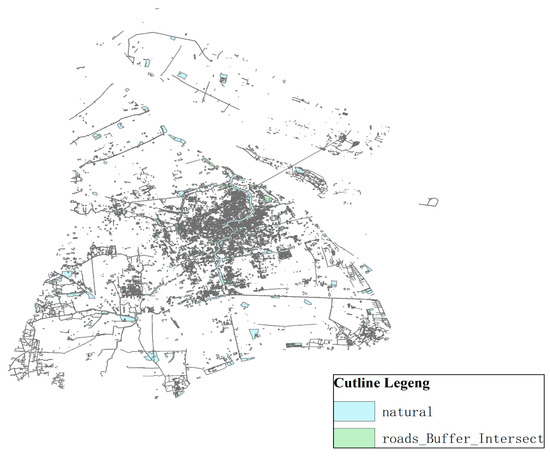
Figure 10.
Image overlay analysis.
According to the operation of ArcGIS vehicles and surrounding facilities, it is proposed to determine 40 customer demand points and one dismantling center, of which the serial number and its two-dimensional coordinate setting and demand are listed in Table 3.
Table 3.
Coordinate Settings.
4.4. Multi-Objective Optimization Scheduling Results Comparison and Analysis
To further verify the practicability of the model and the superiority of the algorithm, this paper uses MATLAB R2016a software to program and run on a Windows computer with AMD Ryzen 7 5800H with Radeon Graphics (3.20 GHz) and running memory of 16 GB. The program simulation parameter settings are shown in Table 4.
Table 4.
Simulation parameters.
To better reflect the objectivity of the simulation experiment, six different sample sizes were selected for the first group of simulation experiments in the Solomon example, where the number of nodes included 50 and 100. The improved NSGA-II algorithm is based on the swarm intelligence optimization algorithm, the particle swarm optimization (PSO) and genetic algorithm (GA). New intelligent optimization algorithm solvers including CPLEX and Gurobi, which have been widely used in recent years, are selected for comparison. The parameters in the setting algorithm and the comparison results are shown in Table 5. The results verified the better performance of the improved INSGA-II algorithm compared with other algorithms.
Table 5.
Optimization results of different algorithms.
From Table 5, it can be seen that the designed INSGA-II algorithm is superior to the other two algorithms and two solvers in time cost and penalty cost in the six examples. From the perspective of total cost, the INSGA-II algorithm has the best results, followed by the Gurobi solver, the GA algorithm, and finally the CPLEX solver. When the problem size is 50 nodes, the four algorithms have a small gap in solving effects. As the problem size increases, the solution becomes more complex. The INSGA-II algorithm obviously shows its lack of solving ability, and the Gurobi solver and the GA algorithm perform better. In terms of time cost and penalty cost, the INSGA-II algorithm achieves the minimum value in five examples. Because of the great randomness of the algorithm, the stability of the INSGA-II algorithm can be explained. With the increase of the scale of the problem, it is obvious that the variance fluctuation of the three algorithms and the two solvers also increases, but the INSGA-II algorithm is less affected.
The initial diagram of customer demand point and recycling center location is shown in Figure 11. Each customer requirement point is evenly distributed around the disassembly center. The demand of each requirement point varies according to market changes and the scope of business operations. The distribution of demand points in Figure 11 is more in line with the law of market development. The recycling center location results are shown in Figure 12.
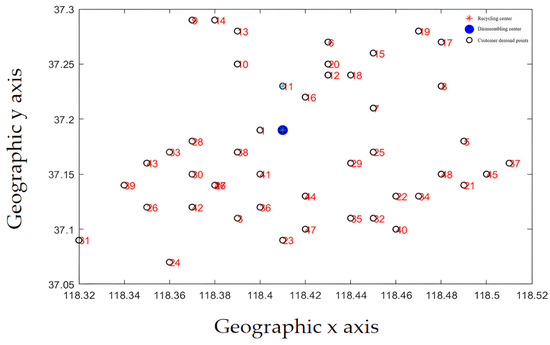
Figure 11.
Initial position.
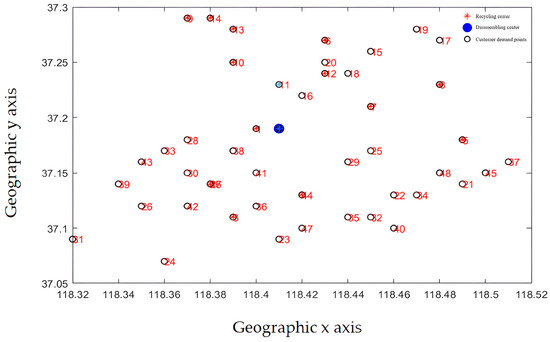
Figure 12.
Location results.
Recycling centers are responsible for the customer demand points and the overall layout, as shown in Figure 13a–d, where Figure 13a–c represent the situation where the customer demand points are from less to more, and the responsible area is determined by the construction and operation of the recycling center in the area, including the affordable transportation freight volume, schedulable vehicles, and callable personnel. From Figure 13d, it can be seen that each recycling center is generally responsible for customer demand points. The areas responsible for power battery recycling in each recycling center are different, and the coverage is not coincident, which is generally conducive to enterprise vehicle scheduling and power battery recycling.
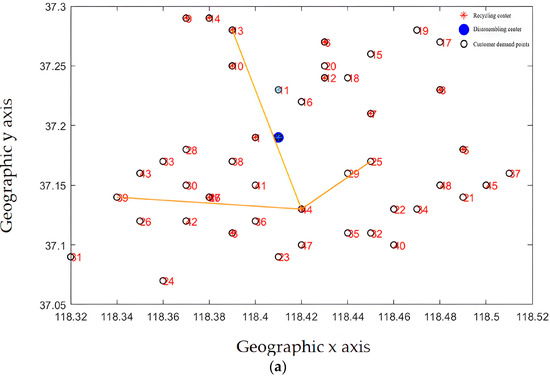
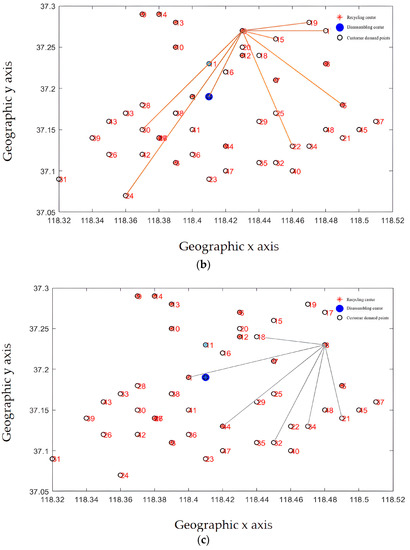
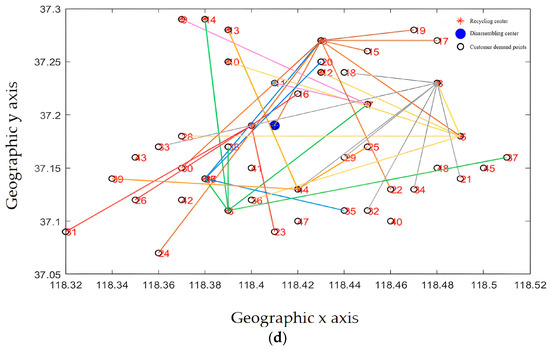
Figure 13.
(a) The recycling center is responsible for the distribution of subordinate customer demand points (fewer demand points). (b) The recycling center is responsible for the distribution of subordinate customer demand points (responsible for demand points generally). (c) The recycling center is responsible for the distribution of subordinate customer demand points (more demand points). (d) The complete recycling center is responsible for the distribution of customer requirements points.
From the results of the site selection, the membership relationship of the recycling center is mainly determined by its service scope and service capacity. By improving the layout recommended by the algorithm, the actual utilization of the recycling center can be optimized to provide better service for customers. From the perspective of system optimization, the location of the recycling center needs to consider market demand factors. Enterprises also need to take into account the construction results of the power battery disassembly center, better serve the enterprise development strategy, and use existing resources to form a more efficient power battery reverse supply chain.
The path optimization results are shown in Figure 14 and Figure 15. The improved optimization algorithm has clearer route optimization, a clearer running route, and shorter running distance, and can take into account all customers, which is obviously better than the classical algorithm.
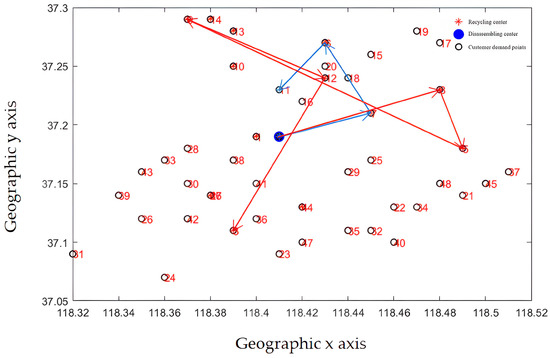
Figure 14.
Delivery route before optimization (classic NSGA-II algorithm).
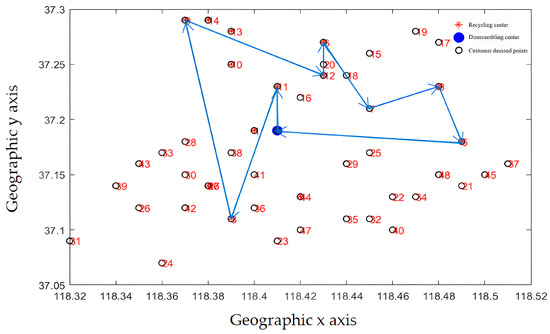
Figure 15.
Delivery route before optimization (improved NSGA-II algorithm).
After running the basic and improved NSGA-II optimization algorithm 10 times, average values of each algorithm and their optimization comparisons are shown in Table 6. The total cost of the improved algorithm is calculated to be $143,911.0049, whereas that of the basic algorithm is $144,623.1240. The customer satisfaction is improved by 0.0817, and the calculation time is reduced by 0.631 s. Therefore, the power battery reverse supply chain scheduling optimization model and the improved algorithm proposed in this paper is effective and feasible.
Table 6.
Optimization comparison.
As illustrated in Figure 16, the simulation results show that the basic NSGA-II optimization algorithm converges too fast, and the average convergence is completed in the 100th generation. At this time, the average fitness is the farthest from the optimal fitness value, the operation effect is poor, and the location-path optimization result is chaotic, which cannot complete the optimization task of enterprise reverse supply chain construction well. The improved NSGA-II optimization algorithm has a moderate convergence speed, runs 500 times, and averages in the 300th generation. The algorithm completes the convergence effect, that is, reaches the optimal fitness value, and the average fitness value does not change significantly. The algorithm gradually tends to be stable from the iterative process, and the value no longer changes when it becomes the optimal value. At this point, it is closest to or reaches the optimal fitness value.
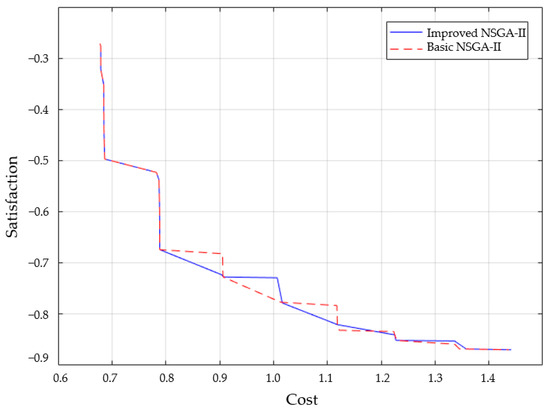
Figure 16.
Algorithm convergence curve comparison.
5. Discussion and Conclusions
5.1. Discussion
A power battery reverse supply chain is a structured, systematic, and scientific project, involving multiple objects and subjects. The power battery reverse supply chain scheduling optimization model and image processing data established in this paper provide guidance and reference for the improvement and construction of the enterprise power battery supply chain [42,43]. This study provides a variety of solutions for the sustainable green development of the industry by combining the regional land use situation and road operation status, through the optimization, coordination and decision-making model analysis of the reverse supply chain scheduling of power batteries [44,45,46,47].
Although our proposed models and methods mainly focus on the response and recovery stages of the power battery reverse supply chain, as well as the modeling and solution method design of enterprise resource management, in order to make the method efficient and effective in practice, some factors can also be considered to promote the effective data discovery of decision makers and the transparency of management processes. For example, Li et al. [48] studied the impact of subsidy policies and dual credit policies on the production decisions of new energy vehicles considering battery recycling in a competitive environment. Li et al. [49] explored the effect of the current deposit return scheme in promoting recycling, and puts forward some suggestions for improvement. The study points out that with the improvement of public awareness of recycling, the amount of subsidy can be appropriately changed. Alamerew and Brissaud [50] applied the system dynamics (SD) approach to model the dynamics of costs, benefits, and strategic and regulatory decisions. In addition, through the case study of electric vehicle battery (EVB), the interaction between the main factors of circular economy research is explored. Finally, the power battery recycling process can also use radio frequency identification equipment technology, GIS technology, and a computer information system to track real-time customer needs and disposable resource information to improve management efficiency.
5.2. Conclusions
On the basis of the literature and industry reports, this paper analyzes the development status and future development trend of power batteries. This study effectively processed structured and unstructured data from different data collection schemes, conducted multi-dimensional decision analysis, and further adopted various methods to visualize the multi-source heterogeneous data, which makes the results more reasonable and highly applicable. This study also provides valuable suggestions on the policymaking for governments. Through formulating reasonable laws and regulations, governments can regulate and ensure the healthy and stable development of power battery recycling markets, as well as the stable development of society and economy.
Under the background of a carbon neutral policy and increasing market demand for power battery recycling, this paper put forward the location-routing optimization scheme based on the constructed power battery reverse supply chain, and constructed a multi-objective function from the perspective of system optimization with the consideration of the operation of the recycling center and the dismantling center, to achieve global optimization and achieve the goal of customer demand point satisfaction and total distribution cost optimization. This study proposed an improved NSGA-II optimization algorithm, and obtained better results for the power battery recycling scheduling. Compared with the output scheme of the basic algorithm, the scheme provided by the improved NSGA-II algorithm greatly reduces the cost of recycling center construction and human resources. The average service level of the recycling center is improved. Based on the simulation results, it is verified that the improved NSGA-II algorithm is competent enough to solve the location-routing optimization problem of a power battery reverse supply chain with complex constraints.
5.3. Limitations
The location-routing optimization model of the power battery reverse supply chain constructed in this paper considers the total cost and customer demand. In the actual application scenario, the main parties involved in the recycling of power batteries include government departments and electric vehicle manufacturers. Many other additional factors have a certain impact on the operation and development of the power battery reverse supply chain. First, this paper considered the operating costs of enterprises, loading efficiency, and customer satisfaction. Future research may consider different objectives, or other heuristic algorithms to find out whether there is a more effective solution. Second, this study mainly studied the reverse recycling scheduling problem of power batteries, mainly involving the resource allocation of vehicles, recycling centers, and disassembly centers. Future research may use the scheduling optimization model under the system regulations such as the extended producer responsibility system, or study the matching of power battery recycling vehicles [33,41], reverse supply chain node importance assessment, etc. to enrich the research on power battery recycling. Third, our research mainly used the improved NSGA-II algorithm to solve the model. Future research may consider the problem of material scheduling and personnel allocation of government and enterprise multi-agent participation in the reverse supply chain of power batteries, and combine precise and heuristic methods to solve single-objective or multi-objective models.
Author Contributions
Conceptualization, K.T. and C.L.; methodology, K.T.; software, K.T.; validation, K.T. and F.X.; formal analysis, K.T. and F.X.; resources, C.L.; data curation, K.T.; writing—original draft preparation, K.T.; writing—review and editing, C.L. and Y.T.; visualization, K.T.; supervision, C.L. and Y.T.; funding acquisition, C.L. All authors have read and agreed to the published version of the manuscript.
Funding
This research was funded by the Higher Education Fund of the Macao SAR Government, grant number HSS-MUST-2021-10.
Data Availability Statement
Publicly available datasets were analyzed in this study. This data can be found here: [https://www.shevdc.org/gsggnr/1604.jhtml (accessed on 6 June 2022)].
Conflicts of Interest
The authors declare no conflict of interest.
References
- Yang, T.; Yuan, Z.W.; Xing, C. Research on China’s fiscal and taxation policy of new energy vehicle industry technological innovation. Ekon. Istraz. 2022, 1–27. [Google Scholar] [CrossRef]
- Dong, F.; Liu, Y.J. Policy evolution and effect evaluation of new-energy vehicle industry in China. Resour. Policy 2020, 67, 13. [Google Scholar] [CrossRef]
- Haghi, M.; Arslan, O.; Laporte, G. A location-or-routing problem with partial and decaying coverage. Comput. Oper. Res. 2023, 149, 12. [Google Scholar] [CrossRef]
- Hassanpour, S.T.; Ke, G.Y.; Tulett, D.M. A time-dependent location-routing problem of hazardous material transportation with edge unavailability and time window. J. Clean. Prod. 2021, 322, 18. [Google Scholar] [CrossRef]
- Heine, O.F.C.; Demleitner, A.; Matuschke, J. Bifactor approximation for location routing with vehicle and facility capacities. Eur. J. Oper. Res. 2023, 304, 429–442. [Google Scholar] [CrossRef]
- Hoogeboom, M.; Dullaert, W.; Lai, D.; Vigo, D. Efficient Neighborhood Evaluations for the Vehicle Routing Problem with Multiple Time Windows. Transp. Sci. 2020, 54, 400–416. [Google Scholar] [CrossRef]
- Li, H.; Li, Z.P.; Cao, L.; Wang, R.D.; Ren, M. Research on Optimization of Electric Vehicle Routing Problem With Time Window. IEEE Access 2020, 8, 146707–146718. [Google Scholar] [CrossRef]
- Li, J.L.; Liu, Z.B.; Wang, X.F. Public charging station localization and route planning of electric vehicles considering the operational strategy: A bi-level optimizing approach. Sust. Cities Soc. 2022, 87, 16. [Google Scholar] [CrossRef]
- Lv, A.; Sun, B.F. Multi-Objective Robust Optimization for the Sustainable Location-Inventory-Routing Problem of Auto Parts Supply Logistics. Mathematics 2022, 10, 2942. [Google Scholar] [CrossRef]
- Rabbani, M.; Mokarrari, K.R.; Akbarian-saravi, N. A multi-objective location inventory routing problem with pricing decisions in a sustainable waste management system. Sust. Cities Soc. 2021, 75, 14. [Google Scholar] [CrossRef]
- Raeisi, D.; Ghoushchi, S.J. A robust fuzzy multi-objective location-routing problem for hazardous waste under uncertain conditions. Appl. Intell. 2022, 52, 13435–13455. [Google Scholar] [CrossRef] [PubMed]
- Shen, H.Y.; Hou, F. Trade policy uncertainty and corporate innovation evidence from Chinese listed firms in new energy vehicle industry. Energy Econ. 2021, 97, 12. [Google Scholar] [CrossRef]
- Schultz, M.; Soolaki, M.; Salari, M.; Bakhshian, E. A combined optimization-simulation approach for modified outside-in boarding under COVID-19 regulations including limited baggage compartment capacities. J. Air Transp. Manag. 2023, 106, 15. [Google Scholar] [CrossRef] [PubMed]
- Shi, Y.H.; Lin, Y.; Li, B.; Li, R.Y.M. A bi-objective optimization model for the medical supplies’ simultaneous pickup and delivery with drones. Comput. Ind. Eng. 2022, 171, 14. [Google Scholar] [CrossRef] [PubMed]
- Xu, Q.F.; Wang, L.K.; Jiang, C.X.; Jia, F.; Chen, L.J. Tail dependence network of new energy vehicle industry in mainland China. Ann. Oper. Res. 2022, 315, 565–590. [Google Scholar] [CrossRef]
- Yang, C.X.; Wang, Q.Z.; Pan, M.C.; Hu, J.F.; Peng, W.D.; Zhang, J.Q.; Zhang, L. A linguistic Pythagorean hesitant fuzzy MULTIMOORA method for third-party reverse logistics provider selection of electric vehicle power battery recycling. Expert Syst. Appl. 2022, 198, 19. [Google Scholar] [CrossRef]
- Zhang, H.; Aydin, G.; Parker, R.P. Social Responsibility Auditing in Supply Chain Networks. Manag. Sci. 2022, 68, 1058–1077. [Google Scholar] [CrossRef]
- Feng, Q.; Li, C.Z.; Lu, M.S.; Shanthikumar, J.G. Implementing Environmental and Social Responsibility Programs in Supply Networks Through Multiunit Bilateral Negotiation. Manag. Sci. 2022, 68, 2579–2599. [Google Scholar] [CrossRef]
- Yu, H.; Sun, X.; Solvang, W.D.; Zhao, X. Reverse Logistics Network Design for Effective Management of Medical Waste in Epidemic Outbreaks: Insights from the Coronavirus Disease 2019 (COVID-19) Outbreak in Wuhan (China). Int. J. Environ. Res. Public Health 2020, 17, 1770. [Google Scholar] [CrossRef]
- Zhao, K.; Zuo, Z.Y.; Blackhurst, J.V. Modelling supply chain adaptation for disruptions: An empirically grounded complex adaptive systems approach. J. Oper. Manag. 2019, 65, 190–212. [Google Scholar] [CrossRef]
- Oyola-Cervantes, J.; Amaya-Mier, R. Reverse logistics network design for large off-the-road scrap tires from mining sites with a single shredding resource scheduling application. Waste Manag. 2019, 100, 219–229. [Google Scholar] [CrossRef] [PubMed]
- Motahari, R.; Alavifar, Z.; Andaryan, A.Z.; Chipulu, M.; Saberi, M. A multi-objective linear programming model for scheduling part families and designing a group layout in cellular manufacturing systems. Comput. Oper. Res. 2023, 151, 17. [Google Scholar] [CrossRef]
- Mokni, M.; Yassa, S.; Hajlaoui, J.E.; Omri, M.N.; Chelouah, R. Multi-objective fuzzy approach to scheduling and offloading workflow tasks in Fog-Cloud computing. Simul. Model. Pract. Theory 2023, 123, 24. [Google Scholar] [CrossRef]
- Mahato, D.; Aharwal, V.K.; Sinha, A. Multi-objective optimisation model and hybrid optimization algorithm for Electric Vehicle Charge Scheduling. J. Exp. Theor. Artif. Intell. 2023, 1–23. [Google Scholar] [CrossRef]
- Goli, A.; Ala, A.; Hajiaghaei-Keshteli, M. Efficient multi-objective meta-heuristic algorithms for energy-aware non-permutation flow-shop scheduling problem. Expert Syst. Appl. 2023, 213, 20. [Google Scholar] [CrossRef]
- Belhor, M.; El-Amraoui, A.; Jemai, A.; Delmotte, F. Multi-objective evolutionary approach based on K-means clustering for home health care routing and scheduling problem. Expert Syst. Appl. 2023, 213, 15. [Google Scholar] [CrossRef]
- Alamatsaz, K.; Ahmadi, A.; Al-E-hashem, S. A multiobjective model for the green capacitated location-routing problem considering drivers’ satisfaction and time window with uncertain demand. Environ. Sci. Pollut. Res. 2022, 29, 5052–5071. [Google Scholar] [CrossRef]
- Chen, L.; Xu, P.; Yan, X.D.; Souleyrette, R.R.; Wang, T. Local-Ideal-Points based Autonomous Space Decomposition framework for the Multi-objective Periodic Generalized Directed Rural Postman problem under Length Restrictions with Intermediate Facilities. Comput. Oper. Res. 2023, 150, 28. [Google Scholar] [CrossRef]
- Wang, M.T.; Zhang, C.R.; Bell, M.G.H.; Miao, L.X. A branch-and-price algorithm for location-routing problems with pick-up stations in the last-mile distribution system. Eur. J. Oper. Res. 2022, 303, 1258–1276. [Google Scholar] [CrossRef]
- Yilmaz, Y.; Kalayci, C.B. Variable Neighborhood Search Algorithms to Solve the Electric Vehicle Routing Problem with Simultaneous Pickup and Delivery. Mathematics 2022, 10, 3108. [Google Scholar] [CrossRef]
- Zang, Y.S.; Wang, M.Q.; Qi, M.Y. A column generation tailored to electric vehicle routing problem with nonlinear battery depreciation. Comput. Oper. Res. 2022, 137, 19. [Google Scholar] [CrossRef]
- Cao, D.D.; Xu, X.; Li, W.S.; Hu, J.; Kong, Z.G. Research on random vibration condition of driving motor system for new energy passenger vehicle. Energy Rep. 2022, 8, 988–996. [Google Scholar] [CrossRef]
- Yu, V.F.; Aloina, G.; Susanto, H.; Effendi, M.K.; Lin, S.W. Regional Location Routing Problem for Waste Collection Using Hybrid Genetic Algorithm-Simulated Annealing. Mathematics 2022, 10, 2131. [Google Scholar] [CrossRef]
- Wu, X.H.; Cao, Y.R.; Xiao, Y.; Guo, J. Finding of urban rainstorm and waterlogging disasters based on microblogging data and the location-routing problem model of urban emergency logistics. Ann. Oper. Res. 2020, 290, 865–896. [Google Scholar] [CrossRef]
- Oztas, T.; Tus, A. A hybrid metaheuristic algorithm based on iterated local search for vehicle routing problem with simultaneous pickup and delivery. Expert Syst. Appl. 2022, 202, 17. [Google Scholar] [CrossRef]
- Faugere, L.; Klibi, W.; Iii, C.W.; Montreuil, B. Dynamic pooled capacity deployment for urban parcel logistics. Eur. J. Oper. Res. 2022, 303, 650–667. [Google Scholar] [CrossRef]
- Wang, Y.; Zhang, X.Y.; Ju, N.; Jia, H.N.; Sun, Z.J.; Liang, J.X.; Guo, R.X.; Niu, D.; Sun, H.B. High capacity adsorption of antimony in biomass-based composite and its consequential utilization as battery anode. J. Environ. Sci. 2023, 126, 211–221. [Google Scholar] [CrossRef] [PubMed]
- Basirati, M.; Jokar, M.R.A.; Hassannayebi, E. Bi-objective optimization approaches to many-to-many hub location routing with distance balancing and hard time window. Neural Comput. Appl. 2020, 32, 13267–13288. [Google Scholar] [CrossRef]
- Zhang, Q.J.; Mou, F.S.; Li, S.W.; Li, A.; Wang, X.D.; Sun, Y.W. Quantifying emission fluxes of atmospheric pollutants from mobile differential optical absorption spectroscopic (DOAS) observations. Spectroc. Acta Pt. A-Molec. Biomolec. Spectr. 2023, 286, 7. [Google Scholar] [CrossRef]
- Yu, Y.M.; Xu, H.; Cheng, J.P.; Wan, F.; Ju, L.; Liu, Q.Z.; Liu, J. Which type of electric vehicle is worth promoting mostly in the context of carbon peaking and carbon neutrality? A case study for a metropolis in China. Sci. Total Environ. 2022, 837, 12. [Google Scholar] [CrossRef]
- Kristiansen, A.B.; Zhao, B.Y.; Ma, T.; Wang, R.Z. The viability of solar photovoltaic powered off-grid Zero Energy Buildings based on a container home. J. Clean. Prod. 2021, 286, 15. [Google Scholar] [CrossRef]
- Mohammadkhani, A.; Mousavi, S.M. A new last aggregation fuzzy compromise solution approach for evaluating sustainable third-party reverse logistics providers with an application to food industry. Expert Syst. Appl. 2023, 216, 24. [Google Scholar] [CrossRef]
- Chang, J.P.; Chen, Z.S.; Wang, X.J.; Martinez, L.; Pedrycz, W.; Skibniewski, M.J. Requirement-driven sustainable supplier selection: Creating an integrated perspective with stakeholders? Interests and the wisdom of expert crowds. Comput. Ind. Eng. 2023, 175, 20. [Google Scholar] [CrossRef]
- Yang, Y.; Yang, F.F.; Chen, J.; Zeng, Y.Y.; Liu, L.M. Pythagorean Fuzzy Bonferroni Mean with Weighted Interaction Operator and Its Application in Fusion of Online Multidimensional Ratings. Int. J. Comput. Intell. Syst. 2022, 15, 15. [Google Scholar] [CrossRef]
- Shi, J.W.; Zhou, Y. Group Decision Making for Product Innovation Based on PZB Model in Fuzzy Environment: A Case from New-Energy Storage Innovation Design. Mathematics 2022, 10, 3634. [Google Scholar] [CrossRef]
- Mishra, A.R.; Rani, P.; Saha, A.; Pamucar, D.; Hezam, I.M. A q-rung orthopair fuzzy combined compromise solution approach for selecting sustainable third-party reverse logistics provider. Manag. Decis. 2022, 38. [Google Scholar] [CrossRef]
- Cheng, C.; Wang, X.M.; Ren, X.H. Selection of outsourcing logistics providers in the context of low-carbon strategies. Environ. Sci. Pollut. Res. 2022, 1–17. [Google Scholar] [CrossRef] [PubMed]
- Li, J.Z.; Ku, Y.Y.; Liu, C.L.; Zhou, Y.P. Dual credit policy: Promoting new energy vehicles with battery recycling in a competitive environment? J. Clean. Prod. 2020, 243, 14. [Google Scholar] [CrossRef]
- Li, X.; Mu, D.; Du, J.B.; Cao, J.J.; Zhao, F. Game-based system dynamics simulation of deposit-refund scheme for electric vehicle battery recycling in China. Resour. Conserv. Recycl. 2020, 157, 13. [Google Scholar] [CrossRef]
- Alamerew, Y.A.; Brissaud, D. Modelling reverse supply chain through system dynamics for realizing the transition towards the circular economy: A case study on electric vehicle batteries. J. Clean. Prod. 2020, 254, 12. [Google Scholar] [CrossRef]
Disclaimer/Publisher’s Note: The statements, opinions and data contained in all publications are solely those of the individual author(s) and contributor(s) and not of MDPI and/or the editor(s). MDPI and/or the editor(s) disclaim responsibility for any injury to people or property resulting from any ideas, methods, instructions or products referred to in the content. |
© 2023 by the authors. Licensee MDPI, Basel, Switzerland. This article is an open access article distributed under the terms and conditions of the Creative Commons Attribution (CC BY) license (https://creativecommons.org/licenses/by/4.0/).