Article

Mathematical Modelling of Leptin-Induced Effects on Electrophysiological Properties of Rat Cardiomyocytes and Cardiac Arrhythmias

by
Tatiana Nesterova
1,2,3,*,
Roman Rokeakh
1,2,3,
Olga Solovyova
2,3,* and
Alexander Panfilov
1,3,*
1
Almazov National Medical Research Centre, Saint-Petersburg 197341, Russia
2
Institute of Immunology and Physiology, Ural Branch of Russian Academy of Sciences, Ekaterinburg 620049, Russia
3
Institute of Natural Sciences and Mathematics, Ural Federal University, Ekaterinburg 620075, Russia
*
Authors to whom correspondence should be addressed.
Mathematics 2023, 11(4), 874; https://doi.org/10.3390/math11040874
Submission received: 16 November 2022 / Revised: 30 January 2023 / Accepted: 1 February 2023 / Published: 8 February 2023
(This article belongs to the Special Issue Mathematical Modelling in Biomedicine III)

Abstract

:
Elevated plasma leptin levels, or hyperleptinemia, have been demonstrated to correlate with metabolic syndrome markers, including obesity, and may be an independent risk factor for the development of cardiovascular disease. In this paper, we use cardiac models to study possible effects of hyperleptinemia on the electrophysiological properties of cardiomyocytes and cardiac arrhythmias. We modified the parameters of an improved Gattoni 2016 model of rat ventricular cardiomyocytes to simulate experimental data for the leptin effects on ionic currents. We used four model variants to investigate the effects of leptin-induced parameter modification at the cellular level and in 2D tissue. In all models, leptin was found to increase the duration of the action potential. In some cases, we observed a dramatic change in the shape of the action potential from triangular, characteristic of rat cardiomyocytes, to a spike-and-dome, indicating predisposition to arrhythmias. In all 2D tissue models, leptin increased the period of cardiac arrhythmia caused by a spiral wave and enhanced dynamic instability, manifesting as increased meandering, onset of hypermeandering, and even spiral wave breakup. The leptin-modified cellular models developed can be used in subsequent research in rat heart anatomy models.

1. Introduction

Cardiovascular disease is the leading cause of death in developed countries. According to the European Society of Cardiology Atlas Project 2021 [1], more than 40% of all deaths in Europe are caused by cardiovascular diseases. In most cases, sudden cardiac death is the result of a cardiac arrhythmia, such as ventricular fibrillation [2]. One of the essential risk factors for cardiac disease development is obesity, which has become a huge social problem worldwide. According to the World Health Organization’s report for 2016, 650 million adults aged 18 years and older were obese [3]. The exact factors for how obesity leads to heart disease and cardiac arrhythmias remain largely under-investigated.
From a scientific point of view, cardiac arrhythmias result from abnormal propagation of electrical excitation waves generated in the heart by billions of cardiomyocytes. Thus, to understand the effects of obesity on arrhythmias, one needs to link it with possible electrophysiological effects of obesity on cardiomyocytes. One way of doing this is to consider biologically active molecules produced by adipose tissue and their effects on cardiomyocytes. From this point of view, a promising object is leptin, a peptide hormone with a molecular mass of 16 kDa. Leptin is mainly produced by fat tissue cells (adipocytes) but can also be produced by cardiomyocytes [4,5,6]. Its concentration increases in obesity [7,8]. A recent experimental study of eight-day hyperleptinemia in rats revealed systemic effects of leptin such as dyslipidemia, systemic inflammation, increased blood pressure and heart rate, myocardial hypertrophy, and impaired left ventricular function. Moreover, the study [9] demonstrated an increased frequency of ischemic arrhythmias and increased size of induced myocardial infarction, indicating a pro-arrhythmic effect of high-level leptin on myocardial function. Experiments have also been carried out to study the effects of leptin on the electrical function of isolated cardiomyocytes from rat [10,11], mouse [12] and rabbit [13] hearts, as well as some leptin-induced effects on the properties of transmembrane ionic channels [10,12,13,14]. However, an important question about how leptin-induced remodeling of ion channels affects the properties of cardiac arrhythmias remains poorly understood.
A modern approach to studying the mechanisms of cardiac arrhythmias is detailed integrative mathematical modeling of the myocardium, which has been successfully used in many cases [15,16,17,18,19,20]. The main idea of this method can be described as follows. The excitation of each cardiomyocyte is the result of the dynamics of tens of thousands of different ion channels, and the heart excitation is due to the excitation of billions of cardiomyocytes that are electrically coupled to each other. Thus, the myocardium model must combine a description of the ion channel property dynamics with a description of the cardiomyocyte organization in the heart at the tissue level. Mathematically, such a model consists of a set of nonlinear ordinary differential equations, or so-called ionic cellular models, that describe the cardiomyocyte electrophysiology. Cardiomyocyte connectedness is reflected by adding spatial operators that describe electrical currents between them. The numerical solution to such a model provides spatial patterns of myocardial excitation. Cardiac arrhythmias correspond to abnormal patterns of excitation, such as spiral waves [21].
Effects of leptin on cardiac arrhythmias can be studied in the following way. In fact, there are experimental data on how leptin affects the transmembrane channels. Since transmembrane currents are part of the cellular ion model, we can modify the model based on those experimental measurements, i.e., reproduce the impact of leptin at the cellular level and then study how this modification affects the properties of cardiac arrhythmias (spiral waves).
In this paper, we apply this method and study effects of leptin on the electrophysiological properties of rat cardiac tissue and cardiac arrhythmias. The rat heart was chosen as one of the most widely used hearts in experimental studies of cardiovascular disease. We have developed a modification of the Gattoni 2016 [22] rat cardiomyocyte model that reproduces leptin-induced ion channel remodeling effects in order to obtain cellular models that mimic chronic exposure to leptin. Furthermore, these cell models are integrated into a 2D myocardial model, which we use to study reentrant cardiac arrhythmias organized by spiral waves and investigate how the application of leptin affects the arrhythmia dynamics.

2. Materials and Methods

2.1. Updated Gattoni 2016 Ionic Models of Rat Ventricular Cardiomyocytes

The Gattoni 2016 model [22] of the rat ventricular cardiomyocyte combines the Pandit ionic model of the rat ventricular cardiomyocyte [23] with the updated description of the Na + /K + pump from [24] and the Hinch model of intracellular Ca 2 + handling [25].
In the present study, we used four versions of the Gattoni 2016 cell model with modified parameters. The process and reasons for the modification of the parameters were described in detail in our previous article [20]. In brief, although the original Gattoni 2016 model was validated through experimental recordings of action potential (AP) shapes and calcium transients at stimulation frequencies of 1 and 6 Hz, we found that it becomes unstable at frequencies above 6 Hz. This was an essential limitation for our studies, as arrhythmias in the rat heart can attain frequencies above 10 Hz [26]. In addition, the original Gattoni 2016 model was not verified in terms of the frequency dependence of the action potential duration (APD), or APD restitution curve, which is one of the important measurable characteristics of cardiac tissue. When modifying the Gattoni 2016 cell model, we found that the model’s instabilities were due to rapid leakage of calcium from the dyadic spaces into the cytosol, which were eliminated by a 60% decrease in this Ca 2 + flow rate (parameter g D ). To fit the model to the measured APD restitution curves, we applied the population modeling approach, which enables suitable models to be selected from the space of multiparametric simulation results. To this end, we evaluated the sensitivity of the model to 16 main parameters of ionic transmembrane conductance and intracellular calcium fluxes by varying the parameters in the range of 10–200% with reference to the values of the original model. Based on this evaluation, we selected six parameters (see Table 1).
Next, based on the 6 selected parameters, we performed Latin hypercube sampling [27] from 10,000 different sets of parameters, with each of these 6 parameters varying in the range of 0–200% relative to the reference value per 1000 ms stimulation period in the Gattoni 2016 cellular model. From this population, we selected 39 models that had their main action potential characteristics and intracellular calcium dynamics falling within the physiological ranges, including APD [28,29], AP overshoot [22,30], resting potential [22,30], calcium transient peak [22], diastolic calcium levels in the cytosol [22] and sarcoplasmic reticulum (SR) [22], and APD restitution curves [28]. Finally, from this subpopulation, we drew four representative models: the restitution curve of Model 1 is at the lower subpopulation boundary, Models 2 and 4 are close to the center line, and Model 3 is at the upper subpopulation boundary. The parameter values of these models are presented in Table 1.

2.2. Leptin-Related Remodeling in the Cellular Model

To reproduce the effects of high levels of leptin (hyperleptinemia) on the electrophysiological properties of cardiomyocytes, we used data from reference [12]. At the moment, we are not aware of any work on the effect of continuous exposure to leptin for several weeks on transmembrane currents in rat ventricular cardiomyocytes, and so we used a mouse model of chronic leptin exposure. In [12], a group of sham-operated mice received leptin at a concentration of 0.36 mg/(kg*day) for 3 weeks by implanting a micro-osmotic pump, while the other group received, via a pump, a solution without leptin. It was shown that leptin application decreased transient outward potassium current (I t o ) by an average of 47% for potentials from −10 to 60 mV at a holding potential of −80 mV and increased the expression of Na + -Ca 2 + exchange (NCX) current by 93%. In accordance with these data, we simulated the effects of leptin on cells described by Models 1–4 by multiplying the parameters of maximum conductance of I t o (g t o ) and of NCX (g N C X ) by the coefficients 0.53 and 1.93, respectively. The original models are referred to as control Models 1C–4C, while the same models with modified parameters under leptin application are referred to as Models 1L–4L.

2.3. Simulation Protocol for Single Cell Models

To find the rate dependency of Models 1C–4C and 1L–4L, we performed simulations using the dynamic stimulation protocol [20], involving pacing with gradually decreasing basic cycle length (BCL) from 1000 ms to 200 ms in 50 ms steps and from 200 ms to 80 ms in 10 ms steps. For each BCL, we simulated 40 APs. We decreased BCL to 90 ms because, at BCL 80 ms, excitation was found to be blocked in Models 1L–-3L.
In accordance with the Gattoni 2016 model, we used two fixed g S E R C A values for the BCL of 1000 ms and 170 ms. For frequencies between 1 and 6 Hz and larger than 6 Hz, g S E R C A was assumed to be linearly dependent on frequency.
The following characteristics were calculated: AP duration at 50% (APD50) and 90% (APD90), Ca 2 + transient peak (PCa), and diastolic Ca 2 + level in the SR (DCaSR). Where not specially indicated, APD = APD90.
We used the CVODE solver (absolute tolerance = 1 × 10 6 , relative tolerance = 0.0001) [31] and the software package Myokit [32] to solve cellular model equations.

2.4. Myocardial Tissue Models

Propagation of excitation waves in myocardial tissue is described by the monodomain equation:
V t = · ( D V ) I ion C m ,
where V is the transmembrane potential, ∇ is the gradient operator, D is the diffusion tensor, I ion is the total ionic current, and C m is the membrane capacitance.
We set the initial conditions for transmembrane voltage equal to the resting potential V = V r e s t . The boundary condition was no flux through the boundaries:
n V = 0 ,
where n is the normal to the boundary.
To simulate excitation wave propagation in the 2D generic models of myocardial tissue, we solved Equations (1) and (2) using original software written in C with a Cuda extension. The system of Equations (1) and (2) was integrated in time using the forward-Euler method with a time step of Δ t = 0.005 ms, and in space using the centered finite difference method with a space step of Δ s = 0.1 mm. This space step corresponds to the resolution of the DT MRI image of the rat ventricles.
For 2D simulations, we used a sheet of 50 × 50 mm 2 isotropic tissue with a constant diffusion coefficient D of 0.1544 mm 2 /ms [16]. This coefficient value provides conduction velocities of 0.5 0.57 m/s for Models 1C–4C, which are in the range of experimentally observed conduction velocities [33].
Spiral waves were initiated using the S1S2 protocol. Stimulus S1 was generated at the left border of the 2D model. The S2 stimulus was applied to the upper left quarter of the tissue. The interval between stimuli S1 and S2 was selected so that the spiral wave was triggered and ranged from 58 to 154 ms.
Spiral wave periods and tip trajectories were determined. Spiral wave tips were identified by means of the algorithm proposed by Fenton and Karma [34]. The core size was measured as the length of the largest side of the rectangle that covers the spiral core trajectory.
Available software. We provide the code that calculates and plots APD restitution curves for cell models 1–4. The code can be downloaded from the GitHub repository from the link: https://github.com/tatiannesterova/DRC, accessed on 27 January 2023. The code is written in Python and is intended to run as a script in the Myokit IDE [32]. Myokit can be installed from the developer’s website: http://myokit.org/. The original Gattoni 2016 model was converted into the Myokit format from CellML (https://models.cellml.org/workspace/285, accessed on 27 January 2023) provided by the authors of the model in their article [22].

3. Results

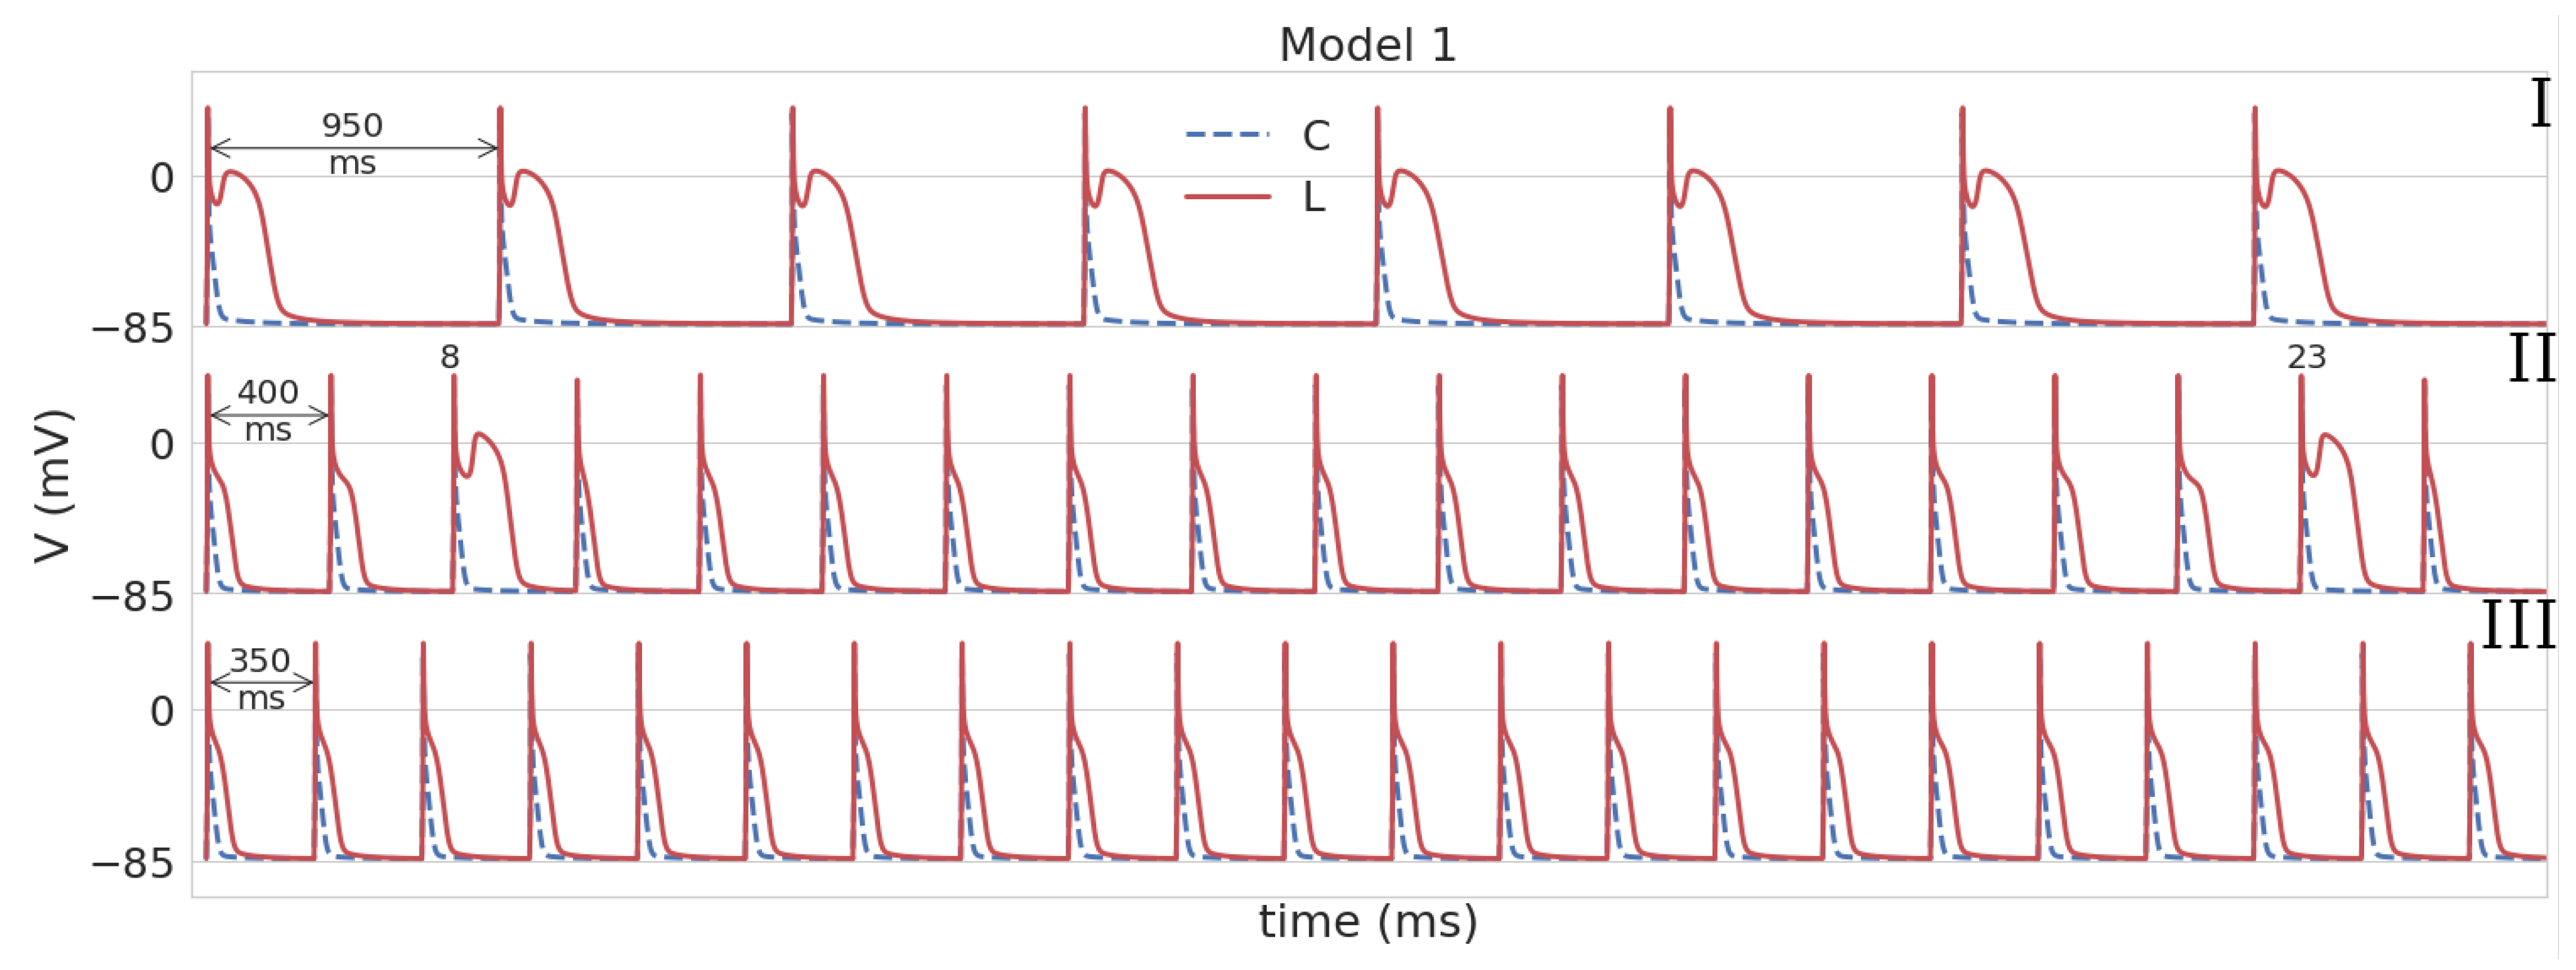
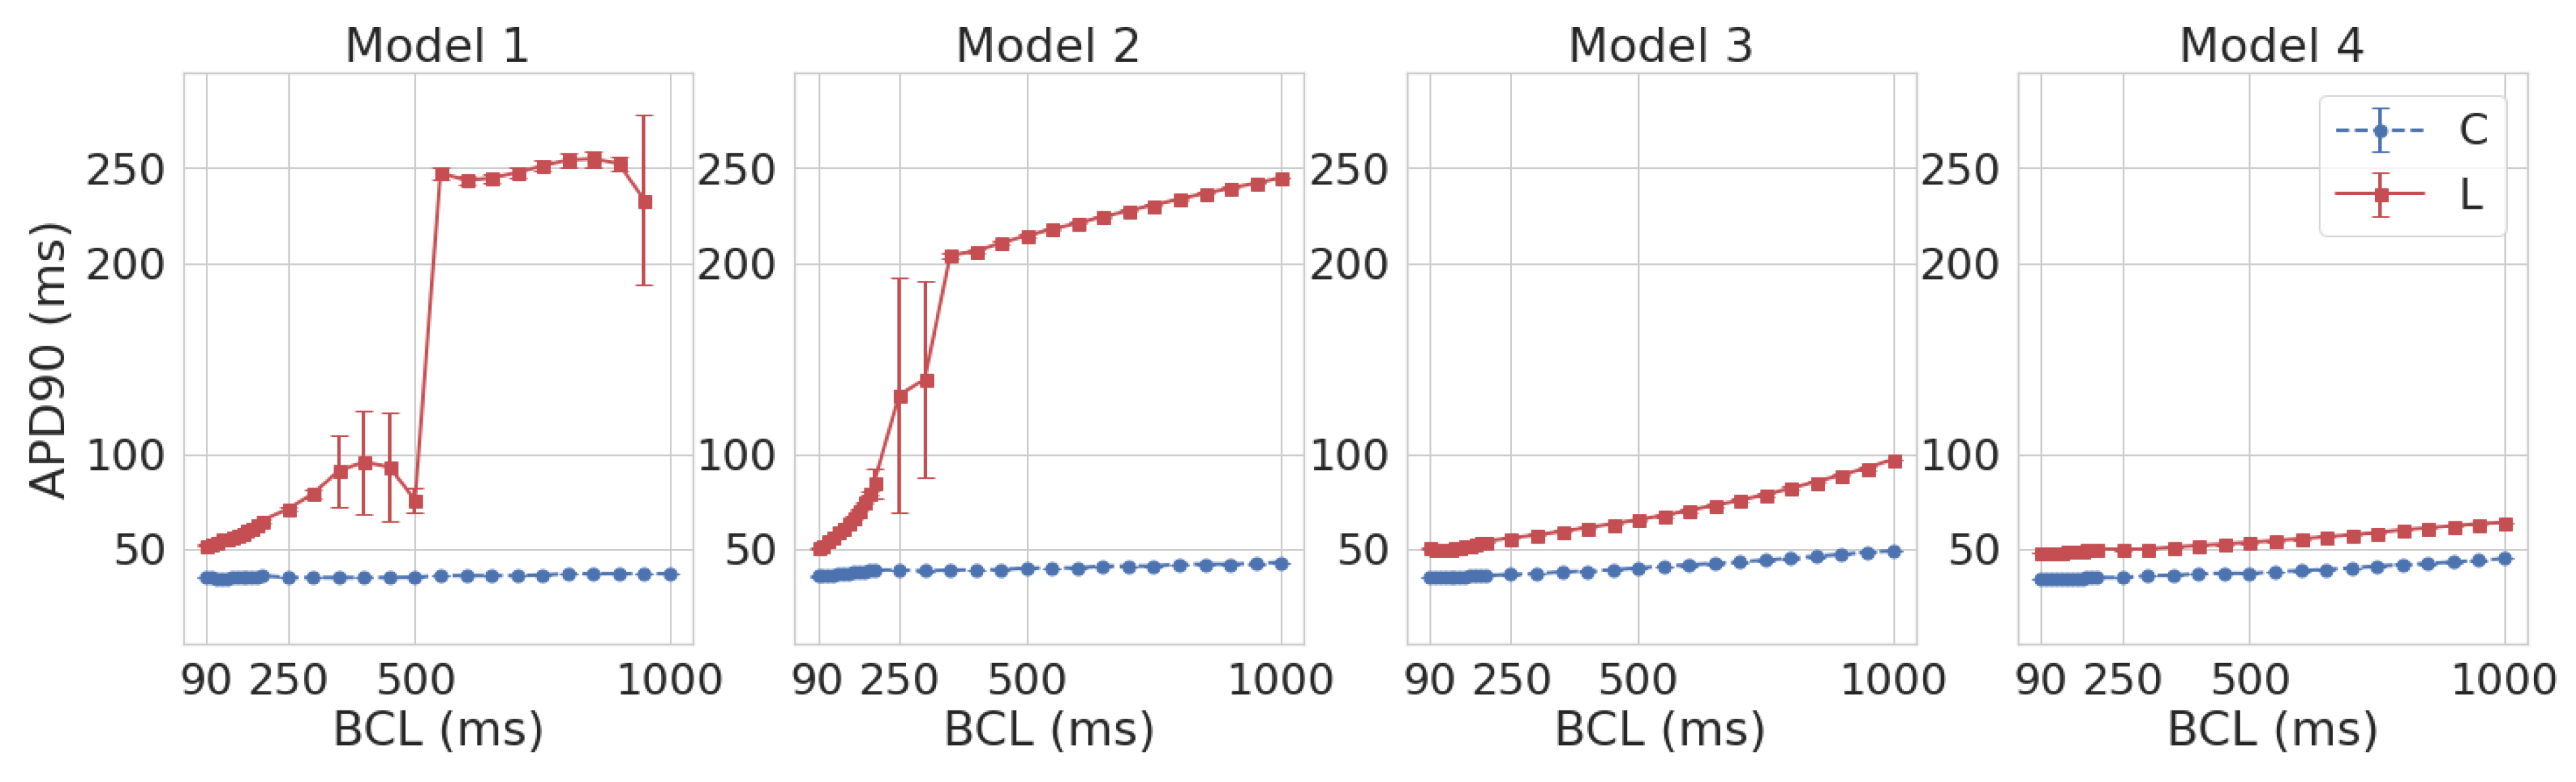
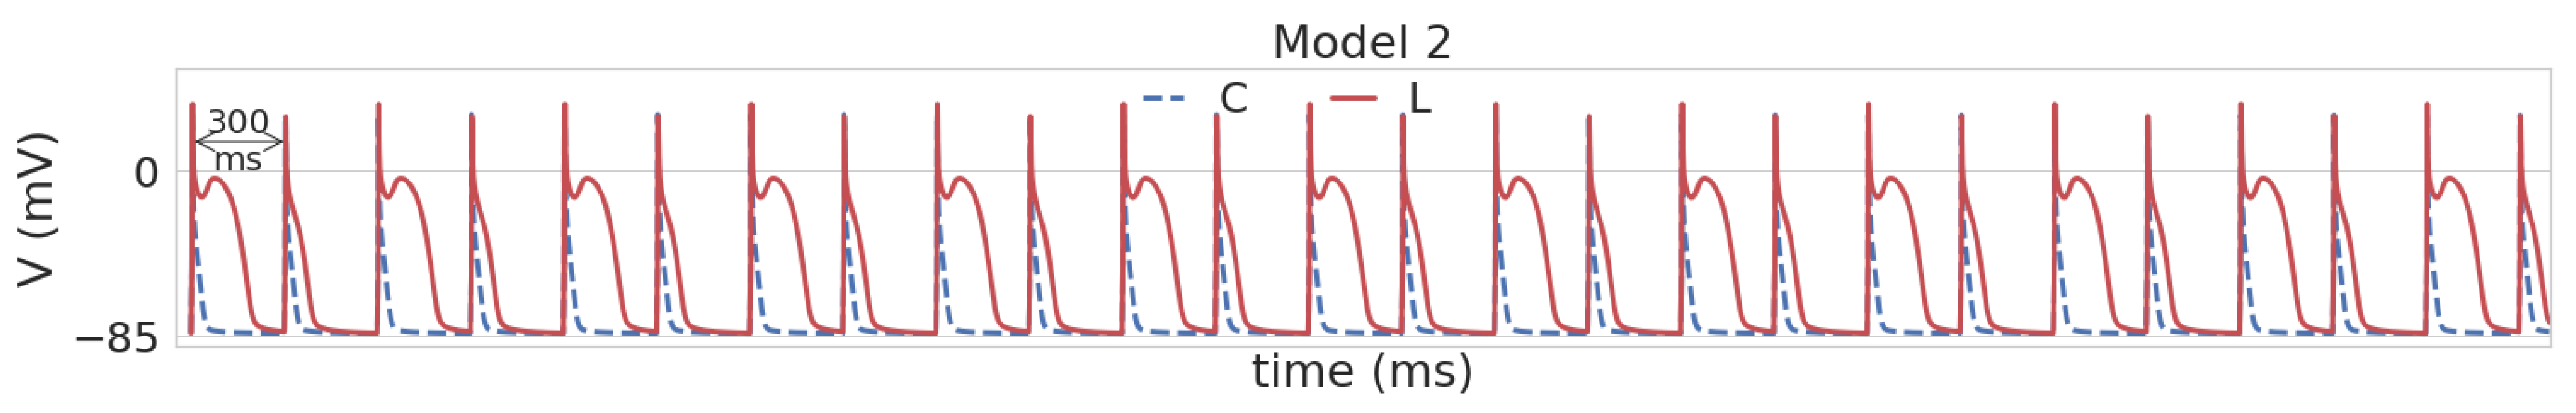
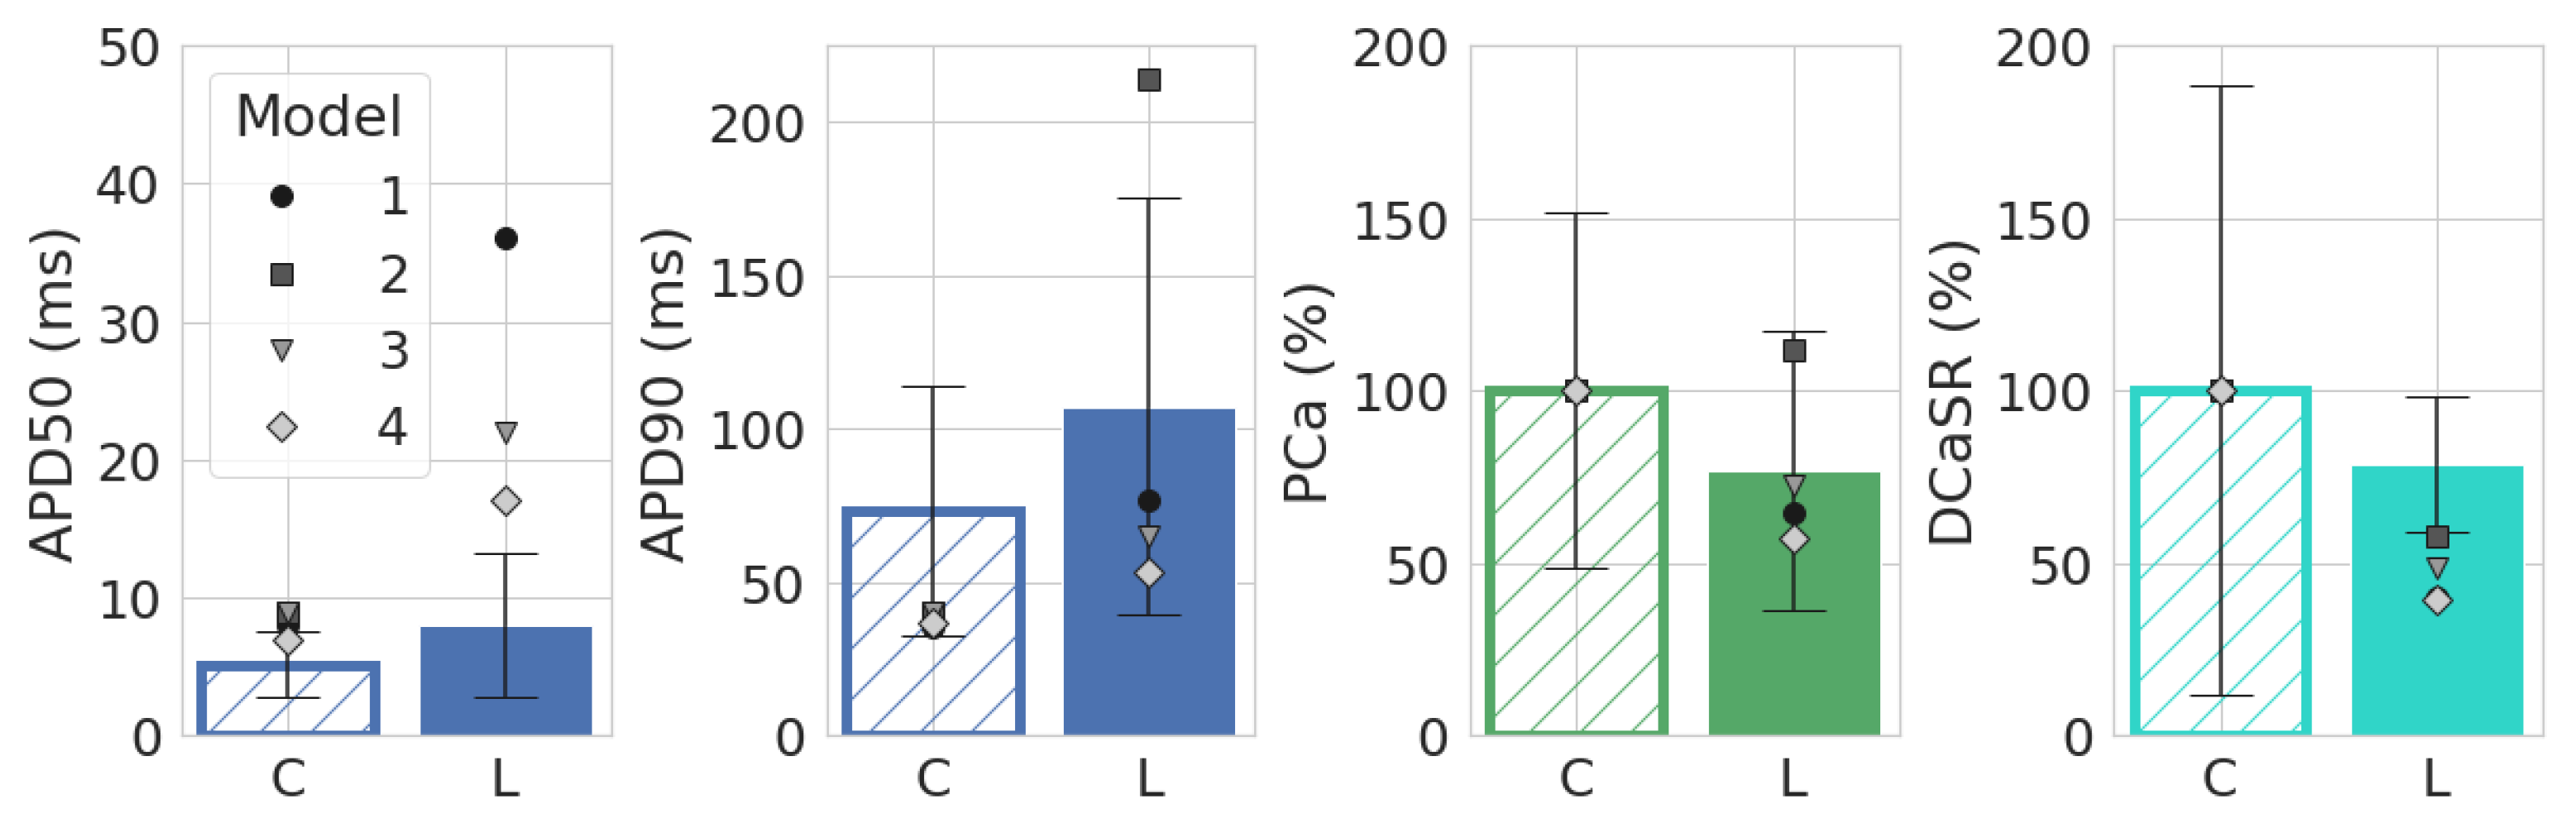
3.1. Leptin Effects in Single Cell Models

We first studied AP rate dependence for Model 1 in the control and under leptin application. The cardiomyocyte was simulated with the period of 1000 ms, which was then progressively decreased. The results are presented in Figure 1, where AP is shown by the dashed blue line for the control and by the solid red line under leptin exposure. In the control, we see APs of normal triangular shape. The APD rate dependence (APD restitution curve) is almost flat for the control (Figure 2, Model 1). However, under leptin application, APD increased essentially at every pacing rate tested, but the degree of change depended on BCL. Moreover, the AP shape varies substantially in the model with leptin-induced parameter modification. The dynamics of shape transformation are complex; however, the main features are illustrated in Figure 1. We observed three main types of dynamics. For long periods of stimulation (more than 500 ms), APs were found to generally have a spike-and-dome shape rather than triangular as seen in Figure 1I, and APD was around 232–262 ms long. Thus, compared to the control, APD was prolonged by 544–608%. As we decreased the stimulation period, the spike-and-dome morphology was observed to be present down to the BCL of 550 ms. For shorter BCLs, AP returned to the original triangular shape, though still with substantially longer APD as compared to the control (by 49–237%). In some instances, however, spike-and-dome APs appeared between normal triangular APs. The dynamics of this type for BCL 400 ms are shown in Figure 1II. For BCLs below 350 ms, all APs under leptin were triangular as in the control. These dynamics for BCL 350 ms are shown in Figure 1III.
The BCL-dependence of APD (the APD restitution curve) in Model 1L under leptin is shown against control Model 1C in Figure 2 (Model 1). It is important to note that the APD90 restitution curve of Model 1L lies above the Model 1C restitution curve. In other words, for all tested BCLs, APD90 in the models simulating exposure to leptin was longer than in the control.
Like Model 1L, Model 2L reveals two different AP shapes: spike-and-dome for large BCLs (1000 to 350 ms) and triangular shape for short BCLs (200 to 90 ms). At BCL 300 and 250, an intermediate state was observed in Model 2L, with these two AP forms alternating with a period of 2 cycles, which was not encountered in 1L (see Figure 3). In the restitution curve (see Figure 2 Model 2), the regular alternation in AP configuration was reflected in a large standard deviation (51–62 ms) for APD90. In general, APD90 in Model 2L decreased with going from long to short BCLs, while for shorter BCLs, the restitution curve had a greater slope compared to Model 1L (the difference in APD90 between BCL 200 ms and 90 ms was 32.4 ms in 2L versus 12 ms in 1L). As in Model 1, leptin exposure resulted in AP elongation across all BCLs (by 410–476% for BCL ≥ 350 ms and by 39–130% for BCL ≤ 200 ms).
In modeling the effects of leptin using Models 3 and 4, the AP was also prolonged compared to the control (by 48–98% in Model 3 and by 38–46% in Model 4; see Figure 2, Models 3 and 4). However, no spike-and-dome morphology was observed. The restitution curves were monotonically decreasing functions with the decrease in BCL, and the restitution curve in Model 3L demonstrated a steeper slope than in 3C (the difference in APD90 between BCL 1000 ms and 90 ms was 47.5 ms in 3L versus 14 ms in 3C). At the same time, the difference in slope between Models 4L and 4C was not as strong (16 ms in 4L versus 11 ms in 4C).
For validating Models 1L–4L, we used experimental data on the effect of leptin on APD50, APD90, calcium transient peak (PCa), and diastolic SR calcium (DCaSR) in mouse ventricular cardiomyocytes from ref. [12], which also reported data on ion channel remodeling. A comparison of these literature data with the simulations is presented in Figure 4, where the literature data are represented by boxplots and the simulation data by markers. As can be seen, Models 1–4 demonstrate good-quality reproduction of the results for three of the four characteristics [12]: APD50 and APD90 increased under the influence of leptin compared with the control, while DCaSR decreased. Note that, like in the literature data, PCa decreased in the case of triangular APs (1L, 3L–4L in Figure 4), but if the AP had a spike-and-dome morphology (2L), then PCa was higher than the control. The simulation results at BCL = 500 ms are shown in Figure 4. For all other tested BCLs, leptin exposure led to qualitatively the same results.

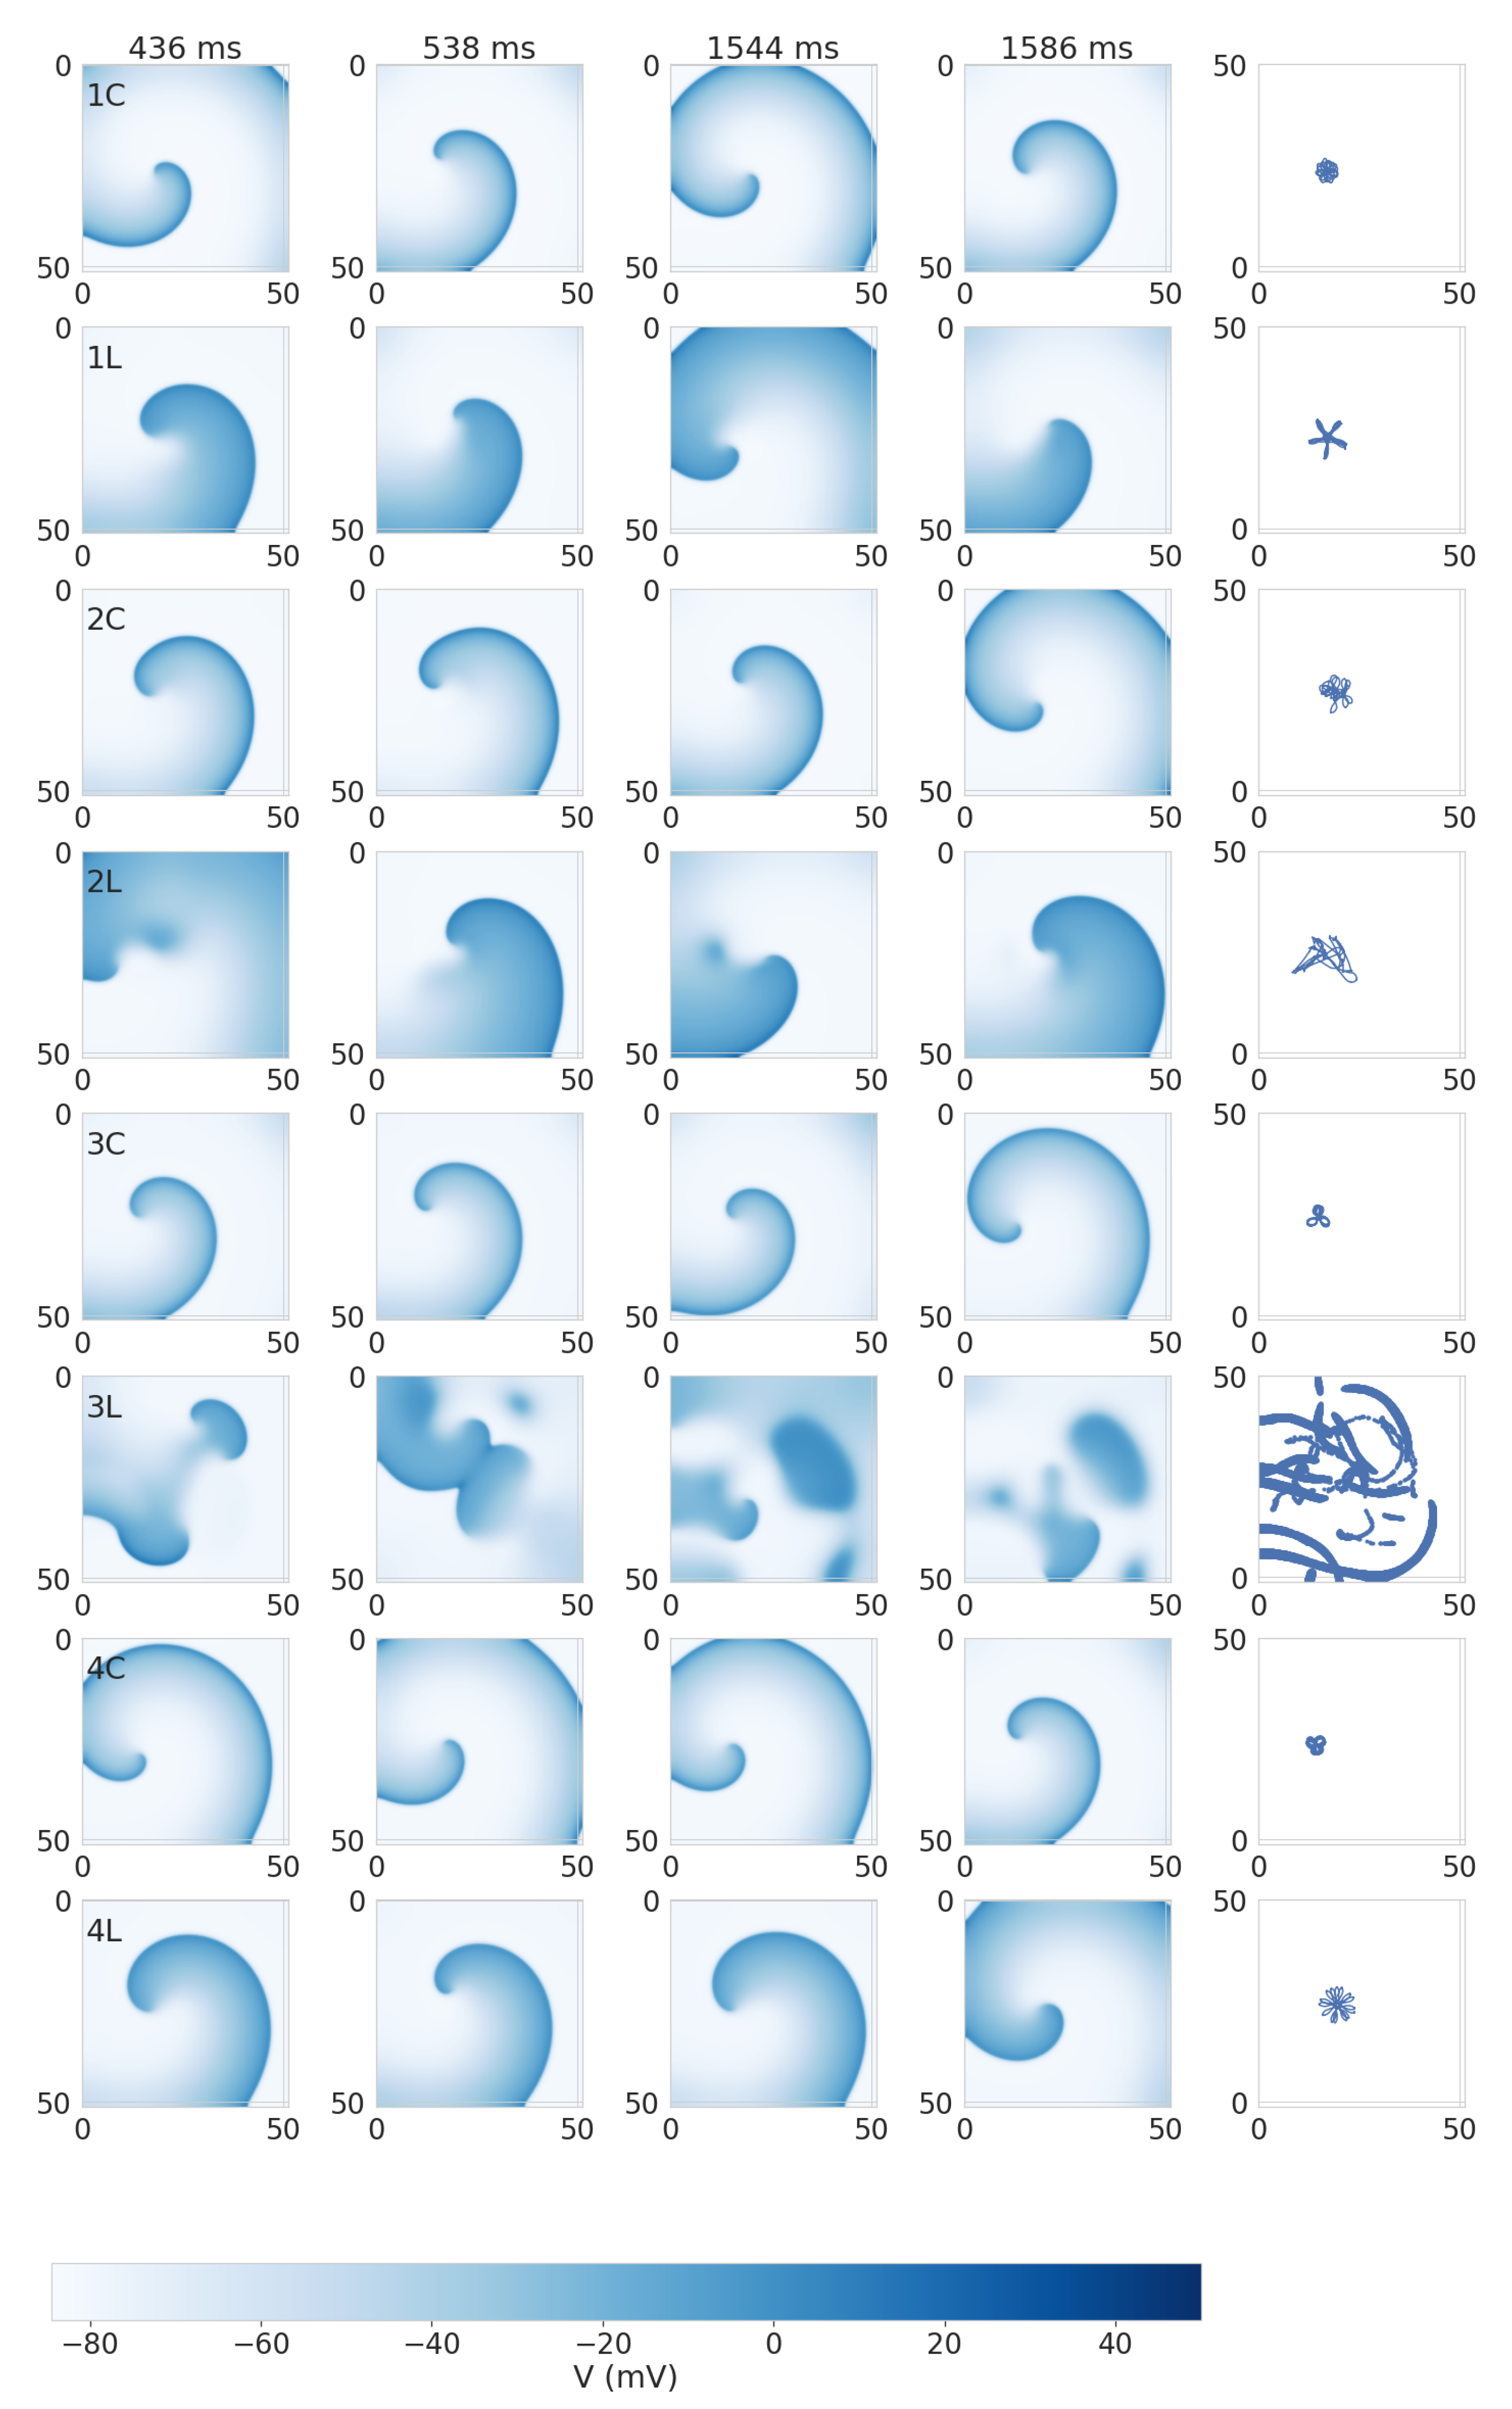
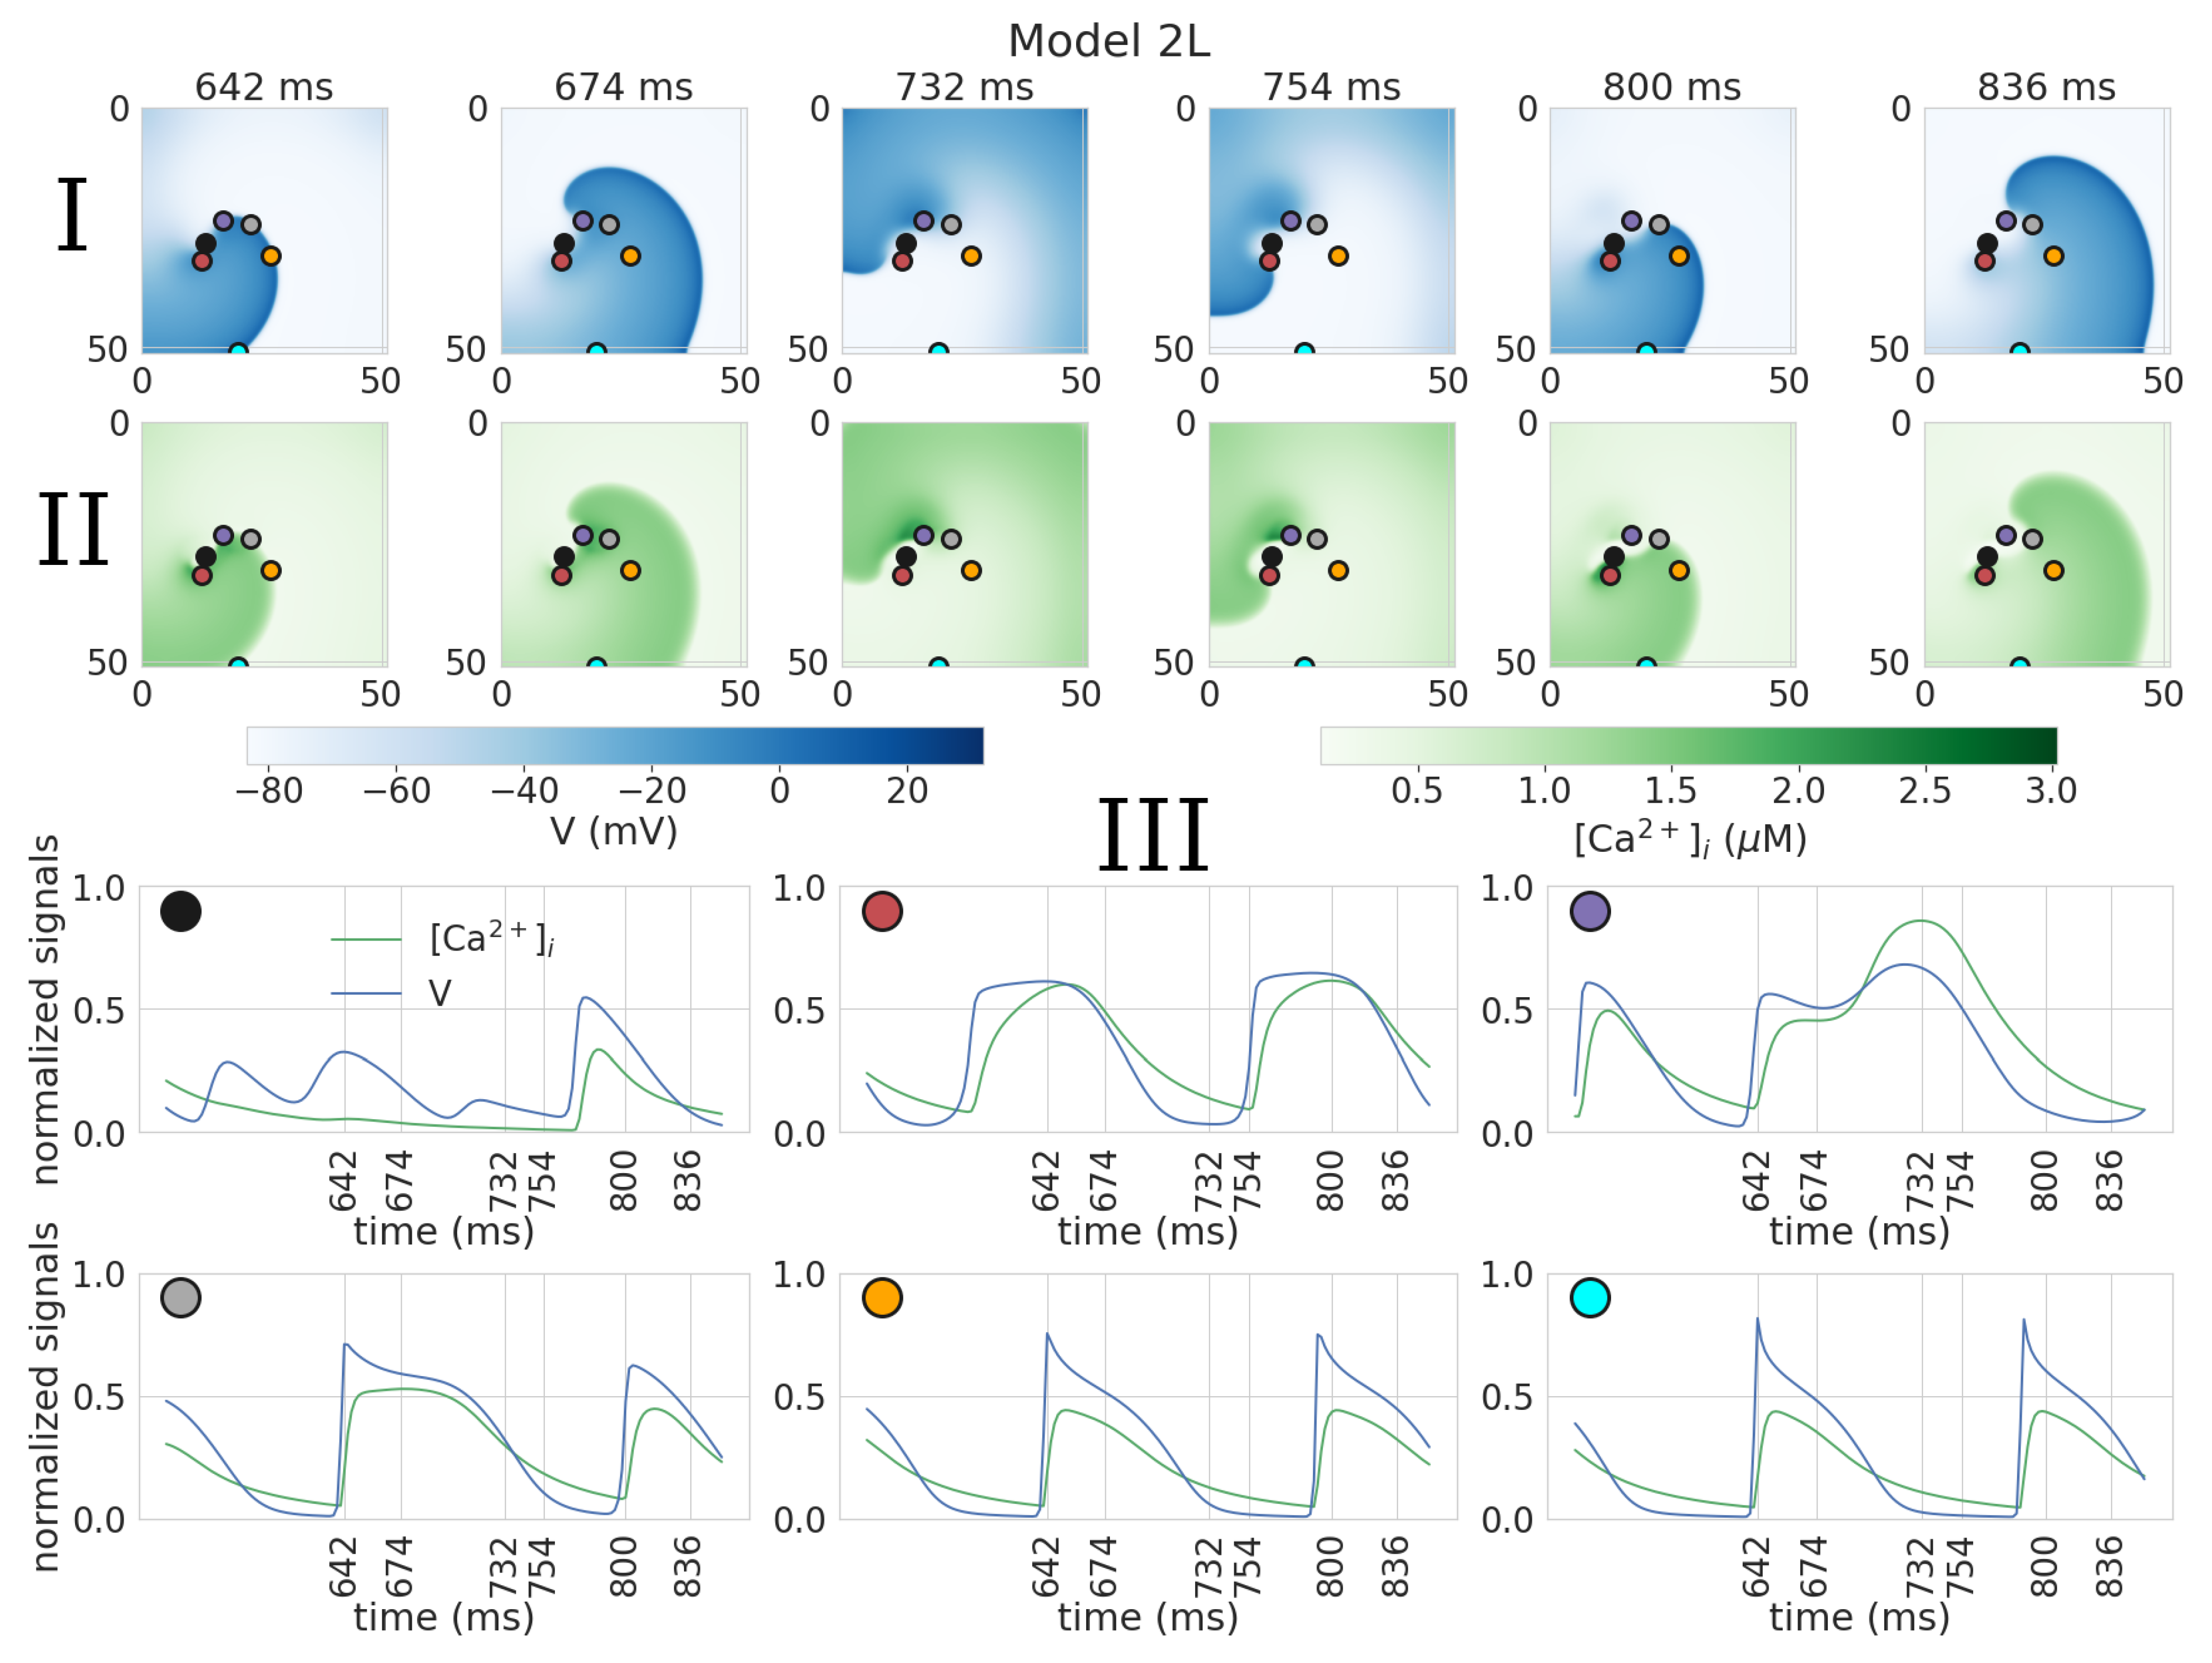
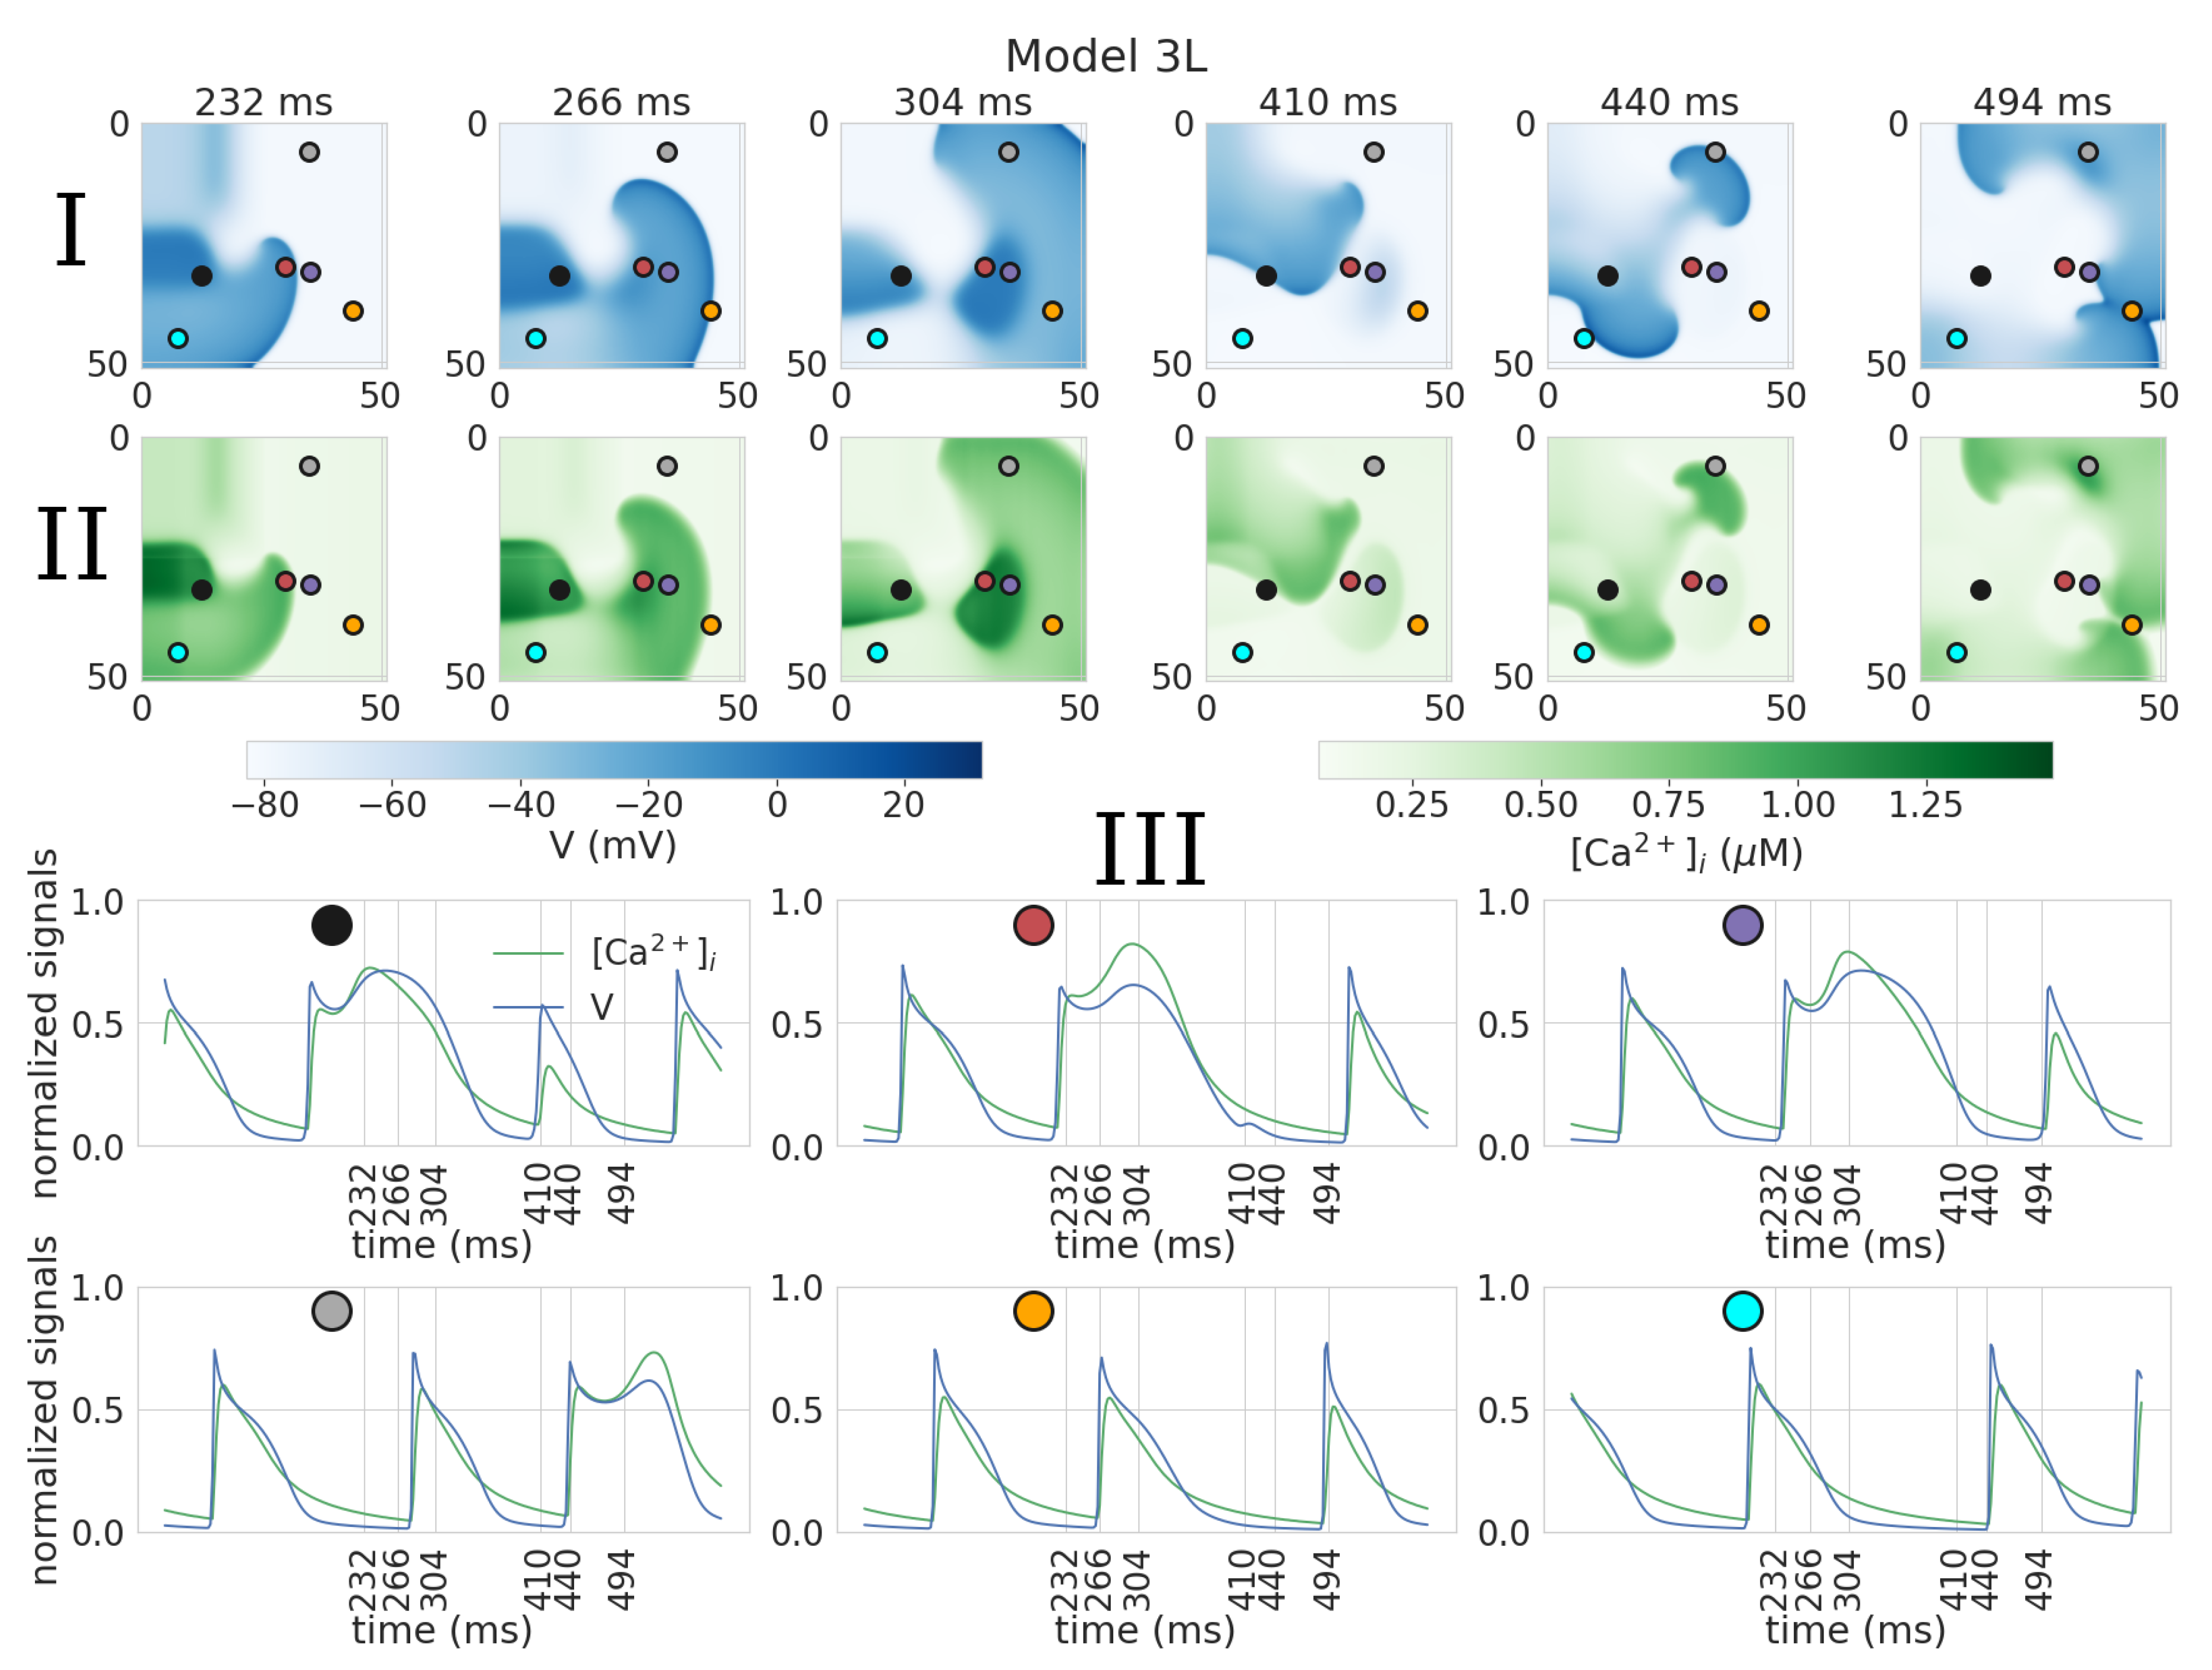
3.2. Dynamics of Spiral Waves in 2D Tissue Models

Figure 5 shows dynamics of spiral waves in Models 1–4 in the control and under leptin application. In Model 1C (control), the spiral wave has a small meandering core of 6 mm size. The trajectory of the meandering has outward facing petals, and the whole meandering cycle consists of approximately 17 subcycles. Under leptin application, the size of the core increased almost twice up to 11.5 mm. The trajectory of the meandering also has outward facing petals, but the meandering cycle consists of approximately 5 petals. The spiral wave period is 79.8 ± 2.0 ms in the control and essentially longer, 117.9 ± 3.6 ms, under leptin.
In Model 4, we see similar spiral wave dynamics. In the control, there is a meandering with the core of 4.9 mm and three outward petals. Under leptin application, the size of the core increased up to 9.6 mm, and the meandering trajectory shows 15 outwards petals. The spiral wave period is 84.5 ± 1.5 ms in the control and much longer, 110.6 ± 2.2 ms, under leptin.
In Model 2C (control), we also observed a meandering, although it was less regular than in Model 1C and 4C. The trajectory has outward petals, but their positions are not equally spaced. The size of the core is 10.0 mm. Under leptin, the core size also increased to 17.7 mm, and the trajectory became even more irregular. The main mechanism of this irregularity was the onset of early after-depolarization (EAD) activity close to the center of the spiral. As a result, we observed areas with elongated APs (see Figure 5(2L) and Figure 6). These regions, however, did not lead to a breakup and just increased the degree of meandering. The spiral wave period is 91.9 ± 3.2 ms in the control (similar to Models 1C, 4C) and 152.0 ± 12.8 ms under leptin (much longer than in Models 1L, 4L).
In Model 3 control, the dynamics were similar to those of Model 4, with the core size of 5.6 mm and outward petal meandering. However, under leptin application, we observed a substantial increase in EAD activity, which resulted in spiral wave breakup. The spiral wave period was 92.9 ± 2.6 ms in the control, and the period of the excitation pattern during breakup under leptin was around 185.4 ± 55.6 ms.
We further illustrate the EAD related mechanism of meandering and breakup in more detail in Figure 6 and Figure 7. Also, videos of spiral waves in Models 2L and 3L can be found in the Supplementary Materials (videos 2D_2L and 2D_3L, respectively). In Model 2L, abnormal APs are seen close to the tip of the spiral wave with extremely long dome shapes (see Figure 6III, magenta dot, APD 160 ms) or a plateau (red dot APD 120 ms). These cases are additionally characterized by a long duration of the calcium transients (time from start to 50% decay of calcium transient is 160 ms and 94 ms for magenta and grey dots versus 62 ms and 54 ms for orange and cyan dots). The AP becomes shorter at some distance from the core (APD: 160, 120, 88, and 76 ms for magenta, gray, orange, and cyan dots, respectively), and finally acquires the triangular shape characteristic of the rat (orange dot), approaching its values during intermittent stimulation.
Breakup in Model 3L is shown in Figure 7. After 232 ms, we see a dark blue area indicating a region with an elongated AP (Figure 7I, frame 1, black dot); however, it is located further from the spiral wave tip (approximately 12 mm away) than in Model 2L simulations (where such areas intersect with the core) (Figure 6). At t = 304 ms, a second similar area is formed (Figure 7I, frame 2, red and purple dots); the APs measured in both areas (Figure 7III, black, red, and purple dots) have a spike-and-dome morphology with an extra-long APD (182, 202, and 186 ms, respectively). Then at t = 410 ms, the wave front collides with the central area of the elongated AP (Figure 7I, frame 4). This collision leads to wave break and formation of new spiral waves (Figure 7I, frame 5). In addition, a new area of spike-and-dome APs appears at t = 494 ms (Figure 7I, frame 6, grey dot) with an action potential duration of 140 ms (Figure 7III, grey dot).
In the time interval considered, the orange and blue dots are outside the regions of spike-and-dome APs, and the APD are in the range from 72 to 106 ms (Figure 7III).
Thus, we see that in Models 2L and 3L the more complex dynamics are directly related to the spike-and-dome morphology of the AP, or EADs. We did not specifically study the mechanism of EAD; however, our Ca 2 + transient graphs for the spike-and-dome APs indicate that it is related to Ca 2 + dynamics and reactivation of Ca 2 + current. Interestingly, in contrast to the 2D tissue models in single cell simulations, no spike-and-dome morphologies were found in Models 2L and 3L at pacing BCLs in the range of the spiral wave periods.

4. Discussion

In this paper, we report simulated effects of chronic exposure to leptin on ionic currents in electrophysiological models of the rat cardiomyocyte and investigate the related effects on the cellular activity and dynamics of cardiac arrhythmias in the two-dimensional layer of cardiac tissue. The ionic model for the rat cardiomyocyte was previously developed and described in our recent paper [20] as a modification of the Gattoni 2016 [22] model of rat ventricular cardiomyocytes. Overall we studied four modifications of the model, all of which reproduce experimental measurement of APD restitution curves in normal conditions. To reproduce leptin effects, we varied the model parameters as follows: the maximal conductance of the transient outward current g t o was reduced by 47%, and the conductance of the Na + -Ca 2 + exchanger g N C X was increased by 93%, which corresponds to data on the remodeling of transmembrane currents in mouse ventricular cardiomyocytes after a three-week administration of leptin through a micro-osmotic pump [12].
As a result of ionic parameter modifications in each model, the duration of the AP increased, while the calcium transient peak and the level of diastolic Ca 2 + in the SR lowered. These results qualitatively reproduce the experimental findings from [12] (Figure 4). Our simulations are also consistent with in vitro studies of the effect of leptin on rat ventricular cardiomyocytes showing AP prolongation [11] and decreased amplitude of the calcium transient [35]. Note that although there is inconsistency in experimental data, showing either no effects of leptin on the Ca 2 + transient or a change in the Ca 2 + transient amplitude and temporal characteristics [35,36,37,38], the response may be dependent on the experimental protocol, animal species, and leptin concentrations. However, our model predictions of reduced Ca 2 + levels in the SR suggest a potential role of modified intracellular calcium dynamics in reducing the contractile function of cardiomyocytes exposed to high-level leptin, as reported in a number of studies [35,36,37,39].
In two out of the four models (Models 1–2), leptin-associated ionic modifications caused a substantial change in the AP shape with the formation of a spike-and-dome morphology at low stimulation frequency. This AP morphology is not characteristic of rat cardiomyocytes. The occurrence of dome-shaped APs was accompanied by an increase in the amplitude of the calcium transient, caused by an enhanced calcium release from the SR through ryanodine receptors and increased Ca 2 + influx through L-type calcium channels. These mechanisms are similar to the mechanisms of EAD, whereby the downregulation of potassium channels—in our case, reduction in the I t o —leads to a prolongation of the early phase of fast repolarization, reactivation of L-type calcium channels, and, as a result, re-depolarization [2]. In addition, spontaneous Ca 2 + release from the SR during the AP plateau, which we observed in our simulations, can also potentially contribute to the occurrence of dome-shaped APs or EAD [40].
Note that in a small number of simulations with Model 1, we sometimes observed triangular APs for long BCLs (around 1000 ms), and their onset was dependent on the prehistory of simulation and the rate at which we decreased the frequency. Such long BCLs are not in the physiological range for the rat heart, for which the normal BCL is around 170 ms and the period of arrhythmia in rats is less than 100 ms. We did not observe this phenomenon in Models 2–4 or in Model 1 for BCL less than 700 ms. The mechanism of this phenomenon may be related to the model’s slow Ca 2 + dynamics. However, we did not study it in detail, as it does not affect the results of our study in any way.
The findings reported in this paper suggest the following implications. Leptin-induced increase in action potential duration in itself is considered an arrhythmogenic effect. Indeed, action potential prolongation correlates with QT prolongation, while a long QT interval can cause the polymorphic ventricular tachycardia “torsades de pointes” (TdP), which in turn can lead to syncope and sudden cardiac death [41]. As a matter of fact, leptin-induced QT prolongation in rats was shown in [11]. Also, the occurrence of action potentials of abnormal shape is considered a highly arrhythmogenic factor. Such spike-and-dome action potentials, as mentioned above, are not typical for rats and are similar to EAD dynamics. The onset of EADs is one of the main mechanisms underlying arrhythmias [2], including TdP [21].
We also simulatied the dynamics of cardiac arrhythmias in a 2D model of cardiac tissue with each of the four modifications of the cellular model. Leptin-induced changes in AP were found to increase the period and the core size of the spiral wave in Models 1, 2, and 4. In all models, the dynamics of spiral wave rotation also became more complex. In Models 1, 2, and 4, we observed an increased meandering of the tip trajectory. In Model 2, hypermeandering dynamics developed, induced by the emergence of APs with a spike-and-dome morphology. Moreover, in Model 3, the spike-and-dome morphology of AP led to a breakup of the spiral wave and formation of an excitation pattern similar to fibrillation.
The main implications of these results are as follows. An increased period of arrhythmia in itself may be considered a positive effect. However, what is more important here is the change in the spiral wave dynamics. An increase in the core size together with an increased meandering (as in Models 1, 2, and 4) make an arrhythmia more unstable and thus more dangerous. For example, the meandering spiral is associated with arrhythmia called TdP [21], which can deteriorate to ventricular fibrillation and lead to sudden cardiac death [21,41]. Another mechanism for ventricular fibrillation development is the spiral wave breakup—a process leading to the development of multiple spirals that are continuously extinguished and recreated [21]. We observed it under the application of leptin in Model 3.
Thus, our simulation results suggest that cellular remodeling in the ionic currents under hyperleptinemia could provoke rhythm disturbances on the tissue and organ level. This prediction is in line with experimental data showing a higher risk of arrhythmia in hyperleptinemia [9,42].
In our models, arrhythmogenic effects of leptin were obtained as a result of decreasing I t o and increasing I N C X , which led to the elongation of the action potential and affected intracellular calcium dynamics. Thus, it can be assumed that drugs that inhibit I N C X and activate I t o will be effective in counteracting the negative effects of hyperleptinemia. Also antiarrhythmic effects can be expected where a drug counteracts leptin-induced elongation of the action potential. These considerations suggest that some existing antiarrhythmic drugs can be effective in ameliorating leptin-induced arrhythmia. In particular, aprindine is an antiarrhythmic drug that shortens the action potential [43] and, at the same time, shows NCX inhibitory effects [44]. In addition, class 1b antiarrhythmic agents and calcium channel blockers, which cause action potential shortening, and selective NCX blockers (SEA0400, SN-6 and YM -244769), which have demonstrated cardioprotective effects in experiments on cell cultures and animals [45,46], can be effective drugs in this case. Our models can be used to initially test this hypothesis.
In the future, Models 1L–4L can be integrated into the 3D model of the rat ventricles with an anatomically realistic geometry (with and without post-infarction scar) and fiber orientation that we developed previously [20], in which models 1C and 2C were used as cellular models. The 3D model can be used to further study arrhythmias in hyperleptinemia at the organ level, including the combined effect of hyperleptinemia and post-infarction scar.
An important aspect of biomedical modeling research is reproducibility and credibility based on model verification, validation, and underlying experimental data. These issues have been discussed in several papers (see, e.g., [47,48]), and the development of related principles is still ongoing. In reference [48], for example, the authors proposed ten rules for credible practice of modeling and simulation in healthcare. Although in our study we did not follow these rules explicitly, many of them were naturally used in our research. For example, in our paper, we define the purpose of the study, give details of the model development, perform validation on available data, and outline limitations. So far, we do not have version control since this is the first version of our model. However, we will do this in subsequent research, as new modifications of our model are developed. We also provide full details of our model. Because we use software that was not developed by us, we cannot publish it in full. However, we provide the complete list of parameters and the code that we used to generate some results. We also will be happy to help researchers implement our model.

Limitations

To simulate leptin effects on the ionic current remodeling in rat cardiomyocytes, we used experimental data for mouse ventricular cardiomyocytes after long-term exposure to leptin, due to the lack of similar data on rats. Although the ventricular APs in the rat and mouse are triangular in shape and more similar to each other than to APs in the cardiomyocytes of other species (rabbit, guinea pig, pig, dog) and humans [49], there are still some differences in the potassium currents between them [50]. Moreover, the heart rate of a mouse is higher than that of a rat [49]. Therefore, experimental data on leptin effects in rat ventricular cardiomyocytes are needed to validate our models. In case of any discrepancy in the mechanisms of leptin effects on ionic currents between mouse and rat, our models and the approach we developed can be easily adjusted to simulate experimental data specific to rats and can be used to further study the effects of leptin on cardiac arrhythmias. It would also be interesting to apply our approach to other models of rat cardiomyocytes and compare their performance with the model used in our study.
In this paper, we presented our models built and validated using experimental data for long-term exposure to leptin [12]. However, acute, short-term, or dose-dependent effects of leptin (see, e.g., [10,36]) may differ. These effects can also be studied using the approaches developed in our paper. That said, we believe that the use of data on chronic effects of leptin is more relevant to contexts where obesity needs to be identified, because these effects definitely develop during chronic long-term processes.

5. Conclusions

Cellular ionic models of rat cardiomyocytes have been developed to simulate effects of hyperleptinemia. AP prolongation is predicted in consistency with experimental data. Our results from 2D myocardial tissue models suggest that leptin may increase the period of arrhythmia and make it less stable due to the occurrence of local areas with an EAD-like morphology of APs in the tissue.

Supplementary Materials

The following supporting information can be downloaded at: https://www.mdpi.com/article/10.3390/math11040874/s1.

Author Contributions

Conceptualization, A.P. and O.S.; investigation, T.N., A.P. and O.S.; methodology, A.P. and O.S.; software, T.N. and R.R.; visualization, T.N.; writing—original draft preparation, T.N., A.P. and O.S; writing—review and editing, T.N., R.R., A.P. and O.S. All authors have read and agreed to the published version of the manuscript.

Funding

The research funding from the Ministry of Science and Higher Education of the Russian Federation (Ural Federal University Program of Development within the Priority-2030 Program) is gratefully acknowledged.

Institutional Review Board Statement

Not applicable.

Data Availability Statement

The data and the code for the 0D simulation are publicly available in the GitHub repository: https://github.com/tatiannesterova/DRC (accessed on 27 January 2023). Other data related to this study can be provided by the corresponding authors on request.

Conflicts of Interest

The authors declare no conflict of interest.

Abbreviations

The following abbreviations are used in this manuscript:
APaction potential
APDaction potential duration
APD50APD at 50% repolarization
APD90APD at 90% repolarization
BCLbasic cycle length
DCaSRdiastolic Ca 2 + level in the sarcoplasmic reticulum
EADearly after-depolarization
SRsarcoplasmic reticulum
PCaCa 2 + transient peak
TdPTorsade de Pointes
I N C X Na + -Ca 2 + exchange current
I t o transient outward potassium current
g N C X pump rate of I N C X
g S E R C A the maximal velocity of the sarcoplasmic reticulum Ca 2 + -ATPase pump
g t o maximum conductance parameter of I t o

References

  1. Timmis, A.; Vardas, P.; Townsend, N.; Torbica, A.; Katus, H.; De Smedt, D.; Gale, C.P.; Maggioni, A.P.; Petersen, S.E.; Huculeci, R.; et al. European Society of Cardiology: Cardiovascular disease statistics 2021. Eur. Heart J. 2022, 43, 716–799. [Google Scholar] [CrossRef] [PubMed]
  2. Anumonwo, J.M.; Pandit, S.V. Ionic mechanisms of arrhythmogenesis. Trends Cardiovasc. Med. 2015, 25, 487–496. [Google Scholar] [CrossRef]
  3. World Health Organization (WHO). Obesity and Overweight Fact-Sheets. Available online: https://www.who.int/news-room/fact-sheets/detail/obesity-and-overweight (accessed on 4 November 2022).
  4. Fonfara, S.; Kitz, S.; Hetzel, U.; Kipar, A. Myocardial leptin transcription in feline hypertrophic cardiomyopathy. Res. Vet. Sci. 2017, 112, 105–108. [Google Scholar] [CrossRef]
  5. Zeidan, A.; Purdham, D.M.; Rajapurohitam, V.; Javadov, S.; Chakrabarti, S.; Karmazyn, M. Leptin induces vascular smooth muscle cell hypertrophy through angiotensin II-and endothelin-1-dependent mechanisms and mediates stretch-induced hypertrophy. J. Pharmacol. Exp. Ther. 2005, 315, 1075–1084. [Google Scholar] [PubMed]
  6. Matsui, H.; Motooka, M.; Koike, H.; Inoue, M.; Iwasaki, T.; Suzuki, T.; Kurabayashi, M.; Yokoyama, T. Ischemia/reperfusion in rat heart induces leptin and leptin receptor gene expression. Life Sci. 2007, 80, 672–680. [Google Scholar] [PubMed]
  7. Bravo, P.E.; Morse, S.; Borne, D.M.; Aguilar, E.A.; Reisin, E. Leptin and hypertension in obesity. Vasc. Health Risk Manag. 2006, 2, 163. [Google Scholar]
  8. Leifheit-Nestler, M.; Wagner, N.M.; Gogiraju, R.; Didié, M.; Konstantinides, S.; Hasenfuss, G.; Schäfer, K. Importance of leptin signaling and signal transducer and activator of transcription-3 activation in mediating the cardiac hypertrophy associated with obesity. J. Transl. Med. 2013, 11, 170. [Google Scholar] [CrossRef]
  9. Polyakova, E.A.; Mikhaylov, E.N.; Galagudza, M.M.; Shlyakhto, E.V. Hyperleptinemia results in systemic inflammation and the exacerbation of ischemia-reperfusion myocardial injury. Heliyon 2021, 7, e08491. [Google Scholar]
  10. Gómez-Hurtado, N.; Fernández-Velasco, M.; Fernández-Alfonso, M.S.; Boscá, L.; Delgado, C. Prolonged leptin treatment increases transient outward K+ current via upregulation of Kv4. 2 and Kv4. 3 channel subunits in adult rat ventricular myocytes. Pflügers Arch.-Eur. J. Physiol. 2014, 466, 903–914. [Google Scholar] [CrossRef]
  11. Lin, Y.C.; Huang, J.; Hileman, S.; Martin, K.H.; Hull, R.; Davis, M.; Yu, H.G. Leptin decreases heart rate associated with increased ventricular repolarization via its receptor. Am. J. Physiol.-Heart Circ. Physiol. 2015, 309, H1731–H1739. [Google Scholar] [CrossRef]
  12. Gómez-Hurtado, N.; Domínguez-Rodríguez, A.; Mateo, P.; Fernández-Velasco, M.; Val-Blasco, A.; Aizpún, R.; Sabourin, J.; Gómez, A.M.; Benitah, J.P.; Delgado, C. Beneficial effects of leptin treatment in a setting of cardiac dysfunction induced by transverse aortic constriction in mouse. J. Physiol. 2017, 595, 4227–4243. [Google Scholar] [CrossRef] [PubMed]
  13. Lin, Y.K.; Chen, Y.C.; Huang, J.H.; Lin, Y.J.; Huang, S.S.; Chen, S.A.; Chen, Y.J. Leptin modulates electrophysiological characteristics and isoproterenol-induced arrhythmogenesis in atrial myocytes. J. Biomed. Sci. 2013, 20, 94. [Google Scholar] [CrossRef] [PubMed] [Green Version]
  14. Ricci, E.; Smallwood, S.; Chouabe, C.; Mertani, H.C.; Raccurt, M.; Morel, G.; Bonvallet, R. Electrophysiological characterization of left ventricular myocytes from obese Sprague-Dawley rat. Obesity 2006, 14, 778–786. [Google Scholar] [CrossRef]
  15. Qu, Z.; Weiss, J.N.; Garfinkel, A. Cardiac electrical restitution properties and stability of reentrant spiral waves: A simulation study. Am. J. Physiol.-Heart Circ. Physiol. 1999, 276, H269–H283. [Google Scholar]
  16. Ten Tusscher, K.H.; Panfilov, A.V. Alternans and spiral breakup in a human ventricular tissue model. Am. J. Physiol.-Heart Circ. Physiol. 2006, 291, H1088–H1100. [Google Scholar]
  17. Pravdin, S.F.; Dierckx, H.; Katsnelson, L.B.; Solovyova, O.; Markhasin, V.S.; Panfilov, A.V. Electrical wave propagation in an anisotropic model of the left ventricle based on analytical description of cardiac architecture. PLoS ONE 2014, 9, e93617. [Google Scholar] [CrossRef]
  18. Dusturia, N.; Choi, S.W.; Song, K.S.; Lim, K.M. Effect of myocardial heterogeneity on ventricular electro-mechanical responses: A computational study. Biomed. Eng. Online 2019, 18, 1–18. [Google Scholar] [CrossRef]
  19. Konovalov, P.; Mangileva, D.; Dokuchaev, A.; Solovyova, O.; Panfilov, A.V. Rotational activity around an obstacle in 2d cardiac tissue in presence of cellular heterogeneity. Mathematics 2021, 9, 3090. [Google Scholar] [CrossRef]
  20. Rokeakh, R.; Nesterova, T.; Ushenin, K.; Polyakova, E.; Sonin, D.; Galagudza, M.; De Coster, T.; Panfilov, A.; Solovyova, O. Anatomical model of rat ventricles to study cardiac arrhythmias under infarction injury. Mathematics 2021, 9, 2604. [Google Scholar]
  21. Antzelevitch, C. Basic mechanisms of reentrant arrhythmias. Curr. Opin. Cardiol. 2001, 16, 1–7. [Google Scholar]
  22. Gattoni, S.; Røe, Å.T.; Frisk, M.; Louch, W.E.; Niederer, S.A.; Smith, N.P. The calcium–frequency response in the rat ventricular myocyte: An experimental and modelling study. J. Physiol. 2016, 594, 4193–4224. [Google Scholar] [PubMed]
  23. Pandit, S.V.; Clark, R.B.; Giles, W.R.; Demir, S.S. A mathematical model of action potential heterogeneity in adult rat left ventricular myocytes. Biophys. J. 2001, 81, 3029–3051. [Google Scholar] [CrossRef] [PubMed]
  24. Lewalle, A.; Niederer, S.A.; Smith, N.P. Species-dependent adaptation of the cardiac Na+/K+ pump kinetics to the intracellular Na+ concentration. J. Physiol. 2014, 592, 5355–5371. [Google Scholar] [CrossRef] [PubMed]
  25. Hinch, R.; Greenstein, J.; Tanskanen, A.; Xu, L.; Winslow, R. A simplified local control model of calcium-induced calcium release in cardiac ventricular myocytes. Biophys. J. 2004, 87, 3723–3736. [Google Scholar] [CrossRef] [PubMed]
  26. Handa, B.S.; Roney, C.H.; Houston, C.; Qureshi, N.A.; Li, X.; Pitcher, D.S.; Chowdhury, R.A.; Lim, P.B.; Dupont, E.; Niederer, S.A.; et al. Analytical approaches for myocardial fibrillation signals. Comput. Biol. Med. 2018, 102, 315–326. [Google Scholar] [CrossRef] [PubMed]
  27. McKay, M.D.; Beckman, R.J.; Conover, W.J. A comparison of three methods for selecting values of input variables in the analysis of output from a computer code. Technometrics 2000, 42, 55–61. [Google Scholar]
  28. Hardy, M.E.; Pervolaraki, E.; Bernus, O.; White, E. Dynamic action potential restitution contributes to mechanical restitution in right ventricular myocytes from pulmonary hypertensive rats. Front. Physiol. 2018, 9, 205. [Google Scholar] [PubMed] [Green Version]
  29. Annoni, E.M.; Xie, X.; Lee, S.W.; Libbus, I.; KenKnight, B.H.; Osborn, J.W.; Tolkacheva, E.G. Intermittent electrical stimulation of the right cervical vagus nerve in salt-sensitive hypertensive rats: Effects on blood pressure, arrhythmias, and ventricular electrophysiology. Physiol. Rep. 2015, 3, e12476. [Google Scholar] [CrossRef]
  30. Bébarová, M.; Matejovic, P.; Pásek, M.; Simurdova, M.; Simurda, J. Dual effect of ethanol on inward rectifier potassium current IK1 in rat ventricular myocytes. J. Physiol. Pharmacol. 2014, 65, 497–509. [Google Scholar]
  31. Hindmarsh, A.C.; Brown, P.N.; Grant, K.E.; Lee, S.L.; Serban, R.; Shumaker, D.E.; Woodward, C.S. SUNDIALS: Suite of nonlinear and differential/algebraic equation solvers. ACM Trans. Math. Softw. TOMS 2005, 31, 363–396. [Google Scholar] [CrossRef]
  32. Clerx, M.; Collins, P.; de Lange, E.; Volders, P.G. Myokit: A simple interface to cardiac cellular electrophysiology. Prog. Biophys. Mol. Biol. 2016, 120, 100–114. [Google Scholar] [PubMed]
  33. Lee, S.W.; Li, Q.; Libbus, I.; Xie, X.; KenKnight, B.H.; Garry, M.G.; Tolkacheva, E.G. Chronic cyclic vagus nerve stimulation has beneficial electrophysiological effects on healthy hearts in the absence of autonomic imbalance. Physiol. Rep. 2016, 4, e12786. [Google Scholar] [CrossRef] [PubMed]
  34. Fenton, F.; Karma, A. Vortex dynamics in three-dimensional continuous myocardium with fiber rotation: Filament instability and fibrillation. Chaos Interdiscip. J. Nonlinear Sci. 1998, 8, 20–47. [Google Scholar]
  35. Nickola, M.W.; Wold, L.E.; Colligan, P.B.; Wang, G.J.; Samson, W.K.; Ren, J. Leptin attenuates cardiac contraction in rat ventricular myocytes: Role of NO. Hypertension 2000, 36, 501–505. [Google Scholar]
  36. Khokhlova, A.; Myachina, T.; Butova, X.; Kochurova, A.; Polyakova, E.; Galagudza, M.; Solovyova, O.; Kopylova, G.; Shchepkin, D. The Acute Effects of Leptin on the Contractility of Isolated Rat Atrial and Ventricular Cardiomyocytes. Int. J. Mol. Sci. 2022, 23, 8356. [Google Scholar] [CrossRef]
  37. Hintz, K.; Aberle, N.; Ren, J. Insulin resistance induces hyperleptinemia, cardiac contractile dysfunction but not cardiac leptin resistance in ventricular myocytes. Int. J. Obes. 2003, 27, 1196–1203. [Google Scholar]
  38. Wold, L.E.; Relling, D.P.; Duan, J.; Norby, F.L.; Ren, J. Abrogated leptin-induced cardiac contractile response in ventricular myocytes under spontaneous hypertension: Role of Jak/STAT pathway. Hypertension 2002, 39, 69–74. [Google Scholar] [CrossRef]
  39. Ren, J.; Relling, D.P. Leptin-induced suppression of cardiomyocyte contraction is amplified by ceramide. Peptides 2006, 27, 1415–1419. [Google Scholar] [CrossRef]
  40. Song, Z.; Ko, C.Y.; Nivala, M.; Weiss, J.N.; Qu, Z. Calcium-voltage coupling in the genesis of early and delayed afterdepolarizations in cardiac myocytes. Biophys. J. 2015, 108, 1908–1921. [Google Scholar] [CrossRef]
  41. Roden, D.M. A current understanding of drug-induced QT prolongation and its implications for anticancer therapy. Cardiovasc. Res. 2019, 115, 895–903. [Google Scholar]
  42. Fan, Y.; Huang, S.; Li, S.; Wu, B.; Huang, L.; Zhao, Q.; Zheng, Z.; Xie, X.; Liu, J.; Huang, W.; et al. The adipose-neural axis is critically involved in cardiac arrhythmias. bioRxiv 2022. [Google Scholar] [CrossRef]
  43. Watanabe, Y.; Koide, Y.; Kimura, J. Topics on the Na+/Ca2+ exchanger: Pharmacological characterization of Na+/Ca2+ exchanger inhibitors. J. Pharmacol. Sci. 2006, 102, 7–16. [Google Scholar] [CrossRef] [PubMed] [Green Version]
  44. Iwamoto, T.; Watanabe, Y.; Kita, S.; Blaustein, M.P. Na+/Ca2+ exchange inhibitors: A new class of calcium regulators. Cardiovasc. Haematol. Disord.-Drug Targets Formerly Curr. Drug Targets-Cardiovasc. Hematol. Disord. 2007, 7, 188–198. [Google Scholar]
  45. Morciano, G.; Rimessi, A.; Patergnani, S.; Vitto, V.A.; Danese, A.; Kahsay, A.; Palumbo, L.; Bonora, M.; Wieckowski, M.R.; Giorgi, C.; et al. Calcium dysregulation in heart diseases: Targeting calcium channels to achieve a correct calcium homeostasis. Pharmacol. Res. 2022, 177, 106119. [Google Scholar]
  46. Ravens, U. Antiarrhythmic therapy in atrial fibrillation. Pharmacol. Ther. 2010, 128, 129–145. [Google Scholar]
  47. Quinn, T.A.; Granite, S.; Allessie, M.A.; Antzelevitch, C.; Bollensdorff, C.; Bub, G.; Burton, R.A.B.; Cerbai, E.; Chen, P.S.; Delmar, M.; et al. Minimum Information about a Cardiac Electrophysiology Experiment (MICEE): Standardised reporting for model reproducibility, interoperability, and data sharing. Prog. Biophys. Mol. Biol. 2011, 107, 4–10. [Google Scholar]
  48. Erdemir, A.; Mulugeta, L.; Ku, J.P.; Drach, A.; Horner, M.; Morrison, T.M.; Peng, G.C.; Vadigepalli, R.; Lytton, W.W.; Myers, J.G. Credible practice of modeling and simulation in healthcare: Ten rules from a multidisciplinary perspective. J. Transl. Med. 2020, 18, 369. [Google Scholar] [CrossRef]
  49. Joukar, S. A comparative review on heart ion channels, action potentials and electrocardiogram in rodents and human: Extrapolation of experimental insights to clinic. Lab. Anim. Res. 2021, 37, 25. [Google Scholar] [CrossRef]
  50. Demir, S.S. Computational modeling of cardiac ventricular action potentials in rat and mouse. Jpn. J. Physiol. 2004, 54, 523–530. [Google Scholar]
Figure 1. APs in Model 1 in the control (the dotted blue line C) and under leptin (solid red line L). For Model 1L, three main types of dynamics are shown. I (BCL = 950 ms): APs have a spike-and-dome morphology; II (BCL = 400 ms): triangular APs predominate, but there are a few APs with spike-and-dome shapes; III (BCL = 350 ms): all APs are triangular. In the control, APs have a triangular shape at all stimulation periods.
Mathematics 11 00874 g001
Figure 2. The APD90 restitution curves in Models 1–4 in the control (C, blue) and under leptin (L, red).
Mathematics 11 00874 g002
Figure 3. Alternation of spike-and-dome and triangular AP shapes in Model 2 under leptin (solid red line) compared to triangular control APs (dashed blue line) at BCL 300 ms.
Mathematics 11 00874 g003
Figure 4. Comparison of AP duration at the level of 50% (APD50), 90% (APD90), calcium transient peak (PCa), and diastolic SR Ca 2 + (DCaSR) in Models 1–4 with experimental data from [12]. Simulations for BCL = 500 ms; boxplots (mean ± STD) are experimental results from [12]. The differences between leptin-treated and control groups shown in the experiment were statistically significant (p-value was <0.001 for APD50, APD90, and DCaSR and <0.05 for PCa) [12].
Mathematics 11 00874 g004
Figure 5. Spiral wave dynamics in 2D tissue with cellular Models 1–4 in the control (C) and under leptin application (L). The models are labeled in the left panels. Snapshots of transmembrane voltage at several moments of time are shown. The right column shows the tip trajectory detected using the Fenton and Karma algorithm [34] in the time window from 0.5 to 1.5 s after spiral initiation. The transmembrane potential color scale is given at the bottom.
Mathematics 11 00874 g005
Figure 6. Formation of abnormal action potentials close to the tip of the spiral wave in 2D tissue with cellular model 2L. Action potential (I); calcium transient (II) maps; III: normalized signals of the action potential and calcium transient, recorded at the points indicated on the graphs above by corresponding colors.
Mathematics 11 00874 g006
Figure 7. Breakup in 2D tissue model with cellular model 3L. Action potential (I) and calcium transient (II) maps during spiral wave rotation; III: normalized signals of the action potential and calcium transients, recorded at the points indicated on the graphs above by corresponding colors.
Mathematics 11 00874 g007
Table 1. Parameter values in four selected model samples as a percentage of the reference values at a basic cycle length of 1000 ms from the Gattoni 2016 model [22].
ParameterDefinitionReference ModelModel 1Model 2Model 3Model 4
g D Ca 2 + flux rate
from dyadic space to cytosol
100% (99 nm 3 /ms)40%40%40%40%  
g S E R C A (1000 ms)maximal velocity of
SR Ca 2 + -ATPase pump
100% (0.47 μ M/ms)71%79%116%155%
g S E R C A (170 ms) 145% (0.68 μ M/ms)130%143%168%225%  
J L permeability of
single L-type Ca 2 + channel
100% (0.7 nm 3 /ms)118%165%100%87%  
g N C X pump rate of
Na + -Ca 2 + exchange current
100% (51.5 μ M/ms)69%63%168%154%  
g t o maximum conductance of
transient outward K + current
100% (19.6 nS)178%185%196%193%  
g s s maximum conductance of
steady state outward K + current
100% (12 nS)72%41%26%62%  
i N a K m a x maximal velocity of
Na + /K + pump
100% (1.38 nA)181%140%64%105%
Disclaimer/Publisher’s Note: The statements, opinions and data contained in all publications are solely those of the individual author(s) and contributor(s) and not of MDPI and/or the editor(s). MDPI and/or the editor(s) disclaim responsibility for any injury to people or property resulting from any ideas, methods, instructions or products referred to in the content.

