1. Introduction
Neural machine translation, based on Transformer-based deep learning [
1], has seen rapid development in recent years in the field of machine translation. Unlike statistical machine translation, neural machine translation generates translations using neural networks, leading to more diverse sentences. Evaluating the quality of these translation systems is crucial but poses several challenges.
While there may be multiple correct translations due to language variability, there is no single correct translation. Human evaluation is subjective and can lead to inconsistent results, and determining what is considered “good enough” is subjective and task-dependent. While some evaluation methods are well established, there is no standard or universally accepted approach for evaluating NMT systems [
2]. In short, postulating good evaluation criteria of machine translation quality is complicated and ambiguous.
There are two main approaches to evaluating machine translation systems: human evaluation and automated evaluation. Human evaluation, while a good way to assess translation quality, is costly and requires significant human labor, in addition to the difficulty of finding reliable bilingual annotators. On the other hand, automatic evaluation is relatively low in quality, but is cost-effective and easy to use for comparing multiple systems.
Human evaluation involves evaluators assessing the translation output, also known as the hypothesis. The primary forms of human evaluation include scoring adequacy and fluency, human ranking of translations at the sentence level, and post-editing measures. Adequacy measures the correctness of the translation in meaning, while fluency refers to the grammatical and fluency quality of the translation output [
3]. Despite its strengths, human evaluation faces several challenges, such as inter-annotator agreement, subjectivity, and time-consuming nature. In addition, human evaluators may bring their own biases and preconceptions to the evaluation process, leading to inconsistent results.
In contrast, automatic evaluation metrics are cost-effective and easy to use for comparing multiple systems, but their quality is not as good as human evaluation. Research on automatic evaluation metrics that mimic or replace human evaluation methods is being conducted to address this limitation. Automated evaluation involves comparing the machine translation output to the correct translation, also known as the reference.
Traditionally, automatic evaluation metrics compare overlapping words [
4,
5,
6,
7]. These metrics, however, only capture lexical similarity and do not properly measure semantic, grammatical diversity, and sentence structure [
8]. For example, the bilingual evaluation understudy (BLEU) metric often performs poorly on sentences that are semantically similar but have different vocabulary and structure and vice versa, as shown in
Table 1. Research has shown that BLEU has a low correlation with human evaluation [
9,
10,
11,
12]. To address these limitations, recent studies have used embeddings from deep learning or Transformer-based language models [
13,
14], which have a deeper understanding of sentences and context and therefore show a higher correlation with human evaluation [
15,
16,
17].
In order to improve performance, a number of automated metrics using deep learning have been proposed. However, it is challenging to fully understand and utilize the different characteristics of each metric. Despite this, few studies have been conducted to gain a general understanding of these metrics. This is an important area of knowledge for both established and new researchers in the field.
Therefore, we conduct a survey of the automated evaluation metrics that have been studied so far. We categorize the metrics and analyze their characteristics based on the tasks they are used for and the training techniques employed. Through experiments, we highlight the challenges associated with each category of automated metrics. Furthermore, we examine the limitations of recent deep learning-based metric studies and suggest ways to improve them.
2. Taxonomy of Automated Evaluation Metrics
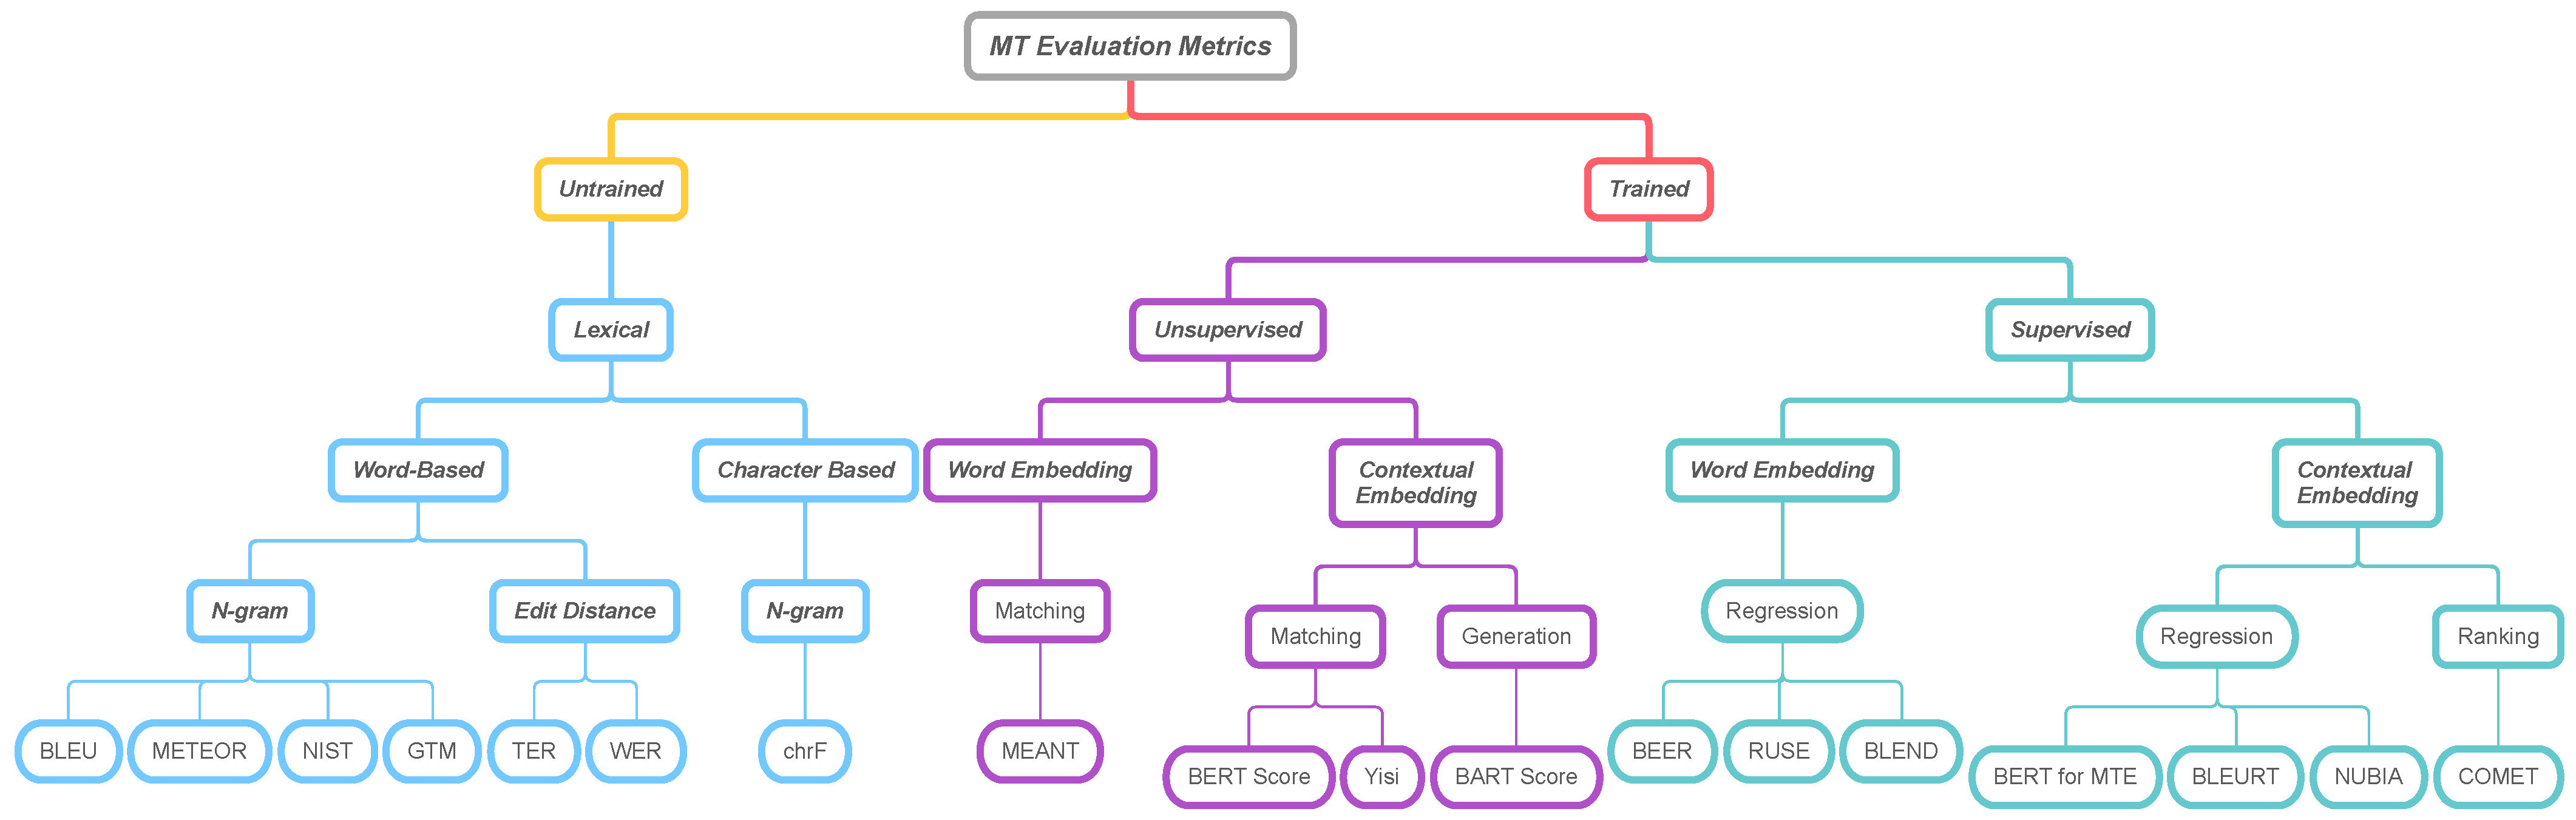
We classify the automatic evaluation metrics used in machine translation into
lexical-based metrics,
embedding-based metrics, and
supervised-metrics depending on the machine learning technique. The lexical-based metric refers to a metric that measures the similarity between the hypothesis and reference by a mathematical formula or heuristic method without requiring machine learning algorithms. It is divided into those that are word-based and character-based according to matching units. The embedding-based metric refers to a metric that measures similarity using machine learning or deep learning algorithms. This mainly uses embeddings. Hypotheses and references represented as dense vectors measure similarity by understanding the word or context more deeply. The supervised-metric trains regression models using labeled data which are annotated by humans. Furthermore, automatic evaluation metrics can be classified into matching, regression, ranking, and generation according to the training task. Below, we define these metric types and summarize respective popular metrics found in our taxonomy, shown in
Figure 1.
2.1. Matching
Matching-based evaluation metrics measure token or character-level similarity between the machine translation output and the correct translation.
Studies on this include BERT
score [
18] and Y
iS
i [
19].
2.2. Regression
Regression is modeling the relationship between a scalar response and one or more explanatory variables. In the automatic evaluation metric research, it uses the translation score annotated by humans for prediction. Research on this includes BLEURT, COMET [
20], etc.
2.3. Ranking
The evaluation of machine translation can also be thought of as a ranking or rating. Supervised ranking learns to assign higher scores to better machine translation output than poor quality output. COMET is a representative study in ranking.
2.4. Generation
We formulate evaluating generated text as a text generation task from pre-trained language models. The basic concept is that a high-quality hypothesis will be easily generated based on source or reference text, or vice versa [
21]. In the case of the BART
score [
21], the evaluation proceeds through the likelihood between the machine translation output (generated sentence) and the correct translation using the parameters of the generative model BART [
14].
We survey the trends of each metric based on this taxonomy and describe the advantages and disadvantages.
3. Lexical-Based Metric
Lexical-based metrics are a type of evaluation metrics used in the field of NMT. They are based on the comparison of the lexical items (e.g., words or phrases) in the hypothesis with those in a reference translation. Metrics such as BLEU and METEOR are examples of lexical-based metrics that have been widely used in NMT evaluations. These metrics are designed to measure the overlap between the hypothesis and the reference translation, taking into account both the precision and recall of the lexical items.
In recent years, lexical-based metrics have widely been used to evaluate the quality of NMT systems, due to their simplicity, fast computation, and ability to provide a quick assessment of the translation quality. However, they have also been criticized for their limitations in capturing the overall meaning and fluency of the hypothesis [
22].
3.1. Word-Based
3.1.1. BLEU
Bilingual evaluation understudy (BLEU) is an automatic evaluation metric used to measure the similarity of the hypothesis to the reference [
4]. BLEU measures both adequacy by looking at word precision and fluency by calculating
n-gram precision for
n [
2].
BLEU is calculated through three factors: (1) n-gram-based precision of the machine translation output and the reference translation, (2) brevity penalty (BP) to prevent overfitting of sentence length, and (3) clipping for calibration of continuous word appearance.
Precision is calculated by dividing the number of matching
n-grams by the number of total
n-grams. The formula for precision
is as follows:
BLEU counts the maximum frequency of
n-gram matches. To avoid counting the same word (
n-gram) multiple times, BLEU clips the match count for the n-gram by the largest count measured in any single reference. The formula for a clipped count is expressed as
The minimum of this maximum count and the original count is referred to as the clipped count, which is no greater than the original count. BLEU uses this clipped count in place of the original count for computing the modified precision.
BP is used to reduce the influence of sentence length on the BLEU score. It is applied when the sentence length of the reference
is shorter than the sentence length of the hypothesis
. The formulas for BP and BLEU are as follows:
In the above Formula (4), and represent the precision and weight of the nth gram, respectively. The BLEU score is calculated by summing the weight and precision and finally multiplying by BP.
The BLEU metric is a widely used evaluation method for machine translation models. It is a simple and straightforward method to evaluate the quality of hypothesis, as it requires minimal human intervention. BLEU is used to evaluate the fluency and appropriateness of the hypothesis, similar to human evaluation. It has been widely used in multiple tasks, including decoding and ancient language translation [
23,
24].
However, the BLEU metric has some limitations. It only uses n-gram precision, not recall, and the results can vary depending on the number of references. The use of precision only has limitations in evaluating the hypothesis. BLEU only considers exact word matching and cannot count stems or synonyms, making it difficult to evaluate the translation of a language with various morphological expressions. It also does not reflect the meaning and sentence structure of the translation result. These limitations have led to the development of various variants of BLEU in various fields.
3.1.2. NIST
BLEU does not reflect the sentence information, and there is a limit to giving the same weight. The National Institute of Standards and Technology (NIST) [
5] metric calculates similarity by weighting matching
n-grams based on sentence information.
In the BLEU n-gram calculation method, all ordered pairs are calculated with the same weight, but in the NIST metric, higher weights are given to ordered pairs that do not appear frequently. This is because n-gram ordered pairs that appear less frequently contain more information than regular n-gram ordered pairs.
The weighted information gain is calculated as follows for
n-gram words
:
Like BLEU, NIST is easily affected by the short hypothesis sentence length. Therefore, the BP of BLEU is modified. Finally, using the corrected BP and information gain, the NIST metric score is calculated as follows:
Here, is chosen so that the brevity penalty factor = 0.5 when the number of words in the hypothesis is of the average number of words in the reference. means the average number of words in the reference.
3.1.3. WER
Word error rate (WER) [
25] has been used as a quality evaluation tool in speech recognition and machine translation field [
26]. WER measures the edit distance between machine translation output and the reference translation. Edit distance refers to the minimum number of operations required to modify or convert one word to another, based on which two word units are calculated:
The number of words substitution, insertion, and deletion between hypothesis and reference is indicated as a percentage.
The initial WER edit distance computation incurs several problems. It penalizes word-changing sentences or words. The omitted sentences “Long live the king” and “The king live long” cause confusion in deletion or insertion. In addition, it is impossible to compute word transformation by word-based calculations. Several variants overcome these limitations. Snover et al. [
6] proposed the translation edit rate (TER), which further introduces the editing step—a moving action/block action.
3.1.4. TER
The translation edit rate (TER) [
6] is a widely used metric that measures the accuracy of machine translation by comparing it to a reference translation. It calculates the minimum number of editing operations required to align the hypothesis with the reference. The editing operations include shift, substitution, deletion, and insertion. The TER metric is expressed as the ratio of the number of edits to the average number of words in the reference.
The TER formula is calculated as the number of editing operations (shift, substitution, deletion, and insertion) divided by the average number of words in the reference:
Despite being the widely used metric, TER has several shortcomings that limit its ability to accurately evaluate machine translation performance. TER only focuses on word-level matching and ignores the semantic similarity between the translation and reference. This means that even if the translation is semantically correct, it may still receive a low score if the words do not match exactly. Additionally, TER does not measure the fluency of the translation and only looks at the word-level matching. This means that a machine translation system that produces translations that are grammatically correct but unnatural may still receive a high score.
3.1.5. GTM
General text matcher (GTM) [
27] is a metric that evaluates the quality of a hypothesis (generated text) against a reference text by counting the number of matching words. This metric is based on the precision, recall, and F-score, which is the harmonic average of precision and recall.
GTM gives higher importance to consecutive sequences of words that match between the hypothesis and the reference. It accomplishes this through the concept of matching, which is defined as a mapping of words between the hypothesis and the reference. This metric considers the surface-form of the hypothesis and reference, ensuring that matching words are not counted twice.
In order to give additional weight to longer matching sequences, GTM uses
runs. A run is a continuous sequence of matching words (
n-grams) that are given a reward in the form of weight. The size of the matching, denoted as
, is calculated using the weights of its runs. This calculation is done through the equation:
where
run is each a run in the matching
.
e is a variable number. As
e increases, the weight lasts longer. There can be multiple match sizes between hypothesis and reference. GTM uses a maximum match size (MMS). Finally, the F-score is used by calculating the precision and recall through MMS.
GTM shows a higher correlation with human judgment than BLEU and NIST by using F-score and recall, which were not used in previous studies. The F-score has the advantage of being more familiar and easy to understand.
3.1.6. METEOR
The metric for evaluation of translation with explicit ordering (METEOR) [
7] is a metric designed to address the limitations of BLEU, which is a commonly used evaluation metric for machine translation. BLEU relies on n-gram matching, where it counts the number of overlapping n-grams between the machine-generated translation and the reference translation. However, this approach has several shortcomings. For instance, BLEU does not consider the stems and synonyms of words, meaning that it does not match “running” and “runs”, as they are not counted as the same word in the n-gram matching process. Additionally, BLEU does not use recall, which results in short sentences being penalized.
To overcome these limitations, METEOR uses a weighted F-score and a penalty function that has been modified to take into account precision and recall. The algorithm starts by aligning the hypothesis and the reference to find the longest matching word
chunk. During this alignment process, synonyms (usually obtained from a thesaurus or a large external corpus) are considered so that words with the same meaning are treated as the same word. This helps to account for morphological variants and other nuances that would otherwise be lost when comparing different translations. Precision (
P) and recall (
R) are then calculated based on the number of matched unigrams, where unigrams are single words. The F-score is calculated as the harmonic mean of precision and recall:
Next, the metric calculates the penalty function, which aims to reduce the impact of short contiguous matches, and thus, reward longer contiguous matches. The number of chunks, which are contiguous groups of matching words, is limited to penalize short matches and reward longer matches. Finally, METEOR is calculated as the F-score multiplied by (1-penalty):
One of the key advantages of METEOR over BLEU is that it considers the stem and synonyms of words, and also takes into account word inflection through alignment. This means that METEOR is better able to capture the semantic similarity between the machine-generated translation and the reference translation, which is difficult to evaluate in BLEU. Furthermore, METEOR alleviates the problems of the BLEU penalization of short sentences by incorporating recall, F-score, and penalty functions. Empirical studies have shown that METEOR has a higher correlation with human judgment than BLEU at the sentence level [
28].
3.2. Character-Based
chrF
Character n-gram F-score (
chrF) [
29] measures character n-gram overlap instead of word n-grams as in BLEU.
chrF uses the F-score that combines character n-gram precision (ChrP) as precision and character n-gram recall (ChrR) as recall. ChrP represents the percentage of character n-grams of matching hypothesis for reference, while ChrR represents the percentage of n-grams per character of the reference for the hypothesis. Finally,
chrF computes the F-score using ChrP and ChrR; it calculates the overlap between hypothesis and reference on character units, so it is not scarcely affected by the tokenization method. Therefore, it is effective in languages that have meaning in character units, such as Chinese, Japanese, and Korean.
chrF shows effective performance for languages in which stem and morpheme errors occur.
chrF showed a higher correlation with human judgment than BLEU in WMT19 [
30].
4. Embedding Based Metric
Embedding-based metric captures the similarity between hypothesis and reference using the embedding of language models. After the language model was studied [
13,
31], the metrics using it showed a high correlation with human judgment. In general, lexical-based metric depends on surface level matches for the similarity between hypothesis and reference. Some metrics consider synonyms, but most lexical-based metric cannot consider synonyms and can only measure lexical similarity. It means these metrics cannot capture the semantics in sentences. On the other hand, embedding-based metric measures similarity using embedding after representing the sentence form as a latent space rather than comparing the word or sentence as it is. It can consider semantic similarity in words and sentence. Accordingly, it has a higher correlation with human evaluation than lexical-based metric in general (see
Section 7.1.2). However, the disadvantage is that the evaluation speed is slower than lexical-based metric, and there is a need for training models. Additionally, it can support multiple languages depending on the underlying model, but it is difficult to use for low-resourced languages or specific domains. We classify embedding-based metric into word embedding and contextual embedding according to the representation training method.
4.1. Word Embedding
Word embedding refers to a dense, distributed, fixed-length word vector constructed using word co-occurrence statistics according to the distributional hypothesis [
32]. Word embedding usually uses fixed vectors, which cannot change under different contexts. Representative studies include Word2Vec [
33] and Glove [
34]. It is possible to capture the similarity between synonyms or words that have not been considered before using word embedding. For example, ‘refrigerator’ and ‘icebox’ can be considered synonymous and of greater similarity to ‘oven’ than to ‘car’. In this section, we analyze the metric that measures the sentence similarity between the hypothesis and the reference using this method.
MEANT
MEANT is the metric used to evaluate the quality of machine translation.
MEANT was introduced by Lo and Wu [
35] and is based on the idea that the most important aspect of a machine translation is its ability to convey the intended meaning of the source text.
The MEANT metric uses semantic role labeling (SRL) to analyze the structure and meaning of the sentence. SRL, also known as shallow semantic parsing or slot-filling, labels words or phrases in a sentence that represent a semantic role. These labels follow a semantic analysis of the sentence and enable such questions as “who did what to whom” to be answered.
MEANT is calculated by combining the scores obtained from semantic role labeling, lexical similarity, and role filler estimation. The process starts by using a shallow semantic parser to analyze both the machine translation output and the reference sentence. Then, the semantic frame is aligned using maximum weighted bipartite matching based on the lexical similarity of the predicate. The lexical similarity and role filler are estimated using word embeddings. Finally, the weighted F-score is calculated by matching the role label and role filler.
There have been follow-up studies to
MEANT, including modified or enhanced versions, such as
MEANT 2.0 [
36]. This version measures the importance of each word through inverse document frequency and gives higher scores to phrases that match more content words than function words. It also modifies the syntax similarity calculation to account for word order by calculating n-gram lexical similarities instead of bag-of-words of phrases.
MEANT is a valuable metric for evaluating machine translations, as it focuses on the meaning and structure of the sentence, rather than just the surface-level grammar and syntax. Additionally, note that the quality of the SRL parser can significantly impact the quality of the MEANT metric.
4.2. Contextual Embedding
Contextual embedding is a type of embedding used in machine translation metrics to capture the context and relationships between words in a sentence. It is a more sophisticated approach than traditional word embeddings, which only consider the meaning of individual words. Contextual embeddings, on the other hand, take into account the surrounding words and the relationships between them, providing a more nuanced understanding of the meaning of a sentence.
Representative research in this area includes the use of Transformer models, such as BERT [
13] and ELMo [
31], which have shown to perform well in a variety of NLP tasks, including machine translation. These models are trained on massive amounts of text data and generate a vector representation of each word, capturing the context and relationships between words in a sentence. The representations generated by these models have been used to improve machine translation metrics by capturing the contextual relationships between words, providing a more nuanced understanding of the meaning of the translation. Therefore, automatic evaluation metrics using contextual embeddings showed a higher correlation with human judgment based on a deeper understanding of language [
15,
16,
30]. It reflects semantic similarity by considering the context rather than lexical matching [
37].
4.2.1. YiSi
Y
iS
i [
19] is a quality evaluation metric for neural machine translation. It is designed to assess the quality of machine translations in low-resource languages, monolingual languages, and cross-lingual languages. The Y
iS
i metric has three variants: Y
iS
i-0, Y
iS
i-1, and Y
iS
i-2.
YiSi-0 is a resource-free variant of YiSi, and it evaluates the lexical similarity between the machine translation output and the reference using the longest common character substring accuracy. It uses the inverse-document-frequency of words in the reference to estimate the lexical weight of words in the translation and reference.
YiSi-1 is a monolingual variant of YiSi and it requires an embedding model to evaluate lexical semantic similarity and optional access to a semantic role labeller for evaluating the structural semantic similarity. The lexical semantic similarity is computed using cosine similarity of the embeddings from the lexical representation model.
YiSi-2 is a cross-lingual variant of YiSi, and it requires a cross-lingual embedding model for evaluating the cross-lingual lexical semantic similarity and optional access to semantic role labelers in both the input and output languages for evaluating structural semantic similarity. The lexical semantic similarity is computed using the cosine similarity of the cross-lingual lexical representation model.
In the WMT 2018 metrics shared task, YiSi-1 used word2vec to evaluate lexical semantic similarity. However, this approach has limitations, as it provides the same embedding representation for the same word without considering the context of different sentences. To overcome this, YiSi-1 now uses BERT to evaluate lexical semantic similarity. BERT uses a bidirectional transformer encoder to capture the sentence context in the output embeddings and provides a better representation of the same word in different sentences. BERT models with different layers are used for different languages and to represent different elements in the reference and machine translation output.
4.2.2. BERTscore
BERT
score [
18] compares the hypothesis and reference statements of the translator using features extracted by BERT [
13] that is trained for the masked language model and next sentence prediction. BERT
score uses token embeddings of the pre-trained BERT. This evaluation metric computes the cosine similarity between the tokenized
of machine translation output
h and the tokenized
of reference
r. To find the maximizing similarity score, greedy matching is used. BERT
score exhibits precision, recall, and F1-score as a final output. The scoring method is estimated using Equation (
13):
There are several types of BERT models, including BERT-base, BERT-large, and multilingual BERT models. BERTscore can also be used with multilingual models, making it a versatile evaluation metric for tasks that involve text in multiple languages. This feature allows researchers to evaluate the performance of their models on different languages, making it a useful tool for cross-lingual NLP tasks.
BLEU, which uses n-gram-based word matching, cannot consider synonymous or closer-meaning words. On the contrary, BERT is a deeply bidirectional language model. BERTscore can measure the similarity of words by considering the context. BERTscore shows a high correlation with human evaluation by calculating the similarity.
4.2.3. BARTscore
Existing evaluation metrics based on contextual embeddings utilize encoder layers trained to extract suitable representations for natural language understanding. As a result, there is a mismatch between the machine translation metric, which evaluates text generation, and the pre-training objective of extracting language representations. In other words, these methods do not account for text generation probabilities. In contrast, BART
score [
21] is a generation metric that utilizes the encoder–decoder structure of BART [
14] to mitigate this discrepancy between the objective and the sentence generation task. BART is trained using a denoising objective, making BART
score well suited for evaluating conditional generation tasks. BART
score calculates the weighted log probability of the reference sentence
r with respect to the hypothesis sentence
h using the pre-trained BART weights
. Specifically, the BART score is obtained by summing up the conditional log probabilities of each token in the hypothesis sentence
, considering the token-specific weight
w. This estimate indicates the likelihood that the hypothesis sentence would be generated from the source sentence. The scoring method is formulated in Equation (
14):
BART
score offers the advantage of providing an accurate evaluation of sentence generation by considering various evaluation factors and all the weights of BART. For example, the performance can be evaluated using the likelihood
between the hypothesis sentence
h and the source sentence
s. Furthermore, BART
score provides F-score, precision, and recall as alternative evaluations and can lead to further performance improvements through fine-tuning with CNNDM [
38], which is annotated by human, or prompt-based learning.
However, BARTscore has a higher computational complexity compared to previous automatic evaluation metrics due to its use of all weights of BART and its auto-regressive calculation of the probability of each token occurrence.
5. Supervised Metric
The supervised-metric refers to a metric trained by machine learning or deep learning using labeled data. In general, labeled data are the WMT Direct Assessment (DA) dataset, a human judgment for machine translation output. Most of them use regression models. Because it trains the score evaluated by the human, it shows a higher correlation with human evaluation than other metrics.
However, the supervised-metric requires a dataset containing human-annotated translation quality scores. It is hard to adapt to low-resource languages. We discuss this problem in
Section 7.3.
5.1. BEER
Better evaluation as ranking (BEER) [
39] is an automated metric based on supervised learning. It trains translation quality scores using labeled data to increase the resemblance to human ranking.
BEER computes word-based similarity using precision, recall, and F-score using n-gram pairs as input. It also uses a permutation tree to measure word order and fluency from input sentences. Unigram statistics are calculated for each word pair, function words, and content words of the entire sentence denoted as
where
h is the hypothesis sentence and
r is the reference sentence. The regression score is calculated by multiplying each feature
by weight to predict the translation quality score of human evaluation. This linear regression model uses machine translation quality scores evaluated by human raters in WMT13 [
40].
5.2. BLEND
BLEND [
41] is used to combine multiple untrained metrics. The use of different metrics can measure the similarity between a hypothesis and a reference from various perspectives. A total of 57 metric scores and DA evaluated by a human annotator were used as features. The DA score of WMT15 [
10] and WMT16 [
11] was used as a gold standard target. It is trained through an SVM regressor using 57 metrics as features to predict human evaluation scores. The 57 metrics are divided into three categories: lexical, syntactic, and semantic. In other words, it evaluates machine translation quality from various perspectives. Ma et al. [
41] performed an ablation study to analyze the contribution of each category and confirmed that a combination of metrics from several categories achieves the best performance. This method of combining multiple evaluation metrics influenced NUBIA [
42] (see
Section 5.6).
5.3. RUSE
Regressor using sentence embeddings (RUSE) [
43] uses a multi-layer perceptron (MLP)-based regression architecture with three types of pre-trained sentence embeddings. This metric uses InferSent [
44], Quick-Thought [
45], and UniversalSentEncoder [
46]. The three types of sentence embeddings are combined in Equation (
16) as follows:
In Equation (
16),
and
denote hypothesis and reference sentence, respectively.
refers to concatenation,
is absolute element-wise difference, and
indicates element-wise product. Those three types of sentence embeddings are fed into the MLP-Regressor and output the RUSE score.
The MLP-regressors were trained using pre-trained models and human annotations from 2015 to 2017 in the WMT shared task. RUSE is capable of considering the meaning of sentences in a more comprehensive manner than n-gram-based metrics and the MLP-regressors have shown a high correlation with human evaluation.
5.4. BERT for MTE
BERT for MTE [
47] is a metric for automatic machine translation evaluation (MTE) that uses BERT for estimating the evaluation score. Unlike the previous metric RUSE [
43], BERT for MTE uses a sentence-pair encoder to simultaneously encode both the hypothesis and reference translation, and the pre-trained encoder is also fine-tuned with a regression model based on MLP.
BERT is pre-trained using two unsupervised tasks, masked language model (MLM) and next sentence prediction (NSP), on large amounts of raw text, allowing the BERT encoder to learn the relationship between tokens in a sentence and the relationship between two consecutive sentences. The sentence-pair encoding in BERT involves encoding sentence pairs simultaneously, using the special classification token ([CLS]) and end-of-sentence token ([SEP]). The final hidden state corresponding to the [CLS] token is used as the aggregate sequence representation for classification tasks.
In the case of BERT for MTE, after obtaining the sentence-pair embedding, it is used as an input to the regression model based on MLP to solve the MTE task. The pre-trained encoder is also fine-tuned with labeled data of the MTE task. As shown in Equation (
17), hypothesis
h and reference
r are embedded to calculate
. The MLP regressor is trained using [
] of the embedding vector
denoted
:
By using BERT for MTE, the metric is capable of capturing the similarity between the hypothesis and reference, as BERT is designed to pre-train for the task of estimating the similarity between sentence pairs. BERT for MTE has a higher correlation with human evaluations than RUSE and achieved the best performance in the WMT17 [
12] dataset for all to-English language pairs [
47].
5.5. BLEURT
BLEURT [
48] is a pre-trained model with a BERT structure using multi-task loss on synthetic data of a large number of references. It is a sentence-level metric that learns prediction scores that explain the similarity between the hypothesis and references.
BLEURT is designed with a metric optimized for multi-domain NLG evaluation, giving diversity to the reference sentence set. It is intended to be robust in the domain, data, and quality drift and targeted pre-training for generation tasks. To predict the noise generated in the generation task, the sentence pairs between the hypothesis and the reference are exposed in various ways by mask filling, back-translation, and dropping words. Mask filling involves randomly replacing a word in a sentence with a mask symbol, such as [MASK], and then training the model to predict the correct word. Back-translation involves translating a sentence from its original language to another language, and then translating it back. Finally, dropping words involves randomly deleting words from a sentence and then training the model to predict the words that were dropped. By combining these techniques, BLEURT multi-task learning is able to generate better results than using a single technique.
The main purpose of BLEURT is to train regression models to predict human ratings. By entering the sequence of reference
and model hypothesis
into the BERT, we obtain the
token’s contextualized vector
:
Using
, it trains a regression function
f to predict the human rating score
:
BLEURT obtained state-of-the-art results from the WMT20 Metrics Shared Task [
15]. However, one of the shortcomings of the BLEURT metric is its reliance on large amounts of training data. This means that it may not perform well in cases where limited training data are available, or when it is applied to languages that are under-represented in the training data. This limitation can result in a lack of accuracy and consistency in the evaluation results.
5.6. NUBIA
NUBIA [
42] is a regression-based metric. It is inspired by BLEND, which uses a combination of multiple metrics, and BEER uses the regression model.
NUBIA uses a combination of three modules for translation evaluation: a neural feature extractor, an aggregator and a calibrator.
The neural feature extractor uses semantic similarity, logical entailment, and sentence intelligibility from the language model to extract the machine translation outputs and the features of the correct translation. For semantic similarity, to evaluate how semantically similar the hypothesis and reference are, the pre-trained language model was fine-tuned on the semantic textual similarity (STS-B) dataset. The purpose of this dataset is evaluating the degree of semantic similarity between two sentences. The logical entailment was fine-tuned to the multi-genre natural language inference (MNLI) [
49]. This dataset contains two sentences (premise and hypothesis). With these sentences, the model is trained to classify the two relationships as entailment, contradiction, and neutral. The model trained on this dataset captures the logical relationship between the hypothesis and the reference. Sentence intelligibility is used to capture the linguistic applicability of a hypothesis. The perplexity score of GPT-2 [
50] was used to measure the legible and grammatical correctness of the hypothesis. The aggregator is trained as the regression model to predict the human evaluation of hypotheses and references to convert the values output by the language model into numerical scores. The calibrator module finally normalizes and limits the maximum value so that the evaluation result is between 0 and 1.
5.7. COMET
Cross-lingual optimized metric for evaluation of translation (COMET) [
20] is an evaluation method for multilingual machine translation using ranking and regression. COMET consists of an estimator and translation ranking model based on human determination. It uses a dual cross-lingual modeling scheme for the input of the encoder. The dual cross-lingual modeling demonstrates exemplary performance in multi-lingual machine translation evaluation because it considers both the input source and target sentence.
To imitate human evaluation, COMET uses different training objectives. The estimator learns to regress the quality score of machine translation directly. The translation ranking model learns by minimizing the distance between ‘good’ machine translation outputs and reference translation (or input source sentences) and maximizing the distance between inferior quality machine translation outputs and reference translation. Finally, both models consist of cross-lingual encoders.
The estimator follows Equation (
20). Combined features are concatenated to reference embedding
r and hypothesis embedding
h for input
x. The estimator is then trained using mean squared error loss to minimize the error between the predicted score and quality assessment:
The equations for the translation ranking model are denoted as Equations (
21)–(
23). As an input,
where
denotes a hypothesis ranked higher than the hypothesis using
.
after passing through the cross-lingual encoder, we obtain triplet margin loss [
51] for source and reference.
refers to the Euclidean distance between
u and
v. Additionally,
means margin:
where
With the advancement of deep learning, machine translation results are generated not just through simple word substitution, but by a deeper understanding of language. Therefore, evaluating the translation results should also consider the meaning and linguistic understanding between the machine translation outputs and the human-annotated translation, not just the overlapping of words. To solve this problem, COMET can evaluate the quality of machine translation based on an understanding of multiple languages through a cross-lingual encoder, showing a high correlation with human evaluation.
6. Evaluation of MT Metrics
In this section, the focus is on methods for evaluating the performance and validity of metrics. The main objective is to determine the ability of an automatic evaluation metric to imitate or substitute human evaluation. The most commonly used approach to achieve this goal is to compare the correlation between human evaluation and the metric score that assesses the produced translation results. However, metric scores often have varying scales and are not easily understandable by humans. To address this, the correlation between each metric score and human evaluation score is analyzed. The section outlines various techniques for determining this correlation.
6.1. Pearson Correlation Coefficient
The Pearson correlation coefficient is the most basic method for confirming the correlation between two continuous variables: confirming whether the two numerical values are related to each other, assuming that a set of two numerical values is given and that the numerical values are linked for each ordered pair
. This assumes that the combination of the two variables is a normal distribution and that the two variables have a linear relationship. The Pearson correlation coefficient
is defined as follows:
The value of the Pearson correlation coefficient ranges from +1 to −1. The correlation coefficient is +1 if each ordered pair is exactly same, 0 if they are completely different, and −1 if they are exactly the same in the opposite direction.
6.2. Spearman’s Correlation Coefficient
Spearman’s correlation coefficient computes a monotonic relationship regardless of whether the two variables are linear or not. The Spearman correlation between two variables is the same as the Pearson correlation calculated by rank. When
is given, Spearman’s correlation coefficient
is defined as follows:
where
and
represent the rank in
x and
y, respectively. Like the Pearson correlation coefficient, it has a value from −1 to +1.
6.3. Kendall’s Coefficient
Kendall’s
coefficient is a type of rank correlation coefficient and calculates the correlation by comparing the ranks between the two variables. This computes the number of concordant and discordant pairs of the ordered pair
. Kendall’s
coefficient is defined as follows:
The Pearson correlation coefficient is an inaccurate measurement when the variable does not follow a normal distribution. Kendall’s can improve on these weaknesses.
7. Experiment
The experiment being proposed is crucial in determining the effectiveness of different machine translation metrics in capturing semantic similarity. This is important because the accuracy and quality of a machine translation system heavily depend on the ability of the system to correctly translate the meaning of a source text into the target language [
52]. In order to evaluate the performance of machine translation systems, a reliable and consistent evaluation metric is needed.
The use of lexical-based metrics such as BLEU and METEOR has been widespread in the field of machine translation. However, these metrics have been criticized for not being able to capture the semantic similarity between the source and target texts. For example, Zhang et al. [
53] showed that it is challenging to identify the discrepancy between “Flights from New York to Florida” and “Flights from Florida to New York”. On the other hand, the recent development of transformer-based deep learning has resulted in the creation of metrics such as BLEURT and BERT score, which have shown high correlation with human judgment.
The STS-B dataset, which will be used in the proposed experiment, provides a benchmark for evaluating the semantic similarity between texts. This dataset is well suited for the experiment because it contains a large number of sentence pairs with human-annotated similarity scores. By comparing the performance of lexical-based, embedding-based, and supervised metrics on this dataset, we can determine which type of metric is most effective in capturing semantic similarity.
The WMT metric shared task, on the other hand, focuses on evaluating the performance of machine translation metrics on a large scale, comparing the metrics on a variety of language pairs and translation directions. This task provides a comprehensive overview of the current state of machine translation metrics, but it does not directly address the issue of semantic similarity.
Therefore, this experiment is necessary in the machine translation metric survey, as it provides a detailed evaluation of the effectiveness of lexical-based, embedding-based, and supervised metrics in capturing semantic similarity. It offers a unique perspective on machine translation metrics, complementing the comprehensive overview provided by the WMT metric shared task.
7.1. Experiment Setting
7.1.1. Dataset
The sentence text similarity benchmark (STS-B) is one of the datasets in the general language understanding evaluation (GLEU) [
54] benchmark. The STS-B dataset contains sentence pairs in English, and the task is to predict the semantic similarity between the two sentences on a scale from 0 to 5. The goal of this task is to evaluate the ability of a model to understand the semantic meaning of sentences and to compare the similarity between them.
The label information for STS-B is a real-valued score between 0 and 5, where 0 represents completely dissimilar sentences, and 5 represents completely similar sentences. The score reflects the level of semantic similarity between the two sentences, as annotated by human evaluators. The label distribution of the STS-B dataset is relatively balanced, with the majority of sentence pairs having a score of 3 to 4 [
54]. This allows for the evaluation of models on both high and low similarity sentences, which is important in real-world applications where the similarity between sentences can vary greatly.
The STS-B dataset contains a total of 7551 sentence pairs, the training set consists of 5749 sentence pairs, the validation set consists of 1176 sentence pairs, and the test set consists of 626 sentence pairs. For the purpose of our experiment, we combined the validation set and test set. It containing 1802 examples.
Overall, the STS-B task in the GLUE benchmark is a useful evaluation metric for evaluating the semantic understanding of language models and their ability to compare the similarity of sentences. This dataset is utilized to demonstrate that automatic evaluation metrics are capable of accurately measuring semantic similarity. For the experiment, we set sentence 1 as the hypothesis and sentence 2 as the reference. We perform min-max scaling on the label scores of the STS-B dataset.
7.1.2. Evaluation Metric
In this experiment, we selected representative metrics from the taxonomy for automatic evaluation. We selected the automatic evaluation metrics based on the following criteria: the metrics that showed high performance or were frequently used in the WMT metric shared tasks 17 to 21, and representative metrics from our metric taxonomy in
Figure 1. In lexical-based metric, we selected BLEU, NIST, METEOR, and
chrF. In embedding-based metric, BERT
score and BART
score were selected. In the supervised-metric, we selected BEER and BLEURT. In particular, we rejected NUBIA since it was trained on the same dataset as our experimental dataset. In addition, we excluded metrics with negative correlations or those that were no longer accessible to the pre-trained model.
This experiment was conducted based on open-source and the same experimental settings used in the WMT metric shared task [
12,
16]. For the experiment, we used BLEU which uses sentencepiece tokenization with case-insensitive and punctuation-insensitive tokenization, tokenization options = add-dummy-prefix, BLEU smoothing = exp, and n-gram order = 4. These parameters were chosen based on the results of the WMT 2019 Shared Task, which found that these values provided the best results. Additionally, precision and recall as components of the METEOR score were also used, with a weight of 0.5 for each.
chrF parameters are -nw 0 -b 3. The deep learning-based evaluation metric uses pre-trained models: RoBERTa-Large [
55] for BERT
score, BLEURT-Large for BLEURT, and BART-Large [
14] trained with the CNN dataset for BART
score. The detailed experimental environment and open source information are presented in
Table 2.
7.2. Results of Experiment
7.2.1. Quantitative Evaluation
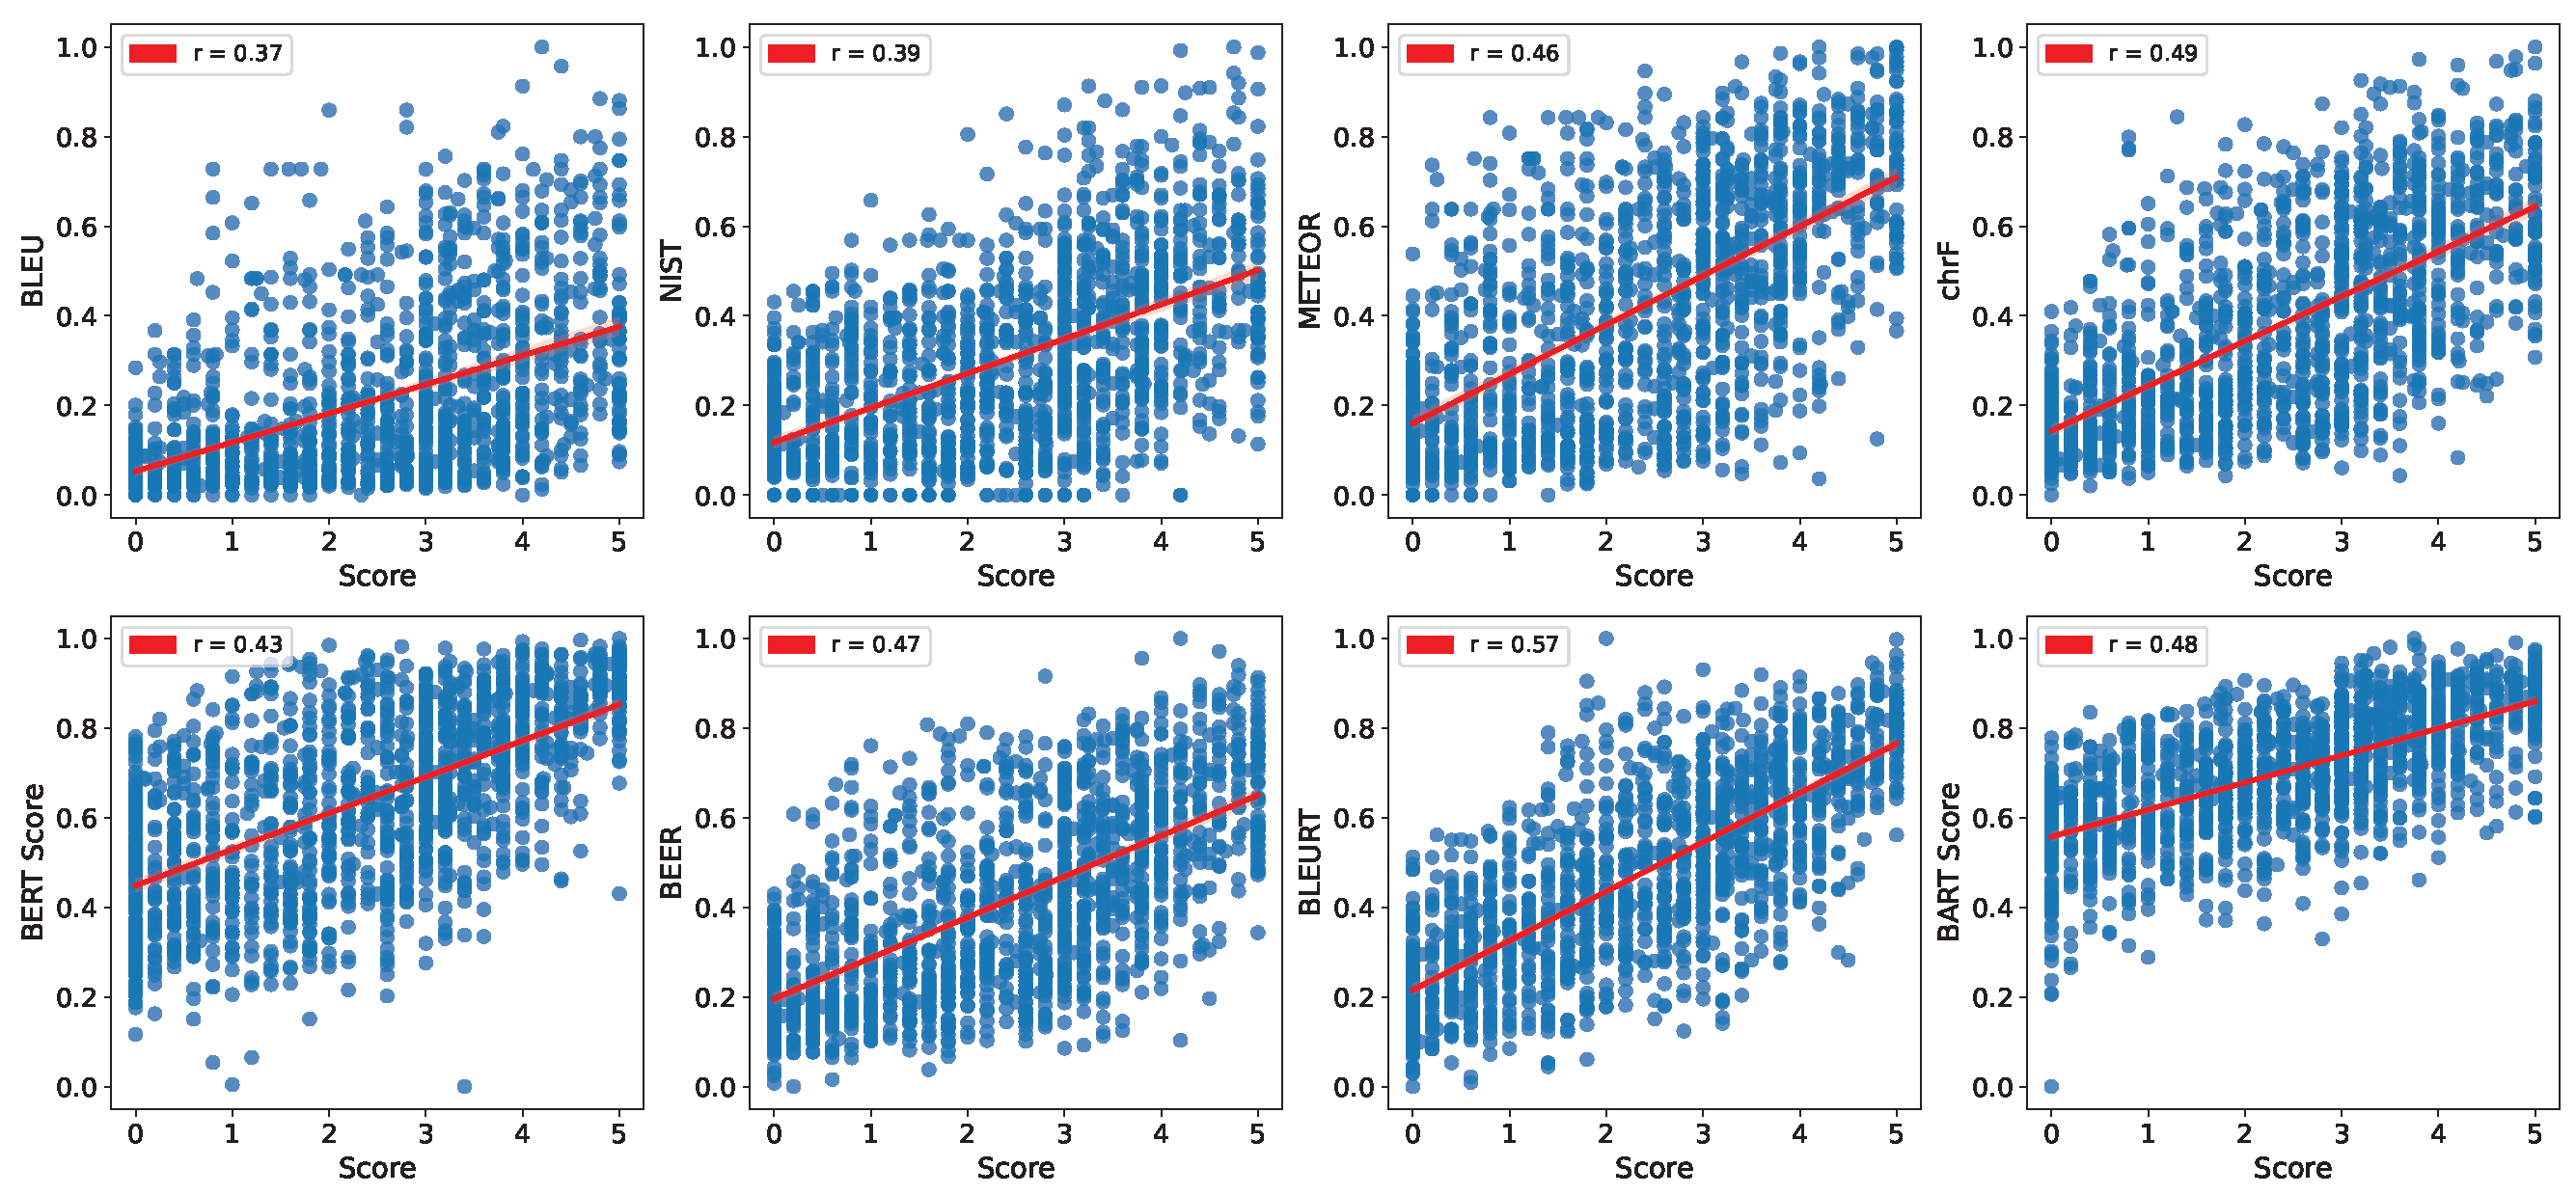
We conducted a quantitative evaluation to assess the correlation between similarity scores and automatic evaluation scores of two semantically equivalent sentences with different structures or words. We utilized Kendall’s
correlation coefficient for the correlation analysis, and the results are presented in
Table 3. The scatter plot with trend lines can be seen in
Figure 2.
A high correlation with human-annotated scores suggests that the metric is of good quality and accurately reflects the human quality scores. The highest correlation was observed between similarity scores and the BLEURT score, with a Kendall’s of 0.57. This suggests that BLEURT is the metric that most closely matches human judgments of semantic similarity. On the other hand, the lowest correlation was observed between similarity scores and the BLEU score, with a Kendall’s of 0.37, indicating that BLEU does not effectively capture semantic similarity.
Comparing the performance of different metrics, we found that METEOR showed the best correlation (0.46) among the word-based metrics in lexical-based metric. This is likely due to its consideration of stems and synonyms of words Banerjee and Lavie [
7]. Furthermore, it was demonstrated that
chrF shows the best performance among lexical-based metrics, surpassing the performance of some embedding-based metrics and supervised-metrics. The reason why the character-based (
chrF) metric shows higher correlation with human judgment compared to embedding-based metrics and supervised-metrics is likely due to its focus on individual characters rather than words or sub-word units. By considering the meaning of each character, the
chrF metric is able to capture the essence of the text, making it more representative of human understanding. Among the embedding-based metrics, the matching-based BERT
score shows a lower correlation scores compared to some lexical-based metrics. However, the generation-based BART
score metric shows the highest correlation among embedding-based metrics and a higher correlation score compared to some lexical-based metrics. In particular, BLEURT, which is a supervised-metric, showed the best overall performance, with a correlation of 0.57.
Our results suggest that supervised-metrics have a higher correlation with human-annotated scores compared to lexical-based metrics and embedding-based metrics. This difference in performance is due to the fact that supervised-metrics are trained on annotated data, allowing them to learn patterns and relationships between the hypothesis, reference, and human evaluations. As a result, supervised-metrics are better able to reflect human understanding and judgment, leading to higher correlation with human-annotated scores compared to lexical-based metrics and embedding-based metrics. However, it is noted that matching-based metrics may have limitations in capturing the full meaning of a sentence. The limitations of automated metric studies are discussed in
Section 7.3.
7.2.2. Qualitative Evaluation
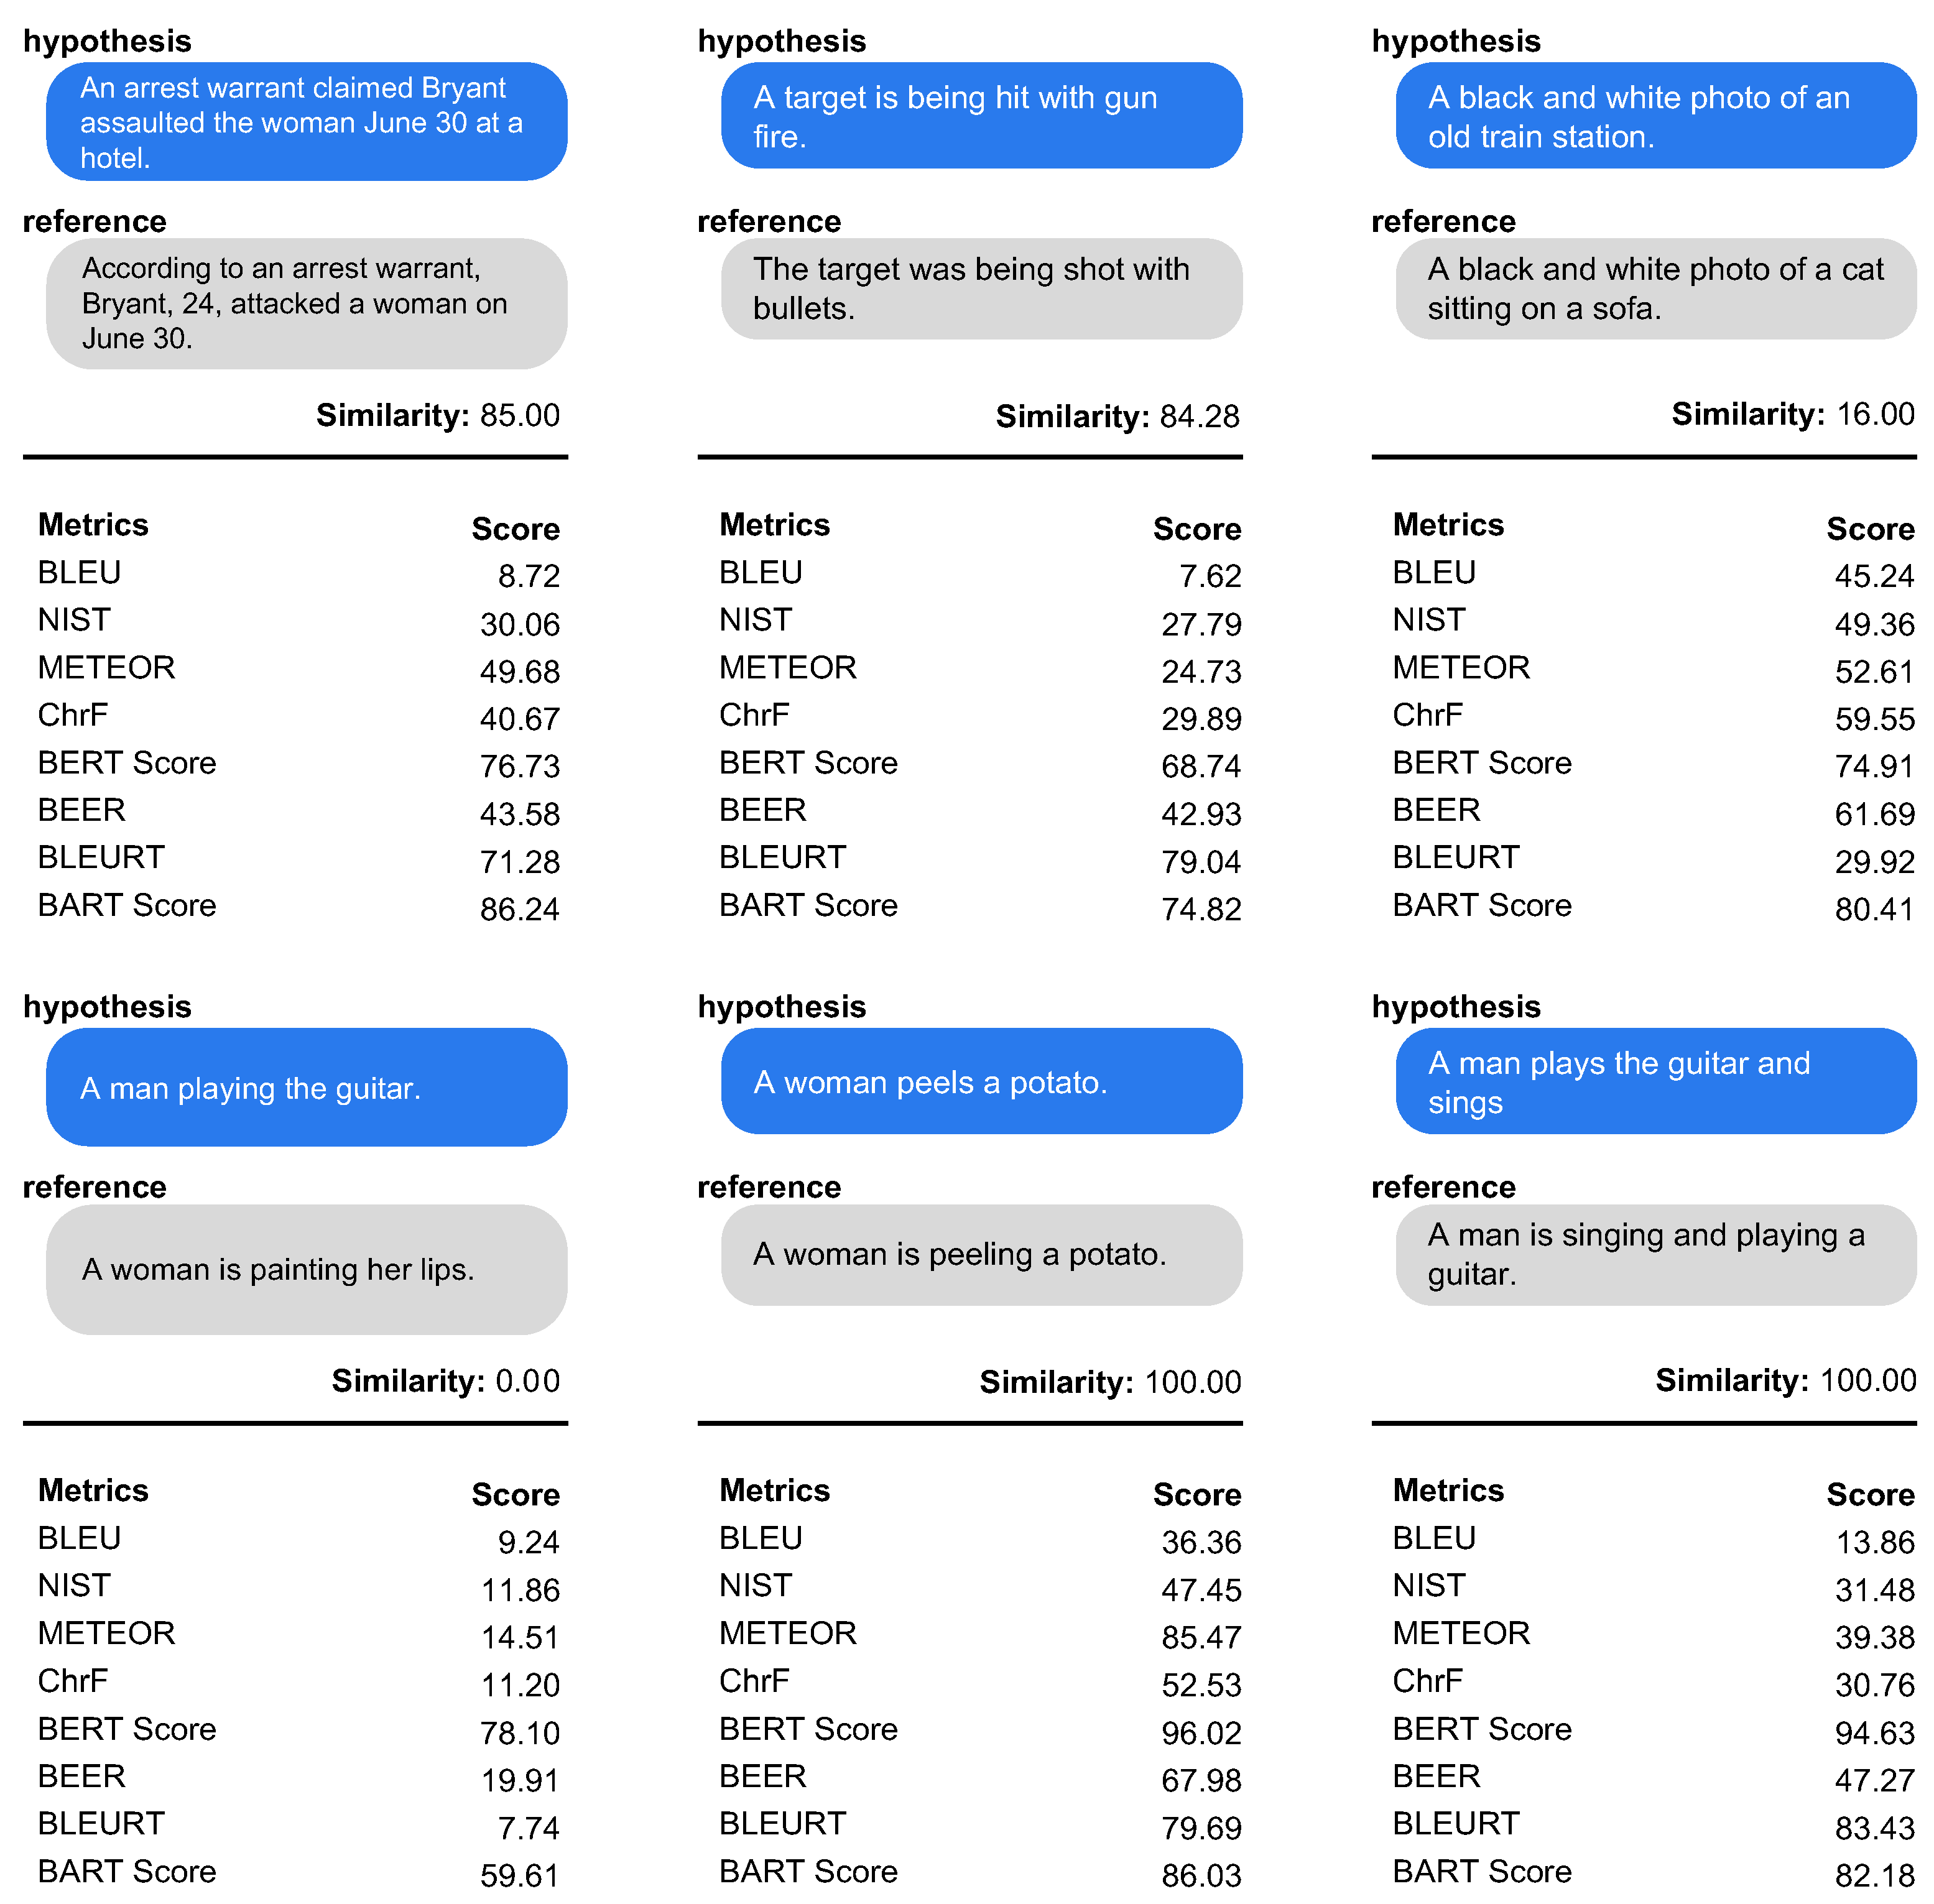
We select examples that can represent the performance of the automatic evaluation metric, then explain the qualitative analysis. The qualitative analysis result is shown in
Figure 3. All scores are normalized using a min-max scaler. In the case of the 1st example (left) of
Figure 3, the form and morphology of the two sentences are different. BERT
score, BLEURT, and BART
score show high similarity scores of 0.77, 0.71, and 0.86, respectively. On the other hand, lexical-based metric shows a low correlation. In the 2nd example, both sentence structure and meaning are similar. lexical-based metric cannot quite understand the similarity between the two sentences. The 3rd example in
Figure 3 is when the structure is similar but the meaning is completely changed. BLEU, METEOR,
chrF, BERT
score and BART
score have high scores. However, only BLEURT has low similarity. It means that BLEURT captures well the semantic similarity while being more robust to lexical changes than others. In the 4th example, it has a completely different meaning. BERT
score shows the lowest correlation due to the greedy matching. The 5th example is the case where the meaning is similar and there are stemming changes. METEOR, BERT
score and BART
score show a high correlation with stemming changes. In particular, METEOR shows higher correlation than BLEURT. It is possible that the training data used to create BLEURT did not cover the specific type of sentence being evaluated in this task. Additionally, the BLEURT training process may not have captured the exact relationship between the words in the two sentences being compared. The 6th example is similar in meaning, but the stemming and structure are different. METEOR shows low correlation. The low score of METEOR in the 6th example may have been caused by factors such as unigram precision, recall, or F1-score not being improved by lemmatization, or inaccurate synonymy or semantic similarity measurement by the METEOR metric. On the other hand, BERT
score and BART
score show robustness to stemming and structural change.
Summarizing, the embedding-based metric and supervised-metric show a higher correlation with human evaluation than lexical-based metric. Similar to the quantitative evaluation results, the lexical-based metric does not properly capture the meaning of the sentence. It is presumably due to the use of the trained model. Among all experimental models, BLEURT shows robustness to structural and lexical changes, and it captures the semantic similarity well.
7.3. Discussion
Experimental results show that the supervised-metric had the highest correlation with human evaluation, followed by the embedding-based metric and lexical-based metric. However, in contrast to the experimental results, why is the lexical-based metric type, such as BLEU, still frequently used?
Objective comparison with existing studies or conventional use may be the reasons, but our survey results suggest one more noteworthy point. The embedding-based metric or the supervised-metric, which generally show higher performance than the lexical-based metric, have several implementation prerequisites, including a pre-trained language model, human-labeled data, and additional training. This follows the difficulty in application to low-resource languages, where linguistic analysis tools rarely exist.
Conversely, lexical-based metrics are language-agnostic and require no additional data or training. However, as lexical-based metrics highly depend on word matching, they often fail to grasp the implied meaning between sentences and insufficiently represent translation evaluation.
The supervised-metric shows decent performance, but there is a problem that the pre-trained language model (PLM) or human-supervised training data are required; therefore, the performance of the metric heavily relies on the linguistic interpretability of the PLM used and the property of the training data. Dependency on the PLM or the supervised data also introduces the domain reliance problem, where the accurately translated results are evaluated as low quality because of the domain mismatch with the PLM used. Recent studies such as the WMT shared metric task also suggest that, consistent with our experimental results, the supervised-metric leads to superior performance [
15,
16,
30].
However, our study was conducted in a direction specialized for a high-resource languages (e.g., English–German [
48]); the applicability to other languages was not considered.
The polarization has grown to the point where the latest metrics that show such good performance cannot be applied to other languages. Reflecting on our analyses, we express concern about this polarized research direction and claim that universal metric studies (language agnostic or multilingual) should be conducted.
8. Conclusions
In this study, we surveyed machine translation evaluation metrics and analyzed the strengths and weaknesses of each metric. We classified the existing metrics into the lexical-based metric, embedding-based metric, and supervised-metric, according to learning status and methods and clarified the characteristics of each method. Additionally, we analyzed the prerequisites for applying each metric and objectively compared the performance of each metric through experiments with STS data. Through these analyses, we confirmed that the supervised-metric has the highest correlation with human evaluation and shows the best performance as an automatic metric but has limitations in that PLM and training data are required for the implementation. We pointed out that metric research that only improves performance can deepen the polarization between languages. Currently, the polarization has grown to the point where the latest metrics that show such good performance cannot be applied to other languages. From our study, we conclude that universal metric research should be conducted as a future study.
Author Contributions
Funding acquisition, H.L.; investigation, S.L. and S.E.; methodology, H.M.; project administration C.P. and J.S.; conceptualization, C.P. and S.K.; software, J.L. and C.P.; validation, S.E. and J.S.; formal analysis, S.L. and C.P.; writing—review and editing, C.P. and S.L.; supervision, H.L. and H.M.; project administration, J.S. and S.L.; data curation, S.K. All authors have read and agreed to the published version of the manuscript.
Funding
This research was supported by the Ministry of Science and ICT, Korea, under the Information Technology Research Center support program (IITP-2018-0-01405) supervised by the Institute for Information & Communications Technology Planning & Evaluation), and by the Basic Science Research Program through the National Research Foundation of Korea, funded by the Ministry of Education (NRF-2022R1A2C1007616).
Data Availability Statement
Not Applicable.
Acknowledgments
Many thanks to KU NMT Group for taking the time to proofread this article.
Conflicts of Interest
The authors declare no conflict of interest.
References
- Vaswani, A.; Shazeer, N.; Parmar, N.; Uszkoreit, J.; Jones, L.; Gomez, A.N.; Kaiser, Ł.; Polosukhin, I. Attention is all you need. In Proceedings of the 31st Conference on Neural Information Processing Systems (NIPS 2017), Long Beach, CA, USA, 4–9 December 2017; Volume 30. [Google Scholar]
- Lavie, A. Evaluating the Output of Machine Translation Systems. In Proceedings of the Machine Translation Summit XIII: Tutorial Abstracts, Xiamen, China, 19–23 September 2011. [Google Scholar]
- White, J.S.; O’Connell, T.A. Evaluation of machine translation. In Proceedings of the Human Language Technology: Proceedings of a Workshop, Plainsboro, NJ, USA, 21–24 March 1993. [Google Scholar]
- Papineni, K.; Roukos, S.; Ward, T.; Zhu, W.J. Bleu: A method for automatic evaluation of machine translation. In Proceedings of the 40th Annual Meeting of the Association for Computational Linguistics, Philadelphia, PA, USA, 7–12 July 2002; pp. 311–318. [Google Scholar]
- Doddington, G. Automatic evaluation of machine translation quality using n-gram co-occurrence statistics. In Proceedings of the Second International Conference on Human Language Technology Research, San Diego, CA, USA, 24–27 March 2002; pp. 138–145. [Google Scholar]
- Snover, M.; Dorr, B.; Schwartz, R.; Micciulla, L.; Makhoul, J. A study of translation edit rate with targeted human annotation. In Proceedings of the 7th Conference of the Association for Machine Translation in the Americas: Technical Papers, Cambridge, MA, USA, 8–12 August 2006; pp. 223–231. [Google Scholar]
- Banerjee, S.; Lavie, A. METEOR: An automatic metric for MT evaluation with improved correlation with human judgments. In Proceedings of the ACL Workshop on Intrinsic and Extrinsic Evaluation Measures for Machine Translation and/or Summarization, Ann Arbor, MI, USA, 29 June 2005; pp. 65–72. [Google Scholar]
- Tatman, R. Evaluating Text Output in NLP: BLEU at Your Own Risk. 2019. Available online: https://towardsdatascience.com/evaluating-text-output-in-nlp-bleu-at-your-own-risk-e8609665a213 (accessed on 14 February 2023).
- Macháček, M.; Bojar, O. Results of the WMT14 metrics shared task. In Proceedings of the Ninth Workshop on Statistical Machine Translation, Baltimore, MD, USA, 26–27 June 2014; pp. 293–301. [Google Scholar]
- Stanojević, M.; Kamran, A.; Koehn, P.; Bojar, O. Results of the WMT15 metrics shared task. In Proceedings of the Tenth Workshop on Statistical Machine Translation, Lisbon, Portugal, 17–18 September 2015; pp. 256–273. [Google Scholar]
- Bojar, O.; Graham, Y.; Kamran, A.; Stanojević, M. Results of the wmt16 metrics shared task. In Proceedings of the First Conference on Machine Translation: Volume 2, Shared Task Papers, Berlin, Germany, 11–12 August 2016; pp. 199–231. [Google Scholar]
- Bojar, O.; Graham, Y.; Kamran, A. Results of the WMT17 Metrics Shared Task. In Proceedings of the Second Conference on Machine Translation, Copenhagen, Denmark, 7–8 September 2017; Association for Computational Linguistics: Copenhagen, Denmark, 2017; pp. 489–513. [Google Scholar] [CrossRef]
- Devlin, J.; Chang, M.W.; Lee, K.; Toutanova, K. Bert: Pre-training of deep bidirectional transformers for language understanding. arXiv 2018, arXiv:1810.04805. [Google Scholar]
- Lewis, M.; Liu, Y.; Goyal, N.; Ghazvininejad, M.; Mohamed, A.; Levy, O.; Stoyanov, V.; Zettlemoyer, L. Bart: Denoising sequence-to-sequence pre-training for natural language generation, translation, and comprehension. arXiv 2019, arXiv:1910.13461. [Google Scholar]
- Mathur, N.; Wei, J.; Freitag, M.; Ma, Q.; Bojar, O. Results of the WMT20 metrics shared task. In Proceedings of the Fifth Conference on Machine Translation, Online, 19–20 November 2020; pp. 688–725. [Google Scholar]
- Freitag, M.; Rei, R.; Mathur, N.; Lo, C.k.; Stewart, C.; Foster, G.; Lavie, A.; Bojar, O. Results of the wmt21 metrics shared task: Evaluating metrics with expert-based human evaluations on ted and news domain. In Proceedings of the Sixth Conference on Machine Translation, Online, 10–11 November 2021; pp. 733–774. [Google Scholar]
- Park, C.; Park, K.; Moon, H.; Eo, S.; Lim, H. A study on performance improvement considering the balance between corpus in Neural Machine Translation. J. Korea Converg. Soc. 2021, 12, 23–29. [Google Scholar]
- Zhang, T.; Kishore, V.; Wu, F.; Weinberger, K.Q.; Artzi, Y. Bertscore: Evaluating text generation with bert. arXiv 2019, arXiv:1904.09675. [Google Scholar]
- Lo, C.k. YiSi-a unified semantic MT quality evaluation and estimation metric for languages with different levels of available resources. In Proceedings of the Fourth Conference on Machine Translation (Volume 2: Shared Task Papers, Day 1), Florence, Italy, 1–2 August 2019; pp. 507–513. [Google Scholar]
- Rei, R.; Stewart, C.; Farinha, A.C.; Lavie, A. COMET: A neural framework for MT evaluation. arXiv 2020, arXiv:2009.09025. [Google Scholar]
- Yuan, W.; Neubig, G.; Liu, P. Bartscore: Evaluating generated text as text generation. In Proceedings of the Thirty-Fifth Conference on Neural Information Processing Systems, Online, 6–14 December 2021; Volume 34. [Google Scholar]
- Sai, A.B.; Mohankumar, A.K.; Khapra, M.M. A survey of evaluation metrics used for NLG systems. ACM Comput. Surv. (CSUR) 2022, 55, 1–39. [Google Scholar] [CrossRef]
- Park, C.; Yang, Y.; Park, K.; Lim, H. Decoding strategies for improving low-resource machine translation. Electronics 2020, 9, 1562. [Google Scholar] [CrossRef]
- Park, C.; Lee, C.; Yang, Y.; Lim, H. Ancient Korean neural machine translation. IEEE Access 2020, 8, 116617–116625. [Google Scholar] [CrossRef]
- Woodard, J.; Nelson, J. An Information Theoretic Measure of Speech Recognition Performance; IDIAP: Martigny, Switzerland, 1982. [Google Scholar]
- Su, K.Y.; Wu, M.W.; Chang, J.S. A new quantitative quality measure for machine translation systems. In Proceedings of the COLING 1992 Volume 2: The 14th International Conference on Computational Linguistics, Nantes, France, 23–28 August 1992. [Google Scholar]
- Turian, J.P.; Shea, L.; Melamed, I.D. Evaluation of Machine Translation and Its Evaluation; Technical Report; New York University: New York, NY, USA, 2006. [Google Scholar]
- Agarwal, A.; Lavie, A. Meteor, m-bleu and m-ter: Evaluation metrics for high-correlation with human rankings of machine translation output. In Proceedings of the Third Workshop on Statistical Machine Translation, Columbus, OH, USA, 19 June 2008; pp. 115–118. [Google Scholar]
- Popović, M. chrF: Character n-gram F-score for automatic MT evaluation. In Proceedings of the Tenth Workshop on Statistical Machine Translation, Lisbon, Portugal, 17–18 September 2015; pp. 392–395. [Google Scholar]
- Ma, Q.; Wei, J.; Bojar, O.; Graham, Y. Results of the WMT19 metrics shared task: Segment-level and strong MT systems pose big challenges. In Proceedings of the Fourth Conference on Machine Translation (Volume 2: Shared Task Papers, Day 1), Florence, Italy, 1–2 August 2019; pp. 62–90. [Google Scholar]
- Sarzynska-Wawer, J.; Wawer, A.; Pawlak, A.; Szymanowska, J.; Stefaniak, I.; Jarkiewicz, M.; Okruszek, L. Detecting formal thought disorder by deep contextualized word representations. Psychiatry Res. 2021, 304, 114135. [Google Scholar] [CrossRef]
- Almeida, F.; Xexéo, G. Word embeddings: A survey. arXiv 2019, arXiv:1901.09069. [Google Scholar]
- Mikolov, T.; Chen, K.; Corrado, G.; Dean, J. Efficient estimation of word representations in vector space. arXiv 2013, arXiv:1301.3781. [Google Scholar]
- Pennington, J.; Socher, R.; Manning, C.D. Glove: Global vectors for word representation. In Proceedings of the 2014 Conference on Empirical Methods in Natural Language Processing (EMNLP), Doha, Qatar, 25–29 October 2014; pp. 1532–1543. [Google Scholar]
- Lo, C.k.; Wu, D. MEANT: An inexpensive, high-accuracy, semi-automatic metric for evaluating translation utility based on semantic roles. In Proceedings of the 49th Annual Meeting of the Association for Computational Linguistics: Human Language Technologies, Portland, OR, USA, 19–24 June 2011; pp. 220–229. [Google Scholar]
- Lo, C.k. MEANT 2.0: Accurate semantic MT evaluation for any output language. In Proceedings of the Second Conference on Machine Translation, Copenhagen, Denmark, 7–8 September 2017; pp. 589–597. [Google Scholar]
- Lee, C.; Yang, K.; Whang, T.; Park, C.; Matteson, A.; Lim, H. Exploring the data efficiency of cross-lingual post-training in pretrained language models. Appl. Sci. 2021, 11, 1974. [Google Scholar] [CrossRef]
- Nallapati, R.; Zhou, B.; dos santos, C.B.; Gulcehre, C.; Xiang, B. Abstractive text summarization using sequence-to-sequence rnns and beyond. arXiv 2016, arXiv:1602.06023. [Google Scholar]
- Stanojević, M.; Sima’an, K. Beer: Better evaluation as ranking. In Proceedings of the Ninth Workshop on Statistical Machine Translation, Baltimore, MD, USA, 26–27 June 2014; pp. 414–419. [Google Scholar]
- Macháček, M.; Bojar, O. Results of the WMT13 Metrics Shared Task. In Proceedings of the Eighth Workshop on Statistical Machine Translation, Sofia, Bulgaria, 8–9 August 2013; Association for Computational Linguistics: Sofia, Bulgaria, 2013; pp. 45–51. [Google Scholar]
- Ma, Q.; Graham, Y.; Wang, S.; Liu, Q. Blend: A novel combined MT metric based on direct assessment—CASICT-DCU submission to WMT17 metrics task. In Proceedings of the Second Conference on Machine Translation, Copenhagen, Denmark, 7–8 September 2017; pp. 598–603. [Google Scholar]
- Kane, H.; Kocyigit, M.Y.; Abdalla, A.; Ajanoh, P.; Coulibali, M. NUBIA: NeUral based interchangeability assessor for text generation. arXiv 2020, arXiv:2004.14667. [Google Scholar]
- Shimanaka, H.; Kajiwara, T.; Komachi, M. Ruse: Regressor using sentence embeddings for automatic machine translation evaluation. In Proceedings of the Third Conference on Machine Translation: Shared Task Papers, Belgium, Brussels, 31 October 2018; pp. 751–758. [Google Scholar]
- Conneau, A.; Kiela, D.; Schwenk, H.; Barrault, L.; Bordes, A. Supervised learning of universal sentence representations from natural language inference data. arXiv 2017, arXiv:1705.02364. [Google Scholar]
- Logeswaran, L.; Lee, H. An efficient framework for learning sentence representations. arXiv 2018, arXiv:1803.02893. [Google Scholar]
- Cer, D.; Yang, Y.; Kong, S.y.; Hua, N.; Limtiaco, N.; John, R.S.; Constant, N.; Guajardo-Cespedes, M.; Yuan, S.; Tar, C.; et al. Universal sentence encoder. arXiv 2018, arXiv:1803.11175. [Google Scholar]
- Shimanaka, H.; Kajiwara, T.; Komachi, M. Machine translation evaluation with bert regressor. arXiv 2019, arXiv:1907.12679. [Google Scholar]
- Sellam, T.; Das, D.; Parikh, A.P. BLEURT: Learning robust metrics for text generation. arXiv 2020, arXiv:2004.04696. [Google Scholar]
- Williams, A.; Nangia, N.; Bowman, S.R. A broad-coverage challenge corpus for sentence understanding through inference. arXiv 2017, arXiv:1704.05426. [Google Scholar]
- Radford, A.; Wu, J.; Child, R.; Luan, D.; Amodei, D.; Sutskever, I. Language models are unsupervised multitask learners. OpenAI Blog 2019, 1, 9. [Google Scholar]
- Schroff, F.; Kalenichenko, D.; Philbin, J. Facenet: A unified embedding for face recognition and clustering. In Proceedings of the IEEE Conference on Computer Vision and Pattern Recognition, Boston, MA, USA, 7–12 June 2015; pp. 815–823. [Google Scholar]
- Vamvas, J.; Sennrich, R. NMTScore: A Multilingual Analysis of Translation-based Text Similarity Measures. arXiv 2022, arXiv:2204.13692. [Google Scholar]
- Zhang, Y.; Baldridge, J.; He, L. PAWS: Paraphrase Adversaries from Word Scrambling. In Proceedings of the 2019 Conference of the North American Chapter of the Association for Computational Linguistics: Human Language Technologies, Volume 1 (Long and Short Papers), Minneapolis, MN, USA, 2–7 June 2019; Association for Computational Linguistics: Minneapolis, MN, USA, 2019; pp. 1298–1308. [Google Scholar] [CrossRef]
- Wang, A.; Singh, A.; Michael, J.; Hill, F.; Levy, O.; Bowman, S.R. GLUE: A multi-task benchmark and analysis platform for natural language understanding. arXiv 2018, arXiv:1804.07461. [Google Scholar]
- Liu, Y.; Ott, M.; Goyal, N.; Du, J.; Joshi, M.; Chen, D.; Levy, O.; Lewis, M.; Zettlemoyer, L.; Stoyanov, V. Roberta: A robustly optimized bert pretraining approach. arXiv 2019, arXiv:1907.11692. [Google Scholar]
| Disclaimer/Publisher’s Note: The statements, opinions and data contained in all publications are solely those of the individual author(s) and contributor(s) and not of MDPI and/or the editor(s). MDPI and/or the editor(s) disclaim responsibility for any injury to people or property resulting from any ideas, methods, instructions or products referred to in the content. |
© 2023 by the authors. Licensee MDPI, Basel, Switzerland. This article is an open access article distributed under the terms and conditions of the Creative Commons Attribution (CC BY) license (https://creativecommons.org/licenses/by/4.0/).


 ,
, 

