Article

Market Demand Optimization Model Based on Information Perception Control

1
School of Economics and Management, Shanghai University of Political Science and Law, Shanghai 201701, China
2
Public Experiment Center, University of Shanghai for Science and Technology, Shanghai 200093, China
*
Author to whom correspondence should be addressed.
These authors contributed equally to this work.
Mathematics 2023, 11(3), 783; https://doi.org/10.3390/math11030783
Submission received: 12 December 2022 / Revised: 24 January 2023 / Accepted: 25 January 2023 / Published: 3 February 2023

Abstract

:
The development of Internet technology and the rise of social networks have expanded the means of product information dissemination. Nowadays, consumers can obtain not only product quality information through real life contacts, but can also obtain product cognitive information through virtual networks, which constitute consumers’ information perception together. However, information in the market can be controlled, and companies can change the perceptions of their consumer base towards their products by enhancing the dissemination of information on the Internet, thus achieving higher corporate revenue. This article aims to study the evolution process of market demand under the control of consumers’ information perception, and a two-layer network model consisting of a cognitive information layer and a quality information layer were constructed. In order to improve product information dissemination efficiency, the opinion leaders who are more active in responding to mentions of the product across social networks are selected, and these opinion leaders are influenced in a stepwise manner using the maximum influence model, thus investigating the relationship between resources and corporate revenue. Using scale-free networks for simulation analysis, there are three main conclusions. First, the cognitive information and quality information of the product could affect market demand. Second, product demand and company profits would increase significantly if key individuals were added to the cognitive information layer. Third, the incremental marginal effect of key individuals decreases as their number increases.

1. Introduction

The Internet era has changed the means of product information dissemination, which is available through family and friends through real life contacts as well as celebrities and influential people in social networks. The surge in product information has not only affected consumer purchasing behaviors, but also changed the original market demand structure. The reason for this phenomenon can be explained by the “grass psychology” proposed by French sociologist Jean Gabriel Tarde, who believed that everyone in a society has the habit of imitating others, subject to the following law of consumer behavior: once an imitative behavior occurred without interference, its number increased exponentially and spread rapidly [1]. Therefore, in the consumer market, the rapid dissemination of product information through individuals with greater influence can effectively stimulate consumers to pay for products.
The information that affects consumer behaviors can be mainly divided into quality information and cognitive information. Quality information refers to consumers’ direct perception of product quality, price, and appearance through recommendations from family and friends or through direct contact with products, while cognitive information refers to consumers’ perception of the value and brand of products through relevant information on the Internet. These two types of information combine to form consumers’ information perceptions. In the field of information economics, Zhang pointed out that changes in information perception in the market could indeed have a certain degree of impact on the demand for products [2].
It is possible to find that consumers’ information perception can be manipulated by social phenomena. When a new product comes out, overwhelming advertisements can quickly make consumers quickly of the product and thus change the demand of the entire consumer market. In the process of investment, merchants often want to minimize cost and maximize impact. We can use effective node management to maximize the influence of online information dissemination; thus, this paper will control the dissemination of information perception to maximize the revenue of the company.
Yuan et al. give a model of market demand driven by information perception and quality perception together [3]. After the product is produced, the market-clearing quality is difficult to change, so firms often increase the market demand by manipulating the information perception of the market, through methods such as massive advertising. In this paper, we will explore how to influence the information perception of market consumers to affect market demand from the perspective of enterprises, and use the basic theory of influence maximization to select the appropriate path to achieve the maximum impact on market information perception with minimal input from enterprises, thus maximizing their revenue.
In the second part of the literature review section, the paper analyzes how information perception and quality perception affect market demand, while the article analyzes the influence maximization model. In the third part, the study gives a two-layer network model based on information perception, and the specific mechanism is analyzed and studied. In Section 4, this paper investigates the convergence of the model proposed in Section 3, using the social network analysis method. In Section 5, the model is investigated numerically using numerical analysis tools, and a concluding analysis is given in Section 6.

2. Literature Review

2.1. Consumers’ Perception of Value and Information

In the 1980s, management scholars and entrepreneurs initiated discussions on consumer mechanisms. Zeithaml first proposed the concept of consumer value perception, which means the evaluation of product use value formed by consumers during the consumption process [4]. In his research, he emphasized the subjectivity of consumer value perception. When a company provides products to consumers through the market, consumers will have a certain perception effect, which is the main source of information perception for consumers. In recent years, more and more entrepreneurs and researchers have realized the impact of value perception on consumer behavior [5,6,7,8].
Eggert et al. conducted a survey on some purchasing managers in Germany and found that value perception directly affected managers’ purchasing intentions, and this perception was adjusted by satisfaction [9]. Jiang et al. analyzed the five dimensions of e-commerce service quality perception: maintenance, reliability, combination, practicability, and security, based on the results of a survey of 235 online consumers. The research showed that the five dimensions all played positive roles in improving consumer loyalty [10]. Hung et al. used the structural equation model to study the influence of quality communication perception and virtual information perception on the consumer shopping process. This research showed that people who form consumption habits through the influence of information tended to have stronger demands for quality [11]. At the same time, many scholars have analyzed consumer value perception from the perspective of communication media. These studies pointed out that the satisfaction that consumers obtain through Internet media was promoted by product information perception [12,13,14].
Consumers’ information perception of products comes from two levels. The first level is the quality perception formed by consumers through the purchase and use of products. This perception mainly affects consumers when they purchase daily necessities [15]. The second level is the cognitive perception formed by consumers through external information (Internet information, TV advertising information, etc.). This perception mainly affects consumers when they purchase non-daily products that cannot be directly contacted [16]. Consumers usually form basic market demands under the influence of product quality information. Then, companies use advertising to further increase consumers’ cognitive information, thereby forming new market demands. The relationship between cognitive and quality perception under the influence of information dissemination is shown in Figure 1.
Pandža Bajs pointed out that value perception, satisfaction, and loyalty were the basic principles of successful company operation, so formulating a model of perceived value dimensions was the main goal of marketing management [17]. Sánchez-Fernández et al. established an evaluation system to explain that information perception was manifested in the interactive relationship between consumers and products, and information perception varied greatly due to consumers’ personal preferences and the external environment [18]. Fang et al. regarded value perception as the key driving force of customer repurchase intentions. Consumers with different backgrounds had different responses to their own interests, leading to differences in value perception [19]. Gottlieb et al. found that graduation job fairs were an important publicity method for universities, and richer recruitment resources enabled students to form a better information perception of the school [20].
Therefore, from the perspective of information perception, the research on product market demand can be divided into two parts: quality information and cognitive information. The former cannot be measured by price alone, in case of errors. Based on this, the article treated the quality and price of products as independent variables. Some consumers may still buy products with higher prices and lower quality before high quality products are released, or this may happen at the same time. The correlation between quality and price can often be reflected through market transactions, which also depends on consumers’ information perception of the products.
Based on the information dissemination mechanism of Unaware-Aware-Unaware (UAU) [21], this article constructed a two-layer network dissemination model to study the interactive influence of cognitive information and quality information, which involved the heterogeneous mean field theory and the dynamic evolution process of disease transmission. Different from the existing literature, first of all, this article took the impact of key individuals on consumer information perception into consideration and furthermore optimized the model to study the market demand. Secondly, in the two-layer network designed in this article, the individuals’ understanding of product information and their cognitive abilities show great diversity, since we supposed that each individual was in an identical state, so that the impact of consumers’ cognitive perception and quality perception on product demand could be analyzed. Finally, this article discussed the changes in market demand under different conditions through computer simulation experiments, and the experimental results were consistent with theoretical analysis, which has verified the accuracy and rationality of the proposed model.

2.2. Dissemination Models and Methods of Information Network

Traditional product information dissemination channels are mainly through consumers’ relatives and friends, manifested in the long-term accumulation of product reputation, that is, the slow dissemination of information. Now, with the rapid development of mobile intelligent service terminals, consumers are accessing more and more product information from the Internet. In other words, the Internet has gradually become the main channel for disseminating product information. Existing literature [22] has shown that interaction between users in social networks has a strong relationship with users’ consumption behavior in reality; however, no in-depth research on behavior categories and influence patterns has been conducted. Hong et al. explained that the reason that information dissemination on the Internet has an impact on consumers is that this kind of information dissemination breaks the physical structure and forms many virtual spaces, thereby solving the geographical and time constraints [23].
This paper focuses on the influence of information dissemination on consumer behavior. Thus, in order to expand the influence of information dissemination, this paper analyzes related network control models and methods. Chen et al. studied the robustness of the local effective influence model for maximizing influence [24]. Li et al. and Lagrée et al. studied the control method of information dissemination on market demand through the influence maximization model [25,26]. There is also literature that has focused on optimizing the influence function, or combining the new characteristics of the overall network, such as the potential dissemination network [27,28]. Barbieri et al. proposed for the first time to maximize influence from a topic perspective, and extended the traditional Independent Cascade model and Linear Threshold model to different topics (TIC, TLT) [29].
In order to describe the dissemination behavior of information on multiple social networks, more and more researches have focused on infectious disease models and information dissemination models on multi-layer networks [30]. Compared with a single-layer network, multiple networks can accelerate the dissemination of information and reduce the threshold of large-scale dissemination of information. When the disease transmission rate is less than the transmission threshold of a single-layer network, a multi-layer network can still have a global infection, and the transmission threshold and scale of the two networks are the same. Dickison et al. studied the impact of the coupling strength of two-layer networks on the spread of infectious diseases. They found that if the two networks were strongly coupled, when the infection rate was higher than the critical infection rate, the disease could erupt across the entire network. If the two networks were weakly coupled, the disease could only break out in one network when the infection rate was lower than the critical infection rate [31]. Azimi-Tafreshi studied the spread of two diseases on dual networks and found that infection with one of these diseases increased the probability of suffering from the other disease, and through the Generating Function Method, calculated the proportion of the number of people suffering from two diseases at the same time, as well as the disease transmission threshold [32].

2.3. Influence Maximization

Influence maximization (IM, influence maximization) [25,33,34] researches how to select a set of most influential seed nodes from a social network and initiate information dissemination based on these nodes to maximize the final dissemination range. The influence maximization problem is of great importance for applied research in social networks, information dissemination, etc. Domingos et al. [35] first proposed the influence maximization problem and gave a Heuristic Algorithm.
The issue is widely used in product marketing [36], disease control [37], and personalized recommendation [38]. For example, merchants may select the most influential part of users from social networks, promote, and market their products based on these users to make more users aware and eventually convert them into potential customers.
The influence maximization problem needs to be based on specific propagation models to describe the process of information propagation in the network. The most widespread models in use are the independent cascade (IC, independent cascade) model [39] and the linear threshold (LT, linear threshold) model [40]. Different propagation models are applicable to different types of social networks. Social networks can be divided into individual networks and group networks [41]. Individual networks mainly consider the influence relationship between single nodes and individual nodes, and are suitable for independent cascade models. Group networks mainly consider influence relationships between single nodes and multiple nodes, and between multiple nodes and multiple nodes. Group networks are suitable for linear threshold models. Based on the selected propagation model, the influence maximization problem is equivalent to selecting the seed collection with the largest possible influence.
Influence maximization aims to initiate information dissemination through the seed collection (i.e., the collection of source nodes for information dissemination) to achieve optimal influence diffusion. The means by which information spreads in the network is determined by the propagation model. In the process of information propagation, a node is called an activated node if it receives the information, otherwise it is called an inactivated node. The existing propagation models mainly include the Linear Threshold (LT) model [42], Independent Cascade (IC) model [43], and extended model.
The linear threshold model, originally proposed by Granovetter, is a cumulative model of influence that primarily reflects the influence relationship between a single node and multiple nodes. The independent cascade model, originally proposed by Goldenberg, is a probabilistic model that mainly reflects the influence relationship between a single node and a single node. The extended models, on the other hand, are partly composed based on the basic propagation model, with certain constraints added, such as the general linear model [44], the weighted cascade model [45], the decreasing cascade model [46] proposed based on the independent cascade model, and the hierarchical cascade model [47] based on the linear threshold model; the other part is a new propagation model designed for the individual demands in different application scenarios.

3. Two-Layer Network Model Based on Information Perception

3.1. Model Analysis

3.1.1. Demand Analysis under Information Perception Control

The focus of this paper is the product demand q Q , p , ε across the entire market, and the total demand in the market comes from N consumers. Although the information perception of each consumer has certain differences, there is an average market information perception. Then, the total market demand can be as shown in Equation (1).
q Q , p , ε = i = 1 N q i Q , p , A i
Q represents the quality of the product or service (market-clearing quality); P represents market-clearing price; A i represents the volume of information perceived by each consumer in the market; q i represents the demand for the product that each consumer is willing to purchase; and ε represents the average information perception across the market.
Because consumers can decide whether to purchase a certain product, it can be considered that each product has a certain degree of substitutability. Assuming that N consumers all purchase the product, the total market demand for the product is 1. If the total market demand is 0.3, that means that 30% of consumers in the market are willing to buy the product.
The product quality, price, and information perception that this paper focus on are all expressed in unspecified unit ratios, so the purchase quantity q is linearly proportional to the likelihood of consumers buying products. Consumers are often less sensitive to the quality of products. When companies in the market disseminate some opaque information, people will be slow to respond to quality-driven consumer behavior. This phenomenon can be described as Equation (2).
q Q , A = A Q A Q 0 / 1 A Q 0
In Equation (2), A represents information perception capability. In order to better functionalize the problem, let A = ε 1 + ε . Because Equation (2) is a special case of the complete expression q Q , p , ε , the selection of parameters can refer to human factors.

3.1.2. Network Analysis under Information Perception Control

The two-layer network model is formed by coupling two single-layer networks, so the two-layer network model can be more in line with the complexity of perceptual information dissemination. For the two-layer network model, each layer has the same number of network nodes, and there are connecting edges between corresponding nodes, and each individual represents different roles at different levels. Assume that the number of nodes in both layers is M, and each node in one layer of network is connected to only one corresponding node in another layer of network. The two-layer network model includes two sub-networks A and B with different topological structures. It is assumed that the UAU information dissemination model is adopted on both sub-networks A and B, that is, the node is in the information AI (Aware Information) or no information UI (Unaware Information) status, information disseminates between nodes through neighbor relationships [48]. In each dissemination process, nodes without information can be affected by neighbor nodes with information, and also affected by nodes in another layer of the network. The dissemination dynamics equations in the two-layer network are shown in Equations (3) and (4).
p 1 , i t + 1 = 1 p 1 , i t 1 q 1 , i t + 1 u 1 p 1 , i t + γ 1 p 1 , j t 1 p 1 , i t
p 2 , i t + 1 = 1 p 2 , i t 1 q 2 , i t + 1 u 2 p 2 , i t + γ 2 p 2 , j t 1 p 2 , i t
In Equations (3) and (4), i ϵ 1 , , N . q 1 , i t and q 2 , i t represent the probability that the node will not be affected by any neighbor node with information in the sub-networks A and B, respectively. Therefore 1 q 1 , i t and 1 q 2 , i t , respectively, represent the probability that the node will be affected in the sub-networks A and B during the dissemination process [3,49]. p 1 , i t + 1 denotes the probability that the node has information at moment t + 1 ; 1 p 1 , i t denotes the probability that it does not have information at moment t; 1 q 1 , i t denotes the probability that the information is propagated to the node at moment t; u 1 denotes the probability that the node has forgotten information in the past in the network, 1 u 1 p 1 , i t denotes the probability that the node has information and the information is not forgotten; γ 1 denotes the probability of propagation to neighboring nodes; p 1 , j t 1 p 1 , i t denotes the probability that the j-th node has information the i-th node does not have information and the information of the j-th node is propagated to the i-th node; therefore, on the second layer of the network, information propagation remains the same.
At present, companies often use some marketing methods to make key individuals in social networks the first to make contact with a certain new product, and then use the influence of these individuals to quickly disseminate product information, so as to achieve marketing effects that cannot be achieved by traditional marketing strategies in a short time. Therefore, this paper summarizes the information dissemination problem in the two-layer network as follows: Firstly, determine the set of m key nodes in a given network. Secondly, inform the set of product information in advance. Finally, key nodes can quickly disseminate information through the network, and allow as many nodes as possible in the network to obtain product information.
In order to find m key nodes in the two-layer network, this paper designs a two-layer network optimization algorithm. Suppose the two-layer network is G, and the initial set of active nodes (also called the seed set) is S, assuming that all nodes except the set S are inactive at the initial moment [50]. At the same time, the influence of the set S is defined as σ S , and σ S represents the final number of active nodes in the two-layer network after the dissemination ends. Therefore, the problem of finding key nodes can be symbolized as follows: In the two-layer network G, given a parameter n (n is a positive integer), assuming that the information is disseminated in G in a specific way, find a set S containing n nodes in G, that is S = n , can maximize σ S [51].
The problem of finding key nodes in a two-layer network satisfies monotonicity and submodularity, that is, an approximate optimal solution with an approximate ratio of 1 1 / e can be found using the optimization algorithm. Submodularity need to define an arbitrary function f that can map a subset of a finite set U to non-negative real numbers. σ S , defined above, also has this form [52,53]. σ S maps the set S in the two-layer network to a real number, this real number refers to the node data in the set of active nodes after the information dissemination ends, and S is the initial target set of activation. If f satisfies the attribute of diminishing returns, then f is considered to be a submodule function [54]. The attribute of diminishing returns refers to the marginal return obtained by adding an element v (i.e., a node in the two-layer network) to the set S, which cannot be less than the marginal return obtained by adding the same element v to the parent set of S [28]. The formula is shown in Equation (5).
f S v f S f T v f T ,   S T
The submodule function has a non-negative, non-strictly monotonically increasing attribute, that is, adding an element to the set will not cause f to decrease, f S v f S .

3.2. Model Design

3.2.1. Two-Layer Network Design

Set the upper layer of the two-layer network model as the cognitive information layer. In this layer, the individual is in an information state A (Aware) or no information state U (Unaware). Individuals in U state do not get any product information, while individuals in A state can obtain product information through Internet media such as Weibo. In order to improve the dissemination efficiency of product information, this paper designs a two-layer network optimization algorithm to select the most influential m key nodes in the cognitive information layer, so that product information can be quickly disseminated through these nodes.
According to the analysis in Section 3.1.2, the specific process of the algorithm is designed as First define S = Φ , F v , G is the set of subsequent nodes after activating node v, and σ S v is the influence range function of node v,   v ϵ V . Starting from the empty initial set S, through R simulations of the dissemination process, R dissemination structure diagrams are generated. Secondly, the F v , G of all nodes on each dissemination structure diagram is accumulated and averaged. This average value is the influence range of the node, that is, the index to evaluate the influence of each node. After finding the node with the largest average value and adding it to S, find the next key node. Then, try to add each node to S and calculate the successor set F S v , G of S v . Accumulate F S v , G and calculate the average value to get the second key node and add it to S. Finally, repeat the above calculation process until S = n . The optimization algorithm for finding m key nodes can be expressed as Equation (6).
σ S v = 1 M r = 1 M F S v ,   G
Thus, a set S containing m nodes in the cognitive information layer can be obtained, which can maximize the number of final active individuals in the network, that is, σ S is the largest. In the cognitive information layer, suppose that m individuals of AI have been notified of product information, then the individual of UI communicates with the individual of AI with the information, and converts to the AI state, with a probability of λ . The individual of AI will switch to the UI state, with the probability of μ due to suspicion or not caring about this information.
Set the lower layer of the two-layer network model as the quality information layer. In this layer, information is disseminated mainly through practically accessible networks such as daily life and work. The quality information layer is also based on the UAU dissemination mechanism, setting the node in the information state AI or non-information state UI. The dissemination mode of the quality information layer is that the individual of UI comes into contact with the individual of AI and is transformed into the state AI, with a probability of λ . The individual of AI will return to the individual of UI, with a probability of μ, due to forgetting and other reasons [54].

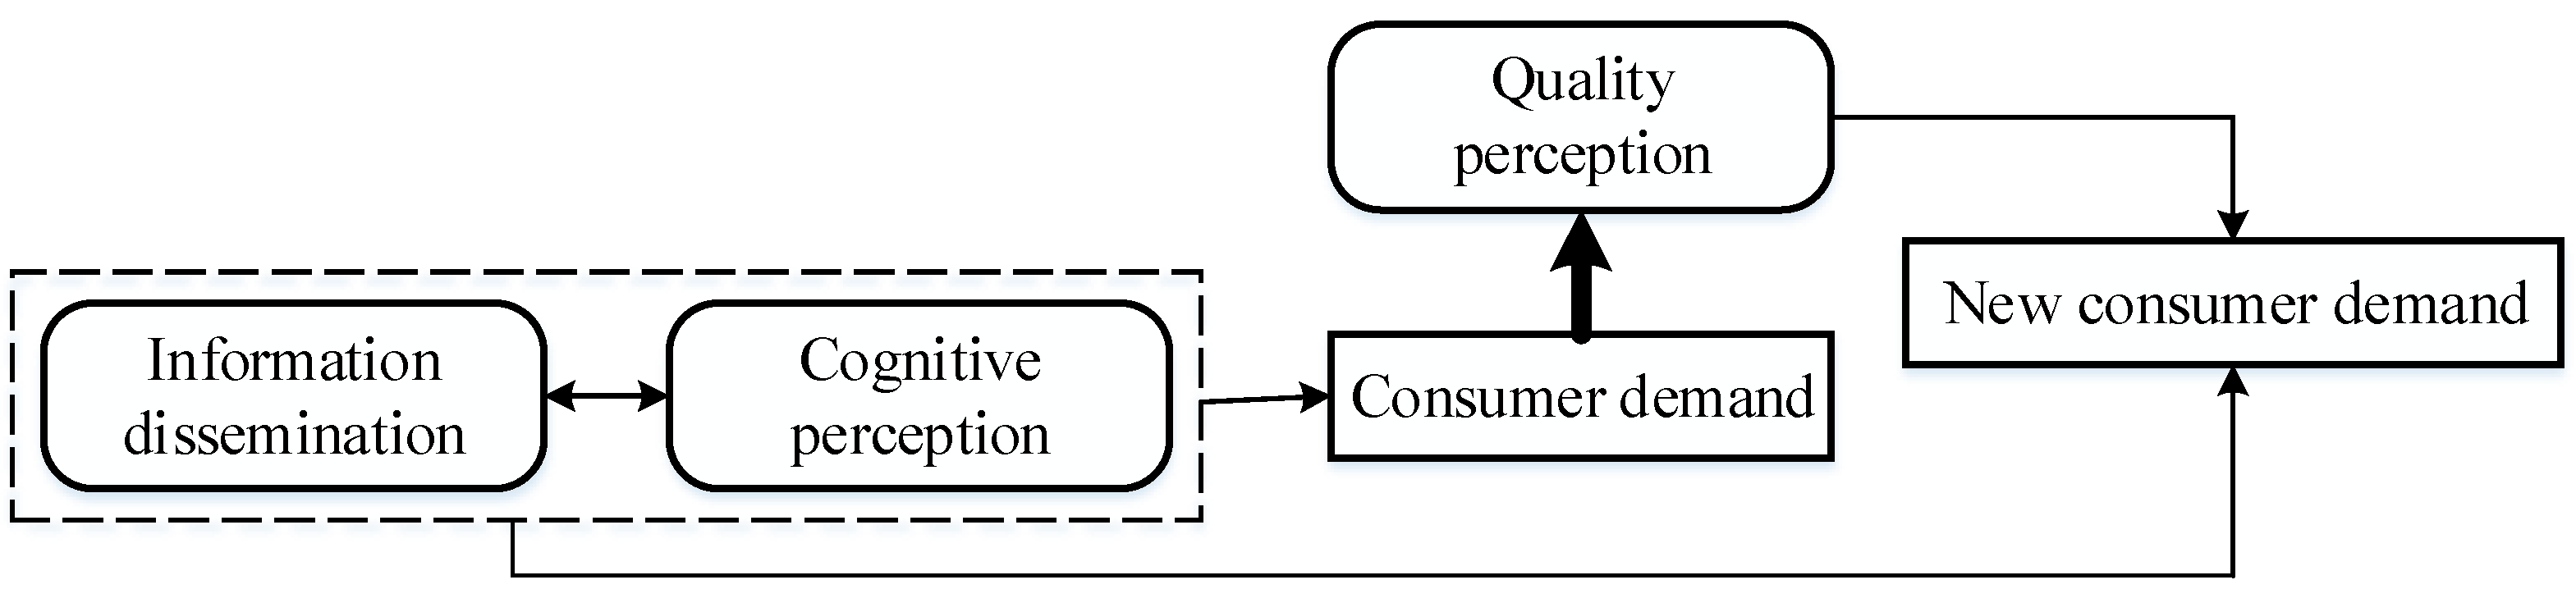
3.2.2. Overall Model Design

In the information perception control two-layer network established in this paper, although the individuals corresponding to different layers are the same, the connection states between individuals at different layers are not completely the same. The basic assumptions of the two-layer network model are as follows:
Suppose two kinds of information are respectively denoted as D 1 and D 2 . They are respectively disseminated on two complex networks with the same number of nodes (the same group), and the two networks are denoted as N 1 and N 2 respectively. The cognitive information D 1 of the product is disseminated in the network N 1 , and the average degree of N 1 is k = k , l P k , l k . The product quality information D 2 is disseminated in the network N 2 , and the average degree of N 2 is l = k , l P k , l l . k and l , respectively, represent the probability that the node has K connecting edges in N 1 and L connecting edges in N 2 at the same time.
The networks N 1 and N 2 are both based on the dissemination mechanism of Unaware-Aware-Unaware (UAU). The UAU dissemination mechanism can be simply described as a certain individual of UI obtains information with a probability λ in the process of contact with a certain individual of AI within a unit of time. At the same time, a certain individual of AI returns to an individual of UI with a probability μ, due to forgetting or not paying attention. Therefore, each node with a k , l connected edge combination can be divided into four states. The first is the state U I U k , l , where neither cognitive information nor quality information is known. The second is the state A I A k , l , where both cognitive information and quality information are known. The third is the state A I U k , l of knowing cognitive information but not quality information. The fourth is the state U I A k , l of not knowing cognitive information but knowing quality information. In addition, U I U k , l ,   A I A k , l ,   A I U k , l ,   U I A k , l represent the probability value of the individual in these four states, and satisfy Equation (7).
U I U k , l + A I A k , l + A I U k , l + U I A k , l = 1 , k , 1
where U I U k , l denotes the probability that consumers do not know both commodity awareness information and commodity quality information; A I A k , l denotes the probability that consumers know both commodity awareness information and commodity quality information; A I U k , l denotes the probability that consumers are aware at the commodity awareness level but are not aware at the commodity quality information level; and U I A k , l denotes the probability that they do not know commodity awareness information but are familiar with commodity quality information.
Individuals in the network can be divided into two types according to their degree of activity. One type is individuals who are more active in daily life. They generally take the initiative to contact other active and inactive individuals, so the probability of disseminating and receiving information is greater. The other type is individuals who are not active in daily life, generally passively contacting other individuals in the network. Therefore, this paper assumes that individuals in active states can receive information from all neighbor individuals, while individuals in inactive states can only receive information from individuals in the active states. The probability of each node being in the active state is α , and the probability of being in the inactive state is 1 α . On the basis of the four information states, the superscript m and n can be used to mark the active state and the inactive state. The four active states are U I U k , l m , A I A k , l m , A I U k , l m , U I A k , l m . The four inactive states are U I U k , l n , A I A k , l n ,   A I U k , l n ,   U I A k , l n .
In summary, the two-layer network model of information perception control can be obtained as shown below:
  • Dissemination of product cognitive information D 1
Seed node information conversion is shown in Equation (8).
U * 1 A *
Unknown individuals in active states are shown in Equations (9)–(12).
U I U k , l m + A I U k , l λ 1 A I U k , l m + A I U k , l
U I U k , l m + A I A k , l β 1 b λ 1 A I U k , l m + A I A k , l
U I A k , l m + A I U k , l β 1 a λ 1 A I A k , l m + A I U k , l
U I A k , l m + A I A k , l β 1 a β 1 b λ 1 A I A k , l m + A I A k , l
Unknown individuals in inactive states are shown in Equations (13)–(16).
U I U k , l n + U I U k , l m λ 1 A I U k , l n + A I U k , l m
U I U k , l n + A I A k , l m β 1 b λ 1 A I U k , l n + A I A k , l m
U I A k , l n + A I U k , l m β 1 a λ 1 A I A k , l n + A I U k , l m
U I A k , l n + A I A k , l m β 1 b λ 1 A I A k , l n + A I A k , l m
Known individuals forgetting information are shown in Equations (17) and (18).
A I U k , 1 μ 1 U I U k , 1
A I A k , 1 η 1 μ 1 U I A k , 1
The dissemination rate and forgetting rate of product cognitive information D 1 are represented by λ 1 and μ 1 . The dissemination of product quality information D 2 will promote or inhibit the dissemination rate and forgetting rate of D 1 , and this probability is represented by the parameters β and η. β 1 a means that the individual knows the quality information while knowing the cognitive information. β 1 b means that the communicator already knows the quality information. η 1 represents the change value of the forgetting rate of cognitive information D 1 , which is due to the fact that the individual already knows the quality information D 2 .
2.
Dissemination of product quality information D 2
Unknown individuals in active states are shown in Equations (19)–(22).
U I U k , l m + U I A k , l λ 2 U I A k , l m + U I A k , l
U I U k , l m + A I A k , l β 2 b λ 2 U I A k , l m + A I A k , l
A I U k , l m + U I A k , l β 2 a λ 2 A I A k , l m + U I A k , l
A I U k , l m + A I A k , l β 2 a β 2 b λ 2 A I A k , l m + A I A k , l
Unknown individuals in inactive states are shown in Equations (23)–(26).
U I U k , l n + U I A k , l m λ 2 U I A k , l n + U I A k , l m
U I U k , l n + A I A k , l m β 2 b λ 2 U I A k , l n + A I A k , l m
A I U k , l n + U I A k , l m β 2 a λ 2 A I A k , l n + U I A k , l m
A I U k , l n + A I A k , l m β 2 b λ 2 A I A k , l n + A I A k , l m
Known individuals forgetting information are shown in Equations (27) and (28).
U I A k , 1 μ 2 U I U k , 1
A I A k , 1 η 2 μ 2 A I U k , 1
Similar to the dissemination of D 1 , the basic dissemination rate and forgetting rate of D 2 are represented by λ 2 and μ 2 . β 2 α means that the individual knows the quality information while also knowing the cognitive information. β 2 b means that the communicator already knows the product cognitive information. η 2 represents the change value of the forgetting rate of quality information D 2 , which is due to the fact that the individual already knows the cognitive information D 1 .

4. Model Convergence Analysis

4.1. Mean Field Approximate Analysis

Based on the heterogeneous mean field approximation theory of the network dissemination model, this paper obtains a dynamic equation that describes the evolution of node density in different states over time. The density dynamic equation of node that is active and unknown to both types of information is shown in Equation (29).
U I U k , 1 m t = μ 1 A I U k , 1 + μ 2 U I A k , 1 k λ 1 θ 1 A I U U U k , 1 k β 1 b λ 1 θ 1 A I U U U k , 1 1 λ 2 θ 2 U A U I U k , 1 1 β 2 b λ 2 θ 2 A I A U U k , 1
The density dynamic equation of node that is inactive and unknown to both types of information is shown in Equation (30).
U I U k , 1 n t = μ 1 A I U k , 1 + μ 2 U I A k , 1 k λ 1 α θ 1 A I U U U k , 1 k β 1 b λ 1 α θ 1 A I U U I U k , 1 1 λ 2 α θ 2 U I A U I U k , 1 1 β 2 b λ 2 α θ 2 A I A U I U k , 1
The parameter θ in Equations (29) and (30) expresses the probability of nodes connecting edges.
The probability of an edge of any node in the network N 1 connected to the A I U state is shown in Equation (31), and the probability of a node connected to the A I A state is shown in Equation (32).
θ 1 A I U = k , 1 p k , 1 k A I U k , 1 k , 1 p k , 1 k = k , 1 p k , 1 k A I U k , 1 k
θ 1 A I A = k , 1 p k , 1 k A I A k , 1 k
The probability of an edge of any node in the network N 2 connected to the A I U state is shown in Equation (33), and the probability of a node connected to the A I A state is shown in Equation (34).
θ 2 A I U = k , 1 p k , 1 1 A I U k , 1 1
θ 2 A I A = k , 1 p k , 1 A I A k , 1 1
Thus, the density dynamic equation of the node whose two kinds of information is known can be obtained as shown in Equation (35).
A I A k , 1 t = α A I A k , 1 m t + 1 α A I A k , 1 n t = μ 1 A I U k , 1 + μ 2 U A k , 1 k σ 1 + 1 σ 2 A I A k , 1
Among them, σ 1 = α λ 1 2 α θ 1 A I U + β 1 b θ 1 A I A and σ 2 = α λ 2 2 α θ 2 U I A + β 2 b θ 2 A I A respectively represent the probability that the edge of the node is connected to the node with known D 1 and D 2 . By analogy, the density dynamic equations of the other three states are shown in Equations (36) and (37).
A I U k , 1 t = k σ 1 U I U k , 1 + η 2 μ 2 A I A k , 1 1 β 2 α σ 2 A I U k , 1 μ 1 A I U k , 1
U I A k , 1 t = k σ 2 U I U k , 1 + η 1 μ 1 A I A k , 1 k β 1 α σ 1 U I A k , 1 μ 2 U I A k , 1
A I A k , 1 t = k β 1 α σ 1 U I A k , 1 + 1 β 2 α σ 2 A I U k , 1 η 1 μ 1 + η 2 μ 2 A I A k , 1
Due to the relationship of U I U k , 1 + A I A k , 1 + A I U k , 1 + U I A k , 1 = 1 , k , 1 , only three of the states are linearly independent.

4.2. Market Demand Analysis

The nodes in the two-layer network can be described in four states: the state in which the cognitive information and quality information of the product are not known U I U k , 1 , the state where both cognitive information and quality information are known A I A k , 1 , the state of knowing cognitive information but not quality information A I U k , 1 , the state of not knowing the cognitive information but knowing the quality information U I A k , 1 . According to the change rate of the four states in t , t + Δ t , the market demand in t , t + Δ t can be obtained as shown in Equation (39).
q ( Q , A , t + Δ t ) = q ( Q 1 , A 0 , t + Δ t ) + q ( Q 1 , A 1 , t + Δ t ) + q ( Q 2 , A 1 , t + Δ t )
q Q , A , t + Δ t denotes the demand in the market at moment t + Δ t , which is jointly influenced by the market-clearing quality in the market at moment t + Δ t and the dry quality of clearing information, when the market-clearing quality transforms from Q 1 to Q 2 , the perceived market-clearing quantity information transforms from A 0 by A 0 ; thus, the above equation is available.
Regardless of the influence of higher-order terms, according to the average field approximation theory, when Δ t 0 , Equation (40) can be found.
q ( Q , A , t ) d t = q ( Q 1 , A 0 , t ) d t + q ( Q 1 , A 1 , t ) d t + q ( Q 2 , A 1 , t ) d t
It can be seen that the cognitive information layer expands the influence of the product, enhances consumers’ awareness of the product, and then encourages consumers to purchase the product. For example, bloggers with a large number of fans on Weibo can promote product information, thereby deepening consumers’ awareness of the product and attracting them to purchase the product. At the same time, in the early stage of product sales, improving consumers’ understanding of product quality can also stimulate consumers to purchase the product. Therefore, when dissemination rates of product cognitive information and quality information are increased, they can change consumer demand for products, and then change the sales revenue of the company. The revenue of the company is shown in Equation (41).
G Q , A , t + Δ t = q Q , A , t + Δ t × 1 Q

5. Model Simulation Experiment

This paper uses the scale-free network generation algorithm [6] to construct a two-layer network in the information perception control two-layer network model. The randomly generated cognitive information layer and quality information layer each contain 1000 nodes. The new node added in each iteration of the cognitive information layer has six edges, and the new node added in each iteration of the quality information layer has three edges. Each simulation experiment takes 100 iterations as the output result. Figure 2 shows the individual’s response behavior when the information mastery parameters are different. Among them, individual activity α D y n a m i c = 1 , number of influential individuals m = 10 , cognitive information layer forgetting rate σ = 0.4 , quality information layer forgetting rate μ = 0.6 , and cognitive information layer dissemination rate λ = 0.4 . In Figure 2, the two subgraphs (a) and (b), respectively, compare the control effect of key individuals’ influence on product demand when consumers have different grasp of product cognition.
First, randomly select 10% of the individuals with product cognitive and 5% of the individuals with product cognitive to conduct the experiment, as shown in Figure 2a. Then, after adding influence for control, the same number of individuals with product cognitive are selected for information dissemination, as shown in Figure 2b. From Figure 2b, it can be seen that after adding control, product demand has been significantly improved. It can be seen that after adding the influence factor to the product cognitive layer and controlling it, that is, the product cognitive information is notified to influential individuals and disseminated, thereby increasing the product demand.
In Figure 3, the four subgraphs (a), (b), (c), and (d) compare the changes in product demand and company revenue with the number of key individuals when individuals have different grasp of information. Among them, individual activity α D y n a m i c = 1 , cognitive information layer forgetting rate σ = 0.4 , quality information layer forgetting rate μ = 0.6 , and cognitive information layer dissemination rate λ = 0.4 . With other conditions unchanged, increase the number of key individuals from m = 5 to m = 10 .
From the comparison of the vertical coordinates in Figure 3a–d, it can be seen that the demand for products increases with the increase of seed nodes, indicating that the control effect of company demand is enhanced with an increase of the number of key individuals. According to the submodularity discussed in Section 3.1.2 of this paper, the incremental effect of element v in the set S decreases as S increases. Therefore, when a company chooses to add key individuals in the dissemination information layer, it is necessary to strictly screen these key individuals who know the product information first.

6. Conclusions

This paper uses a two-layer network model and the dissemination mechanism of information in the network to explore the impact of consumers’ information perception on product demand. Use the influence maximization mechanism to introduce opinion leaders to maximize their influence on the network to study the impact of information dissemination on demand. With the help of mean field theory, the convergence of the method is analyzed, so as to be more in line with the current social media information dissemination mechanism. As opposed to previous studies, this paper divides product information into cognitive information and quality information, and the interaction of the two together affects market demand. At the same time, this paper divides the individuals in the information dissemination network into two states, active and inactive, so that the demand evolution process in information dissemination is more realistic. Finally, computer simulation experiments verify the correctness and scientificity of the theoretical analysis. The main research conclusions of this paper are as follows.
  • When introducing opinion leaders in the cognitive network layer of the two-layer network used in this paper, it can be found that it is susceptible to be influenced by the opinion leaders in the cognitive network, and in the meantime, it can also have an impact on the market demand. Therefore, it is possible to control the whole network by influencing the cognitive layer in the two-tier network. From a corporate perspective, when corporations invest certain resources to influence the consumer market, these resources are invested in opinion leaders in the market that can increase market demand.
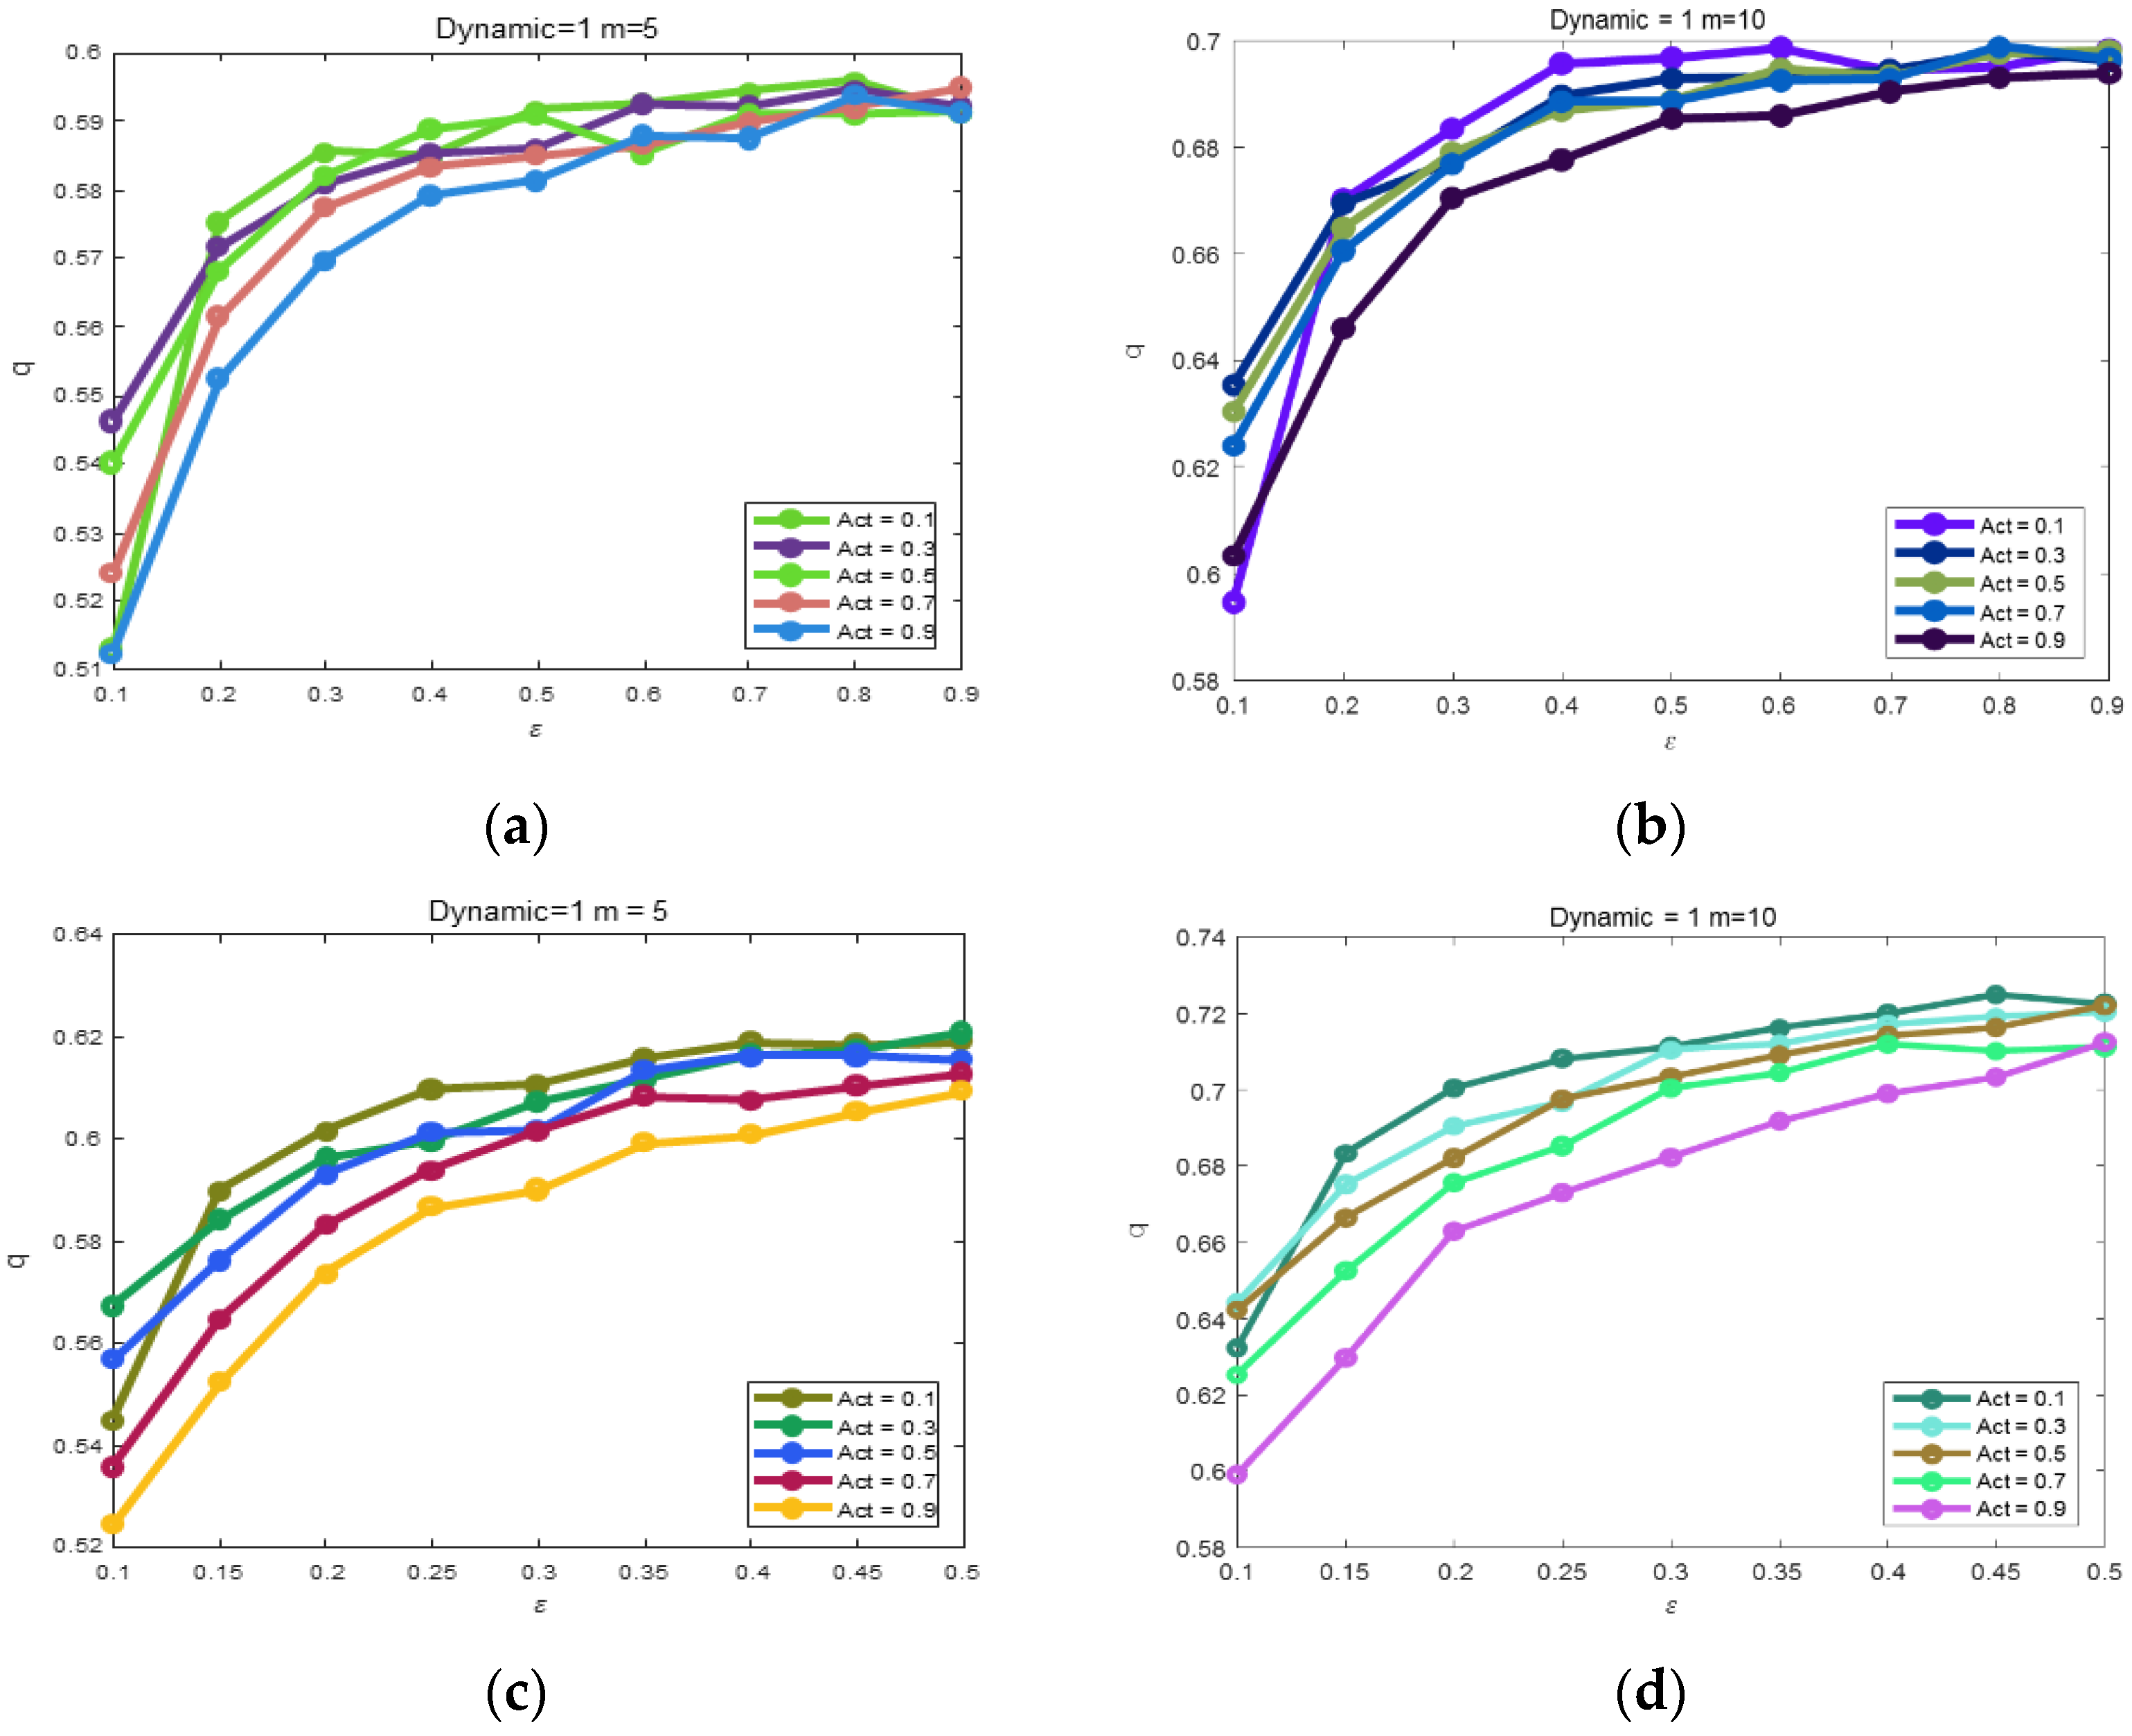
  • From a network control perspective, it is not better to add more and more opinion leaders at the cognitive layer; as the number of opinion leaders increases, their impact on market demand decreases at the margin. In other words, adding core nodes in the network has a marginal decreasing impact on the effectiveness of the entire network. This is due to the fact that the marginal benefit of investment gradually decreases; therefore, enterprises need to consider the number of opinion leaders when selecting opinion leaders, so as to achieve the maximum benefit.
  • When the nodes in the network are not susceptible to infection by neighboring nodes, then adding opinion leaders in the network cannot change the information perception of neighboring nodes, and thus, cannot influence the consumption demand. When personal information cognition has reached a high level or when personal information is difficult to be changed, enterprises should not invest external resources to achieve revenue improvement by changing information cognition.
This paper systematically analyzes the influence mechanism and evolution process of information perception, which has strong theoretical value in the research of product demand. At the same time, the relevant conclusions can help companies increase their income; therefore, this paper has certain practical significance.
This paper is just the beginning of research on information perception, and more in-depth analysis can be done later. For example, the difference in consumers’ perception of information has caused the difference in their influence in information dissemination. Therefore, in the future, we can study the transformation model of different consumers’ active levels under different conditions. At the same time, information perception is not only the behavior of consumers, but also exists among companies. The issue of information perception of companies can be discussed based on the sensitivity of the consumer market.
A follow-up research can also be conducted in two aspects: (1) The activity of different nodes can be considered to analyze the research, and the differences in individual consumers’ perception of information lead to the impact of communication in consumer information networks. (2) The difference in consumer activity makes the difference in their influence on the neighboring nodes after acquiring information, which, in turn, has a strong difference in the network communication. This issue can be solved by constructing a multi-decision information dissemination and information fusion model.

Author Contributions

Conceptualization, G.Y.; Methodology, G.Y., Y.W. and D.P.; Software, Y.W. and D.P.; Formal analysis, G.Y.; Data curation, D.P.; Writing—original draft, G.Y. and Y.W.; Writing—review & editing, Z.L. and D.P.; Project administration, G.Y., Y.W. and D.P.; Funding acquisition, Z.L. All authors have read and agreed to the published version of the manuscript.

Funding

This research received no external funding.

Data Availability Statement

Not applicable.

Conflicts of Interest

The authors declare no conflict of interest.

References

  1. Tarde, G. The Laws of Imitation; Holt, H., Ed.; Read Books Limited: Redditch, UK, 1903. [Google Scholar]
  2. Zhang, Y.C. Supply and demand law under limited information. Phys. A Stat. Mech. Its Appl. 2005, 350, 500–532. [Google Scholar] [CrossRef]
  3. Yuan, G.; Han, J.; Zhou, L.; Liang, H.; Zhang, Y. Supply and demand law under variable information. Phys. A Stat. Mech. Its Appl. 2019, 536, 121004. [Google Scholar] [CrossRef]
  4. Zeithaml, V.A. Consumer perceptions of price, quality, and value: A means-end model and synthesis of evidence. J. Mark. 1988, 52, 2–22. [Google Scholar] [CrossRef]
  5. Babin, B.J.; Darden, W.R.; Griffin, M. Work and/or fun: Measuring hedonic and utilitarian shopping value. J. Consum. Res. 1994, 20, 644–656. [Google Scholar] [CrossRef]
  6. Grewal, D.; Monroe, K.; Krishnan, R. The effects of price-comparison advertising on buyers’ perceptions of acquisition value, transaction value, and behavioral intentions. J. Mark. 1998, 62, 46–59. [Google Scholar]
  7. Li, J.; Deng, Q. What influences the effect of texting-based instruction on vocabulary acquisition? Learners’ behavior and perception. Comput. Educ. 2018, 125, 284–307. [Google Scholar] [CrossRef]
  8. Cruz, T.; Rosa, L.; Proença, J.; Maglaras, L.; Aubigny, M.; Lev, L.; Jiang, J.; Simões, P. A cybersecurity detection framework for supervisory control and data acquisition systems. IEEE Trans. Ind. Inform. 2016, 12, 2236–2246. [Google Scholar] [CrossRef]
  9. Eggert, A.; Ulaga, W. Customer perceived value: A substitute for satisfaction in business markets? J. Bus. Ind. Mark. 2002, 17, 107–118. [Google Scholar] [CrossRef]
  10. Jiang, L.; Jun, M.; Yang, Z. Customer-perceived value and loyalty: How do key service quality dimensions matter in the context of B2C e-commerce? Serv. Bus. 2016, 10, 301–317. [Google Scholar] [CrossRef]
  11. Hung, S.; Cheng, M.; Chiu, P. Do antecedents of trust and satisfaction promote consumer loyalty in physical and virtual stores? A multi-channel view. Serv. Bus. 2019, 13, 1–23. [Google Scholar] [CrossRef]
  12. Zeithaml, V.; Parasuraman, A.; Malhotra, A. Service quality delivery through web sites: A critical review of extant knowledge. J. Acad. Mark. Sci. 2002, 30, 362–375. [Google Scholar] [CrossRef] [Green Version]
  13. Hua, L. Clustering Field Words by Character Extraction in Text Classification. Appl. Linguist. 2007, 1, 21–34. [Google Scholar]
  14. Lv, J.; Wu, Q.; Huang, J.; Zhu, S. Network Comments Data Mining-Based Analysis Method of Consumer’s Perceived Value. In Advances in Swarm and Computational Intelligence, Proceedings of the International Conference in Swarm Intelligence, Beijing, China, 25–28 June 2015; Springer: Cham, Switzerland, 2015; pp. 89–97. [Google Scholar]
  15. Garbarino, E.; Slonim, R. Interrelationships and distinct effects of internal reference prices on perceived expensiveness and demand. Psychol. Mark. 2003, 20, 227–248. [Google Scholar] [CrossRef]
  16. Zhang, J.; Li, S.; Zhang, S.; Dai, R. Manufacturer encroachment with quality decision under asymmetric demand information. Eur. J. Oper. Res. 2019, 273, 217–236. [Google Scholar] [CrossRef]
  17. Pandža Bajs, I. Tourist perceived value, relationship to satisfaction, and behavioral intentions: The example of the Croatian tourist destination Dubrovnik. J. Travel Res. 2015, 54, 122–134. [Google Scholar] [CrossRef]
  18. Sánchez-Fernández, R.; Iniesta-Bonillo, M.Á. The concept of perceived value: A systematic review of the research. Mark. Theory 2007, 7, 427–451. [Google Scholar] [CrossRef]
  19. Fang, J.; Wen, C.; George, B.; Prybutok, V. Consumer heterogeneity, perceived value, and repurchase decision-making in online shopping: The role of gender, age, and shopping motives. J. Electron. Commer. Res. 2016, 17, 116. [Google Scholar]
  20. Gottlieb, U.; Beatson, A. High on emotion! perceived value: Influencing decision-making processes at international student recruitment trade shows. J. Mark. High. Educ. 2018, 28, 282–297. [Google Scholar] [CrossRef]
  21. Fan, C.; Jin, Y.; Huo, L.A.; Liu, C.; Yang, Y.P.; Wang, Y.Q. Effect of individual behavior on the interplay between awareness and disease spreading in multiplex networks. Phys. A Stat. Mech. Its Appl. 2016, 461, 523–530. [Google Scholar] [CrossRef]
  22. Viswanath, B.; Mislove, A.; Cha, M.; Gummadi, K. On the evolution of user interaction in facebook. In Proceedings of the 2nd ACM Workshop on Online Social Networks, Barcelona, Spain, 17 August 2009; pp. 37–42. [Google Scholar]
  23. Hong, L.; Dan, O.; Davison, B.D. Predicting popular messages in twitter. In Proceedings of the 20th International Conference Companion on World Wide Web, Hyderabad, India, 28 March–1 April 2011; pp. 57–58. [Google Scholar]
  24. Chen, W.; Lin, T.; Tan, Z.; Zhao, M.; Zhou, X. Robust influence maximization. In Proceedings of the 22nd ACM SIGKDD International Conference on Knowledge Discovery and Data Mining, San Francisco, CA, USA, 13–17 August 2016; pp. 795–804. [Google Scholar]
  25. Li, Y.; Ju, F.; Wang, Y.; Tan, K.L. Influence maximization on social graphs: A survey. IEEE Trans. Knowl. Data Eng. 2018, 30, 1852–1872. [Google Scholar] [CrossRef]
  26. Lagrée, P.; Cappé, O.; Cautis, B.; Maniu, S. Algorithms for online influencer marketing. ACM Trans. Knowl. Discov. Data (TKDD) 2018, 13, 1–30. [Google Scholar] [CrossRef]
  27. Saito, K.; Nakano, R.; Kimura, M. Prediction of information diffusion probabilities for independent cascade model. In Knowledge-Based Intelligent Information and Engineering Systems, Proceedings of the International Conference on Knowledge-Based and Intelligent Information and Engineering Systems, Zagreb, Croatia, 3–5 September 2008; Springer: Berlin/Heidelberg, Germany, 2008; pp. 67–75. [Google Scholar]
  28. Jung, K.; Heo, W.; Chen, W. Irie: Scalable and robust influence maximization in social networks. In Proceedings of the 12th International Conference on Data Mining, Brussels, Belgium, 10–13 December 2012; pp. 918–923. [Google Scholar]
  29. Barbieri, N.; Bonchi, F.; Manco, G. Topic-aware social influence propagation models. Knowl. Inf. Syst. 2013, 37, 555–584. [Google Scholar] [CrossRef]
  30. Wei, J.; Bu, B.; Liang, L. Estimating the diffusion models of crisis information in micro blog. J. Informetr. 2012, 6, 600–610. [Google Scholar] [CrossRef]
  31. Dickison, M.E.; Magnani, M.; Rossi, L. Multilayer Social Networks; Cambridge University Press: Cambridge, UK, 2016. [Google Scholar]
  32. Kempe, D.; Kleinberg, J.; Tardos, É. Maximizing the spread of influence through a social network. In Proceedings of the 9th ACM SIGKDD International Conference on Knowledge Discovery and Data Mining, Washington, DC, USA, 24–27 August 2003; pp. 137–146. [Google Scholar]
  33. Pu, D.; Yuan, G. Two-sided matching model considering multi-information fusion of stakeholders. Expert Syst. Appl. 2023, 212, 118784. [Google Scholar] [CrossRef]
  34. Domingos, P.; Richardson, M. Mining the network value of customers. In Proceedings of the 7th ACM SIGKDD International Conference on Knowledge Discovery and Data Mining, San Francisco, CA, USA, 26–29 August 2001; pp. 57–66. [Google Scholar]
  35. Peng, H.; Huang, K.; Yang, L.; Yang, X.; Tang, Y. Dynamic maintenance strategy for word-of-mouth marketing. IEEE Access 2020, 8, 126496–126503. [Google Scholar] [CrossRef]
  36. Ren, J.; Liu, M.; Liu, Y.; Liu, J. Optimal resource allocation with spatiotemporal transmission discovery for effective disease control. Infect. Dis. Poverty 2022, 11, 34. [Google Scholar] [CrossRef]
  37. Paul, A.; Wu, Z.; Liu, K.; Gong, S. Personalized recommendation: From clothing to academic. Multimed. Tools Appl. 2022, 81, 14573–14588. [Google Scholar] [CrossRef]
  38. Binesh, N.; Ghatee, M. Distance-aware optimization model for influential nodes identification in social networks with independent cascade diffusion. Inf. Sci. 2021, 581, 88–105. [Google Scholar] [CrossRef]
  39. Blesa, M.; García-Rodríguez, P.; Serna, M. Forward and backward linear threshold ranks. In Proceedings of the 2021 IEEE/ACM International Conference on Advances in Social Networks Analysis and Mining, Virtual Event, 8–13 November 2021; pp. 265–269. [Google Scholar]
  40. Ali, A.; Wang, H.; Khan, A.N. Mechanism to enhance team creative performance through social media: A transactive memory system approach. Comput. Hum. Behav. 2019, 91, 115–126. [Google Scholar] [CrossRef]
  41. Granovetter, M. Threshold models of collective behavior. Am. J. Sociol. 1978, 83, 1420–1443. [Google Scholar] [CrossRef]
  42. Goldenberg, J.; Libai, B.; Muller, E. Talk of the network: A complex systems look at the underlying process of word-of-mouth. Mark. Lett. 2001, 12, 211–223. [Google Scholar] [CrossRef]
  43. Kempe, D.; Kleinberg, J.; Tardos, É. Influential nodes in a diffusion model for social networks. In Automata, Languages and Programming, Proceedings of the International Colloquium on Automata, Languages, and Programming, Lisbon, Portugal, 11–15 July 2005; Springer: Berlin/Heidelberg, Germany, 2005; pp. 1127–1138. [Google Scholar]
  44. Chen, W.; Wang, Y.; Yang, S. Efficient influence maximization in social networks. In Proceedings of the 15th ACM SIGKDD International Conference on Knowledge Discovery and Data Mining, Paris, France, 28 June–1 July 2009; pp. 199–208. [Google Scholar]
  45. Lv, S.; Pan, L. Influence maximization in independent cascade model with limited propagation distance. In Web Technologies and Applications, Proceedings of the Asia-Pacific Web Conference, Changsha, China, 5–7 September 2014; Springer: Cham, Switzerland, 2014; pp. 23–34. [Google Scholar]
  46. Yang, H.; Wang, C.; Xie, J. Maximizing influence spread in a new propagation model. In Rough Sets and Knowledge Technology, Proceedings of the International Conference on Rough Sets and Knowledge Technology, Chengdu, China, 17–20 August 2012; Springer: Berlin/Heidelberg, Germany, 2012; pp. 292–301. [Google Scholar]
  47. Azimi-Tafreshi, N. Cooperative epidemics on multiplex networks. Phys. Rev. E 2016, 93, 042303. [Google Scholar] [CrossRef]
  48. Saitis, C.; Järveläinen, H.; Fritz, C. The role of haptic cues in musical instrument quality perception. In Musical Haptics; Springer: Cham, Switzerland, 2018; pp. 73–93. [Google Scholar]
  49. Dey, S.; Sampath, A. Dynamic linkages between gold and equity prices: Evidence from Indian financial services and information technology companies. Financ. Res. Lett. 2018, 25, 41–46. [Google Scholar] [CrossRef]
  50. Eliseus, A.; Bilad, M.; Nordin, N.; Putra, Z.; Wirzal, H. Tilted membrane panel: A new module concept to maximize the impact of air bubbles for membrane fouling control in microalgae harvesting. Bioresour. Technol. 2017, 241, 661–668. [Google Scholar] [CrossRef]
  51. Lochmüller, H.J.T.; Le, C.; Jonker, A.; Lau, L.; Baynam, G. The International Rare Diseases Research Consortium: Policies and guidelines to maximize impact. Eur. J. Hum. Genet. 2017, 25, 1293–1302. [Google Scholar] [CrossRef]
  52. Hoang, D.T.; Niyato, D.; Wang, P.; Kim, D.I.; Han, Z. Ambient backscatter: A new approach to improve network performance for RF-powered cognitive radio networks. IEEE Trans. Commun. 2017, 65, 3659–3674. [Google Scholar] [CrossRef]
  53. Cai, W.; Chen, T.; Ryali, S.; Kochalka, J.; Li, C.-S.R.; Menon, V. Causal interactions within a frontal-cingulate-parietal network during cognitive control: Convergent evidence from a multisite–multitask investigation. Cereb. Cortex 2016, 26, 2140–2153. [Google Scholar] [CrossRef]
  54. Yuan, G.; Han, J.; Wang, Y.; Liang, H.; Li, G. The product demand model driven by consumer’s information perception and quality perception. Phys. A Stat. Mech. Its Appl. 2019, 535, 122352. [Google Scholar] [CrossRef]
Figure 1. The relationship between cognitive and quality perception.
Mathematics 11 00783 g001
Figure 2. The effect of influence on product demand under different information mastering abilities. (a) ϕ = 0.8 (b) ϕ = 0.5 .
Mathematics 11 00783 g002
Figure 3. The effect of the number of influential individuals on product demand; (a) ϕ = 0.8 , m = 5 (b) ϕ = 0.8 , m = 10 (c) ϕ = 0.5 , m = 5 (d) ϕ = 0.5 , m = 10 .
Mathematics 11 00783 g003
Disclaimer/Publisher’s Note: The statements, opinions and data contained in all publications are solely those of the individual author(s) and contributor(s) and not of MDPI and/or the editor(s). MDPI and/or the editor(s) disclaim responsibility for any injury to people or property resulting from any ideas, methods, instructions or products referred to in the content.

