Abstract
Advances in information technology have led to the proliferation of data in the fields of finance, energy, and economics. Unforeseen elements can cause data to be contaminated by noise and outliers. In this study, a robust online support vector regression algorithm based on a non-convex asymmetric loss function is developed to handle the regression of noisy dynamic data streams. Inspired by pinball loss, a truncated -insensitive pinball loss (TIPL) is proposed to solve the problems caused by heavy noise and outliers. A TIPL-based online support vector regression algorithm (TIPOSVR) is constructed under the regularization framework, and the online gradient descent algorithm is implemented to execute it. Experiments are performed using synthetic datasets, UCI datasets, and real datasets. The results of the investigation show that in the majority of cases, the proposed algorithm is comparable, or even superior, to the comparison algorithms in terms of accuracy and robustness on datasets with different types of noise.
MSC:
68T09; 62R07
1. Introduction
Machine learning-based techniques attempt to investigate the patterns in the data and the reasoning behind it. Researchers in the field of machine learning field have shown significant interest in support vector regression (SVR) algorithms owing to the strong theoretical basis and excellent generalization ability. SVR has proven to be a reliable method for regression and has been widely used in several applications, such as wind speed forecasting [1,2], solar radiation forecasting [3], financial time series forecasting [4,5], travel time forecasting [6], among others.
Classic SVR is a powerful regression method. It works by minimizing the empirical risk loss and the structural risk, which are defined by the loss function and the regularization term, respectively. Given a training dataset , SVR aims to find a linear function or a nonlinear function in feature space, to reveal the patterns and trends in the data. The minimal problem is described as follows:
C is the regularization parameter used to adjust the model complexity and training error. The loss function measures the difference between the predicted and observed values, which is used to define empirical risk loss. The regularization term makes as flat as possible to avoid overfitting. The regression estimator is obtained by solving a convex optimization problem where all the local minima are also global.
The loss function is of significant importance for SVR. It should accurately reflect the noise characteristics present in the training data. In recent years, researchers have developed various loss functions. The most commonly used loss functions are the squared loss, linear loss, Huber loss, and -insensitive loss [7]. Squared loss [8,9] is a metric that assesses the discrepancy between the predicted and actual values by calculating the mean squared error. It is a smooth function which can be solved quickly and accurately by convex optimization methods. However, it is sensitive to large errors, making it less robust than other techniques. Linear loss [10,11] is a general loss function applicable to several problems. It is less sensitive to large errors than the squared loss because it is designed by absolute errors. Huber loss [12] is a combination of linear and squared losses and is designed to simultaneously provide robustness and smoothness by using squared loss for the smaller errors and linear loss for the larger errors. The combination of the two loss functions allows for a more sophisticated understanding of the data. The -insensitive loss [10,11] augments the linear loss by introducing an insensitive band to the data, which promotes sparsity.
In the current era of data abundance, accurately analyzing dynamic data with noise and outliers using SVR is a challenging but essential task.
One of the problems is that the loss function is not sufficiently resilient to general noise in the data and can be adversely affected by outliers. Data collection processes are influenced by various external factors, resulting in noise and outliers in the data. Across numerous fields, including finance, economy, and energy, data are regularly accompanied by a considerable amount of asymmetric noise. Further, noise has several forms and is difficult to identify and remove. For example, asymmetric heavy-tailed noise that is predominantly positive is typically found in automobile insurance claims [13]. The energy-load data contain non-Gaussian noise with a heavy-tailed distribution [14]. The popular loss functions mentioned above are usually symmetric, which means that the loss incurred is the same degree regardless of the direction of the prediction error. They have proven themselves in situations where the noise is symmetric, such as the Gaussian noise and Uniform noise. However, they are not as robust as dealing with asymmetric noise, including heavy-tailed noise and outliers. This was demonstrated in a previous study [7,15,16]. In addition, comparing the predicted value to the target value, there may be different impacts of over-estimation and under-estimation [7,14]. Take the energy market as an example, hedging contracts between retailers and suppliers are commonly used to stabilize the cost of goods in short term, thus reducing economic risk. Over-prediction and under-prediction both result in economic losses, albeit of different magnitudes. Over-forecasting may incur the cost of disposing of unused orders, while under-forecasting may cause retailers to pay a higher price for energy loads than the contract price. Developing a more accurate regression model requires consideration of the various penalties for over-estimation and under-estimation.
To handle the asymmetric noise while considering the distinct effects of positive and negative errors, two asymmetric loss functions have been proposed: quantile loss and pinball loss [15,17,18]. These loss functions differ in terms of different penalty weights for positive and negative errors, thus making them more robust to asymmetric noise.
Moreover, outliers have a severe impact on the accuracy of the model. The presence of outliers skews the data and causes large deviations from the expected results. It is crucial to consider the presence of outlier when constructing and evaluating a model. Given the under-forecasting in dealing with general noise and outliers, there is a need for designing a broader range of loss functions to address these issues. Researchers have developed non-convex loss functions to handle outliers, such as correlated entropy loss [16,19] and truncated loss functions [8,18,20,21]. These two strategies limit the outlier loss to a specific range, thereby reducing the impact of outliers on the regression function. The asymmetric loss function and the truncated loss functions have proven to be viable strategies for improving the robustness of regression models.
Another problem is that the batch learning framework used by a typical SVR is unsuitable for the data flow environment. Traditional SVRs involve batch learning, which can be challenging when dealing with large datasets owing to the increased storage requirements and computational complexity. Researchers have proposed various solutions to address this problem, such as the convex optimization technique outlined in [9,15] and online learning algorithms based on the stochastic approximation theory [22,23,24]. The online SVR presented in [9] and the Canal loss-based online regression algorithm described in [22] are used as examples. Therefore, despite the efficiency of the proposed online learning algorithms for handling regression problems in data streams, other solutions may be required when noise and outliers are present.
The current study aims to present an online learning regression algorithm based on truncated asymmetric loss functions, which can effectively address the regression problem in noisy data streams. We propose a novel online SVR, termed TIPOSVR, established within the regularization framework of SVR and solved by the online gradient descent (OGD) algorithm. TIPOSVR uses an innovative loss function. The main contributions of this study are as follows:
- (1)
- TIPL function proposed is a bounded, non-convex and asymmetric loss function. Asymmetricity helps in dealing with problems arising due to the presence of asymmetric noise, and truncation is used to reduce the effect of outliers. Additionally, the inclusion of an insensitive band increases the sparsity of the model. It is possible to effectively deal with the general noise and reduce the sensitivity to outliers.
- (2)
- An online SVR (TIPOSVR), based on the TIPL function, is developed to address the issue of the data dynamics problem. The algorithm is solved using the OGD approach.
- (3)
- Computational experiments are performed on the synthetic, benchmark, and real datasets. Results of the experiments indicate that TIPOSVR proposed in this study is more accurate than the comparison algorithms in most scenarios. It has been shown that the TIPOSVR has a high degree of robustness and generalizability.
The remainder of this paper is organized as follows. Section 2 of this paper provides a literature review, while Section 3 presents the regularization framework and the robust loss function of SVR. Section 4 proposes an online SVR based on the TIPL function. To validate the performance of the proposed algorithm, Section 5 presents numerical experiments on the synthetic, UCI benchmark, and real datasets which compare TIPOSVR with some classical and advanced SVRs. Finally, Section 6 summarizes the main findings, limitations, and prospects for future work of this paper.
2. Literature Review
SVR has been widely used and implemented in various fields as a powerful machine learning algorithm. This section provides an overview of the recent advances in robust loss functions and online learning algorithms.
2.1. Robust Loss Function
Noise is generally classified into two categories: characteristic noise and outliers. It has been reported [21,25] that the -insensitive loss function is more effective for dealing with uniform noise datasets, whereas the squared loss function is more effective in dealing with Gaussian noise datasets. Aside from Gaussian and Uniform noise, asymmetric noise, especially heavy-tail noise, also significantly affects the accuracy of a regression model. Studies have shown that an asymmetric loss function can be used to solve the asymmetric noise problem [15,17,18]. The quantile regression theory provides the basis for deriving an asymmetric loss function [15]. Assigning different penalty weights to positive and negative errors allows for a wider range of noise distributions. Quantile regression has been increasingly used since the 1970s. Refs. [26,27] have adopted the quantile loss function, incorporating an adjustment term and , to adjust the asymmetric insensitive region within the regularization framework, as expressed in optimization problem Equation (1). The introduction of the parameter to control the width of the asymmetric -insensitive area ensures that a certain percentage of the samples are situated in this area and classified as support vectors. Consequently, an insensitive band that can accommodate the necessary amount of samples is outputted to address the sampling issue, thereby facilitating the automated control of accuracy. The pinball loss is developed based on quantile regression [15,18]. Extensive research on pinball loss has been conducted, leading to the development and application of the sparse -insensitive pinball loss [16] and the twin pinball SVR [28].
Several studies have been conducted to address the outlier problem, with a focus on developing a non-convex loss function. The correlation entropy loss [16,19] is a loss function derived from the correlation entropy theory based on the Gaussian or Laplacian kernel. As the error moves away from zero in either direction, the loss value eventually increases to a constant. Another type of non-convex loss function is horizontal truncated loss. In this case, the loss value of the outlier is a constant. As described in [22], Canal loss is a -insensitive loss with horizontal truncation. Ref. [29] construct a non-convex loss function by subtracting two -insensitive loss functions, which yield a linear loss with horizontal truncation. A non-convex least square loss function, proposed in [8], is based on the horizontal truncation and squared loss. Experimental evidence suggests that these loss functions successfully reduce the impact of outliers. The aforementioned methods produce bounded loss functions that help reduce the sensitivity of the model to outliers by maintaining the loss of outliers within a certain limit.
For a dataset containing noise and outliers, a combination of the asymmetric loss function and truncated loss function is proposed to improve the robustness of the regression model, because such a combination covers a more comprehensive range of noise distributions.
Most of the analysis uses batch learning SVR. Batch algorithms assume that data can be collected and used via a single step process, ignoring any changes that may occur over time. This is not the case in today’s era of the Big Data age, where the data are constantly in flux [23,30,31]. Batch algorithms are faced with memory and computational problems because of the considerable amount of data needed by these algorithms. Researchers have now focused on investigating online learning algorithms to improve the performance of regression strategies in the face of data flow.
2.2. Online Learning Algorithm
A regression algorithm should be designed to easily integrate new data into the existing model to address the storage and computational issues caused by a large amount of data. Online learning algorithms have been discussed and implemented in previous studies [23,24,32,33]. A kernel-based online extreme learning machine is proposed by [34]. An online sparse SVR method is introduced in [35].
Nevertheless, these techniques are formulated in the context of convex optimization, which is unsuitable for non-convex optimization problems. The online learning approach is further improved according to the theory of pseudo-convex function optimization theory [33]. Studies on online learning algorithms for non-convex loss functions have been performed, including the online SVR [22] and a variable selection [36] based on Canal loss.
This study presents an online SVR that contains a bounded and non-convex loss function. The algorithm is designed to be noise-resilient and sparse while being capable of capturing the various data characteristics.
3. Related Work
3.1. Robust Loss Function
The loss function plays a key role in any regression model. The sensitivity of a model to asymmetric noise is reduced using the pinball loss function, which is an asymmetric loss function. Further, the truncated loss function reduces the effect of outliers.
3.1.1. Pinball Loss
The pinball loss is derived from quantile regression, which is more effective for dealing with different forms of noise than linear loss. Pinball loss is defined as follows:
where is an asymmetry parameter. By adjusting the value of , we can address the problems of over and under-prediction to different degrees, making it suitable for datasets with different noise distributions. Cross-validation is the preferred method to determine the best value of . When = 1, the pinball loss is equivalent to a linear loss.
Incorporating a -insensitive band into the pinball loss enables the pinball loss to be sparser and resilient to minor errors. -insensitive pinball loss is defined as:
Pinball loss and -insensitive pinball loss present a potential solution to counteract the asymmetric distribution of noise. These two convex loss functions are particularly susceptible to severe noise and outliers owing to the lack of an upper bound.
3.1.2. Truncated -Insensitive Loss
The horizontal truncation technique provides an efficient approach to dealing with outliers. The truncated -insensitive loss is a variant of the -insensitive loss that includes a horizontal truncation, as shown in Figure 1. As suggested by [22], the truncated -insensitive loss known as Canal loss promotes sparsity and robustness. It is defined as follows:
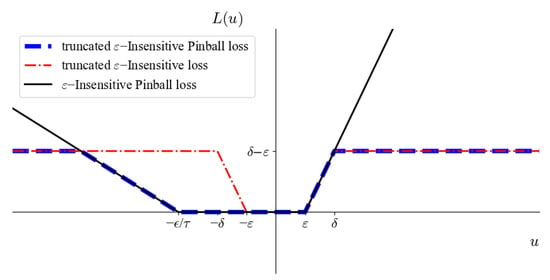
Figure 1.
Loss functions.
By limiting the loss of outliers to a predetermined value , the impact of outliers on the model is limited, thereby increasing the robustness of the model. The -insensitive band and the area contribute to the sparse solution of the algorithm.
3.2. Online SVR
Online learning algorithms integrate new arrival data into the historical model and adjust the model through the parameter update strategy. When constructing a model, the instantaneous risk is used instead of empirical risk. Online SVR is expressed as an instantaneous risk minimization problem under the regularization framework. It is defined as follows:
The objective function consists of two components: a regularization term and a loss function representing the instantaneous risk. The regularization parameter C is typically set by cross-validation. The model can be updated using the latest information and previous support vector data patterns by incorporating the instantaneous risk. Consequently, the memory requirements and the number of calculations are lower than those of the batch algorithm.
4. Online SVR Based on Truncated -Insensitive Pinball Loss Function
In this section, we present a modified version of the pinball loss function, called TIPL, which is a non-convex and asymmetric loss function. In addition, an online SVR for the TIPL is designed and solved using the OGD.
4.1. Truncated -Insensitive Pinball Loss Function (TIPL) and Its Properties
4.1.1. Truncated -Insensitive Pinball Loss Function
Inspired by the pinball loss function, TIPL is developed, which is defined as follows:
where is an asymmetric parameter, is an insensitive parameter, and is the truncation parameter. TIPL is divided into five parts, as shown in Figure 1. If the error u is within the specified tolerance range as -insensitive area, the loss is zero. The loss is for , and for . Except in the above cases, when or , the loss is fixed as a constant .
TIPL is an improved version of the pinball loss that offers improved resistance to noise and outliers, and produces a sparser representation of the solution. The -insensitive band promotes sparsity and thus saves computing resources. Applying horizontal truncation limits the impact of outliers on the loss value and increases the algorithm’s robustness to large disturbances and outliers. The asymmetric feature makes the model more versatile and applicable to a wide range of noise types.
TIPL is expressed in an equivalent form:
4.1.2. Properties of the TIPL Function
Property 1.
is a non-negative, asymmetric, and bounded function.
Proof.
(1) For , . TIPL is non-negative.
(2) From Equation (6), if . , if the error . Obviously, if . is not symmetrical.
(3) From Equation (6), , so is bounded. □
Property 2.
includes and extends both ε-insensitive loss function and truncated ε-insensitive loss function.
Proof.
From Equation (6),
When , reduces to the -insensitive pinball loss function.
When , is equivalent to the truncated -insensitive loss function.
By inheriting the asymmetry of pinball losses and the immunity to outliers of truncated -insensitive loss, TIPL achieves a higher level of resilience. TIPL differs from the -insensitive pinball loss in that the former incorporates horizontal truncation, which limits the loss of outliers to some extent and makes the model more robust. Unlike truncated - insensitive loss, TIPL loss takes advantage of asymmetric functions. It assigns different penalty weights to positive and negative errors, enabling it to deal with general noise distributions. and are determined using a data-driven process. □
Property 3.
The derivative of is discontinuous.
Proof.
As can be seen from Equation (8),
,
,
,
.
The derivative of is discontinuous, which precludes using a convex optimization to solve it. □
4.2. Online SVR Based on the Truncated -Insensitive Pinball Loss Function
Within the regularization framework of SVR, the online SVR model with TIPL is derived by incorporating the loss function into Equation (5), which is defined as:
We chose the OGD to solve the non-convex optimization problem presented by the TIPL loss function. The online algorithm updates the regression function by incorporating the initial decision function and the new sample ().
The learning process involves generating a series of decision functions(,, …,), with the initial hypothesis and the updated regression function . When a new sample () arrives, the predicted value is calculated by the historical decision function , and the loss value is determined by combining with the actual label .
The update process of is defined as follows:
where is the learning rate; = +. is determined by the renewable nucleus, i.e., . With = , is expressed as follows:
The sample is not a support vector if or (, ) ∪ [, +∞). The two regions are -insensitive or outlier regions, in which the samples from these regions are not considered during the update process. The proposed SVR model not only preserves the sparsity of -insensitive loss but also increases the sparsity by eliminating outliers.
Algorithm 1 details the proposed TIPOSVR algorithm.
| Algorithm 1: Online support vector regression algorithm based on the truncated -insensitive Pinball loss function. |
|
4.3. Convergence of TIPOSVR
In the research of the regularized instantaneous risk minimization with Canal loss, Ref. [22] reveals that the regularized Canal loss satisfies an inequality analogous to that of a convex function on , apart from two small, unidentifiable intervals. Strong pseudo-convexity is defined based on this representation, and the convergence performance of NROR is analyzed using online convex optimization theory. It has been demonstrated that if the prediction deviation sequence does not fall into the unrecognizable region of Canal loss, the average instantaneous risk will converge to the minimum regularization risk at a rate of .
Drawing inspiration from [22], this section illustrates the strong pseudo-convexity of the regularization TIPL loss, and concludes TIPOSVR’s convergence rate of the average instantaneous risk to the minimum regularization risk. Definitions and propositions of strong pseudo-convexity in this section are taken from [22].
Definition 1
([22] Strong pseudo-convexity). A function is said to be strongly pseudo-convex (SPC) on with respect to , if
holds for all , with a Clarke subgradient of f at is a contant. If the Inequality Equation (13) holds with respect to any , f is called SPC on . The collection of SPC functions on with are denoted as .
When , a strongly pseudo-convex function is equivalent to a convex function. In order to understand the strong pseudo-convexity of the regularized TIPL’s loss, which is a piecewise convex function, further analysis is required. Propositions 1 and Propositions 2 [22] enable us to verify the strong pseudo-convexity of TIPL loss.
Proposition 1.
([22]). Let be a univariate continuous function. Assume that on each interval of , is convex, and . Then we have that the Inequality (13) holds for any fixed and with
Proposition 2.
([22]). Let be a univariate continuous function. Let be the real numbers, and . On each interval of , is convex, and . Let S be the set of the minimum points of f on R. Suppose that the optimal solution set . With . Moreover, suppose that is strictly decreasing when and strictly increasing when . Then, for any fixed and . Inequality (13) holds with
It is evident from Proposition 1 and Proposition 2 that the parameter K of strong pseudo-convexity is associated with the directional derivatives at the end of the intervals. The strong pseudo-convexity of regularized TIPL loss is obtained from Lemma 1 and Lemma 2. The proof of lemmas and theorems can be found in the supplementary material.
Lemma 1.
Denote , suppose , is SPC with on .
Lemma 2.
Let the sequence instance satisfy . For a fixed
Assuming , we have
with
Lemma 2 demonstrates that, under the given assumptions, f and g of instantaneous loss satisfy the inequality of strong pseudo-convexity. Subsequently, we can employ online convex optimization technology to analyze the convergence performance of TIPOSVR. The theorem provides the rate measure of TIPOSVR convergence to minimize risk.
Theorem 1.
Set example sequence be holds for all t. represents a hypothetical sequence produced by TIPOSVR, , and . Fix and set the learning rate . We assume that each hypothesis generated by TIPOSVR satisfies the hypothesis stated in Lemma 2, for , and then we have the following expression
Among them, , .
In Theorem 1, we get an regret boundary. For each t, , is the union of two intervals with length . For exceeding this hypothesis in practice, the prediction error may fall within the zone , where losses are flat. In this case, sample is identified as a non support vector by TIPOSVR.
5. Numerical Experiments
We performed experiments on multiple datasets with noise and outliers to evaluate the effectiveness of the TIPOSVR. The performance of our model is then compared with those of other online SVR models. The datasets adopted consist of synthetic datasets, benchmark datasets, and real datasets. The artificial dataset evaluates performance under specific fluctuations, while the benchmark and real-world datasets allow for assessing performance in realistic environments. In the experimental part, three comparison algorithms are used in the experiment: -SVR (SVR with -insensitive loss), SVQR (SVR with -insensitive pinball loss), and NROR (SVR with truncated -insensitive loss), as shown in Table 1. Batch algorithms are not included in the comparison algorithms because they are inappropriate for training with large datasets.

Table 1.
Loss functions.
Experiments are carried out using Python 3.8 on a PC with an Intel i7-5500U CPU 2.40 GHz.
To ensure the accuracy and effectiveness of the assessment, we chose absolute mean error (MAE), root mean square error (RMSE), and time to run (TIME) as the assessment metrics. Details of the evaluation criteria are presented in Table 2.

Table 2.
Table of evaluation criteria.
MAE is the average of the absolute errors. RMSE is the square root of the mean square error, which provides the standard deviation of the errors. MAE is not as sensitive to outliers as RMSE, which puts more emphasis on large error values.
Samples from the dataset are randomly selected to form the training and test sets, with outliers and noise added to the training set. A grid search method was used to identify the optimal values of the parameters. The Gaussian kernel was selected as the kernel in the work. TIPOSVR includes hyperparameters such as the insensitivity coefficient , the asymmetry parameter , the truncation parameter , the regularization parameter C, the learning rate and the kernel parameter . To negate the effects of the kernel and regularization parameters, the most effective values of C and were identified through -SVR, and the same values were then used for the other three models. Grid search and five-fold cross-validation were performed on the training set for each dataset to obtain the highest accuracy. C was taken from } while choosen from }. The NROR algorithm was employed to determine the truncation parameter from }. Cross-validation and grid search methods in TIPOSVR were used to select the asymmetric parameter from }. The insensitivity parameter was set to 0.04 for simplicity.
5.1. Synthetic Datasets
The synthetic dataset is generated by a bivariate function defined as follows:
where and are input features of the sample with uniform distribution , , and . The output features are generated by Equation (18), which is shown in Figure 2.
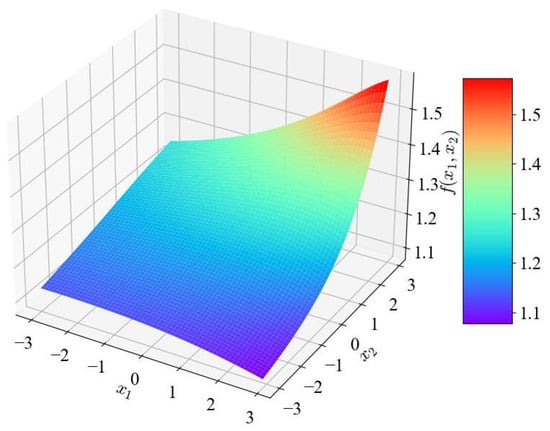
Figure 2.
Function for synthetic dataset.
Different types of noises are added to the dataset to evaluate the effectiveness of the proposed algorithm. Consider the label of the training sample to be of the form , where is noise sampled according to the noise distribution. The synthetic dataset is affected by five different types of noise: symmetric homoscedastic noise, symmetric heteroscedastic noise, asymmetric homoscedastic noise, asymmetric and heteroscedastic, and asymmetric heteroscedastic noise that varies with the independent variable. Samples generated by the bivariate function are polluted with noise. Five noisy training datasets are generated as follows:
Type I.
is the Gaussian noise with a normal distribution , whereas is the data label that contains symmetric homoscedastic noise.
Type II.
is the Gaussian noise whose distribution obeys , where is a random number on the interval , is the data label containing symmetric heteroscedastic noise.
Type III.
is the Chi square noise whose distribution obeys . is the data label containing asymmetric and homoscedastic noise.
Type IV.
is the Chi square noise with a Chi square distribution , where n is the random number on the interval . is the data label containing asymmetric and heteroscedastic noise.
Type V.
is the data label containing asymmetric and heteroscedastic noise where the noise varies significantly with the independent variable x.
The probability density function of Gaussian distribution is shown in Figure 3. The mean is zero and the variance is 2. The skewness of Gaussian distribution is 0. This distribution is symmetric.
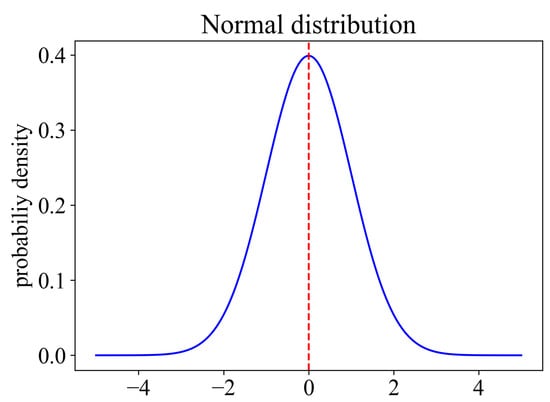
Figure 3.
The probability density function of Gaussian distribution .
The probability density function of is shown in Figure 4. The mean of is zero and the variance of is 8. The skewness of is . This distribution is asymmetric.
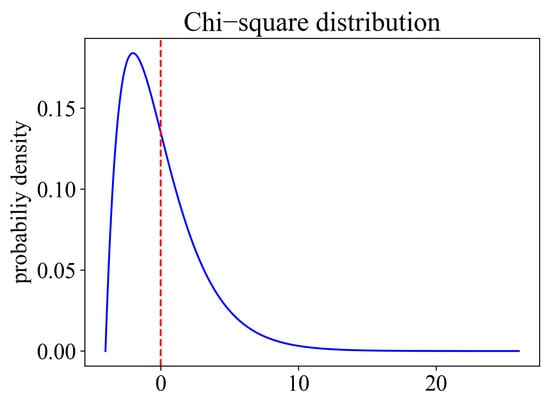
Figure 4.
The probability density function of Chi square distribution .
The noise level is determined by the ratio of noisy data in the training set, which are set to 0%, 5%, 20%, 40%, 50%, or 60%. The training set consists of 5000 samples with noise, and the test set consists of 5000 samples without noise. The experimental results are listed in Table 3, Table 4, Table 5, Table 6 and Table 7. The performance of TIPOSVR demonstrates its effectiveness in making accurate predictions across diverse datasets.

Table 3.
Operation results of algorithms under the influence of noise type I for synthetic dataset.

Table 4.
Operation results of algorithms under the influence of noise typeII for synthetic dataset.

Table 5.
Operation results of algorithms under the influence of noise type III for synthetic dataset.

Table 6.
Operation results of algorithms under the influence of noise typeIV for synthetic dataset.

Table 7.
Operation results of algorithms under the influence of noise type V for synthetic dataset.
Table 3 lists the accuracy and learning time of algorithms for the symmetric homovariance noise dataset. The most outstanding results of each indicator are in bold font. At a low noise level, the performance of the various algorithms is comparable, yet TIPOSVR’s running time is significantly longer than the other comparison algorithms. The benefits of TIPOSVR are not particularly noticeable in datasets that are symmetric and have a low level of noise. However, when the noise level is high, TIPOSVR outperforms the comparison algorithm.
The accuracy and learning time of various algorithms for symmetric heteroscedastic noise datasets are summarized in Table 4. The MAE and RMSE of the TIPOSVR are lowest when the noise rate is 5%, 40%, 50%, and 60%, showing that the TIPOSVR has achieved an excellent matching effect. TIPOSVR is trained with the minimum time when the noise rates are 50% and 60%, indicating that it provides accurate predictions while saving computational resources. TIPOSVR shows the best accuracy and is followed by NROR and SVQR. -insensitive loss provides the worst accuracy for datasets corrupted by heteroscedastic noise. The performance of asymmetric -insensitive loss and truncated asymmetric -insensitive loss is superior to that of symmetric loss, indicating that the ability to deal with heteroscedastic noise can be significantly enhanced by adjusting the asymmetric parameters.
Results of different algorithms on asymmetric homoscedastic noise are tabulated in Table 5. In the absence of noise, the time and accuracy performance of SVQR is clearly superior to other methods. The evidence indicates that truncation has no effect on data regression when there is no noise, however, it will cause a longer running time. As the noise rate increases, the superiority of TIPOSVR becomes more and more apparent, especially when the noise rate is 40%, 50%, and 60%, where it attains the best accuracy. The results show that TIPOSVR can achieve the highest accuracy in a relatively short time for asymmetric noise.
Simulation results of algorithms for asymmetric heteroscedastic noise datasets are presented in Table 6. The experimental results show that TIPOSVR achieves the best MAE performance at overall noise levels. It yields the lowest RMSE when the noise rate is 0%, 20%, 50%, and 60%. TIPOSVR performs better than NROR. The comparison between NROR and TIPOSVR, in terms of both truncated losses, reveals that asymmetric truncated loss is more effective than symmetric loss for heteroscedastic noise. The asymmetric feature diminishes the influence of asymmetric noise on the regression function. The results confirm the theoretical analysis.
The test accuracy and learning time of different algorithms, as the noise value varies with the independent variable, are shown in Table 7. This dataset presents a more intricate situation. The noise in the dataset depends on the independent variable. More noise and outliers are likely to appear. The results show that all algorithms are sensitive to noise level. TIPOSVR is still significantly more accurate than the comparison algorithms and shows its proficiency in dealing with general noise and outliers.
In summary, the study indicates that TIPOSVR is effective when applied to datasets with different types of noise. In particular, at high noise levels (when the noise rate reaches 50% and 60%), TIPOSVR provides accurate predictions in a timely manner. This algorithm shows excellent robustness and generalizability.
5.2. Benchmark Datasets
In this section, four datasets are selected from the UCI benchmark dataset, including the Dry Bean dataset (DB), the Grid Stability Simulation dataset (EGSSD), the Abalone dataset, and the Gas Turbine Generation (CCPP). To evaluate the results, three benchmark algorithms are employed: -SVR, NROR, and SVQR. Table 8 provides an overview of the attributes and sample numbers of the UCI benchmark datasets.

Table 8.
Benchmark datasets description.
The data from the datasets are normalized and split equally into training and test datasets. Research is conducted using datasets with symmetric noise characterized by homogeneous and heteroscedastic variances. The performance of TIPOSVR is evaluated and compared with that of the comparison algorithms on the four benchmark datasets. The selection of the hyperparameters follows the same approach as that used for the synthetic datasets.
Figure 5 and Figure 6 shows the MAE and RMSE values obtained from TIPOSVR and the comparison algorithms for the UCI benchmark datasets with homogeneous Gaussian noise added. No remarkable disparity is observed in the performance of the four methods without noise when analyzing the A dataset. The performance of -SVR and SVQR vary significantly as the noise rate increases. When the noise rate reaches 40%, 50% and 60%, TIPOSVR and NROR demonstrate superior performance compared to the other two methods. In the majority of cases, TIPOSVR has been found to be the most effective. When the noise rate reaches 60%, it is only inferior to NROR. On dataset B, TIPOSVR, NROR and -SVR demonstrate the same level of performance with no noise present. As the noise rate increases, both -SVR and SVQR display more variations. The variation of both TIPOSVR and NROR are less than that of the two methods mentioned above. At noise rates of 40% and 50%, TIPOSVR proves to be more effective than NROR. At a noise rate of 60%, TIPOSVR and NROR demonstrate comparable results. In comparison to SVQR, the performance of TIPOSVR, NROR and -SVR on the C dataset are superior when the noise level is 0, 5%, 20% and 40%. At noise rates of 50% and 60%, NROR and TIPOSVR show superior performance compared to the other two methods, with TIPOSVR exhibiting the best results. For the D dataset, NROR and TIPOSVR demonstrate the same level of performance, regardless of the noise rate, which is superior to the other two methods. In terms of noise, the RMSE of TIPOSVR is smaller than that of NROR.
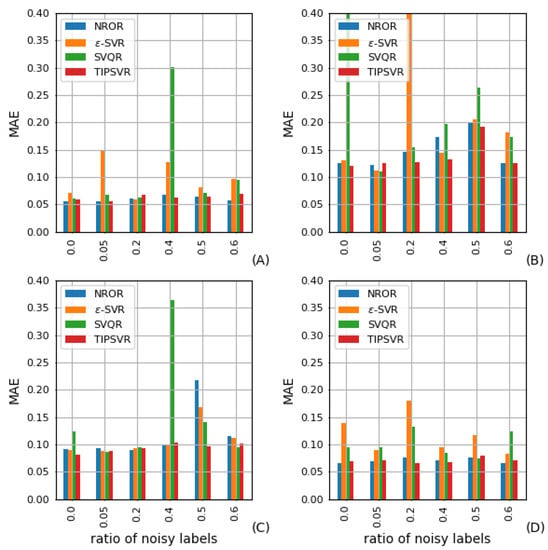
Figure 5.
MAE for Gaussian noise of homogeneity on (A) CCPP, (B) DB, (C) EGSSD, (D) Abalone.
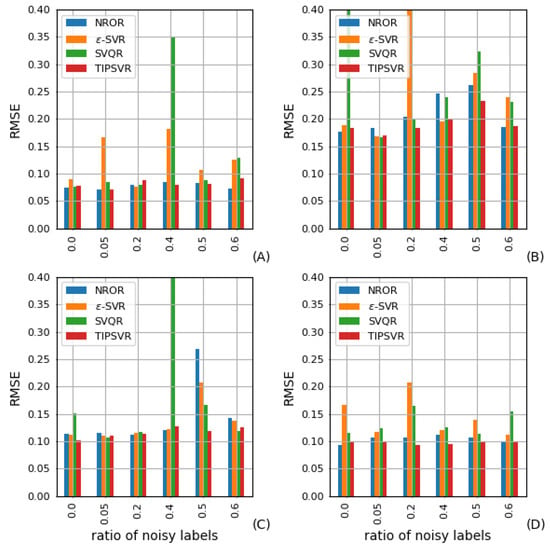
Figure 6.
RMSE for noise of homogeneity on (A) CCPP, (B) DB, (C) EGSSD, (D) Abalone.
The data indicate that TIPOSVR does not excel in symmetric homogeneity datasets at low noise rate, and may even be inferior to NROR. At a high noise rate, TIPOSVR’s performance is equivalent to NROR, surpassing the other two comparison algorithms, and even surpassing NROR in some cases. TIPOSVR has been found to be successful in dealing with regression problems that have a high noise level.
The bar graph in Figure 7 and Figure 8 illustrate the MAE and RMSE of each algorithm for the benchmark datasets with heteroscedastic noise added. If the noise rate is not more than 40% for datasets A and C, there is no significant distinction between the four methods. At noise rates of 40%, 50% and 60%, NROR and TIPOSVR demonstrate superior performance compared to -SVR and SVQR, with TIPOSVR displaying the best results at 60%. At a noise rate of 20%, NROR and TIPOSVR prove to be more effective than SVQR and -SVR when applied to dataset B. Furthermore, when the noise rate increases to 50% and 60%, TIPOSVR outperforms NROR. In the D dataset, TIPOSVR and NROR have consistently demonstrated better performance than SVQR and -SVR. TIPOSVR and NROR demonstrated an equivalent level of performance.
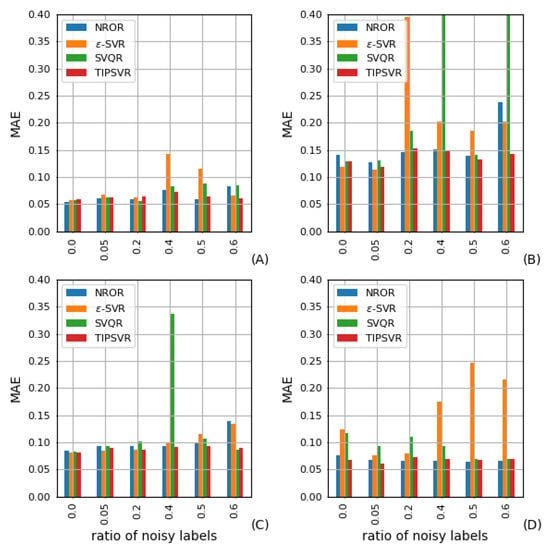
Figure 7.
MAE for noise of heteroscedasticity on (A) CCPP, (B) DB, (C) EGSSD, (D) Abalone.
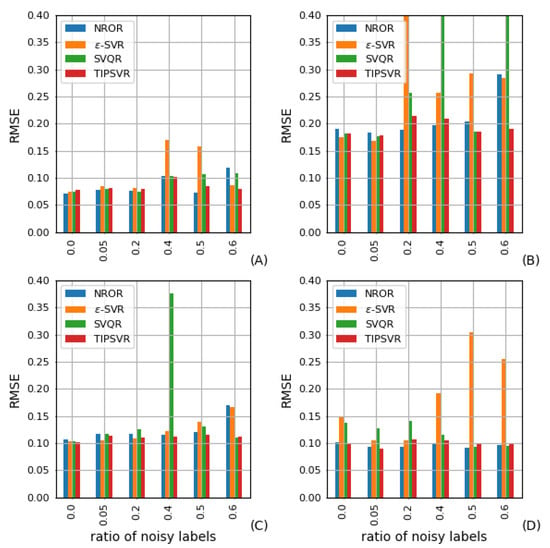
Figure 8.
RMSE for noise of heteroscedasticity on (A) CCPP, (B) DB, (C) EGSSD, (D) Abalone.
It is observable that in the dataset with heteroscedasticity noise, when the noise rate is high, TIPOSVR and NROR have comparable performance, and TIPOSVR are usually more effective than NROR. The loss function that accounts for asymmetry exhibits improved performance.
5.3. Real Datasets
We perform an experiment using actual data from the gas consumption dataset [37]. The dataset consists of 18 features: minimum temperature (minT), average temperature (aveT), maximum temperature (maxT), minimum dew point (minD), average dew point (aveD), maximum dew point (maxD), minimum humidity (minH), average humidity (aveH), maximum humidity (maxH), minimum visibility (minV), average visibility (aveV), maximum visibility (maxV), minimum air pressure (minA), average air pressure (aveA), maximum air pressure (maxA), minimum wind speed (minW), average wind speed (aveW) and maximum wind speed (maxW), and the prediction label is Natural Gas Consumption (NGC).
No noise is added to the data labels on the real datasets. The training set and the test set are divided into equal parts. The parameters and comparison algorithms settings remain the same as before, and the calculation results are presented in Table 9.

Table 9.
Evaluation table based on real dataset experimental result.
Table 9 illustrates the performance of various algorithms on an actual dataset. In Table 9, TIPOSVR is shown to perform optimally with an MAE of 0.059 and an RMSE of 0.102, indicating its ability to provide a reliable estimate of the real datasets. TIPOSVR remains a viable option compared to other algorithms when dealing with real-world problems.
In summary, all datasets show the effectiveness of TIPOSVR. It is still possible to accurately represent the data distribution even though it is corrupted by noise or outliers. This indicates that the algorithm is advantageous in handling noisy data and lends itself to regression in the data flow.
6. Conclusions
In this paper, we review the progress of SVR and find that the existing regression algorithms are insufficient to effectively predict dynamic data streams containing noise and outliers effectively.
This study introduces TIPL to assess instantaneous risk in the SVR model. This new loss function is a combination of asymmetry loss and truncated non-convex loss function that offers a variety of advantages. TIPL adjusts the weights of the penalties for both positive and negative errors using asymmetric parameters . allows us to partition the fixed width of the -insensitive area without sacrificing its sparsity. Horizontal truncation is used to deal with large noise and outliers. TIPL incorporates and extends the pinball loss, -insensitive loss, and truncated -insensitive loss.
Within the regularization framework, a TIPL-based online SVR algorithm is developed to perform robust regression in a data flow context. Given the non-convexity of the proposed model, an online gradient descent algorithm is chosen to solve the problem.
Experiments are performed on synthetic datasets, UCI datasets, and real datasets corrupted by Gaussian, heteroscedastic, asymmetric, and outlier noise. Our model has been found to be more resilient to noise and outliers than some classical and advanced methods. It also has better prediction performance and faster learning speed. The proposed model is therefore expected to provide more accurate predictions in the dynamic flow of data while consuming fewer computational resources than the batch learning approach.
The main disadvantage of this model lies in the use of multiple hyperparameters. Choosing the appropriate parameter values is essential for the algorithm to achieve optimal performance. In our ongoing research, we aim to develop techniques for determining the optimal hyperparameters for a given training set.
Supplementary Materials
The following supporting information can be downloaded at: https://www.mdpi.com/article/10.3390/math11030709/s1.
Author Contributions
Conceptualization, X.S. and Z.Z.; methodology, X.S., J.Y. and Z.Z.; software, Y.X.; writing—original draft preparation, X.S., X.L. and Z.Z. All authors have read and agreed to the published version of the manuscript.
Funding
This research was partially supported by the National Natural Science Foundation of China under Grant No. 71901219.
Institutional Review Board Statement
Not applicable.
Informed Consent Statement
Not applicable.
Data Availability Statement
The datasets used in this paper are all available at the following links: 1. http://archive.ics.uci.edu/ml/ (accessed on 12 December 2022); 2. http://www.csie.ntu.edu.tw/~cjlin/libsvmtools/datasets/ (accessed on 12 December 2022).
Acknowledgments
This work is supported by National Natural Science Foundation of China (Grant No. 71901219).
Conflicts of Interest
The authors declare no conflict of interest.
Abbreviations
The following abbreviations are used in this manuscript:
| SVR | Support Vector Regression |
| TIPL | Truncated -insensitive pinball loss function |
| TIPOSVR | Support Vector Regression based on Truncated -insensitive pinball loss function |
References
- Hu, Q.; Zhang, S.; Xie, Z.; Mi, J.S.; Wan, J. Noise model based ε-support vector regression with its application to short-term wind speed forecasting. Neural Netw. 2014, 57, 1–11. [Google Scholar] [CrossRef] [PubMed]
- Hu, Q.; Zhang, S.; Yu, M.; Xie, Z. Short-Term Wind Speed or Power Forecasting With Heteroscedastic Support Vector Regression. IEEE Trans. Sustain. Energy 2015, 7, 1–9. [Google Scholar] [CrossRef]
- Ramedani, Z.; Omid, M.; Keyhani, A.; Band, S.; Khoshnevisan, B. Potential of radial basis function based support vector regression for global solar radiation prediction. Renew. Sust. Energ. Rev. 2014, 39, 1005–1011. [Google Scholar] [CrossRef]
- Khemchandani, R.; Dr, J.; Chandra, S. Regularized least squares fuzzy support vector regression for financial time series forecasting. Expert Syst. Appl. 2009, 36, 132–138. [Google Scholar] [CrossRef]
- Lu, C.J.; Lee, T.S.; Chiu, C.C. Financial time series forecasting using independent component analysis and support vector regression. Decis. Support Syst. 2009, 47, 115–125. [Google Scholar] [CrossRef]
- Philip, A.; Ramadurai, G.; Vanajakshi, L. Urban Arterial Travel Time Prediction Using Support Vector Regression. Transp. Dev. Econ. 2018, 4, 7. [Google Scholar] [CrossRef]
- Awad, M.; Khanna, R. Support Vector Regression. In Efficient Learning Machines: Theories, Concepts, and Applications for Engineers and System Designers; Apress: Berkeley, CA, USA, 2015; pp. 67–80. [Google Scholar] [CrossRef]
- Wang, K.; Zhong, P. Robust non-convex least squares loss function for regression with outliers. Knowl.-Based Syst. 2014, 71, 290–302. [Google Scholar] [CrossRef]
- Zhang, H.C.; Wu, Q.; Li, F.Y. Application of online multitask learning based on least squares support vector regression in the financial market. Appl. Soft. Comput. 2022, 121, 108754. [Google Scholar] [CrossRef]
- Vapnik, V. The Nature of Statistical Learning Theory; Springer: New York, NY, USA, 2000; Volume 8, pp. 1–15. [Google Scholar] [CrossRef]
- Vapnik, V. Statistical Learning Theory; Springer: New York, NY, USA, 1998. [Google Scholar]
- Balasundaram, S.; Prasad, S. On pairing Huber support vector regression. Appl. Soft. Comput. 2020, 97, 106708. [Google Scholar] [CrossRef]
- Balasundaram, S.; Meena, Y. Robust Support Vector Regression in Primal with Asymmetric Huber Loss. Neural Process. Lett. 2019, 49, 1399–1431. [Google Scholar] [CrossRef]
- Wu, J.; Wang, Y.G.; Tian, Y.C.; Burrage, K.; Cao, T. Support vector regression with asymmetric loss for optimal electric load forecasting. Energy 2021, 2021, 119969. [Google Scholar] [CrossRef]
- Ye, Y.; Shao, Y.; Li, C.; Hua, X.; Guo, Y. Online support vector quantile regression for the dynamic time series with heavy-tailed noise. Appl. Soft. Comput. 2021, 110, 107560. [Google Scholar] [CrossRef]
- Yang, L.; Dong, H. Robust support vector machine with generalized quantile loss for classification and regression. Appl. Soft. Comput. 2019, 81, 105483. [Google Scholar] [CrossRef]
- Koenker, R.; D’Orey, V. Algorithm AS 229: Computing Regression Quantiles. Appl. Stat. 1987, 36, 383. [Google Scholar] [CrossRef]
- Yang, L.; Dong, H. Support vector machine with truncated pinball loss and its application in pattern recognition. Chemom. Intell. Lab. Syst. 2018, 177, 89–99. [Google Scholar] [CrossRef]
- Singla, M.; Ghosh, D.; Shukla, K.; Pedrycz, W. Robust Twin Support Vector Regression Based on Rescaled Hinge Loss. Pattern Recognit. 2020, 105, 107395. [Google Scholar] [CrossRef]
- Tang, L.; Tian, Y.; Li, W.; Pardalos, P. Valley-loss regular simplex support vector machine for robust multiclass classification. Knowl.-Based Syst. 2021, 216, 106801. [Google Scholar] [CrossRef]
- Safari, A. An e-E-insensitive support vector regression machine. Comput. Stat. 2014, 29, 6. [Google Scholar] [CrossRef]
- Liang, X.; Zhipeng, Z.; Song, Y.; Jian, L. Kernel-based Online Regression with Canal Loss. Eur. J. Oper. Res. 2021, 297, 268–279. [Google Scholar] [CrossRef]
- Jian, L.; Gao, F.; Ren, P.; Song, Y.; Luo, S. A Noise-Resilient Online Learning Algorithm for Scene Classification. Remote Sens. 2018, 10, 1836. [Google Scholar] [CrossRef]
- Zinkevich, M. Online Convex Programming and Generalized Infinitesimal Gradient Ascent. In Proceedings of the International Conference on Machine Learning, Los Angeles, CA, USA, 23–24 June 2003. [Google Scholar]
- Karal, O. Maximum likelihood optimal and robust Support Vector Regression with lncosh loss function. Neural Netw. 2017, 94, 1–12. [Google Scholar] [CrossRef] [PubMed]
- Huang, X.; Shi, L.; Pelckmans, K.; Suykens, J. Asymmetric -tube support vector regression. Comput. Stat. Data Anal. 2014, 77, 371–382. [Google Scholar] [CrossRef]
- Anand, P.; Khemchandani, R.; Chandra, S. A v-Support Vector Quantile Regression Model with Automatic Accuracy Control. Res. Rep. Comput. Sci. 2022, 113–135. [Google Scholar] [CrossRef]
- Tanveer, M.; Tiwari, A.; Choudhary, R.; Jalan, S. Sparse pinball twin support vector machines. Appl. Soft. Comput. 2019, 78. [Google Scholar] [CrossRef]
- Zhao, Y.P.; Sun, J.G. Robust truncated support vector regression. Expert Syst. Appl. 2010, 37, 5126–5133. [Google Scholar] [CrossRef]
- Li, X.; Xu, X. Optimization and decision-making with big data. Soft Comput. 2018, 22, 5197–5199. [Google Scholar] [CrossRef]
- Xu, X.; Liu, W.; Yu, L. Trajectory prediction for heterogeneous traffic-agents using knowledge correction data-driven model. Inf. Sci. 2022, 608, 375–391. [Google Scholar] [CrossRef]
- Chen, L.; Zhang, J.; Ning, H. Robust large-scale online kernel learning. Neural Comput. Appl. 2022, 34, 1–21. [Google Scholar] [CrossRef]
- Shalev-Shwartz, S.; Singer, Y.; Srebro, N.; Cotter, A. Pegasos: Primal estimated sub-gradient solver for SVM. Math. Program. 2011, 127, 3–30. [Google Scholar] [CrossRef]
- Wang, X.; Han, M. Online sequential extreme learning machine with kernels for nonstationary time series prediction. Neurocomputing 2014, 145, 90–97. [Google Scholar] [CrossRef]
- Santos, J.; Barreto, G. A Regularized Estimation Framework for Online Sparse LSSVR Models. Neurocomputing 2017, 238, 114–125. [Google Scholar] [CrossRef]
- Lei, H.; Chen, X.; Jian, L. Canal-LASSO: A sparse noise-resilient online linear regression model. Intell. Data Anal. 2020, 24, 993–1010. [Google Scholar] [CrossRef]
- Wei, N.; Yin, L.; Li, C.; Li, C.; Chan, C.; Zeng, F. Forecasting the daily natural gas consumption with an accurate white-box model. Energy 2021, 232, 121036. [Google Scholar] [CrossRef]
Disclaimer/Publisher’s Note: The statements, opinions and data contained in all publications are solely those of the individual author(s) and contributor(s) and not of MDPI and/or the editor(s). MDPI and/or the editor(s) disclaim responsibility for any injury to people or property resulting from any ideas, methods, instructions or products referred to in the content. |
© 2023 by the authors. Licensee MDPI, Basel, Switzerland. This article is an open access article distributed under the terms and conditions of the Creative Commons Attribution (CC BY) license (https://creativecommons.org/licenses/by/4.0/).