
Design and Analysis of Extended Exponentially Weighted Moving Average Signed-Rank Control Charts for Monitoring the Process Mean


Abstract
:1. Introduction
2. Materials and Methods
2.1. Control Charts
2.1.1. Exponentially Weighted Moving Average Control Chart (EWMA)
2.1.2. Extended Exponentially Weighted Moving Average (EEWMA) Control Chart
2.1.3. Exponentially Weighted Moving Average-Sign Control Chart (EWMA-SN)
2.1.4. Exponentially Weighted Moving Average-Sign Rank Control Chart (EWMA-SR)
2.1.5. Extended Exponentially Weighted Moving Average-Sign Control Chart (EEWMA-SN)
2.1.6. Extended Exponentially Weighted Moving Average-Sign Rank Control Chart (EEWMA-SR)
2.2. Performance Evaluation
- (i)
- Create n random samples from any particular distribution.
- (ii)
- Estimate the proposed tracking statistic and evaluate “H” at .
- (iii)
- The control limit is subsequently determined and the values statistic is operated.
- (iv)
- Continue to iterate 100,000 times (N) to calculate the ARL and assess the control chart effectiveness.
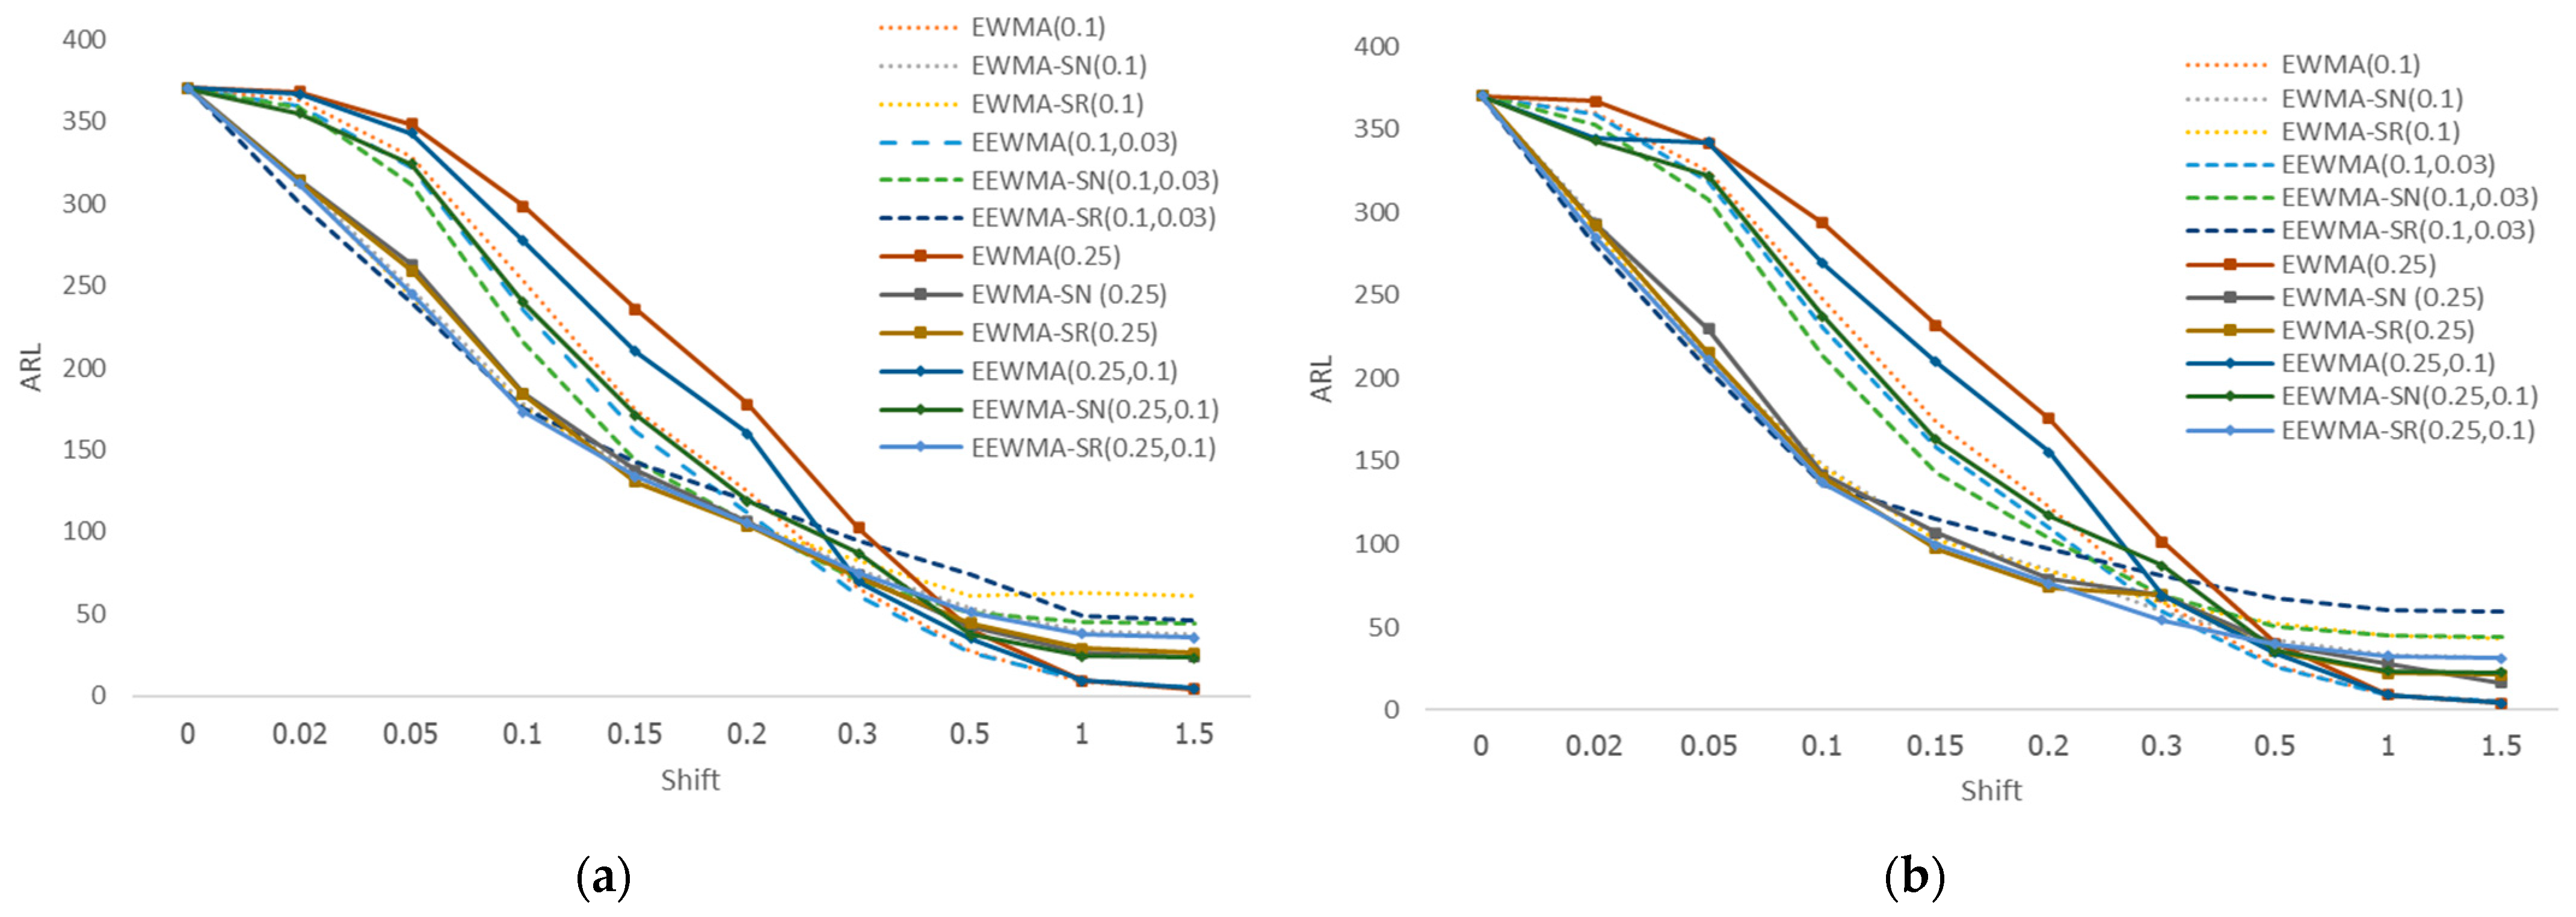
3. Results
3.1. Simulation
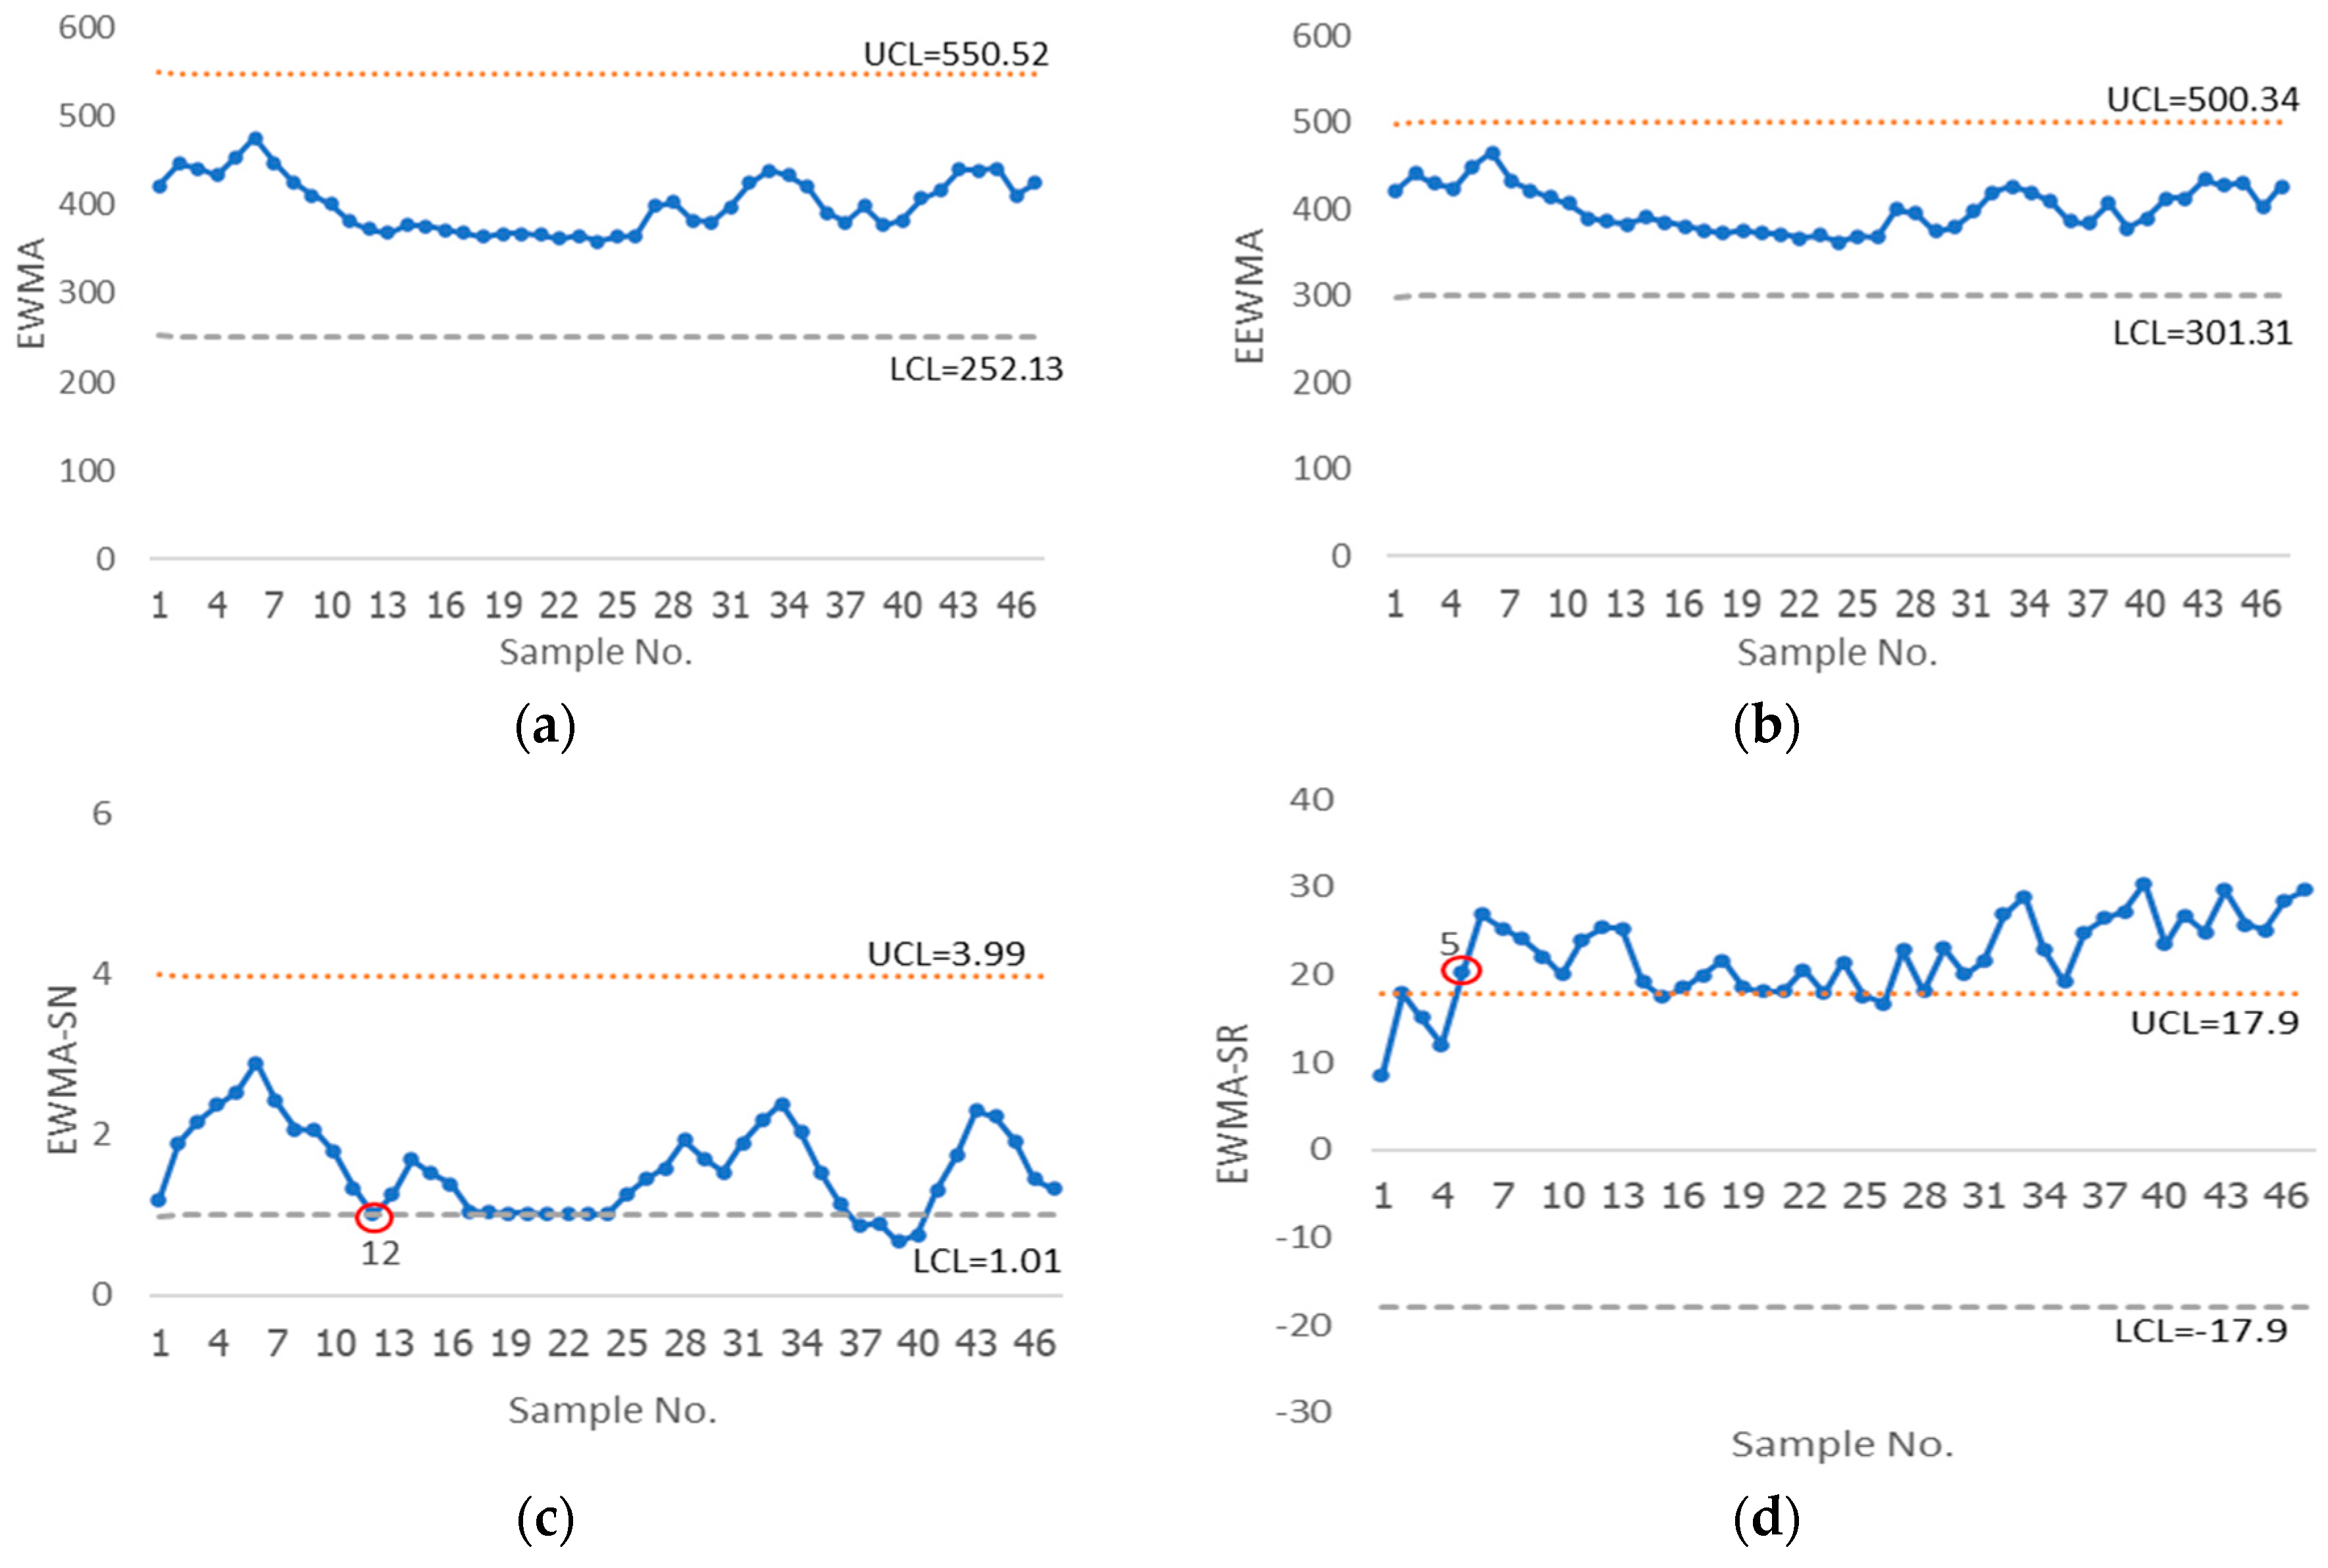
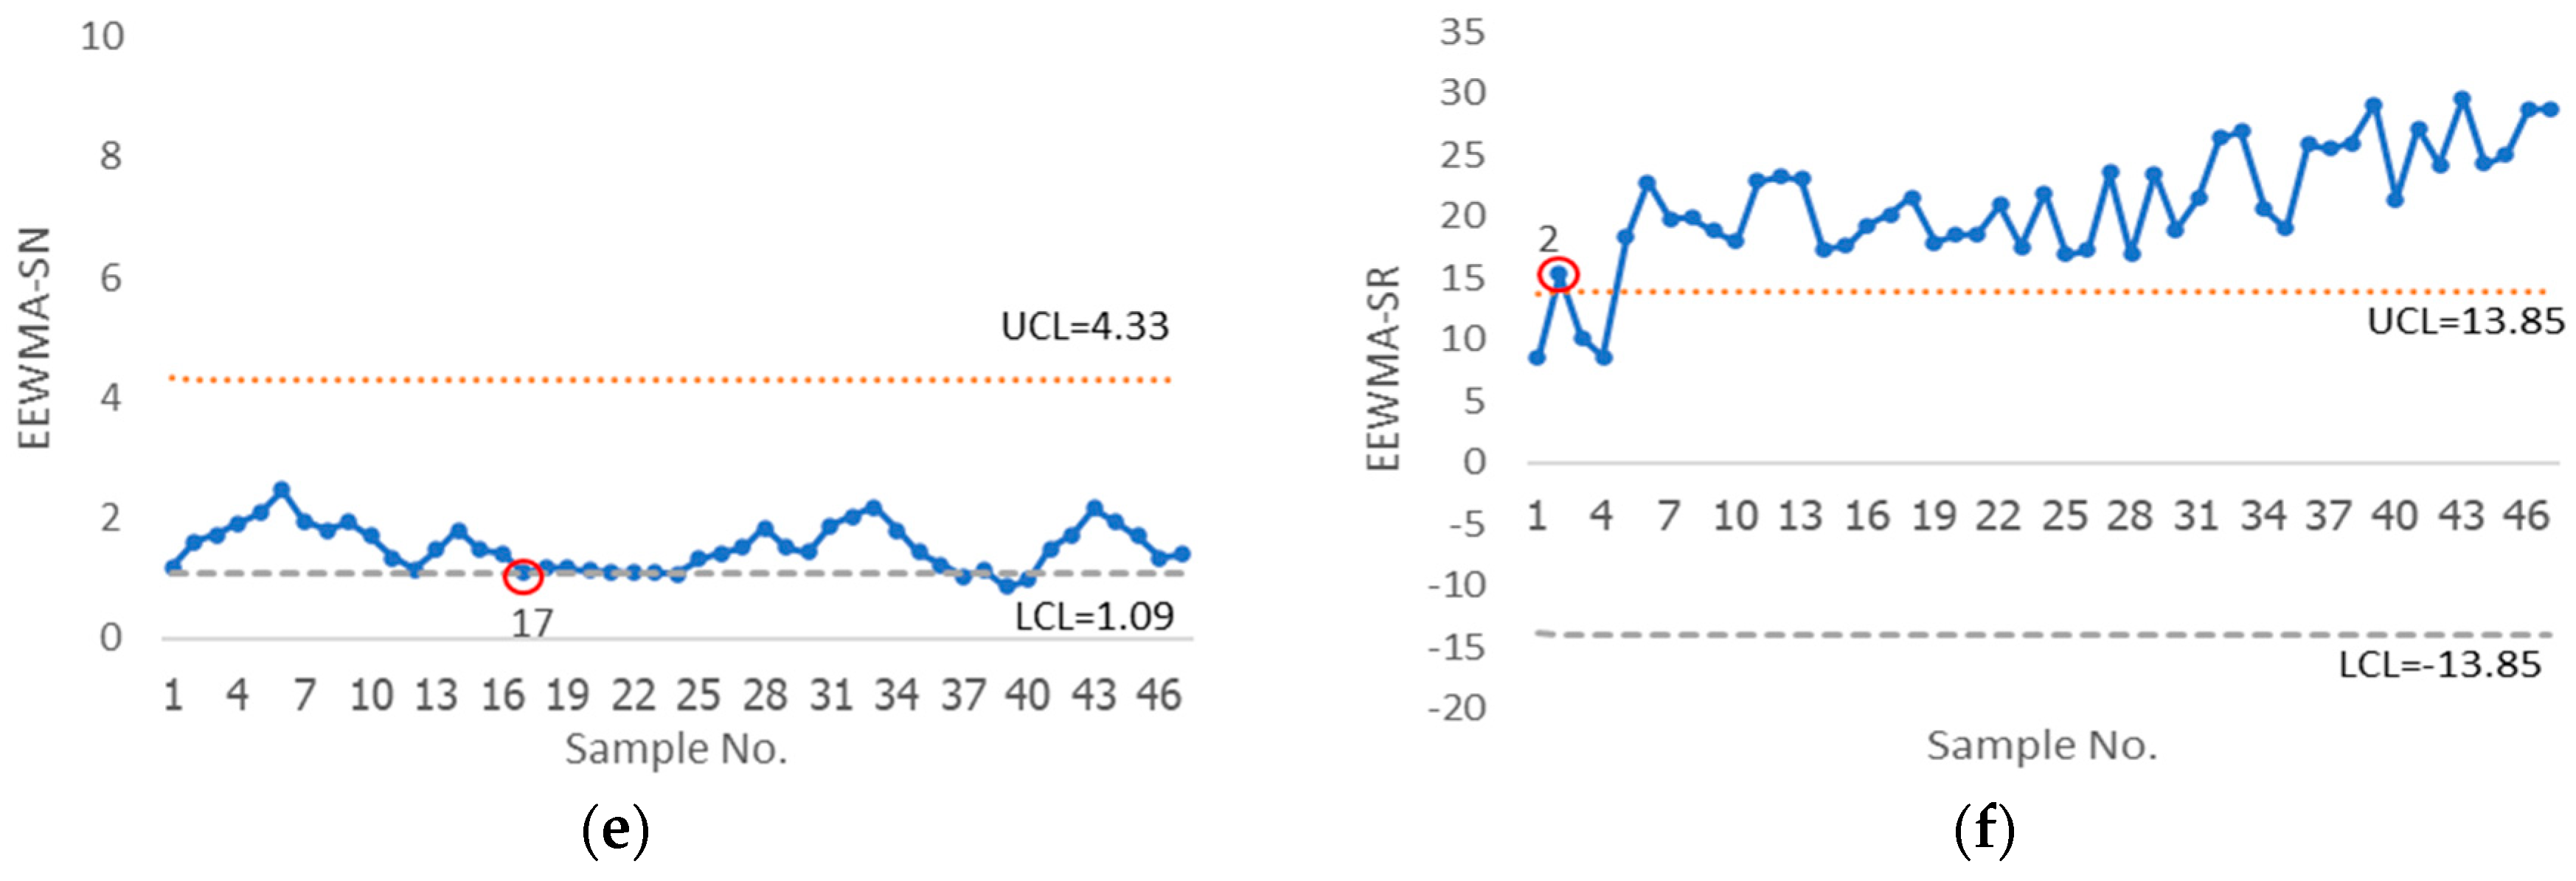
3.2. Application
4. Discussion and Conclusions
Author Contributions
Funding
Data Availability Statement
Acknowledgments
Conflicts of Interest
Appendix A
References
- Shewhart, W.A. Economic Control of Quality of Manufactured Product; D. Van Nostrand Co.: New York, NY, USA, 1931. [Google Scholar]
- Khoo, M.B.C. A Moving Average Control Chart for Monitoring the Fraction Non-conforming. Qual. Reliab. Eng. Int. 2004, 20, 617–635. [Google Scholar] [CrossRef]
- Roberts, S.W. Control Chart Tests Based on Geometric Moving Averages. Technometrics 1959, 1, 239–250. [Google Scholar] [CrossRef]
- Page, E.S. Continuous Inspection Schemes. Biometrika 1954, 41, 100–115. [Google Scholar] [CrossRef]
- Naveed, M.; Azam, M.; Khan, N.; Aslam, M. Design of a Control Chart Using Extended EWMA Statistic. Technologies 2018, 6, 108. [Google Scholar] [CrossRef]
- Yang, S.F.; Lin, J.S.; Cheng, S.W. A New Nonparametric EWMA Sign Control Chart. Expert Syst. Appl. 2011, 38, 6239–6243. [Google Scholar] [CrossRef]
- Lu, S.L. An Extended Nonparametric Exponentially Weighted Moving Average Sign Control Chart. Qual. Reliab. Eng. Int. 2015, 31, 3–13. [Google Scholar] [CrossRef]
- Sukparungsee, S. Robustness of Generally Weighted Moving Average Signed-rank Control Chart for Monitoring a Shift of Skew Processes. Int. J. Sci. Technol. Res. 2018, 4, 125–137. [Google Scholar] [CrossRef]
- Abid, M.; Nazir, H.Z.; Tahir, M.; Riaz, M. On designing a New Cumulative Sum Wilcoxon Signed Rank Chart for Monitoring Process Location. PLoS ONE 2018, 13, e0195762. [Google Scholar] [CrossRef] [PubMed]
- Pawar, V.Y.; Shirke, D.T.; Khilare, S.K. Nonparametric Moving Average Control Charts Using Sign and Signed-rank Statistics. Int. J. Sci. Res. Math. Stat. Sci. 2018, 5, 171–178. [Google Scholar] [CrossRef]
- Aslam, M.; Raza, M.A.; Azam, M.; Ahmad, L.; Jun, C.-H. Design of a Sign Chart using A New EWMA Statistic. Commun. Stat. 2020, 49, 1299–1310. [Google Scholar] [CrossRef]
- Rasheed, Z.; Zhang, H.; Arslan, M.; Zaman, B.; Anwar, M.S.; Abid, M.; Abbasi, A.S. An Efficient Robust Nonparametric Triple EWMA Wilcoxon Signed-Rank Control Chart for Process Location. Math. Probl. Eng. 2021, 2021, 2570198. [Google Scholar] [CrossRef]
- Ali, S.; Abbas, Z.; Nazir, Z.H.; Riaz, M.; Abid, M. A New Distribution-Free Control Chart for Monitoring Process Median Based on the Statistic of the Sign Test. J. Test. Eval. 2022, 50, 20210135. [Google Scholar] [CrossRef]
- Taboran, R.; Sukparungsee, S. An Enhanced Performance to Monitor Process Mean with Modified Exponentially Weighted Moving Average—Sign Control Chart. Appl. Sci. Eng. Prog. 2022, 15, 5532. [Google Scholar] [CrossRef]
- Abbas, Z.; Nazir, Z.H.; Akhtar, N.; Abid, M.; Riaz, M. Non-Parametric Progressive Signed-Rank Control Chart for Monitoring the Process Location. J. Stat. Comput. Simul. 2022, 92, 2596–2622. [Google Scholar] [CrossRef]
- Petcharat, K.; Sukparungsee, S. Development of a New MEWMA-Wilcoxon Sign Rank Chart for Detection of Change in Mean Parameter. Appl. Sci. Eng. Prog. 2023, 16, 5892. [Google Scholar] [CrossRef]
- Graham, M.A.; Chakraborti, S.; Human, S.W. A Nonparametric Exponentially Weighted Moving Average Signed-rank Chart for Monitoring Location. Comput. Stat. Data Anal. 2011, 55, 2490–2503. [Google Scholar] [CrossRef]
- Alevizakos, V.; Chatterjee, K.; Koukouvinos, C. The Triple Exponentially Weighted Moving Average Control Chart. Qual. Technol. Quant. Manag. 2021, 18, 326–354. [Google Scholar] [CrossRef]
- Ali, S.; Abbas, Z.; Nazir, Z.H.; Riaz, M.; Zhang, X.; Li, Y. On Designing Non-Parametric EWMA Sign Chart under Ranked Set Sampling Scheme with Application to Industrial Process. Mathematics 2020, 8, 1497. [Google Scholar] [CrossRef]
- Office of Agricultural Economics. Available online: https://www.oae.go.th/ (accessed on 30 August 2023).


| Shift | EWMA | EWMA-SN | EWMA-SR | EEWMA | EEWMA-SN | EEWMA-SR |
|---|---|---|---|---|---|---|
| 0 | 370.01 | 370.41 | 370.14 | 370.13 | 370.19 | 370.53 |
| 0.02 | 363.28 | 314.22 | 313.14 | 359.36 | 358.40 | 300.31 |
| 0.05 | 328.94 | 248.09 | 243.76 | 322.04 | 311.82 | 239.52 |
| 0.1 | 252.96 | 178.04 | 175.99 | 235.56 | 215.72 | 175.64 |
| 0.15 | 174.65 | 135.78 | 132.63 | 160.98 | 143.61 | 142.40 |
| 0.2 | 124.87 | 106.95 | 104.05 | 111.64 | 104.65 | 119.41 |
| 0.3 | 65.94 | 77.01 | 82.58 | 60.97 | 70.07 | 95.19 |
| 0.5 | 27.37 | 53.36 | 60.74 | 26.76 | 50.63 | 74.42 |
| 1 | 8.75 | 39.84 | 62.91 | 9.18 | 45.12 | 48.54 |
| 1.5 | 4.85 | 37.50 | 60.61 | 5.16 | 44.45 | 46.49 |
| Shift | EWMA | EWMA-SN | EWMA-SR | EEWMA | EEWMA-SN | EEWMA-SR |
| 0 | 370.45 | 370.43 | 370.25 | 370.34 | 370.23 | 370.31 |
| 0.02 | 368.00 | 314.21 | 313.80 | 366.91 | 355.33 | 311.88 |
| 0.05 | 348.39 | 263.15 | 259.40 | 342.85 | 324.12 | 245.14 |
| 0.1 | 298.49 | 184.13 | 184.07 | 277.38 | 239.93 | 173.10 |
| 0.15 | 235.74 | 137.56 | 130.61 | 210.21 | 171.39 | 133.74 |
| 0.2 | 177.78 | 106.38 | 103.98 | 160.08 | 118.93 | 105.13 |
| 0.3 | 102.51 | 73.34 | 72.08 | 69.85 | 87.12 | 74.86 |
| 0.5 | 40.49 | 42.68 | 44.62 | 35.26 | 37.28 | 51.12 |
| 1 | 9.24 | 26.20 | 29.02 | 9.25 | 24.52 | 37.77 |
| 1.5 | 4.17 | 23.61 | 26 | 4.51 | 23.45 | 35.49 |
| Shift | EWMA | EWMA-SN | EWMA-SR | EEWMA | EEWMA-SN | EEWMA-SR |
|---|---|---|---|---|---|---|
| 0 | 370.14 | 370.56 | 370.41 | 370.54 | 370.69 | 370.28 |
| 0.02 | 360.16 | 295.92 | 289.51 | 359.13 | 353.21 | 280.08 |
| 0.05 | 324.87 | 211.79 | 209.30 | 318.99 | 308.29 | 205.06 |
| 0.1 | 247.24 | 147.51 | 147.20 | 230.74 | 213.18 | 136.42 |
| 0.15 | 174.03 | 104.05 | 102.39 | 158.17 | 142.84 | 115.30 |
| 0.2 | 122.65 | 84.69 | 84.03 | 109.63 | 103.66 | 97.70 |
| 0.3 | 64.75 | 59.86 | 64.72 | 59.61 | 69.44 | 80.96 |
| 0.5 | 27.21 | 42.24 | 51.8 | 26.23 | 50.19 | 67.89 |
| 1 | 8.73 | 33.08 | 44.6 | 9.14 | 45.17 | 60.38 |
| 1.5 | 4.79 | 31.38 | 43.34 | 5.22 | 44.47 | 59.21 |
| Shift | EWMA | EWMA-SN | EWMA-SR | EEWMA | EEWMA-SN | EEWMA-SR |
| 0 | 370.34 | 370.55 | 370.62 | 370.21 | 370.31 | 370.25 |
| 0.02 | 367.21 | 293.45 | 292.46 | 344.77 | 343.38 | 285.31 |
| 0.05 | 341.43 | 229.69 | 215.33 | 342.34 | 322.35 | 210.93 |
| 0.1 | 293.82 | 142.27 | 140.35 | 269.37 | 237.34 | 137.21 |
| 0.15 | 232.24 | 106.89 | 97.35 | 210.11 | 163.06 | 99.67 |
| 0.2 | 176.03 | 79.09 | 74.12 | 155.76 | 117.17 | 76.24 |
| 0.3 | 101.42 | 69.30 | 69.59 | 69.16 | 87.09 | 54.23 |
| 0.5 | 40.24 | 39.28 | 35.3 | 34.39 | 35.88 | 39.70 |
| 1 | 9.04 | 28.01 | 22.41 | 9.15 | 23.70 | 32.50 |
| 1.5 | 4.14 | 16.37 | 21.28 | 4.40 | 22.62 | 31.24 |
| Shift | EWMA | EWMA-SN | EWMA-SR | EEWMA | EEWMA-SN | EEWMA-SR |
|---|---|---|---|---|---|---|
| 0 | 370.84 | 370.44 | 370.46 | 370.08 | 370.53 | 370.56 |
| 0.02 | 366.98 | 354.32 | 353.14 | 366.11 | 352.29 | 346.99 |
| 0.05 | 355.17 | 327.87 | 326.54 | 352.87 | 313.99 | 313.46 |
| 0.1 | 315.77 | 284.31 | 283.17 | 308.61 | 239.78 | 238.95 |
| 0.15 | 267.38 | 265.06 | 264.97 | 252.44 | 170.96 | 168.63 |
| 0.2 | 214.72 | 238.59 | 238.09 | 203.02 | 127.89 | 120.61 |
| 0.3 | 155.85 | 82.89 | 80.16 | 127.58 | 80.38 | 114.35 |
| 0.5 | 57.75 | 54.31 | 52.37 | 71.67 | 52.64 | 105.71 |
| 1 | 18.07 | 41.76 | 49.83 | 23.79 | 45.16 | 97.70 |
| 1.5 | 9.62 | 40.12 | 44.94 | 13.66 | 45.00 | 92.06 |
| Shift | EWMA | EWMA-SN | EWMA-SR | EEWMA | EEWMA-SN | EEWMA-SR |
| 0 | 370.92 | 370.42 | 370.50 | 370.35 | 370.32 | 370.31 |
| 0.02 | 370.21 | 356.67 | 353.85 | 368.59 | 356.12 | 348.27 |
| 0.05 | 365.65 | 333.58 | 327.72 | 364.25 | 331.43 | 318.61 |
| 0.1 | 350.87 | 283.99 | 283.46 | 347.98 | 267.65 | 256.66 |
| 0.15 | 328.27 | 266.08 | 265.12 | 326.91 | 196.59 | 189.11 |
| 0.2 | 304.36 | 238.74 | 238.64 | 301.52 | 150.06 | 143.32 |
| 0.3 | 239.78 | 93.93 | 90.42 | 233.40 | 91.81 | 119.41 |
| 0.5 | 142.23 | 47.76 | 45.15 | 136.80 | 46.37 | 107.65 |
| 1 | 34.96 | 43.34 | 44.52 | 38.10 | 39.38 | 101.82 |
| 1.5 | 14.19 | 41.09 | 40.76 | 14.84 | 31.24 | 92.51 |
| Shift | EWMA | EWMA-SN | EWMA-SR | EEWMA | EEWMA-SN | EEWMA-SR |
|---|---|---|---|---|---|---|
| 0 | 370.58 | 370.61 | 370.54 | 370.23 | 370.83 | 370.33 |
| 0.02 | 366.45 | 363.10 | 347.56 | 366.05 | 349.10 | 343.49 |
| 0.05 | 344.40 | 334.62 | 318.83 | 314.10 | 310.41 | 307.83 |
| 0.1 | 313.62 | 285.91 | 273.19 | 259.18 | 234.88 | 217.34 |
| 0.15 | 265.87 | 240.50 | 244.24 | 176.71 | 168.10 | 142.43 |
| 0.2 | 210.24 | 216.19 | 215.08 | 129.79 | 124.15 | 123.54 |
| 0.3 | 138.29 | 127.79 | 73.38 | 91.32 | 79.82 | 85.28 |
| 0.5 | 52.80 | 68.38 | 51.66 | 55.55 | 52.64 | 59.17 |
| 1 | 17.29 | 52.57 | 48.51 | 17.47 | 45.08 | 41.18 |
| 1.5 | 8.70 | 47.53 | 46.95 | 9.36 | 45.00 | 39.36 |
| Shift | EWMA | EWMA-SN | EWMA-SR | EEWMA | EEWMA-SN | EEWMA-SR |
| 0 | 370.13 | 370.64 | 370.55 | 370.68 | 370.32 | 370.29 |
| 0.02 | 358.59 | 356.78 | 345.46 | 358.06 | 356.12 | 341.33 |
| 0.05 | 357.26 | 332.97 | 314.31 | 354.89 | 331.43 | 312.15 |
| 0.1 | 336.54 | 270.52 | 269.50 | 327.96 | 267.65 | 242.02 |
| 0.15 | 321.88 | 240.31 | 234.79 | 320.62 | 196.59 | 140.21 |
| 0.2 | 301.13 | 209.88 | 206.42 | 293.17 | 150.06 | 105.98 |
| 0.3 | 237.38 | 126.76 | 89.50 | 230.41 | 91.81 | 93.89 |
| 0.5 | 139.29 | 70.54 | 45.15 | 130.14 | 46.37 | 63.72 |
| 1 | 26.55 | 52.21 | 40.68 | 39.35 | 39.38 | 50.25 |
| 1.5 | 13.29 | 47.32 | 39.29 | 17.02 | 31.24 | 44.72 |
| Shift | EWMA | EWMA-SN | EWMA-SR | EEWMA | EEWMA-SN | EEWMA-SR |
|---|---|---|---|---|---|---|
| 0 | 370.83 | 370.48 | 370.32 | 370.13 | 370.35 | 370.51 |
| 0.02 | 340.78 | 269.29 | 266.98 | 340.21 | 329.21 | 260.76 |
| 0.05 | 296.56 | 178.96 | 175.36 | 287.07 | 263.58 | 169.78 |
| 0.1 | 220.96 | 103.91 | 101.76 | 219.84 | 183.50 | 96.71 |
| 0.15 | 177.34 | 70.58 | 68.51 | 171.83 | 130.76 | 63.64 |
| 0.2 | 134.57 | 49.02 | 50.04 | 134.00 | 100.97 | 46.34 |
| 0.3 | 89.02 | 31.01 | 29.47 | 86.67 | 71.89 | 34.11 |
| 0.5 | 42.88 | 18.34 | 18.19 | 47.42 | 54.25 | 22.33 |
| 1 | 13.38 | 10.65 | 11.32 | 15.78 | 49.21 | 14.36 |
| 1.5 | 6.32 | 6.19 | 9.76 | 7.54 | 49.02 | 12.61 |
| Shift | EWMA | EWMA-SN | EWMA-SR | EEWMA | EEWMA-SN | EEWMA-SR |
| 0 | 370.86 | 370.80 | 370.54 | 370.26 | 370.38 | 370.32 |
| 0.02 | 341.83 | 303.99 | 302.66 | 340.53 | 332.56 | 281.57 |
| 0.05 | 302.37 | 213.45 | 203.04 | 301.26 | 289.25 | 186.14 |
| 0.1 | 250.19 | 127.71 | 120.75 | 245.23 | 226.65 | 105.04 |
| 0.15 | 209.52 | 82.99 | 77.87 | 203.44 | 167.11 | 68.87 |
| 0.2 | 169.58 | 57.66 | 54.33 | 163.59 | 113.96 | 47.39 |
| 0.3 | 117.79 | 31.16 | 28.27 | 111.09 | 80.72 | 28.28 |
| 0.5 | 58.83 | 14.61 | 13.75 | 61.79 | 62.33 | 15.30 |
| 1 | 14.67 | 6.38 | 6.59 | 16.35 | 17.85 | 8.85 |
| 1.5 | 5.55 | 4.71 | 5.34 | 6.53 | 11.42 | 7.43 |
| Shift | EWMA | EWMA-SN | EWMA-SR | EEWMA | EEWMA-SN | EEWMA-SR |
|---|---|---|---|---|---|---|
| 0 | 370.44 | 370.35 | 370.29 | 370.04 | 370.24 | 370.02 |
| 0.02 | 334.74 | 242.06 | 240.29 | 334.47 | 326.52 | 226.49 |
| 0.05 | 284.19 | 148.84 | 139.16 | 282.18 | 260.16 | 133.51 |
| 0.1 | 220.19 | 76.15 | 71.18 | 217.02 | 181.98 | 70.34 |
| 0.15 | 172.38 | 47.13 | 46.56 | 170.73 | 127.23 | 44.05 |
| 0.2 | 135.31 | 35.23 | 35.56 | 132.52 | 96.30 | 32.10 |
| 0.3 | 88.19 | 22.37 | 20.54 | 86.32 | 70.85 | 24.72 |
| 0.5 | 42.75 | 14.16 | 13.03 | 46.86 | 51.44 | 16.53 |
| 1 | 13.37 | 8.41 | 8.76 | 15.67 | 49.07 | 10.98 |
| 1.5 | 6.36 | 6.34 | 7.35 | 7.59 | 48.81 | 9.67 |
| Shift | EWMA | EWMA-SN | EWMA-SR | EEWMA | EEWMA-SN | EEWMA-SR |
| 0 | 370.61 | 370.46 | 370.28 | 370.35 | 370.44 | 370.11 |
| 0.02 | 339.71 | 279.98 | 271.11 | 338.06 | 322.20 | 251.30 |
| 0.05 | 299.55 | 170.92 | 168.95 | 298.78 | 281.66 | 148.21 |
| 0.1 | 248.61 | 93.11 | 81.23 | 245.13 | 220.73 | 72.55 |
| 0.15 | 205.89 | 54.25 | 47.91 | 202.48 | 166.59 | 45.30 |
| 0.2 | 167.10 | 34.70 | 30.28 | 163.28 | 110.12 | 30.09 |
| 0.3 | 116.40 | 18.52 | 16.88 | 110.40 | 78.34 | 17.97 |
| 0.5 | 58.02 | 9.08 | 8.37 | 63.25 | 63.09 | 10.56 |
| 1 | 14.55 | 4.47 | 4.50 | 15.88 | 17.41 | 6.19 |
| 1.5 | 5.56 | 3.56 | 4.05 | 6.76 | 11.37 | 5.23 |
Disclaimer/Publisher’s Note: The statements, opinions and data contained in all publications are solely those of the individual author(s) and contributor(s) and not of MDPI and/or the editor(s). MDPI and/or the editor(s) disclaim responsibility for any injury to people or property resulting from any ideas, methods, instructions or products referred to in the content. |
© 2023 by the authors. Licensee MDPI, Basel, Switzerland. This article is an open access article distributed under the terms and conditions of the Creative Commons Attribution (CC BY) license (https://creativecommons.org/licenses/by/4.0/).
Share and Cite
Talordphop, K.; Areepong, Y.; Sukparungsee, S. Design and Analysis of Extended Exponentially Weighted Moving Average Signed-Rank Control Charts for Monitoring the Process Mean. Mathematics 2023, 11, 4482. https://doi.org/10.3390/math11214482
Talordphop K, Areepong Y, Sukparungsee S. Design and Analysis of Extended Exponentially Weighted Moving Average Signed-Rank Control Charts for Monitoring the Process Mean. Mathematics. 2023; 11(21):4482. https://doi.org/10.3390/math11214482
Chicago/Turabian StyleTalordphop, Khanittha, Yupaporn Areepong, and Saowanit Sukparungsee. 2023. "Design and Analysis of Extended Exponentially Weighted Moving Average Signed-Rank Control Charts for Monitoring the Process Mean" Mathematics 11, no. 21: 4482. https://doi.org/10.3390/math11214482
APA StyleTalordphop, K., Areepong, Y., & Sukparungsee, S. (2023). Design and Analysis of Extended Exponentially Weighted Moving Average Signed-Rank Control Charts for Monitoring the Process Mean. Mathematics, 11(21), 4482. https://doi.org/10.3390/math11214482