1. Introduction
Diabetes, commonly referred to as diabetes mellitus, is one of the rapidly growing health concerns in the world [
1,
2]. It is considered to be a metabolic disorder disease caused by either the pancreas not being able to produce insulin which leads to type I diabetes or by insulin resistance developing near the body tissues on the glucose-regulatory action of the insulin which leads to type II diabetes. The latter is the most common accounting for almost 80% of the reported cases world-wide. In both type I and type II, the plasma glucose levels are not within the normal range. The amount of plasma glucose is controlled by a glucose homeostasis mechanism regulated by two hormones, namely insulin and glucagon. Insulin is secreted by the
-cells while glucagon is secreted by the
-cells found in the Langerhans of the human pancreas [
2].
For the body to function optimally, it requires optimal plasma glucose levels. The optimal plasma glucose levels fall within a very tight range of between 70 mg/dL ((3.90 mmol/L) and 110 mg/dL (7.00 mmol/L) [
3]. Maintaining this ranges is essential in the management and control of diabetes. It also aids in delaying the onset of long-term complications caused by hyperglycaemia (>120 mg/dL (7.00 mmol/L)) or hypoglycaemia (<70 mg/dL (3.90 mmol/L). In the case of hyperglycaemia, the glucose molecules diffuse into the
-cells leading to an increase of the ratio between adenosine triphosphate (ATP) and the adenosine diphosphate (ADP) inside the
-cells that will cause an increased release of insulin [
4]. Insulin resistance and an inadequate secretion of insulin hormone among diabetics are considered to be causal factors of hyperglycaemia. Insulin resistance occurs when the
-cells in the liver, muscles and adipose cells become less sensitive to the insulin hormones [
5]. Due to this, any consumption of food rich in carbohydrates causes elevated levels of plasma glucose. The interaction between the insulin released and the glucose molecules leads to usage and storage of excessive plasma glucose in the liver, adipocyte tissues and skeletal muscles [
5].
On the other hand, glucagon resistance leads to hypoglycaemia. Glucagon occurs when there is a limited response to the glycogenolysis and gluconeogenesis actions by the glucagon receptors in the
-cells. The risk factors associated with hypoglycaemia includes kidney diseases, prolonged fasting and excess endogenous insulin secretion [
6]. Other causes are insulin overdose and drugs used to treat diabetes mellitus [
7]. When hypoglycaemia occurs, the
-cells are considered to be inactive causing an elevation of ATP to ADP ratio inside the
-cells which leads to the release of glucagon hormone that stimulates glucagon receptors in the kidney, liver and adipose tissues [
4]. The role of the glucagon receptors is to maintain the plasma glucose homeostasis by regulating the glycogenolysis and gluconeogenesis processes [
8]. A failure in this regulatory process leads to the plasma glucose levels that are outside the normal range leading to complications experienced by diabetic patients.
It is also noted that there is a link between stress and type II diabetes mellitus [
9]. This could be explained by the fact that some reactions by human beings to a stressor include developing unhealthy lifestyles—for instance, eating disorders. Moreover, the physiological changes that occur due to stress may affect the neuroendocrine and immune systems [
10]. In the neuroendocrine system, a stressor causes the hypothalamus in the hypothalamo–pituitary–adrenal (HPA) axis to secrete corticotropin-releasing factor, which prompts the release of adrenocorticotropic. The adrenocorticotropic causes the adrenal cortex to secrete glucocorticoid hormones—specifically, the cortisol. The cortisol is considered to be one of the factors influencing the glucose metabolism and other metabolism processes including the breakdown of lipids, carbohydrates and proteins. It also leads to a rise of the plasma glucose levels by stimulating the hepatic gluconeogenesis while inhibiting the insulin actions [
11]. The glucose released by the hepatic gluconeogenesis process, if not used, remains in the bloodstream leading to a rise in plasma glucose.
Therefore, a constant monitoring of the plasma glucose levels using glucometers by diabetes patients is needed. This approach is commonly used to ensure corrective interventions if any are instituted promptly whenever a significant deviation from the acceptable plasma glucose ranges is noticed. Some of the interventions include oral medication and insulin therapy, which involves the subcutaneous insulin injection at prescribed dossal units at regular time interval. For the accepted target to be realized, a strict adherence to monitoring and the institution of prescribed interventions are necessary. However, the constant monitoring of the plasma may sometimes fail due to factors beyond the control of the patient leading to complications such as retinopathy, neuropathy, comatose and dizziness. To overcome these challenges, scientist have developed mathematical and computer simulation models for the prediction of plasma glucose dynamics and trajectories based on the characteristics of insulin secretion and glucose utilization. Most of these models are designed to simulate the glucose-insulin dynamics in vivo [
12]. A number of these models are based on Ordinary Differential Equations [
13,
14], Delay Differential Equations [
15], Partial Differential Equations [
16] and Stochastic Differential Equations (SDE) [
17]. The underlying mathematical foundations of the developed system dynamics model is the SDE. SDE has been adopted due to its ability to capture non-linear, continuous time measurements in a more reliable manner, and its robustness in using maximum likelihood estimation techniques [
17]. SDE is also able to model the random noise associated with system variables due to inherent uncertainties through the Weiner process term which models process diffusion.
A better prediction of the plasma glucose level trajectories using mathematical models requires proper understanding of the causal factors. Furthermore, modelling and determination of the glucose-insulin actions are complex and require a complete understanding of the glycaemic profile of an individual including the glycaemic disturbances and patient behaviour [
18]. Moreover, the typical glucose-insulin models contain sub-compartments including the glucose model, insulin deliver model, gastro-intestinal tract, muscle and adipose tissue and the liver model; but a complete human glucose-insulin is influenced by many more biological systems and processes. Some of the factors that influence plasma glucose and, hence, the biological systems include the amount of carbohydrates ingested, the level of physical exercises, the physiological state of the person (stress), the body weight (BW) of the person, the genetic disposition of the individual, the metabolic characteristics of the individual, their familial history, the gestational diabetes, their life style, their knowledge of the diabetes and the access/availability of health services, among other factors. Therefore, understanding individual information such as risk factors is key in the development of glucose-insulin simulators since they provide an effective means of identifying diabetes complications [
19].
In this study, the focus was on modelling the combined effects of the amount of carbohydrates ingested, the intensity of the physical exercise, the stress levels and the insulin therapy as the intervention strategies on the management and control of glucose dynamics of a diabetes population stock. Through this study, a clear understanding on the contribution in the management of diabetes is demonstrated. The study is conceptualized on a diagnosed diabetic state of the population stock assuming a dynamic state of a diabetic patient. This is because diagnosis is vital in the management and control of the risks associated with extreme glucose levels, both hypoglycaemia and hyperglycaemia. Moreover, diagnosis will determine the management interventions to be put in place.
2. Materials and Methods
A System Dynamics Modelling (SDM) has been adopted to build the model for determining the effect of the diabetes management and control intervention strategies involving meals, physical exercise, stress and insulin administration. The SDM is considered to be reliable in modelling complex health systems [
20]. Moreover, it provides a mechanism of understanding the dynamical changes that occur in a complex situation, such as health, with a focus on analysing the cause-and-effect relations [
21]. It also offers a whole-system-thinking approach that provides an understanding on how the interplaying factors interact and influence each other.
In SDM, causal and loop diagrams (CLDs) are used to demonstrate the interaction between sub-systems. CLDs are also used in analysing the feedback effects among the sub-systems and to show the interconnection between the state variables following the Markovian-linked chain paths approach. Furthermore, a Reinforcing-loop type of CLD is used to show the directional effect (the stocks and flows) of the head variables. In this study, meals, physical exercises and insulin administration are modelled as substantive system states while stress is modelled as a pseudo-system state since it can occur co-jointly with the other sub-systems using CLD.
Since the management and control of diabetes is a time-dependent process that occurs in a continuous manner, the SDM model is developed to capture the variables’ changes within sub-systems over a time period using Stochastic Differential Equations (SDEs). A random noise seed is also introduced to handle the time-dependent perturbations that will accompany the variables. The stocks and flows are measured per time units [
20,
22]. Therefore, the general SDE that describes the glucose-insulin dynamics involving the stocks and flow rates (inflows and outflows) of plasma glucose and insulin in the blood system is represented by the following:
where
is a continuous time-dependent system that describes the glucose-insulin dynamics,
is drift component,
is the diffusion component,
is an observation for the glucose-insulin dynamics in a state given
inputs,
is the system parameters and
is the random noise term.
Equation (1) captures the system perturbations as a result of the diffusion term of the model. In this study, we modelled the physiological perturbations that occurs as stochastic behaviours due to meals taken, physical exercises, stress levels and insulin injection as part of the system parameters. The error term in the system observation equation provides a measure for uncorrelated system errors that are likely to occur in the case of randomly occurring events.
The model is built on certain assumptions about the future based on the current intervening variables. For purposes of modelling in this study, the interventions are assumed to exhibit current characteristics in the near future. This assumption only offers a starting point for future predictions and policy analysis but can be varied. Other assumptions considered in this study include the following: insulin is infused exogenously into the system, and, therefore, the study considered an insulin-dependent patient; ingested food has a direct effect on the plasma glucose concentrations; physical exercise intensity influences the plasma glucose concentrations and decreases linearly after attaining a certain maximum value; and plasma glucose levels are influenced by the stress severity levels which is intertwined with other state variables. Applying these assumptions and borrowing from [
12] on the Bergman Minimal Model, the glucose dynamics as a consequence of carbohydrates ingested, physical exercises intensity, stress level and exogenously infused insulin, the sub-systems interactions are mathematically presented as follows:
where
is the subcutaneous insulin concentration
,
is the plasma insulin concentration
,
is the exogenous insulin infusion rate
to the subcutaneous, s is the stress levels,
is the rate of insulin removal from the circulatory system as a result of exercise-induced physiological changes
,
is the scaling parameter for the diffusion term,
represents the Wiener process which has Gaussian distribution characteristics and
are other system parameters defined in
Table 1.
Equations (3) and (4) describe the plasma insulin and subcutaneous insulin pharmacokinetics. Equation (4) is modified from the original Bergman Minimal Model to include the terms for measuring the effects of exercise and stress on insulin levels in the plasma as a result of exercise and/or stress-induced physiological changes. It is also recognized that physical exercise improves insulin sensitivity [
23] and stress decreases plasma insulin [
2].
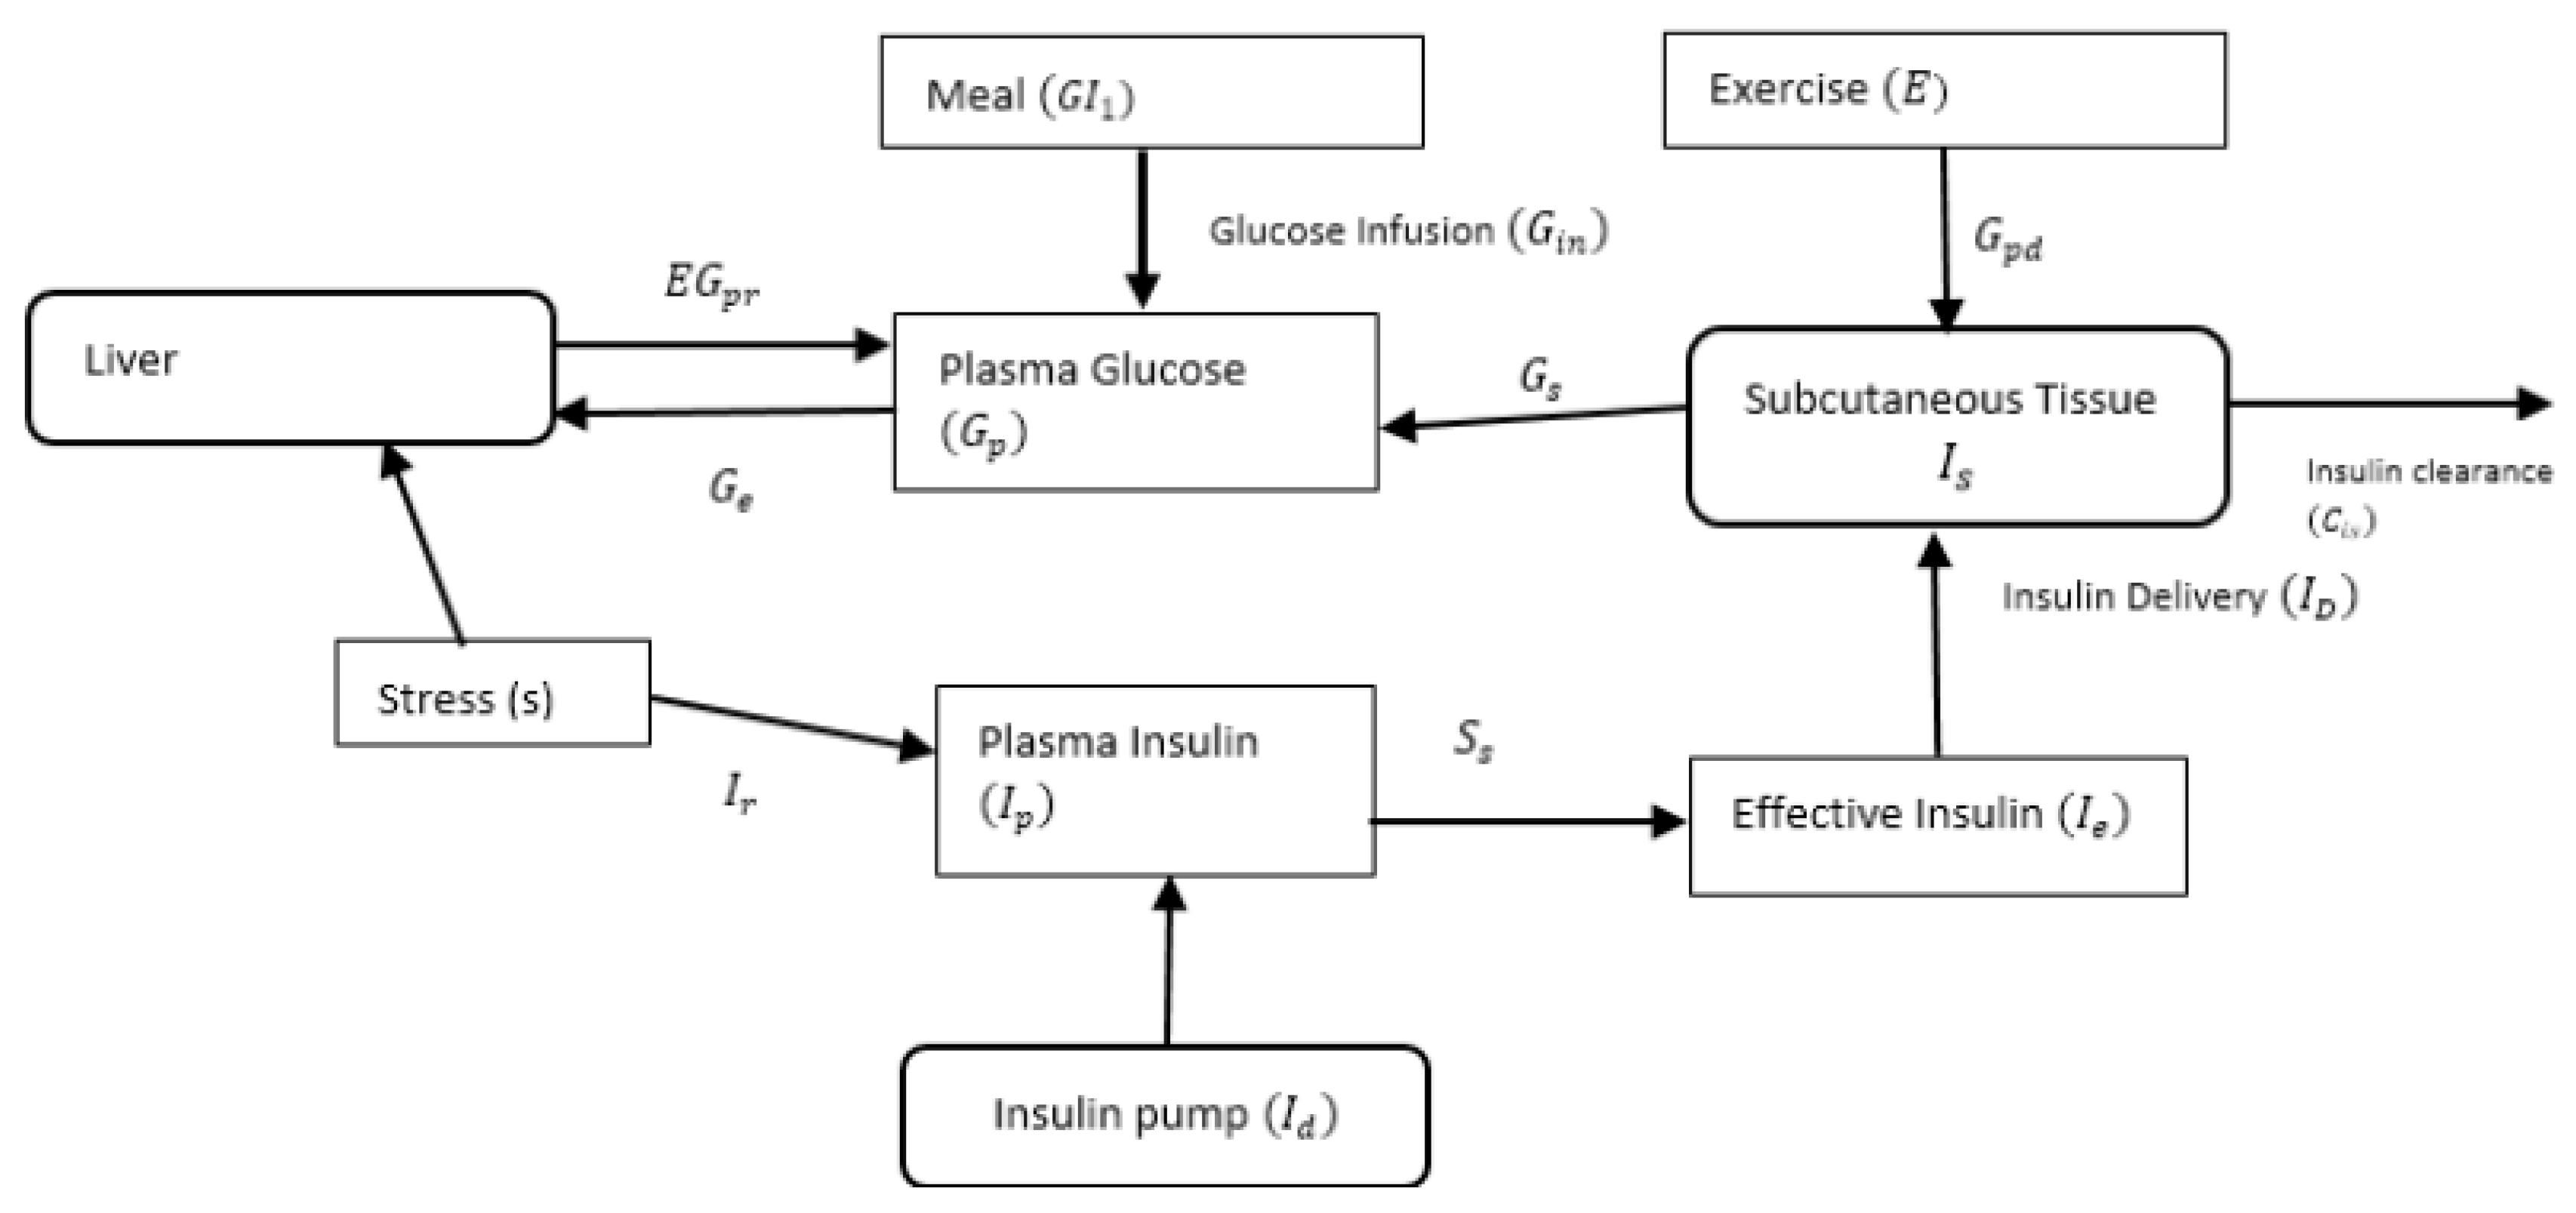
Figure 1 depicts the diagrammatic representation of the flow of glucose and insulin with associated interactions that take place in the extended
Bergman Minimal Model compartments.
From
Figure 1, dynamics interactions between insulin and glucose within the various subsystems are represented mathematically as follows:
where
measures the effect of insulin on glucose transportation
;
is the measure of insulin sensitivity
;
is the amount of plasma glucose
;
is the rate of production of the endogenous glucose when the patient has stress or no stress
;
is the amount of carbohydrates absorption delayed in a compartment (mg);
is the factor for the stress levels;
is the weight (kg) of the patient,
is the rate of hepatic glucose production due to meal, exercise and stress;
represents the rate of glycogenolysis decline due to pro-longed exercise; and
is the rate of glucose uptake during exercise.
,
and
are other system parameters described in
Table 1.
The effect of meals on the plasma glucose is dependent on the amount of carbohydrates ingested, the glucose distribution volume and the constant associated with carbohydrates movement. This effect is, therefore, mathematically represented in a two-stage compartmental model [
24]:
where
represents the amount of carbohydrates absorbed (mg),
is the amount of carbohydrates absorption delayed in a compartment (mg),
is the bioavailability associated with the carbohydrates ingested and
is the amount of ingested carbohydrate per minute
.
According to a study by [
24], the rates of hepatic glucose production
, glucose uptake
and plasma insulin removal
as a result of physical exercise is represented by the following:
where
is a measure of the maximum exercise capacity level. Other parameters are described in
Table 1.
It is also noted that the rate of glycogenolysis (
), which influences glucose-insulin dynamics as a result of physical exercise, starts to decline at a certain maximum value
and is dependent on exercise intensity and duration of the exercise [
25]. This can be represented mathematically as follows:
where
is the duration of exercise performed at exercise intensity (
) before the start of decrease in hepatic glycogenolysis [
7,
25].
The exercise intensity is also expected to decline over time following a linear fit [
25] represented by the following:
Therefore, substituting Equation (14) in Equation (13) gives the maximum value upon which glycogenolysis is likely to start to decrease as follows:
We, therefore, model
as follows:
where
and
are parameters described in
Table 1.
Table 1.
Parameters of the SDE model.
Table 1.
Parameters of the SDE model.
| Parameter | Unit | Description | Range | References |
|---|
| | Insulin clearance from the subcutaneous rate | 0.54–2.01 | [26] |
| | Time in insulin movement action due to an increase in subcutaneous | 40–131 | [26] |
| | Time in insulin movement action due to an increase in plasma insulin | 10–70 | [26] |
| | Time delay ratio in action of insulin due to an increase of insulin in plasma | 8.14 × 10⁻³–2.23 × 10⁻² | [26] |
| | Maximum time for carbohydrate absorption | Fixed at 107 | [24] |
| | Rate of oxygen consumption during glucose production | 1.3 × 10⁻³–1.9 × 10⁻³ | [27] |
| | Glucose production rate | 4.41 × 10⁻²–6.7 × 10⁻² | [27] |
| | Rate of oxygen consumption during glucose uptake | 1.5 × 10⁻³–2.4 × 10⁻³ | [27] |
| | Glucose uptake rate | 3.55 × 10⁻²–6.17 × 10⁻² | [27] |
| | Insulin clearance rate due to exercise | 1.0 × 10⁻³–1.5 × 10⁻³ | [27] |
| | Rate of insulin removal from the circulatory system | 5.88 × 10⁻²–9.12 × 10⁻² | [27] |
| | Rate of change of glycogenolysis | 8.5 × 10⁻³–1.31 × 10⁻² | [27] |
| | Time constant required for glycogenolysis to return to basal value | 1.86–10.14 | [27] |
| | Insulin sensitivity | 9.64 × 10⁻⁵–1.73 × 10⁻³ | [26] |
| | Rate of glucose production | 6.0 × 10⁻¹–3.45 | [26] |
| dl/kg | Mean volume of glucose distribution | 1.93–4.14 | [26] |
| Dimensionless | Carbohydrates bioavailability | Fixed at 0.9 | [26] |
Equations (3)–(16) represent the plasma glucose-insulin dynamical interactions within the various subsystems shown in
Figure 1. The equations are used to estimate the observable stock flows from and into the subsystems to predict the plasma glucose levels. The observation equation measuring the aggregate observations of the stock flows with an error term to account for any variabilities due to uncertainties and system imperfections is given by the following:
where
represents the errors measurements which are assumed to be identically independently distributed (iid),
denotes variance measurement of the noise associated with the plasma glucose measurements.
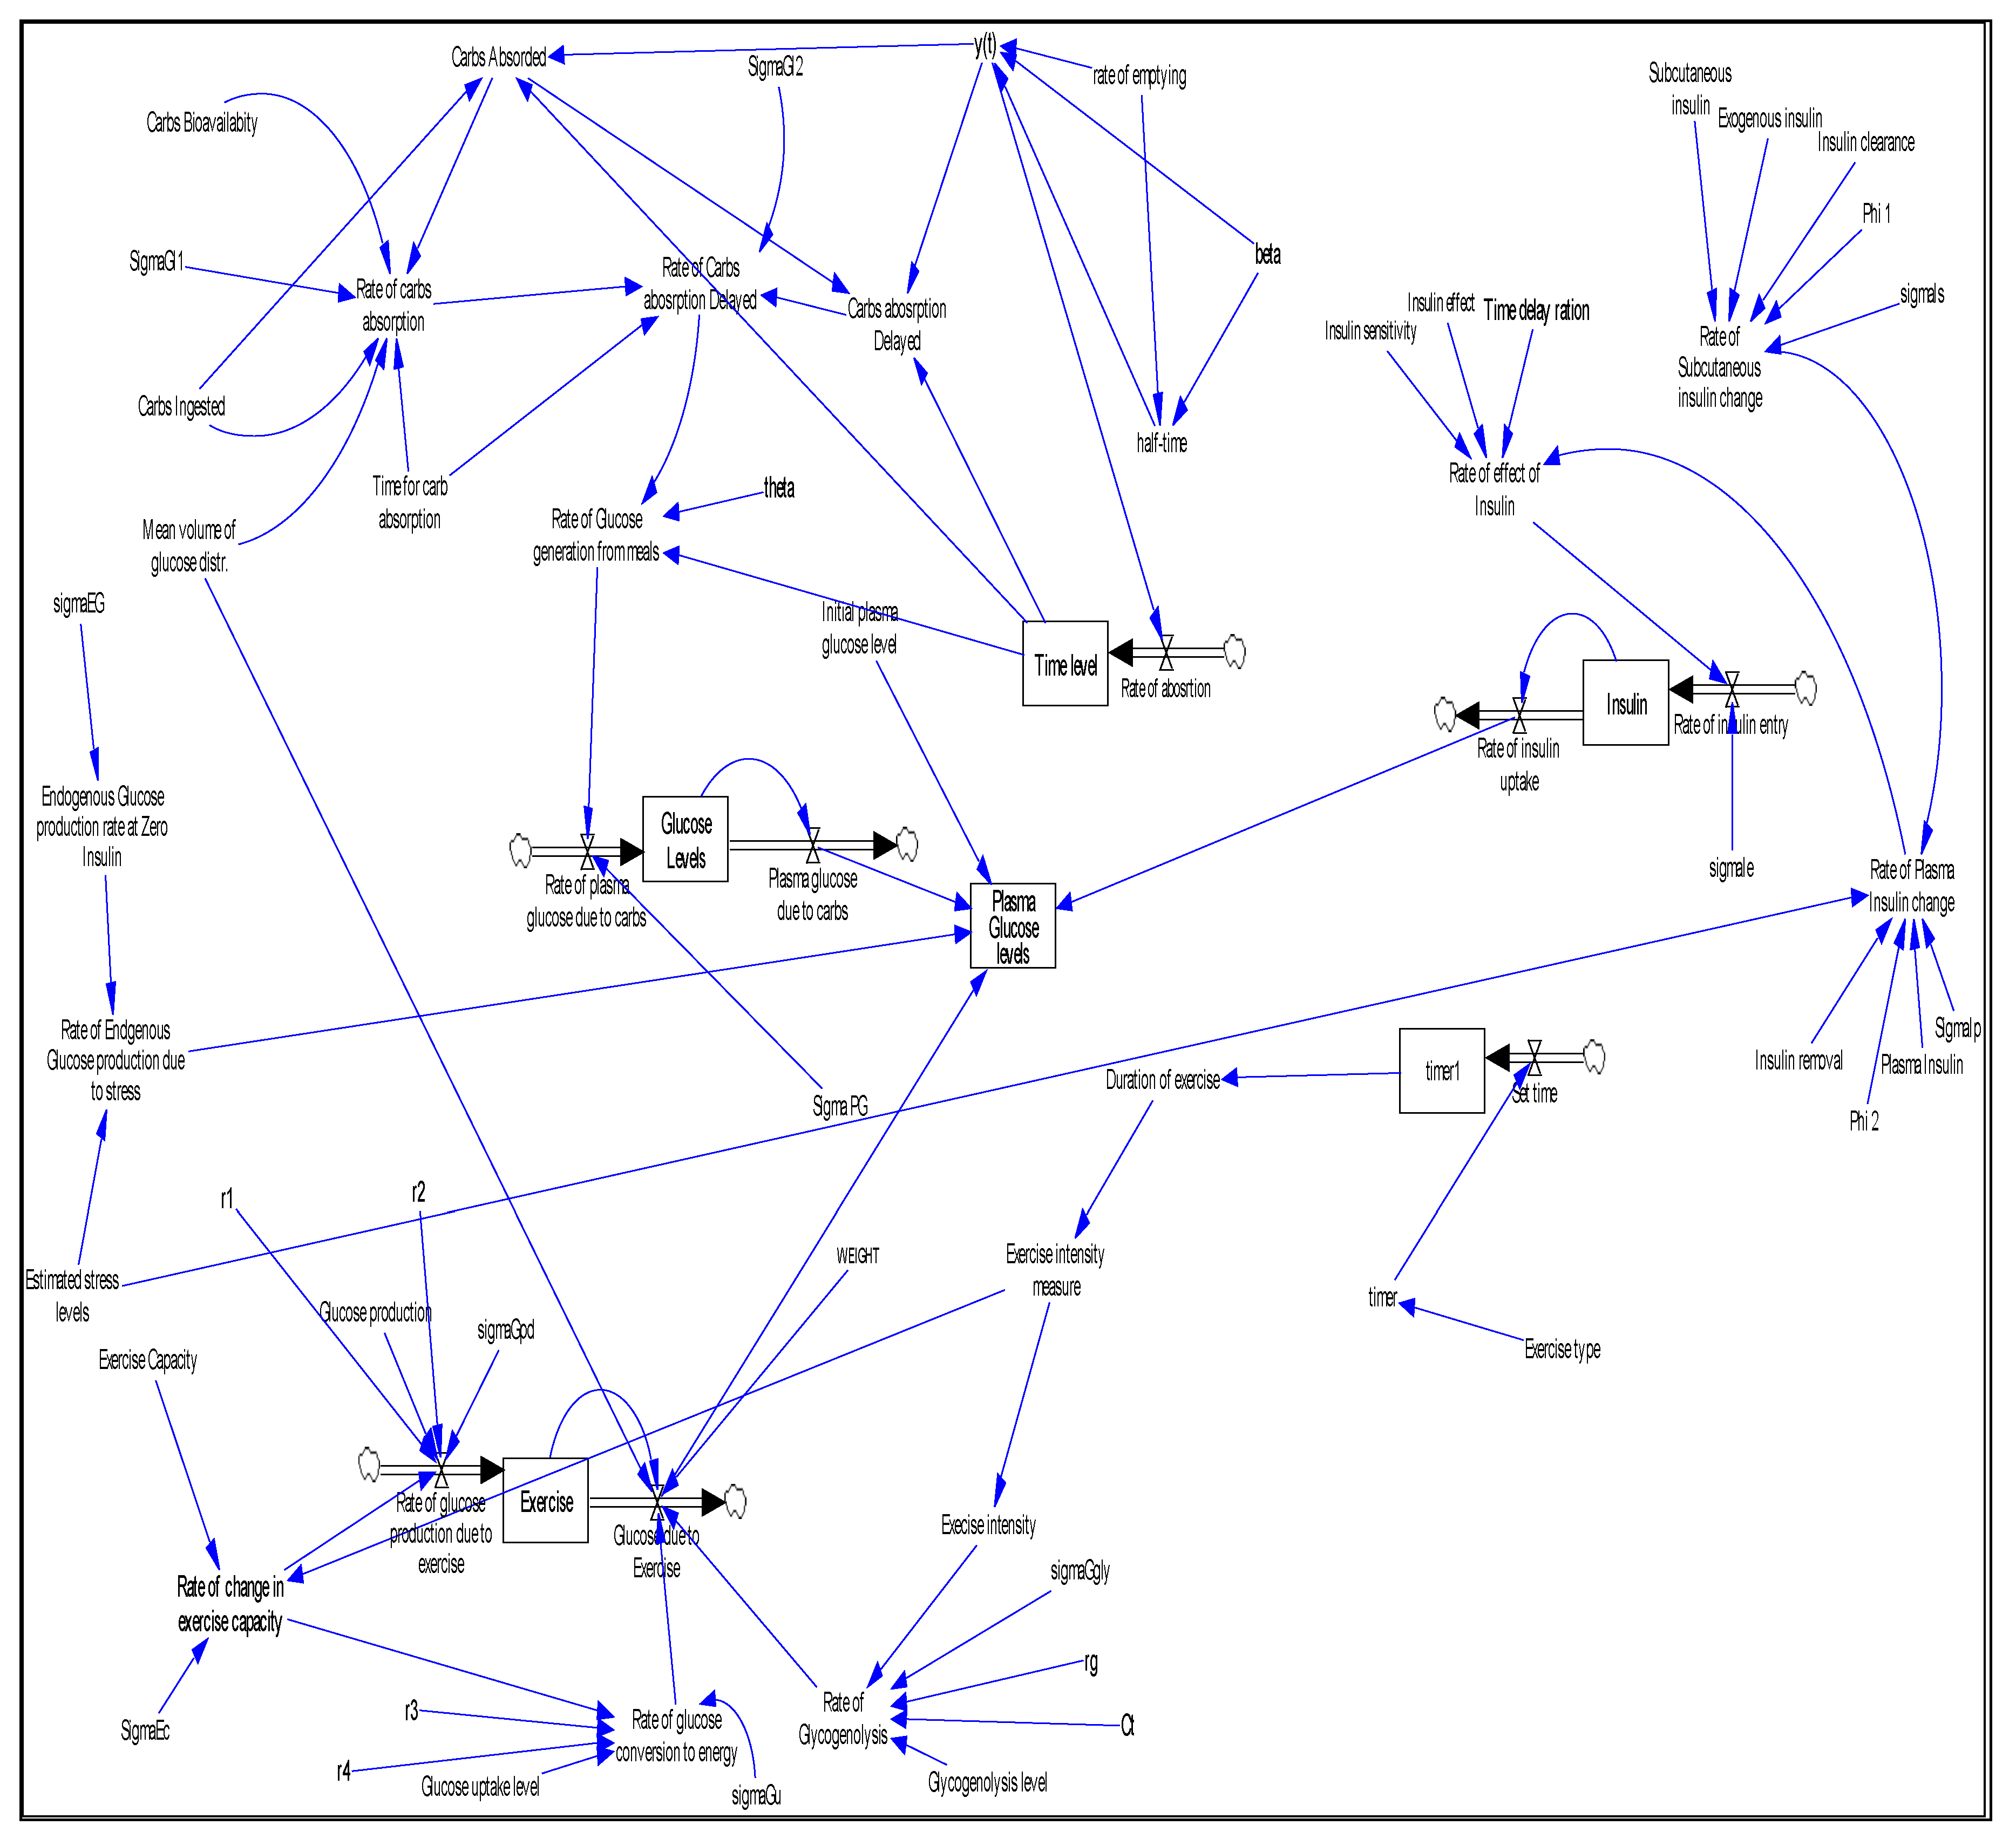
To validate the mathematical models of the stocks and flows of the plasma glucose and insulin dynamics in the blood system, a SDM was developed using the Vensim
®PLE software version 7.2a, Ventana Systems Inc, Harvard, MA, USA, 2018.
Figure 2 shows the SDM of the causal interaction structure of the system dynamics for the plasma glucose control and diabetes management strategies. It depicts the stock inflows and outflows interactions in a semi-closed system loop involving the meals, exercise, stress and exogenous insulin. In the SDM model, the stocks that represent subsystems of the glucose-insulin dynamic system are identified in boxes and the flows that represent the input parameters are identified by arrows (pipes).
Equation (6) was used to test the influence of exogenous insulin, meal, physical exercise and stress on the plasma glucose. The outcome of Equation (6) is identified as a stock of labelled plasma glucose levels in
Figure 2. The input parameter components of the Equation (6), which included exogenous insulin, stress, meals and physical exercises, were estimated using the various model equations implemented in the simulated SDM as follows: the exogenous insulin input parameters
were computed using Equation (5) that gave the rate of insulin uptake
and the amount of plasma glucose
recorded which is used to measure the amount of insulin to be administered; the stress input parameters
were estimated as a scalar factor for the reason that stress was implemented as a pseudo sub-system in the SDM due to its direct influence on the rate of production of exogenous glucose and the rate of plasma insulin change occurring at the same time [
28]; the input parameters for meals
were estimated using Equation (7) and Equation (8) whose output is captured as plasma glucose due to carbs in the SDM representation in
Figure 2, while the input parameters of physical exercise
were computed using Equations (9)–(16) with the influence of physical exercise on plasma glucose captured as glucose due to exercise in
Figure 2. The scaling parameter for the diffusion term
and the Wiener process factor
were used to give Equation (6) the Gaussian distribution characteristics. The result of Equation (6) which formed the input parameter
of Equation (17) was used to compute the predicted plasma glucose value
while taking into consideration the uncertainties and system imperfections estimated as
in the equation.
To compare the performance of the proposed model, different values of the input parameters in the various equations and other parameters were used to generate simulated results using the SDM in the Vensim®PLE software version. The computations on the various model equations were to give the feedback, accumulation of flows into stocks and the time delays of the SDM. The final results of the predicted plasma glucose values obtained through Equation (7) at the end of the interactions of the model equations were compared with those recorded by the CGM to validate the model. The outcome of the dynamic interactions of the feedback, accumulation of flows into stocks and the time delays in the model provided an indication of the current system state’s behaviour when current input parameter values are entered into the simulated model. Using the generated current state behaviours, future predictions can be made by varying the model parameter values.
3. Results and Discussions
Validation of the mathematical models of the plasma glucose-insulin dynamics, as depicted in
Figure 1, followed a series of tests which included analysis on both the structural and behavioural patterns. The structural tests were conducted to ascertain the real-world dynamics of the system interactions and to check if the theoretical foundations of the sub-systems are correctly mapped into the models. The tests involved confirmation of the interaction effects of the various model parameters on the anticipated outcomes. It, therefore, required the verification of both the parameters and the structures that were used in the model by comparing them with the existing literature [
1,
29]. The behavioural validation sought to examine the characteristics of the behavioural patterns of the outputs from the model. The numerically simulated behavioural patterns were compared with the expected, real-world data’s behavioural patterns.
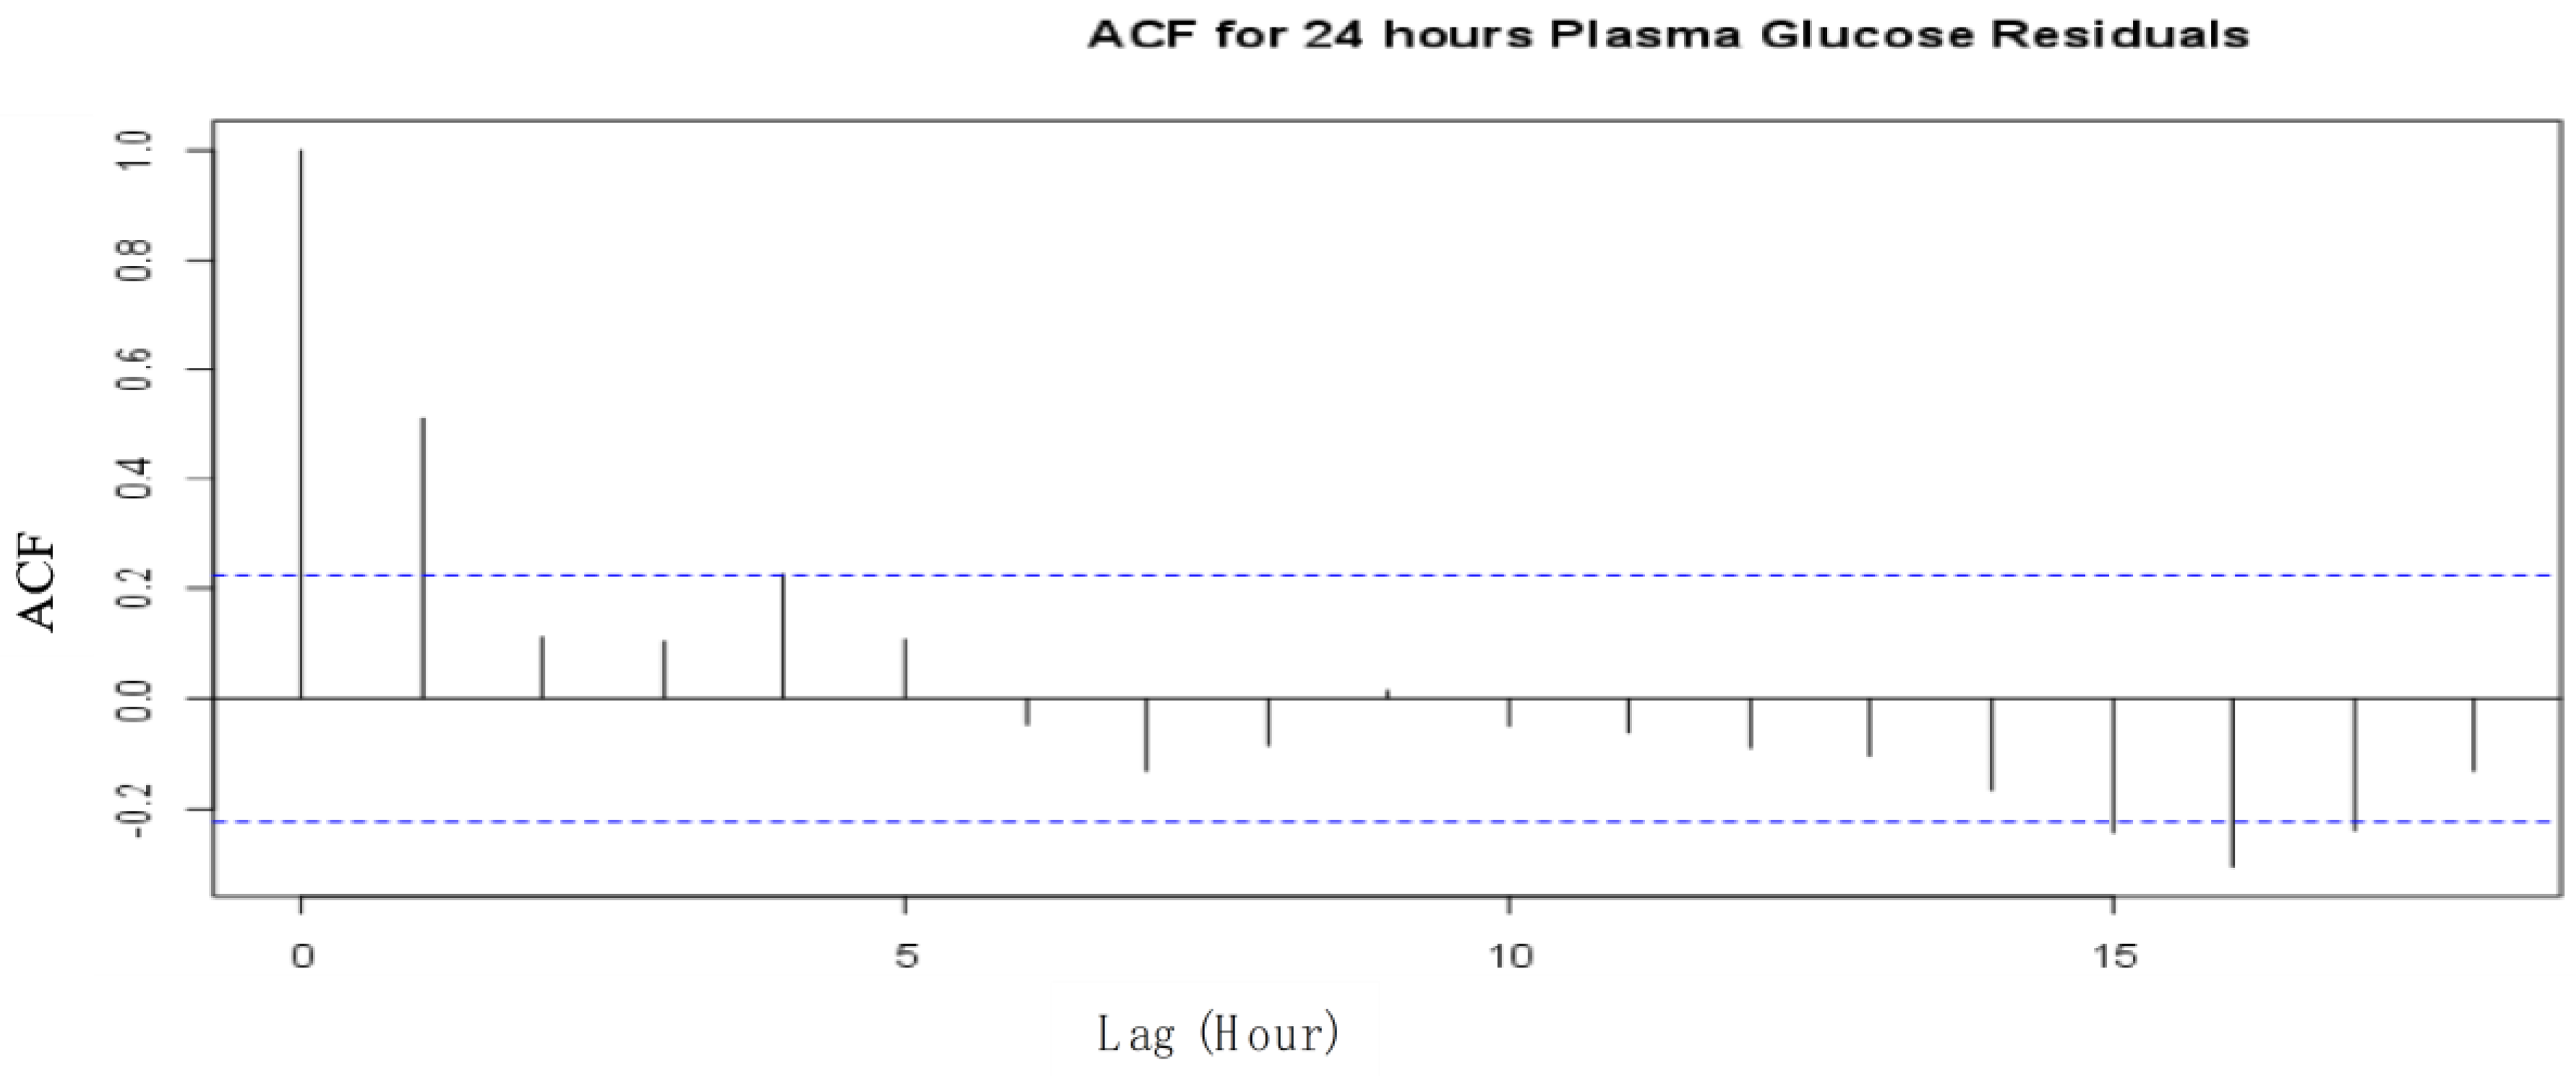
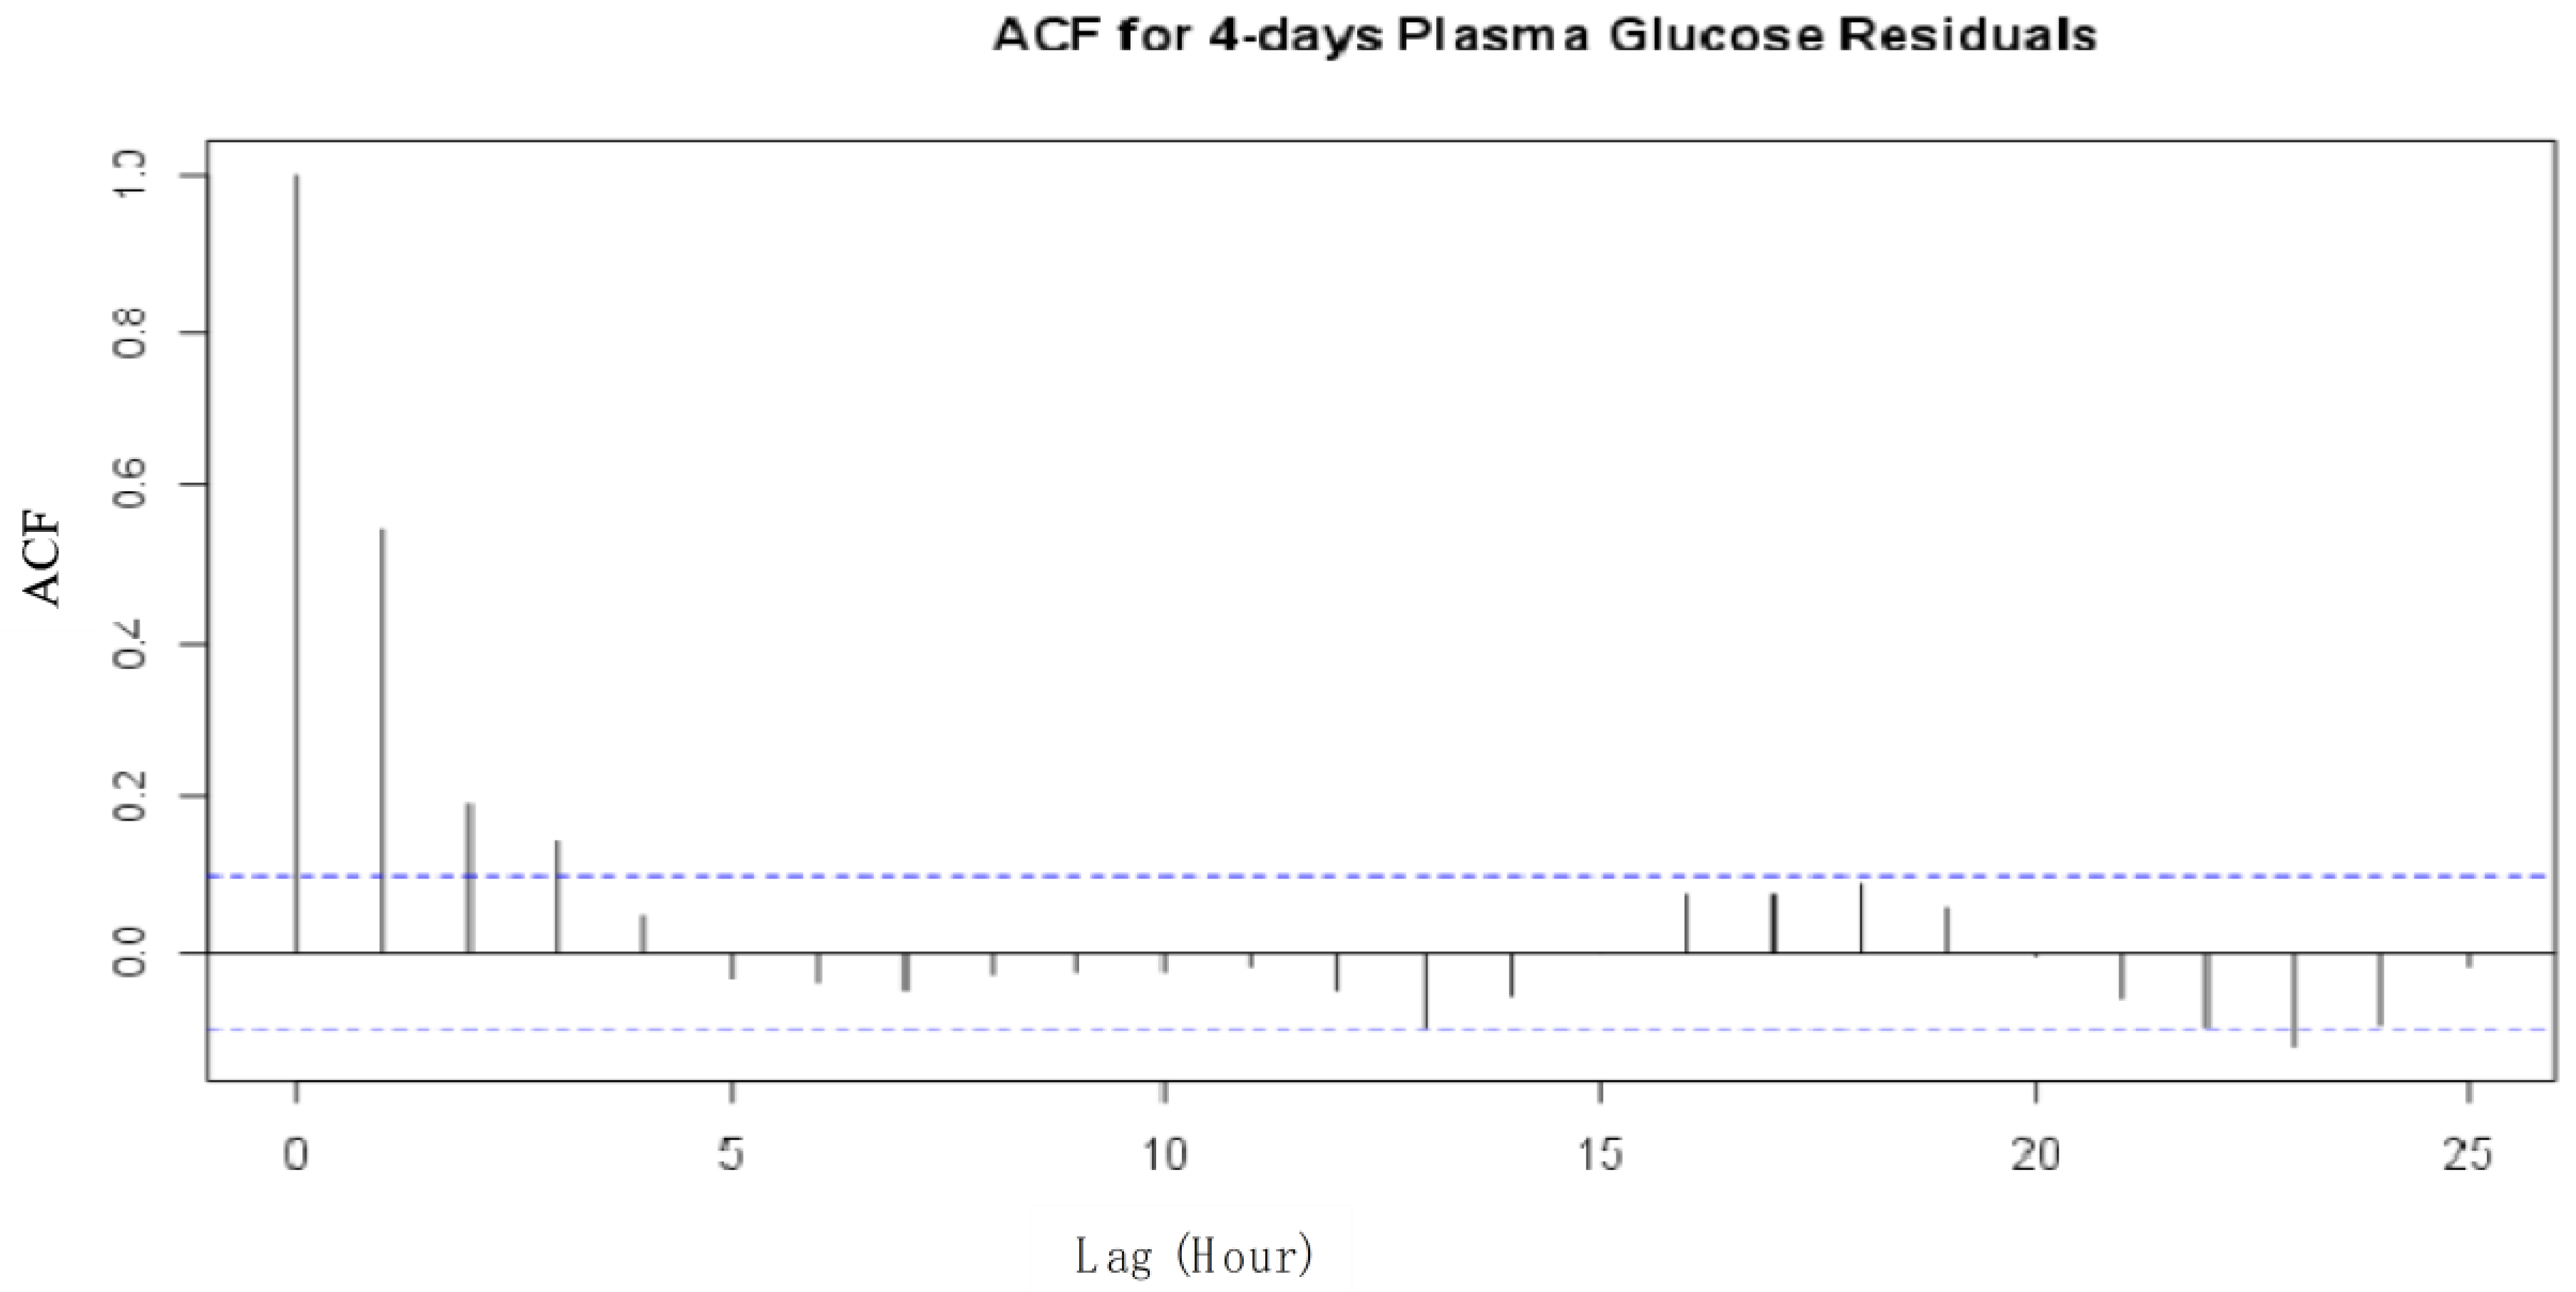
An analysis to evaluate the behavioural performance of the model was conducted by examining the Autocorrelation function (ACF) for the standardized residuals and the one-step predictions using the maximum likelihood ratio tests. ACF was used to examine the independence of observations.
Figure 3 and
Figure 4 illustrate the ACF for the plasma glucose residuals recorded in the first 24 h of the experiment for the 24-hour plasma glucose residuals and the 4-day consecutive plasma glucose residual measurements, respectively.
The two ACFs show that the
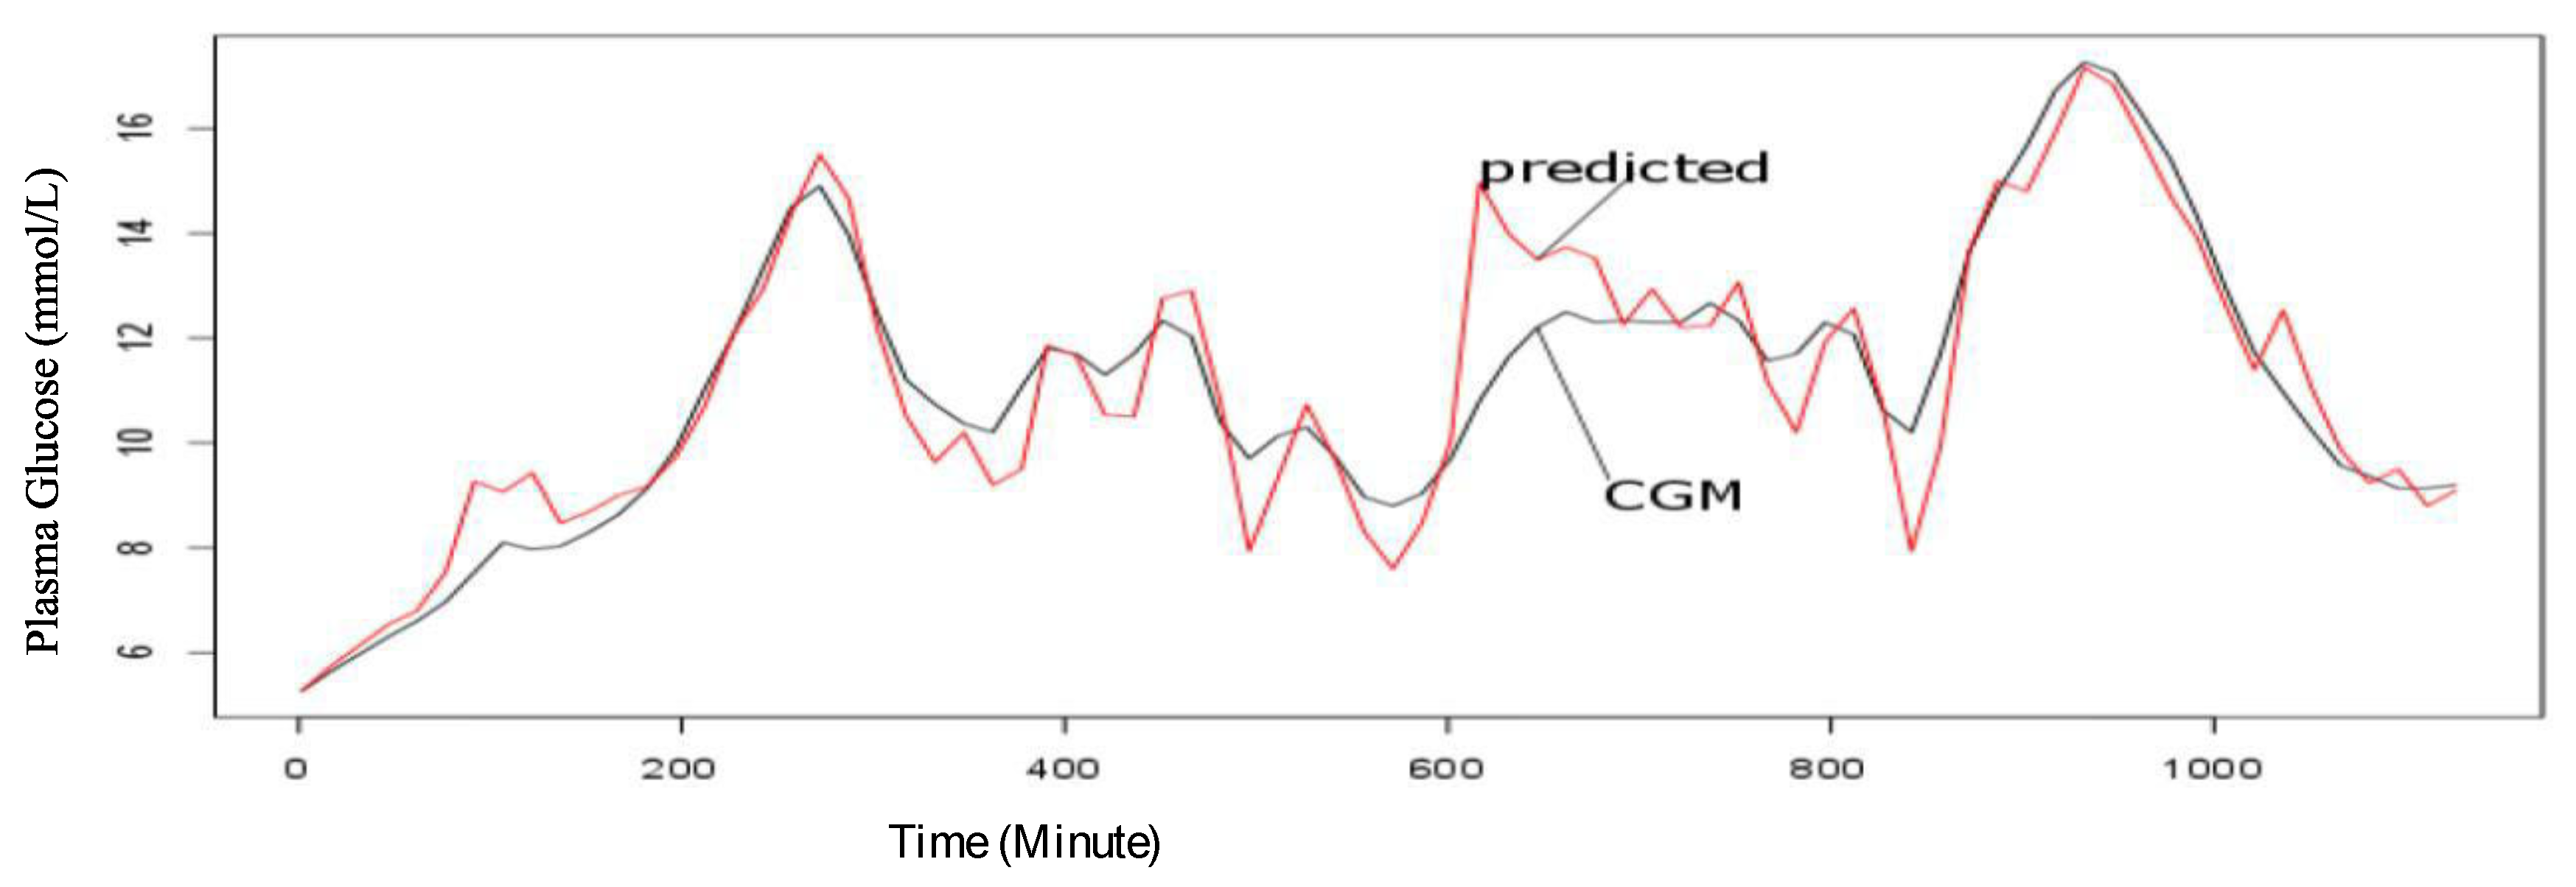
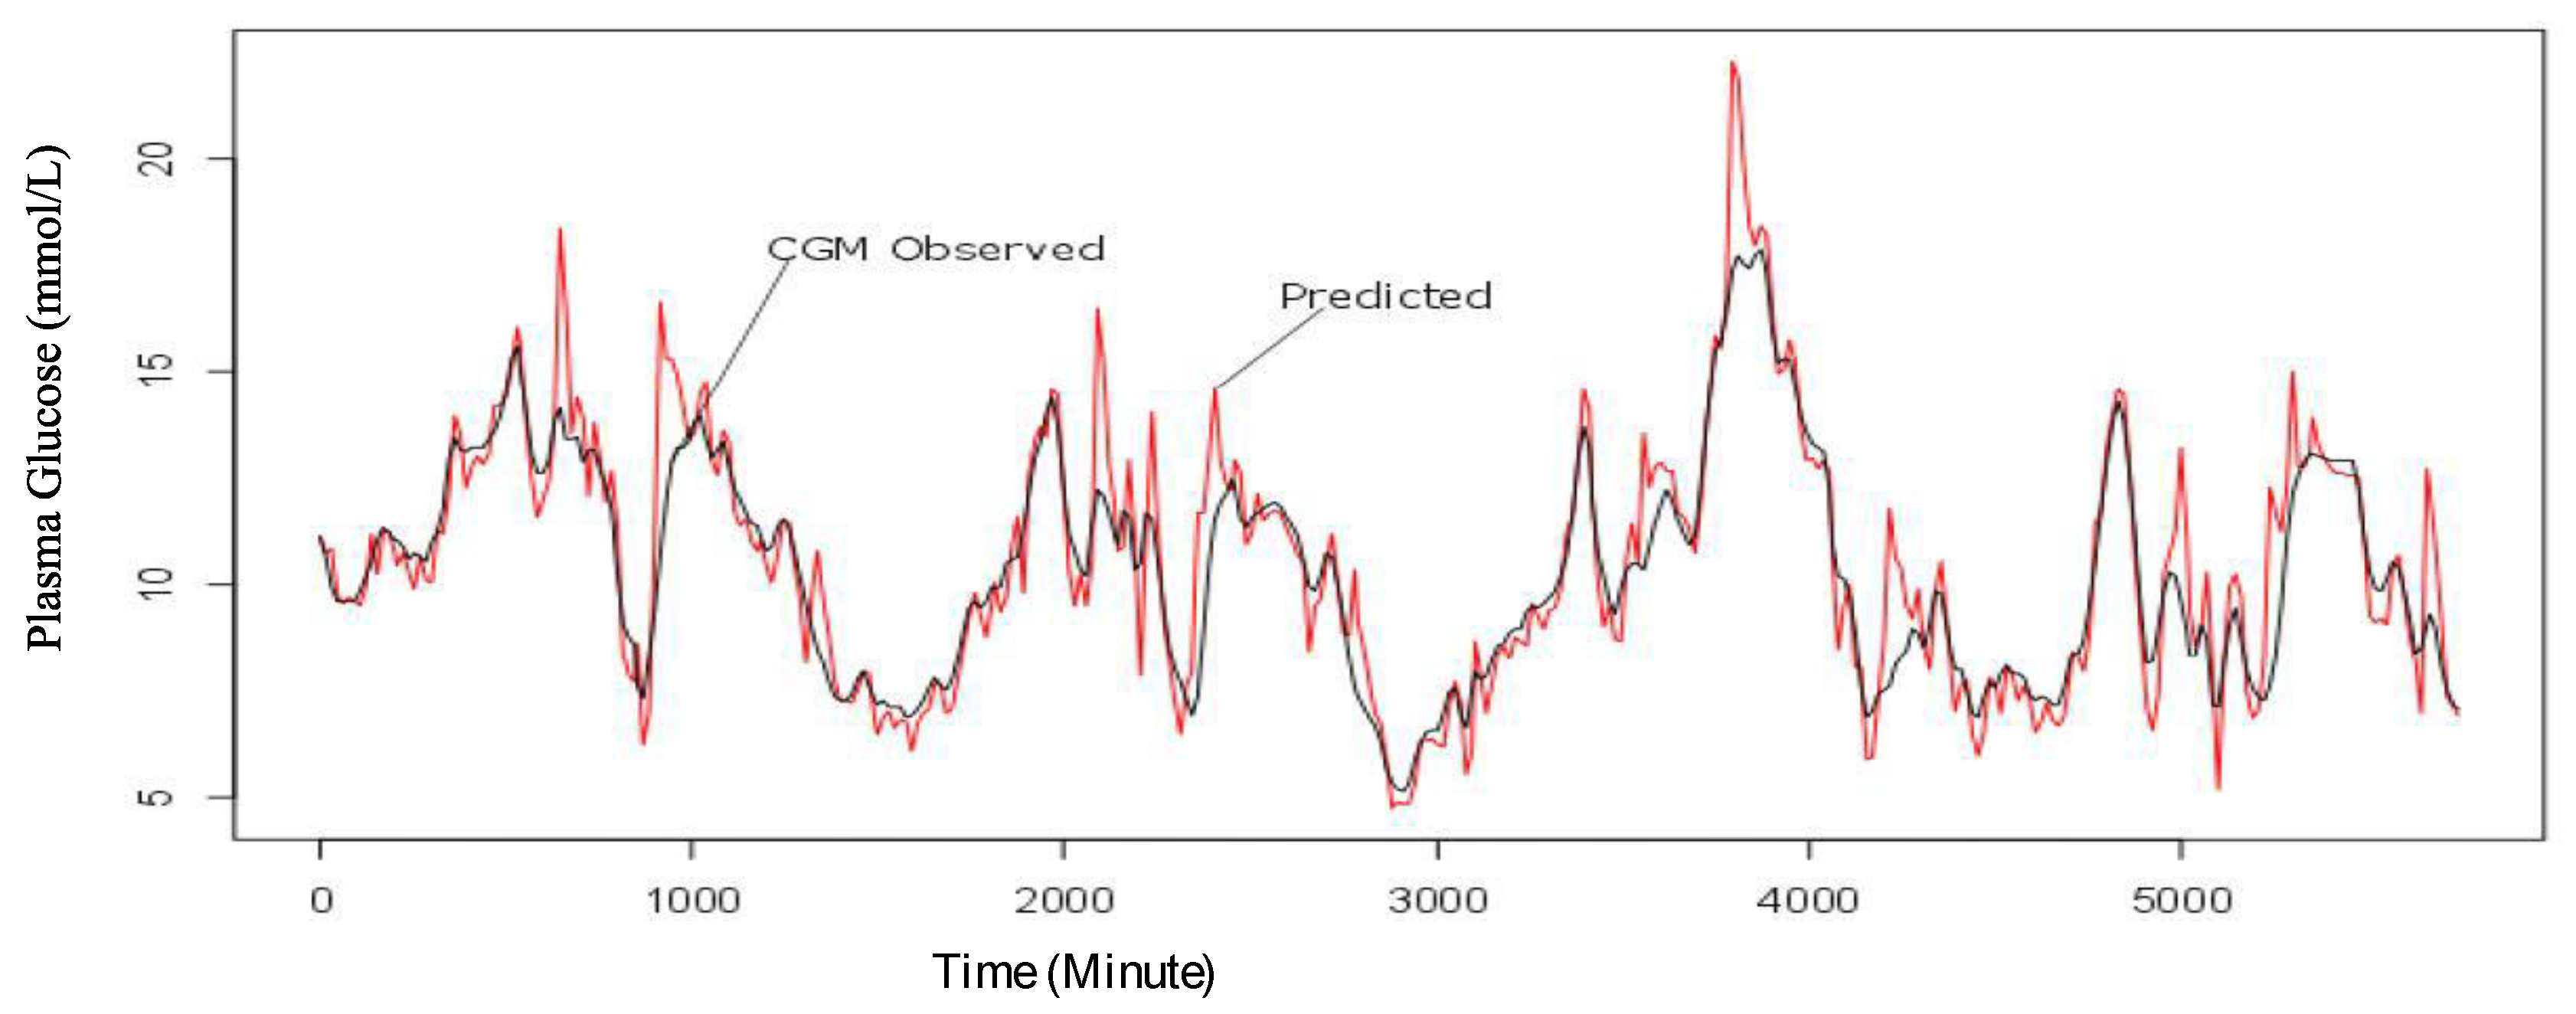
residuals are uncorrelated and are, therefore, considered independent at a 95% confidence level for the observations recorded on the type II diabetes patient. The one-step prediction of the plasma glucose outputs using the proposed model are presented in
Figure 5 and
Figure 6 for the first 24 h and the 4 consecutive days’ observations, respectively.
From
Figure 5 and
Figure 6, the predicted values are within the acceptable range in the first 24 h of the experiment and in the four (4) consecutive days of the experiment. However, the sensitivity of the model seems to improve with more data as shown in
Figure 6.
After confirming the behavioural performance of the model, different simulation runs were conducted on a Vensim
®PLE simulation environment to further analyse the predictive ability of the model to estimate the overall plasma glucose given different diabetes management strategies.
Table 2 presents a selected sample of outputs from the base run (the initial conditions) and simulation runs using clinical data from an IP at varying intervals of diabetes management and control intervention strategies. In this study, the base run refers to measurements of the glucose dynamics as recoded by the Continuous Glucose Monitoring (CGM) device while the diabetes management and control innervations refer to strategies involving carbohydrates intake, physical exercise intensity, stress levels and exogenously administered insulin. The CGM was done using Abbott FreeStyle
® Libre Pro device (also referred to as Flash Glucose Monitoring (FGM)/Ambulatory Glucose Monitoring (AGM) System), Abbot, Chicago, IL, USA, 2016. The CGM sensor measured interstitial (in between the cells) plasma glucose and provided patterns and trends data that assist in making clinical decisions. The components of Abbott FreeStyle
® Libre Pro device include a sensor that is inserted just under the skin into the subcutaneous tissue and lasts for 14 days (and gives calculated blood glucose readings every 15 min). The World Health Organization Well-being (1998 Version) tool was used to assess the stress levels of the patients during the study period.
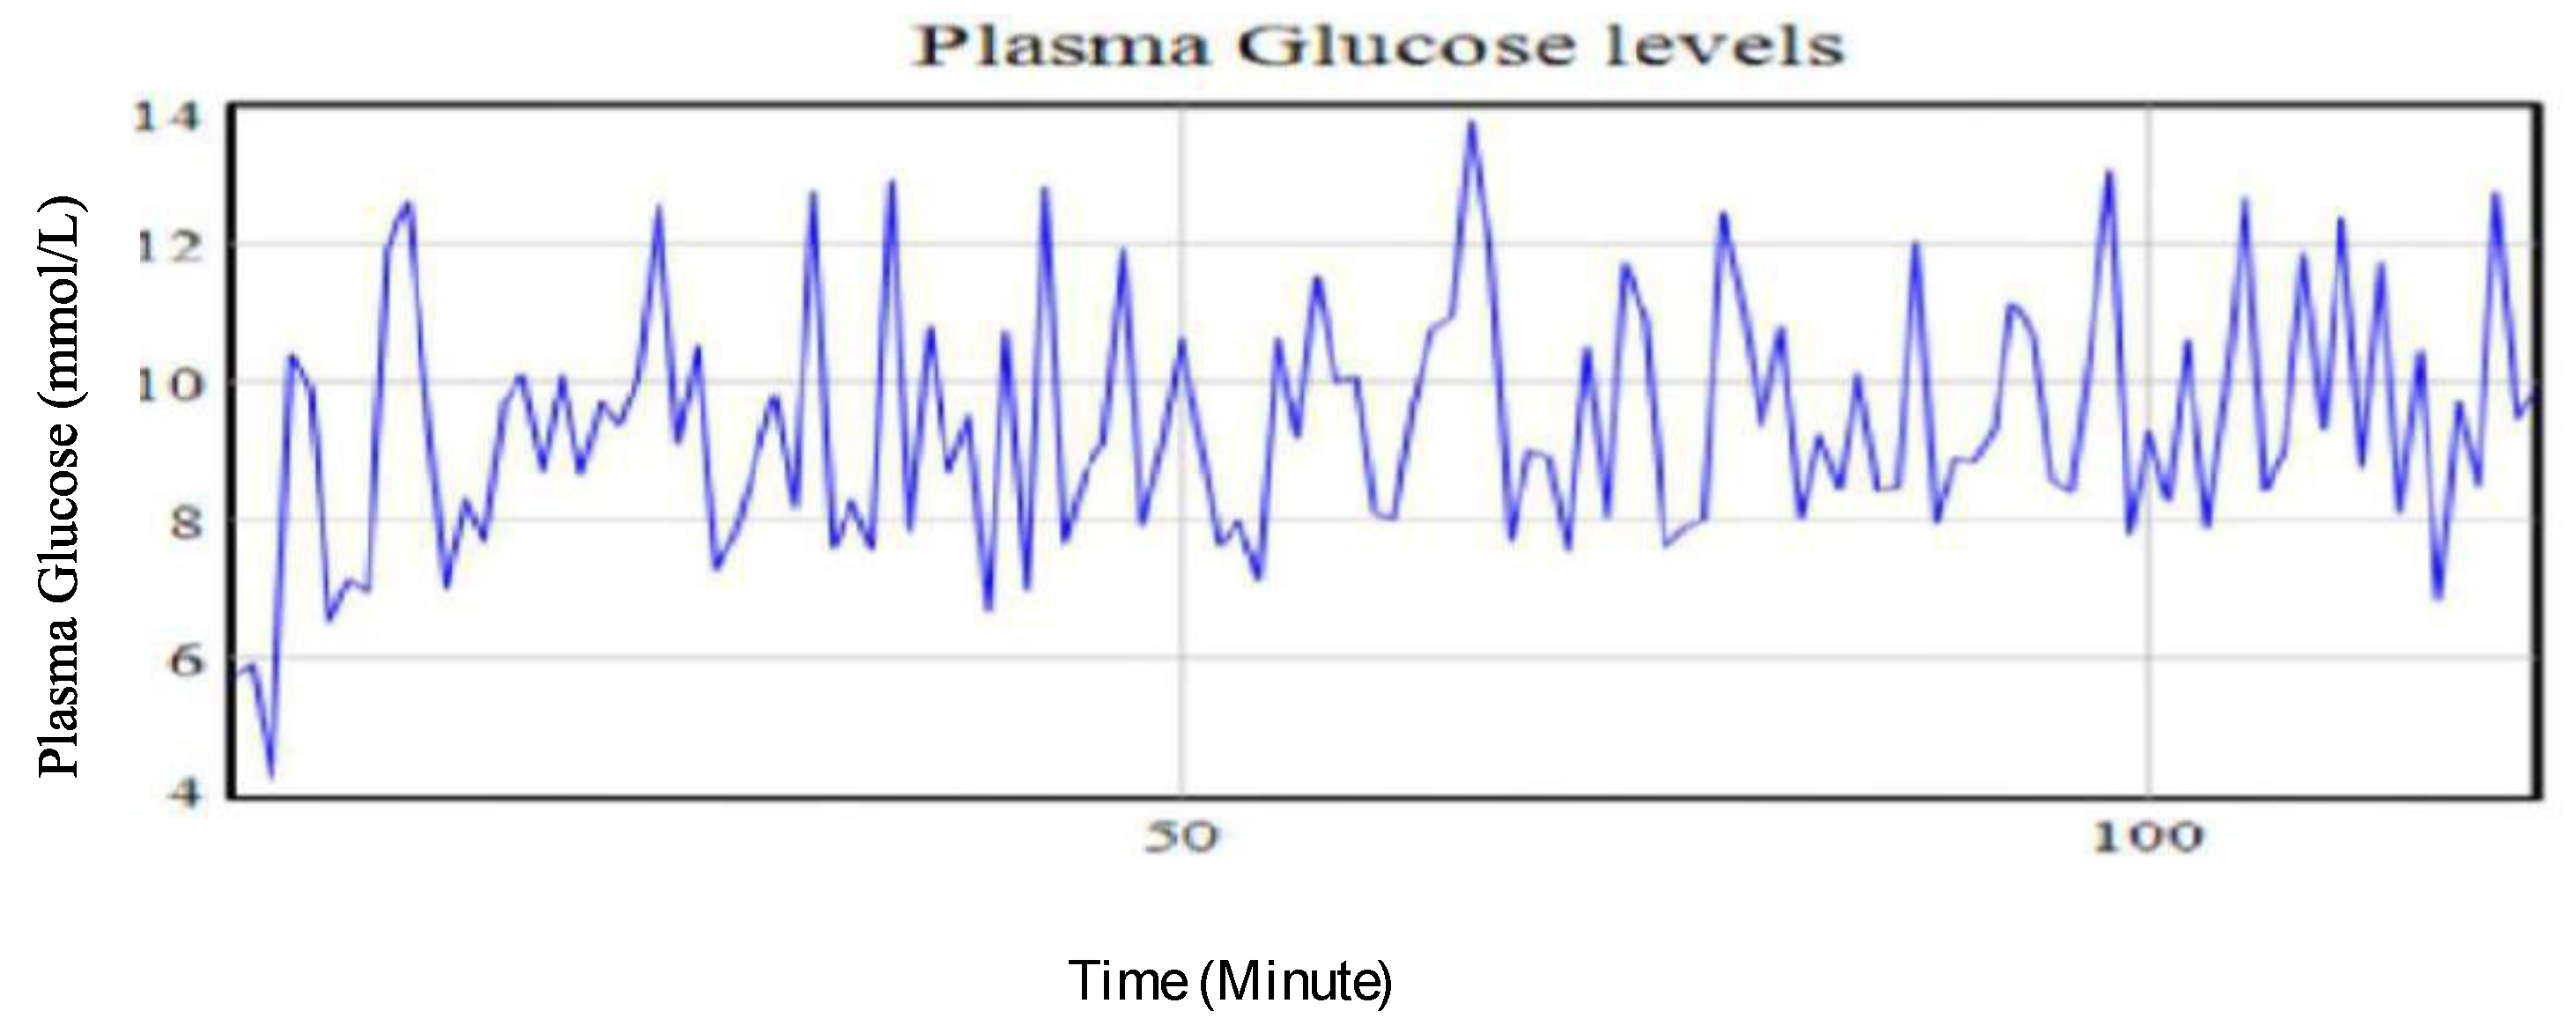
A 24 h base run observation of the plasma glucose of the type II IP using the CGM was conducted. The recorded data gave an average of 9.22 mmol/L as shown in
Table 2. This was considered above the set targets for the patient but was used as the initial value for predicting the potential plasma glucose trends.
Figure 7 shows the plasma glucose profile levels for the patient generated using the proposed model considering the initial conditions (base run values).
The base run results were used to calibrate and check on the performance of the mathematical model as implemented using the SDM in
Figure 2 to estimate the plasma glucose levels at different input parameters. Using the base run input parameter values, different simulation runs involving different intervention strategies in the management and control of diabetes were conducted.
Table 2 shows the experimental estimated values of the average plasma glucose levels at varying input parameter values and different diabetes management and control intervention strategies as generated by the model.
Table 2 gives the input parameter values for the different strategies for the management and control of diabetes. Using the input parameter values, different plasma glucose trends using the proposed mathematical model were generated. These trends are discussed in case 1 to case 5.
The findings from the simulation runs analysis show the amount of carbohydrates taken and stress levels are closely associated with the plasma glucose levels’ dynamics. It was observed that a 33.33% decrease in the amount of carbohydrates ingested while maintaining the base run levels of stress and exercise intensity led to a decrease of glucose level by 11.71%. This outcome is supported by previous studies that showed the amount of meal and, therefore, portion of carbohydrates ingested will have corresponding impact on the plasma glucose [
12,
30].
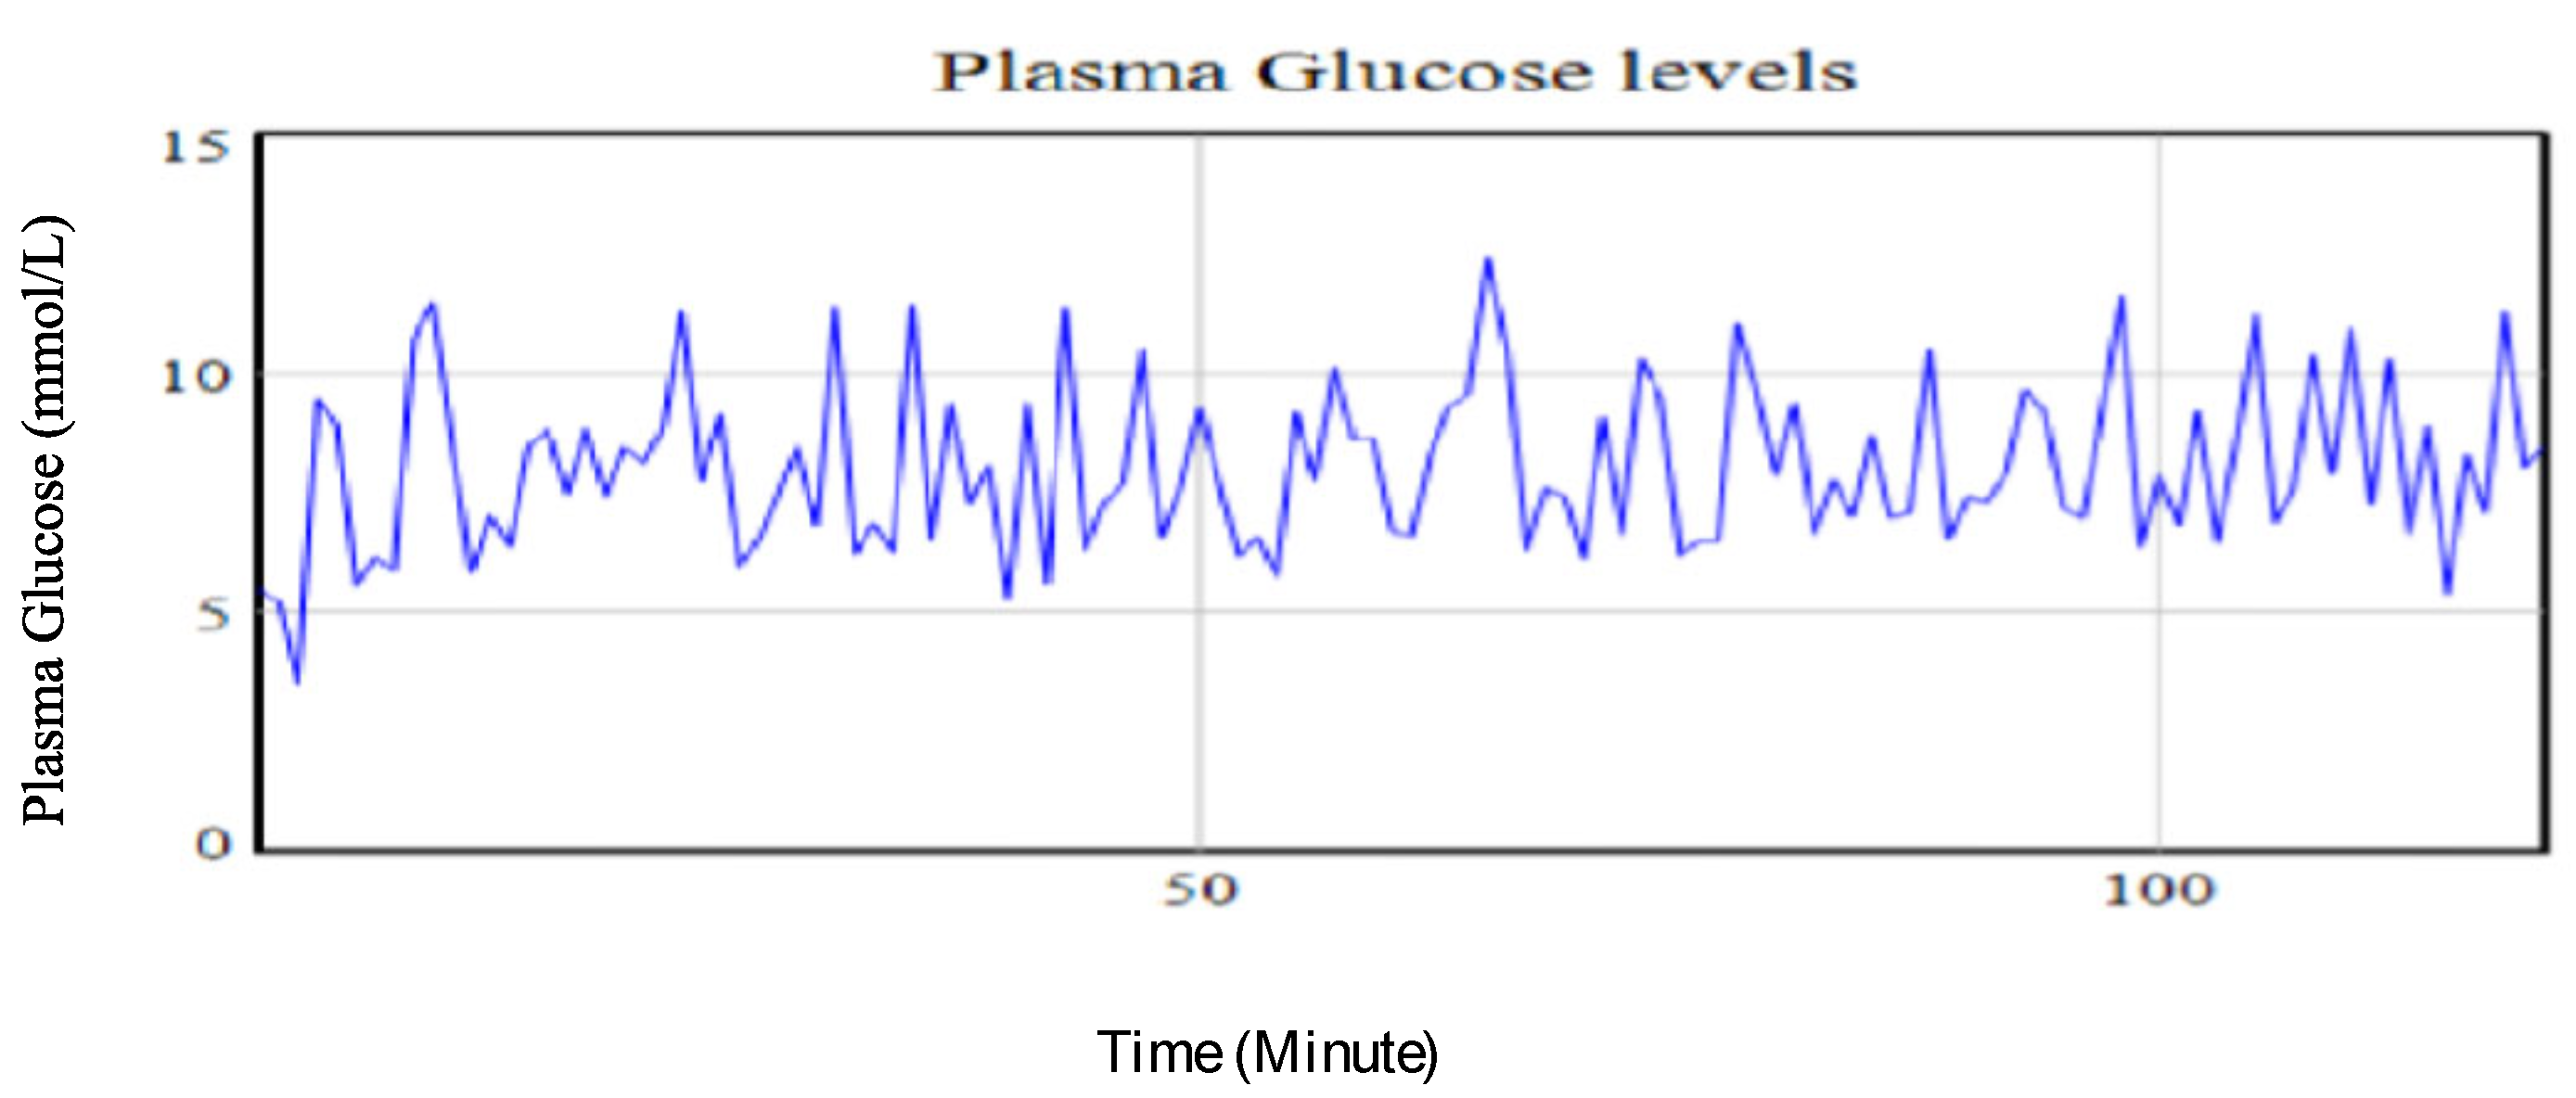
Figure 8 shows the plasma glucose profile of the simulated results from the intervention strategy involving the reduction of the amount of carbohydrates consumed below the base run values.
Similarly, a reduction in the stress level by 33.33%, while holding other intervention strategies at base run levels, led to a decrease in the glucose level by 2.93%. This finding affirms previous studies on brain glucose homeostasis and associated effects on plasma glucose levels. It underscores previous knowledge on the impact of stress on the metabolic processes [
28]. For instance, stress is associated with the energy mobilization trigger for the fight-or-flight responses. This, consequently, influences the stimulation of glucocorticoid hormones which leads to increased plasma glucose concentrations in the blood stream system. It is also noted that high stress levels will have an effect on pancreatic glucagon production as a result of the influence of high stress on catecholamine [
28]. An increase in catecholamine could lead to an increased glycogenolysis and gluconeogenesis in the liver. During this time, the insulin levels are considered to drop thereby causing an increase in hepatic glucose production [
28].
Figure 9 shows the simulated results profile of the plasma glucose levels when stress level is reduced while maintaining the amount of carbohydrates ingested and the intensity of the physical exercise at the base run levels.
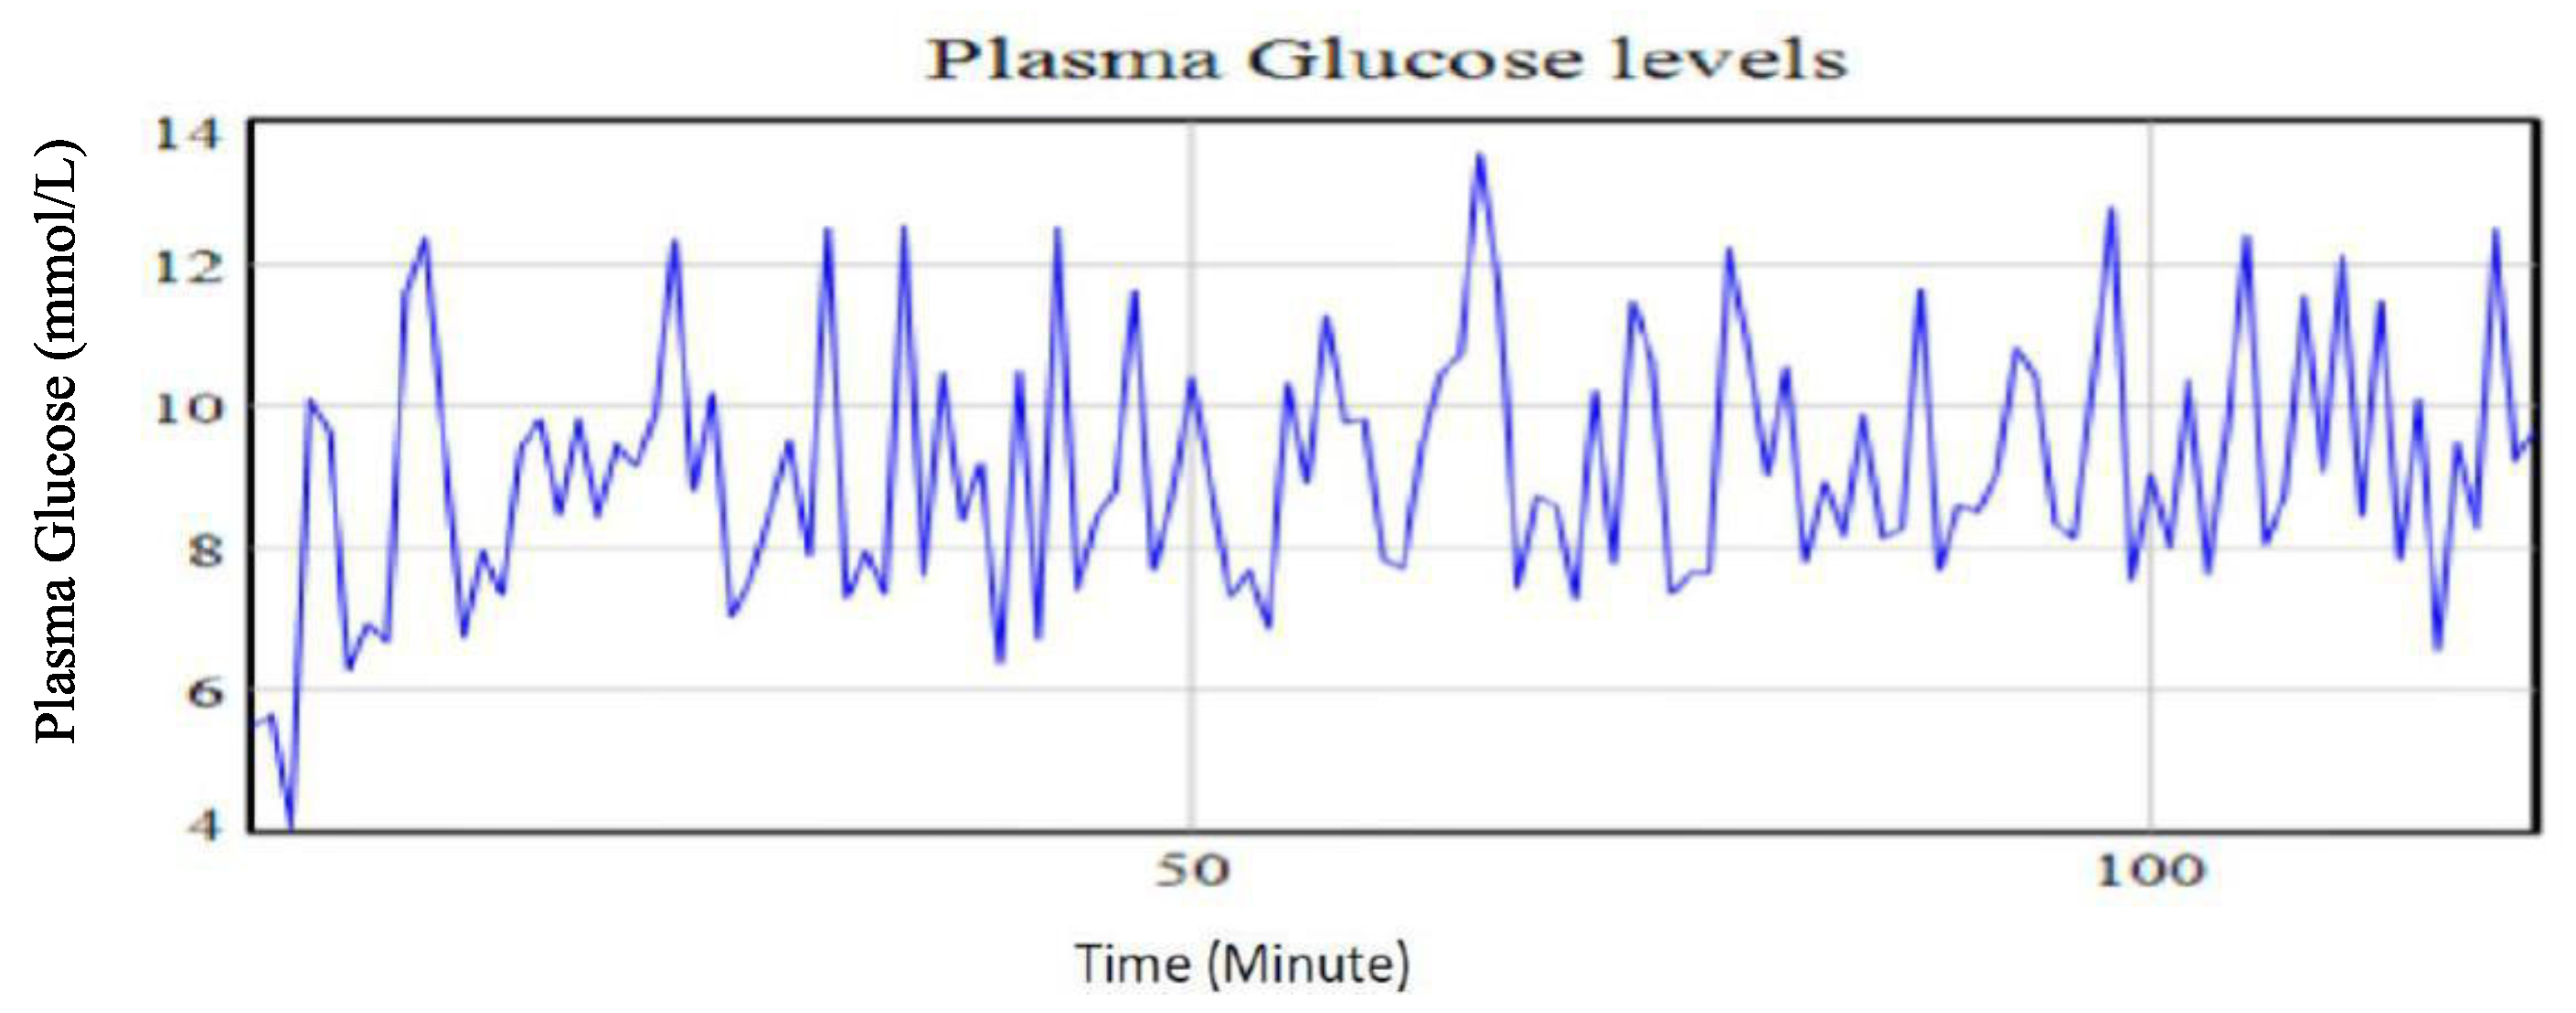
A change of the exercise intensity from moderately high to moderately low and/or near zero while holding both the carbohydrates and stress levels at the base run levels led to a decrease in plasma glucose levels by 0.33%. The minimal decline in the plasma glucose due to physical exercise is supported by previous studies that notes an increased hepatic glucose release due to enhanced glycogenolysis during the physical exercise period. Glycogenolysis activities are aimed at regulating the plasma glucose homeostasis. The effect of the physical exercise is also influenced by the oxygen intake rate and the duration of the exercise upon which a certain intensity is maintained. This, therefore, means that physical exercise is dependent on other factors which needs further investigations.
Figure 10 shows the result of lowering exercise intensity while maintaining the amount of carbohydrates and stress levels at the base run levels. From the graph, episodes of swing of plasma glucose from high levels to low levels are evident. This illustrates poor attainment of control of the plasma glucose.
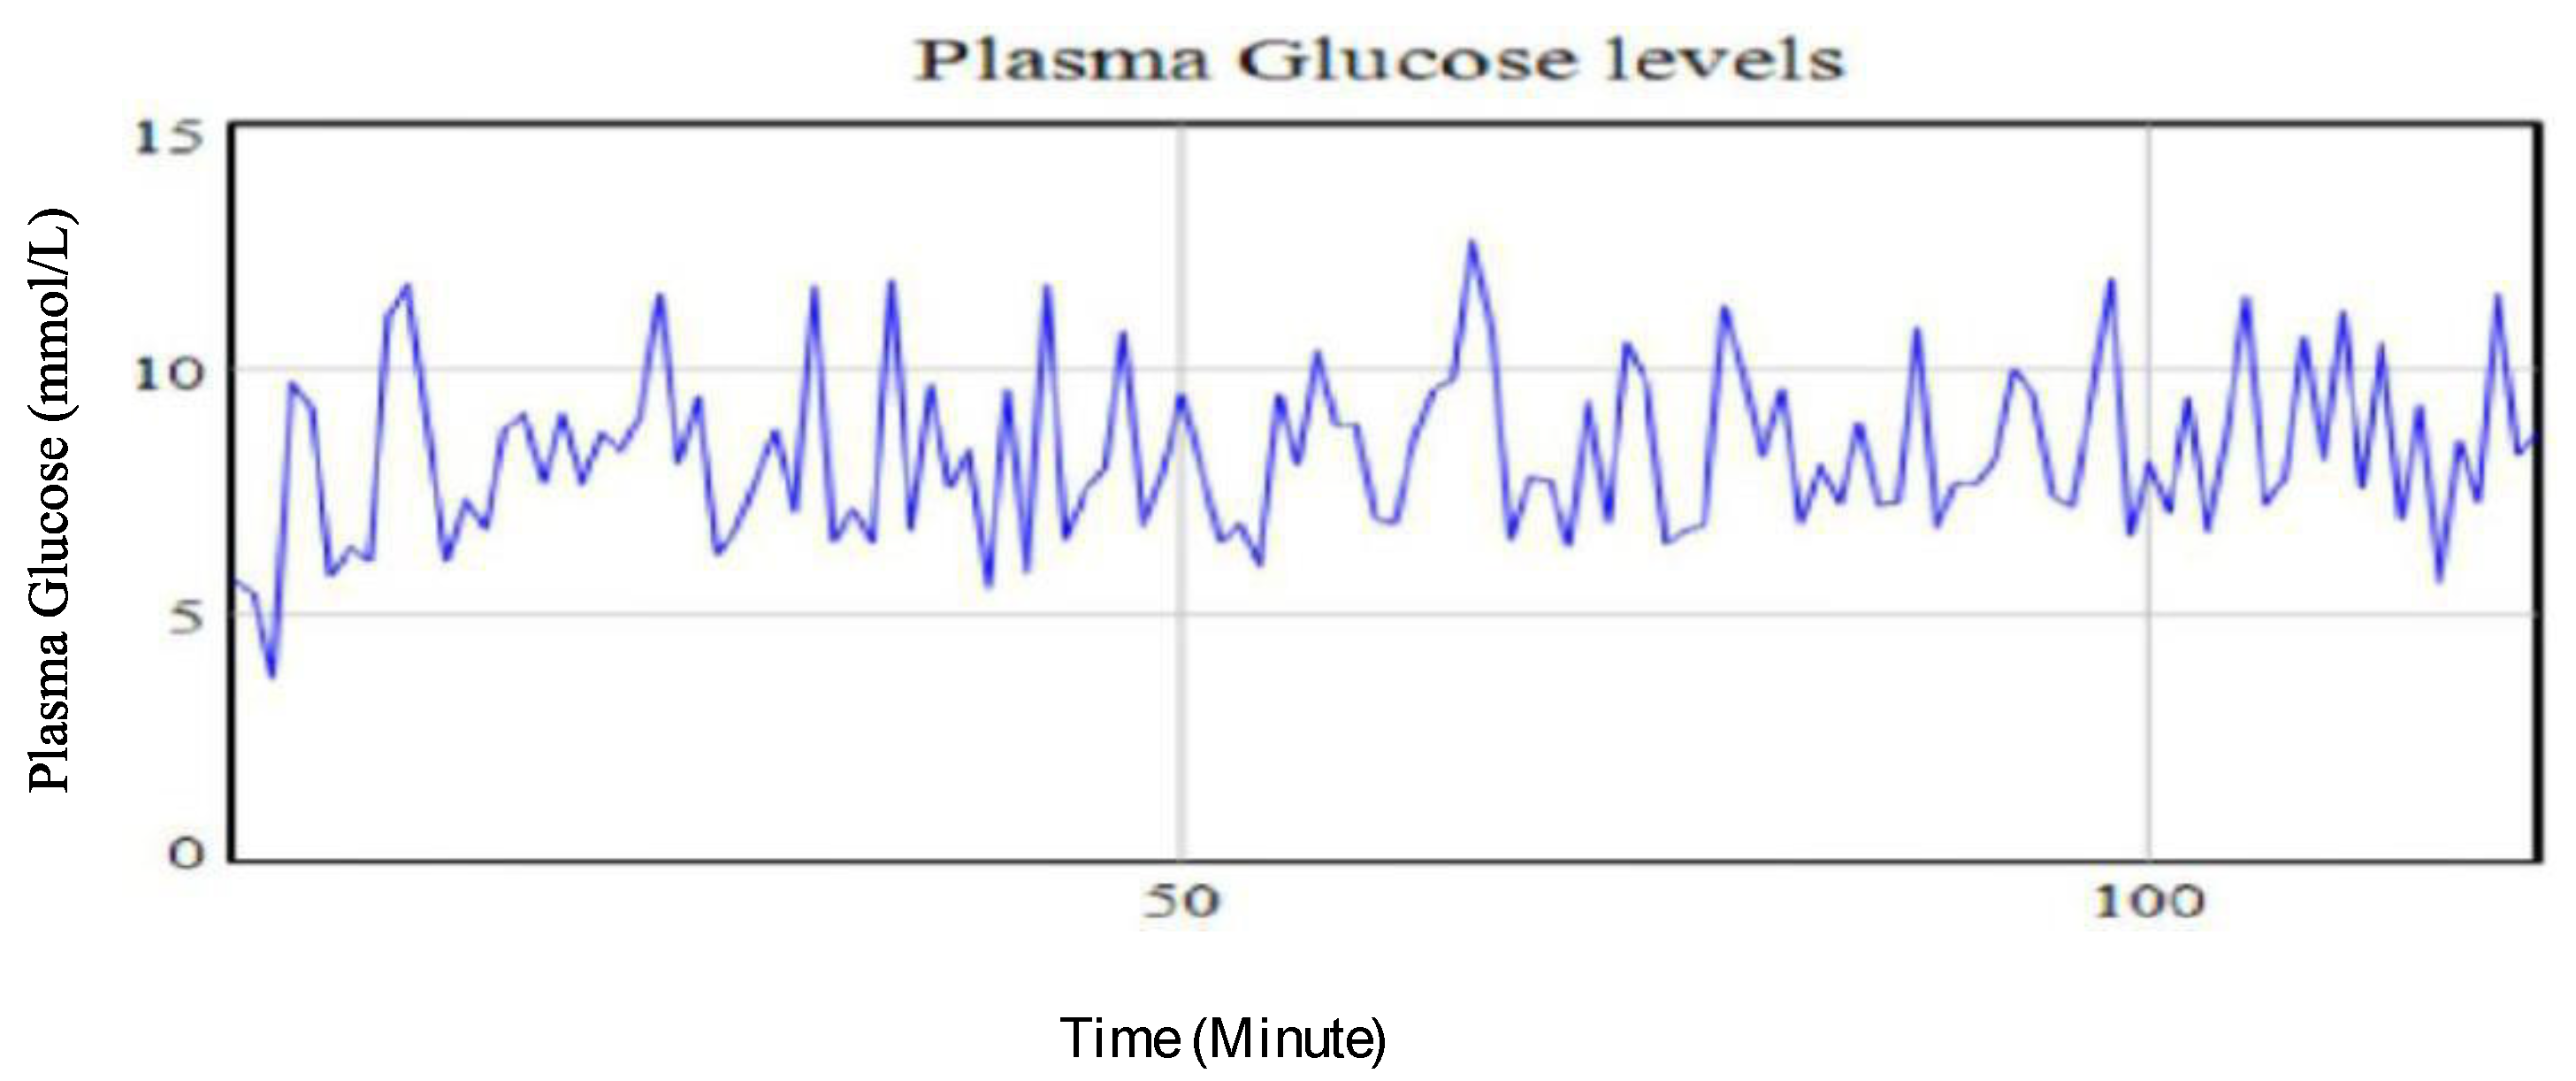
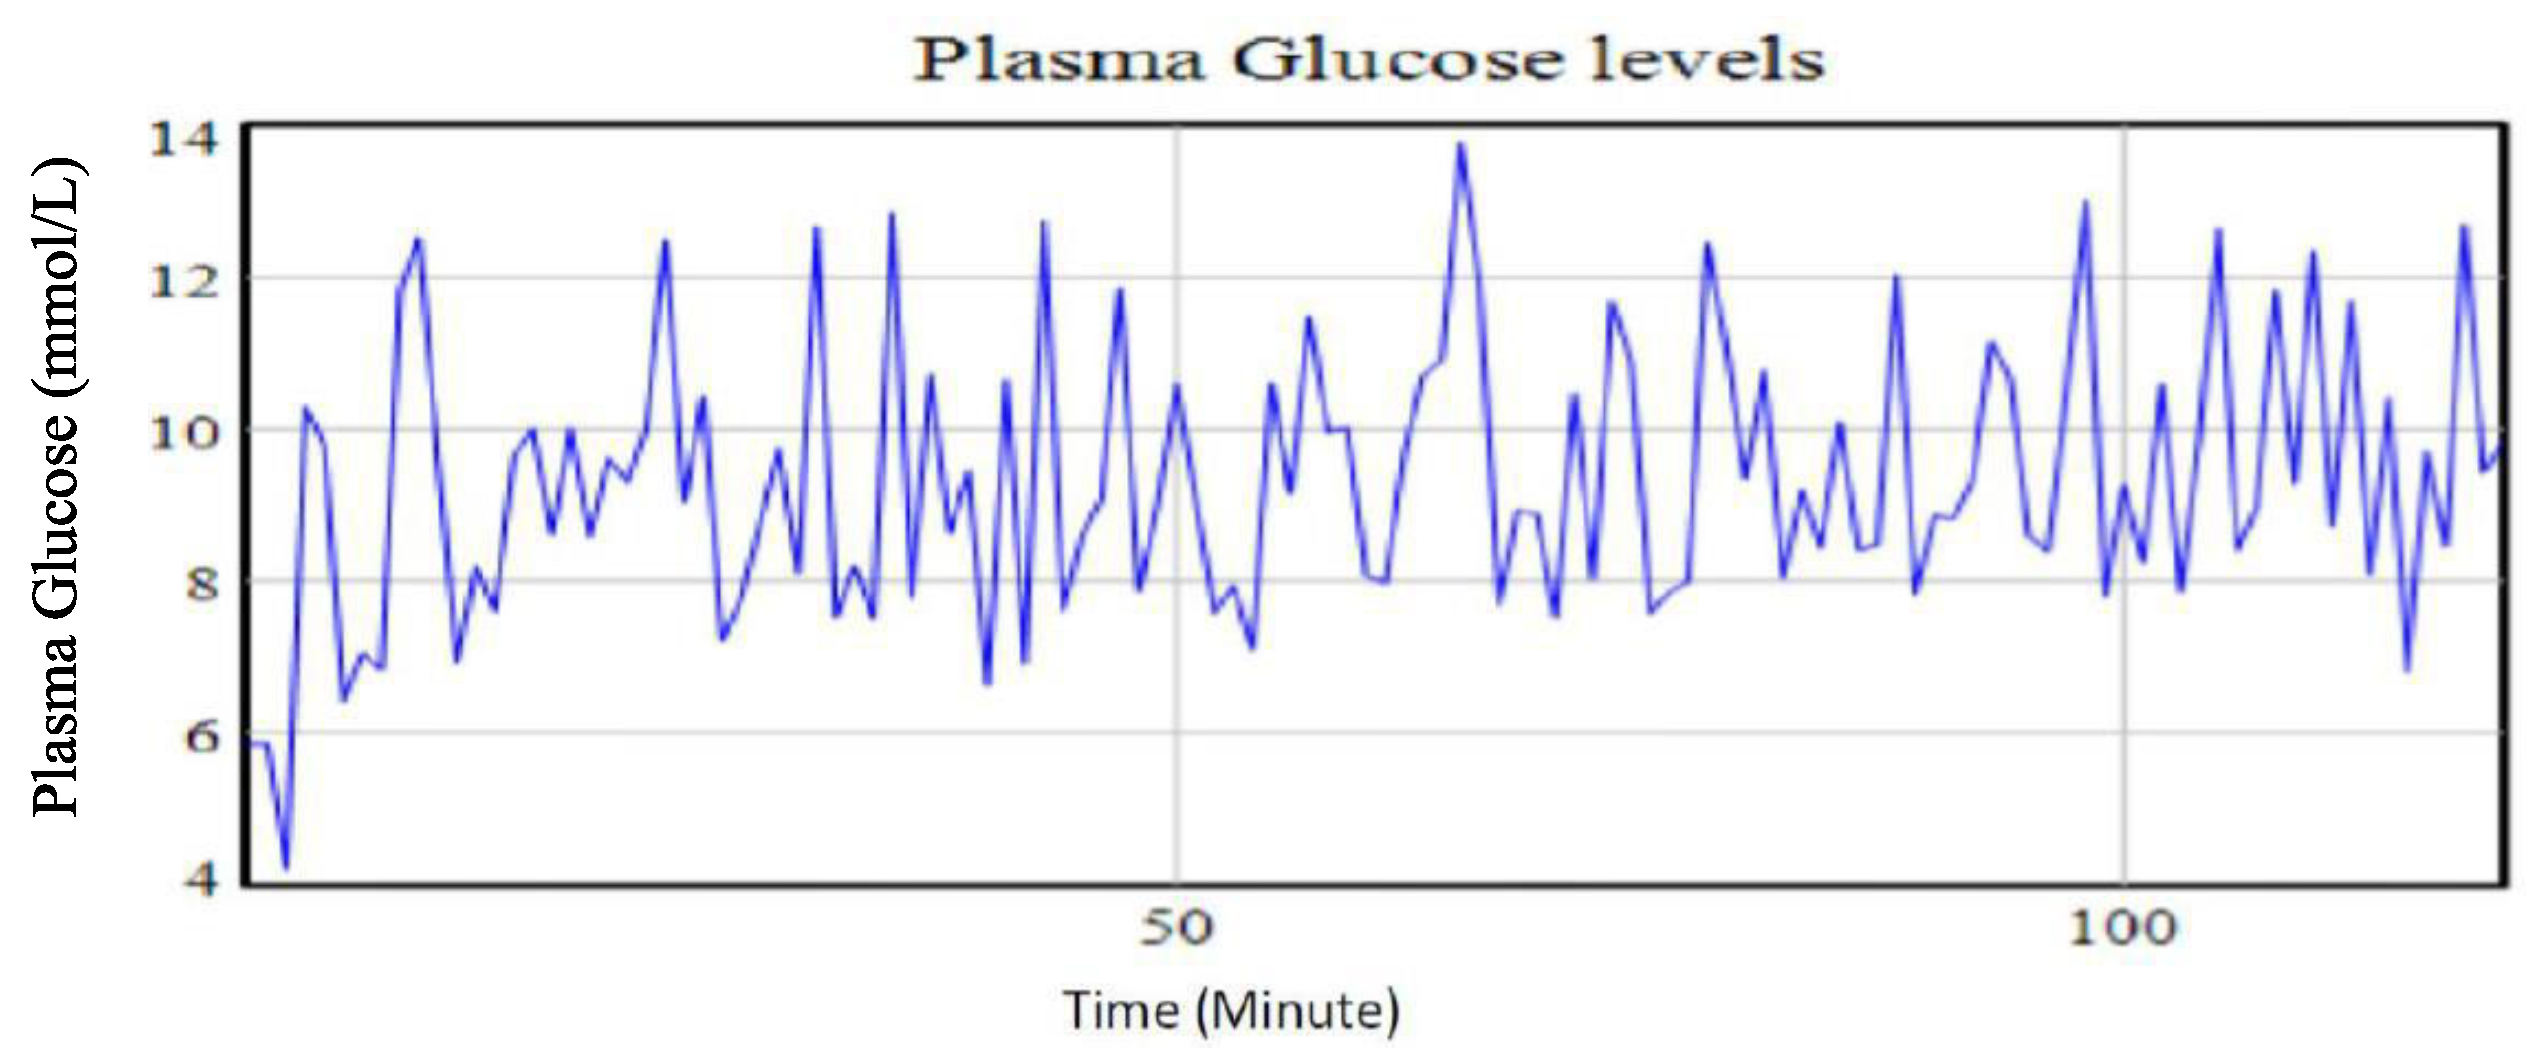
A combined reduction of amounts of carbohydrates intake and stress levels each at 33.33% while maintaining the exercise intensity at the base run levels led to a 14.75% reduction in the plasma glucose levels. This strategy had a relatively lower variability in the recorded plasma glucose levels over the time intervals. This implies a moderately good glycaemia control is achieved.
Figure 11 shows the trend in the plasma glucose with a reduced amount of carbohydrates and stress levels while maintaining high intensity exercise. The trend demonstrates a highly controlled plasma glucose profile. From the graph, the variability of the observed values is small, indicating a good control of the plasma glucose-insulin.
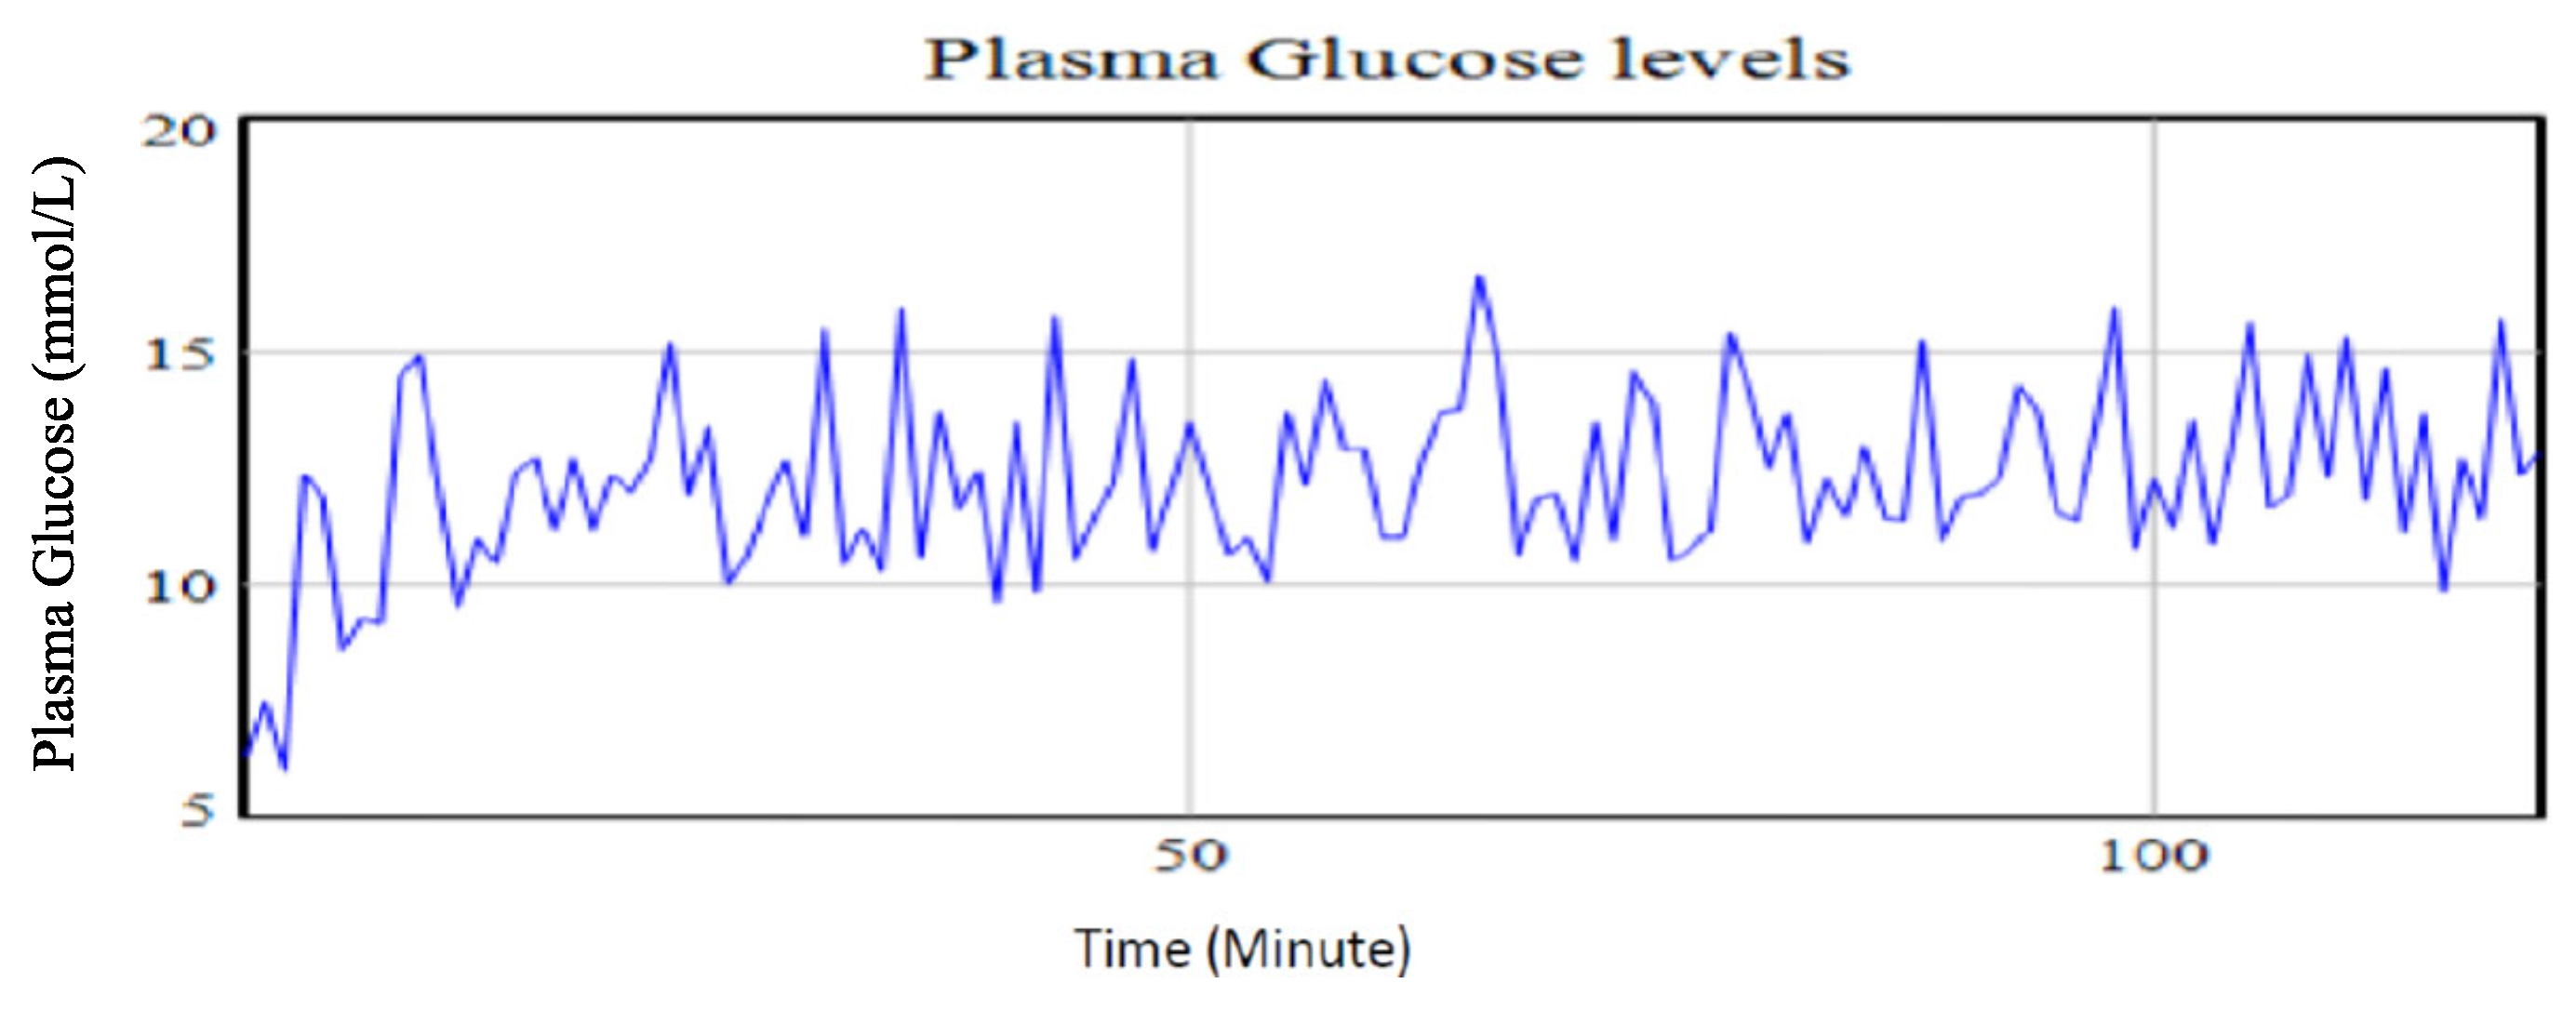
An increase in both the amount of carbohydrates intake and the stress level by 66.67% and 233.33%, respectively, while holding the exercise intensity at the base run level resulted in an increase of 30.59% in the plasma glucose levels. This scenario also had the largest variability in observed plasma glucose values. This means that the glucose management and control could be difficult as the glucose levels swing from one extreme values to the next. This, therefore, means that the corrective intervention will be both to regulate carbohydrates intake and to manage stress levels.
Figure 12 shows the simulated outcome of the increased amount of carbohydrates and stress level while holding the physical exercise at the base run.
From the simulated experimental runs, the best plasma glucose control levels for the type II IP patient are estimated to be attained when both the carbohydrates portion and stress levels are reduced below the base run values while maintaining moderately high to low physical exercises intensity as illustrated in
Figure 11. This combination of interventions strategies is estimated to give an average of 7.86 mmol/L which will be within the set target for the IP patient. It also projects the achievement of the least variability in the recorded observations of 1.827. This indicates that the patient will have better control of the plasma glucose levels.

 ,
, 


