1. Introduction
Measuring customer satisfaction is vital for companies in today’s competitive business landscape. Companies’ operational functions and top-level management activities can be significantly strengthened by understanding and analyzing customer satisfaction. It is crucial that organizations collect customer feedback on their performance across various business activities, analyze this feedback, and make decisions based on the customer insights [
1]. Satisfied customers are more likely to become loyal customers, and high customer satisfaction can increase customer retention and brand loyalty [
2]. The competitive market can put a lot of pressure on the company since numerous activities, such as testing and defining the quality of raw materials and finished products, packaging, distribution, and sales, are carried out in food processing. In most cases, food processing involves physical, chemical, and microbiological treatment and transformation of the raw materials [
3]. Most processed products consist of raw materials and ingredients that are produced separately; some of them are pre-disintegrated (by crushing into smaller particles) and used as ingredients for making finished products. At the same time, dairy products can be easily transformed into a condition that is not suitable for eating [
4] and can cause potential health hazards for consumers, costly product recalls, and negatively impact brand reputation [
5]. Therefore, strict control of the hygienic correctness of the process equipment and work surfaces, the shelf life of products at different storage temperatures, as well as trends in monitoring specific quality parameters are conducted during the production process.
To improve customer satisfaction and identify any factors that may impact it, the marketing department needs to understand the customer demands and expectations and subsequently translate these insights into product features [
1]. The motivation for conducting the present research stands for cultivating strong customer relationships, and maintaining loyal returning customers can strengthen an organization’s resilience and overall performance [
6]. The customers expect quality products in the foreground and demand that such quality be maintained at a high level throughout the whole product’s lifecycle. To meet those demands, different models based on fuzzy sets are developed for managing quality KPIs [
7]. At the same time, customer expectations come because of customers’ primary requirement that the food is supposed to be healthy and that the food is not subject to unwanted changes during the time of consumption.
At first, the company’s marketing department needs to understand the customer demands and expectations and then understand how to transfer these demands to the products’ features [
1]. In the current business conditions, a good relationship with the customer may even help increase the resilience of the company. To accurately predict customer purchasing behavior, company managers should first explore customer needs and wants and provide them with adequate stimuli. Additionally, customers should be provided with enough information about a set of products and how the product will meet their needs. In the beginning, customers will form an opinion (perception) about the products and how the product can meet their needs. After that, specific priorities are formed, and only then will the purchase decision follow. The manager should not neglect the customer’s feelings after the purchase because it affects customer retention and loyalty along with the impressions that the customer will convey to other potential customers through recommendations and word-of-mouth marketing [
8]. However, in the contemporary marketing funnel, the final phase marketers want to reach is customer advocacy [
9]. The feedback conveyed by satisfied customers to potential ones through recommendations and word-of-mouth marketing plays a pivotal role in attracting new customers and shaping a company’s reputation [
8,
9].
The important question is, what are the gaps or missing links that need to be addressed in the field of customer satisfaction assessment? The existing literature suggests various theoretical models for evaluating customer satisfaction [
10,
11]. An important feature of economic theories is that they are based on many assumptions about customer intentions [
12], and the main assumptions might include rational behavior, preferences, information, budget constraints, unmet needs, risk, and perceived quality [
13,
14]. Modern economists rightly point out that customers have the final say in the market, and the practice indicates that most customers consider the amount of money they have at their disposal, the time they should spend on the purchase, and the effort they would have to invest during the purchase. However, economic and sociological explanations of customer behavior do not consider the personal, individual-human factor [
15]; individual characteristics greatly influence consumer purchasing behavior.
Extensive analysis of the literature indicates that customer satisfaction can be analyzed through a variety of approaches, such as the MCDM approach [
16], customer satisfaction index calculation [
11], and different models based on statistics, for example, SERVQUAL [
17], artificial neural networks [
18], different metaheuristics, for example, the particle swarm optimization (PSO) and rough sets-based ANFIS approach [
19]. The main research gap can be identified through the shortcomings of the mentioned research. When speaking about MCDM methods, the main shortcoming is the bias of the decision-makers while choosing appropriate criteria and proposing criteria weights. The main shortcoming of statistical analysis, while assessing the customer satisfaction index, is the need for a large amount of input data originating from evidence that might be inaccurate and outdated. The main shortcoming of neural network application in the treated area seems to be the inaccuracy of the output due to network training issues.
The mentioned research gaps can be overcome through the application of a reliable model for the decision-makers to make assessments of the objective level of customer satisfaction.
To address these research gaps, a reliable model that can provide more accurate output data compared to the existing models and enable decision-makers to objectively evaluate customer satisfaction levels is needed. Following the stated, the goal of this research is to provide a model based on the ANFIS approach since it is based on the fuzzy logic system that needs fewer input data points compared to the statistical methods and neural networks, and at the same time, it provides more accurate output data. The model proposed in the scope of this research is based on neural networks. Many authors [
20] suggest that the problem of customer satisfaction assessment could be solved by applying a nonlinear fuzzy neural network model (NN) since it: (i) enables a better understanding of the interaction between variables in a more precise manner compared to multivariate statistic analysis, and (ii) minimizes the number of variables.
The use of this approach offers the following advantages [
20]: (1) it is capable of approximating various nonlinear functions, as demonstrated in this study dealing with a strongly nonlinear function; (2) all quantitative and qualitative information is uniformly distributed and saved in the neural network, which ensures a high degree of robustness; (3) the approach employs parallel distributed processing, which enables fast data processing. This makes it particularly suitable for performing complicated behavioral science analysis in the area of business management; (4) this model requires minimal setup. It only necessitates data for the input and output layers to analyze the dependencies between variables; (5) the number of learning epochs adapts to the relationships between variables without requiring prior understanding or a predefined sample. The research methodology used in this paper is based on the implementation of the adaptive neuro-fuzzy inference system (ANFIS) with MATLAB.
The paper is organized in the following manner. After
Section 1, which is dedicated to the introduction,
Section 2 presents the literature review from the analyzed field. The research methodology is presented in
Section 3, while
Section 4 presents the numerical results of the research.
Section 5 sets the discussion and conclusion.
2. Literature Review
Product features and customer preferences significantly impact customer satisfaction. Various mathematical models are used to determine and manage customer satisfaction, such as (i) statistical methods [
10,
11,
12,
13,
21,
22,
23], (ii) multi-criteria decision-making methods [
24,
25], fuzzy logic [
26,
27], and (iii) neural network and artificial neural network [
18,
19,
28,
29,
30]. Authors typically determine the number of factors (independent variables) according to which they evaluate customer satisfaction (dependent variable) based on the literature and/or best practices. In most cases, the values of the variables were obtained based on questionnaires defined in each were analyzed, where customers expressed their estimates using pre-defined measurement scales, and survey data collection was conducted. To analyze consumers’ behavioral intentions, a model based on service quality and satisfaction can be employed [
12]. It is important to note that service quality and satisfaction are dependent on a variety of factors that are not mutually independent. The properties of all factors of the proposed model were further evaluated by confirmatory factor analysis. The proposed model is then tested on a representative sample, evenly distributed by gender and mirroring the population, with a slight under-representation of respondents aged 56 years and older. The obtained results are analyzed by applying statistical analysis, and chi squared test is used to perform the comparison of the results obtained by the proposed model and other models.
The analysis of consumers’ behavioral intentions may also include the risk and the perceived quality [
13]. The mentioned model is adopted to be tested in the web environment, so 211 respondents articulated their assessment by using the seven-point measurement scale. In the first step, the authors confirmed a relationship between the tested factors and customer satisfaction by applying an exploratory factor analysis. In the second step, the covariance analysis of linear structural equations procedure defined in SPSS was employed to determine the correlation coefficients between several variables that can be either directly observed variables or unobserved hypothetical variables. Finally, the acceptability of the proposed model was tested according to different indices.
Another research proposed the robust customer satisfaction index (RCSI), a modified adaptation of the American customer satisfaction index (ACSI) to measure air transportation traveler satisfaction [
31]. The study included 503 respondents, traveling on domestic Colombian flights. Following the reliability and validity analysis, the structural equation model (SEM) was employed to evaluate the adequacy of the proposed RCSI. The results of the study indicated that the perceived quality and perceived value are strong predictors of overall passenger satisfaction.
In addition to examining consumers’ behavioral intentions, a significant number of research studies pointed to the assessment and ranking of the factors that impact customer satisfaction. In most cases, these problems have been stated as multi-criteria optimization tasks (MCDM) in an uncertain environment. In compliance with the mentioned, there is an assumption that enhancement of customer satisfaction might be achieved by taking defined actions that address the factors ranked in the first place. For example, the problem of customer assessment in the Kuwait banking sector [
16] has been analyzed through a sample of 863 participants. To ensure sample representativeness, it was decided to distribute as many questionnaires as available resources would permit and reach customers in different locations. The accuracy of the input data was tested by applying statistical tests, and the priority of factors that impact customer satisfaction was determined using a multiple-attribute approach.
Similarly, by applying MCDM, the customer satisfaction index might be calculated. In the case of the banking sector in Serbia, the factors with corresponding subfactors that impact customer satisfaction have been analyzed [
26]. In this case, all uncertainties in the relative importance of factors, subfactors, and values of subfactors were described by triangular fuzzy numbers, and the weights vector of subfactors and factors was calculated by using extent analysis [
32]. The aggregated values of factors were calculated by using a fuzzy order-weighted operator, and the value of the customer satisfaction index was based on fuzzy logic IF-THAN rules.
In the model for determining the European customer satisfaction index [
11], the assessment of the input variable values is based on the questionnaire containing 23 questions. Besides the model questions, demographic questions (e.g., age, gender, education level, etc.) are integral to the questionnaire. In the first step of the research, it was assumed that customer loyalty may be described through the linear multi-regression model. In the second step, all the treated factors were described by polynomial regression curves. The statistical analysis of the results obtained by the proposed nonlinear regression model by [
11] indicates that the provided information is essential for managers in developing marketing strategies as well as is a tool for measuring performance and benchmarking.
The literature indicates that the customer satisfaction index [
10] for smart services was proposed on a survey questionnaire developed through several rounds utilizing the Delphi method [
33]. The expert assessment was conducted using a ten-point measurement scale. This research is conducted in two steps. In the first step, the convergent validity and reliability were assessed by using composite reliability, factor loadings, and average variance; additionally, the correlation coefficient between dependent variables was determined. In the second step, the success of the prediction is measured by applying the chi-square test.
Different models based on statistics, such as SERVQUAL [
17], are also helpful in determining customer satisfaction. The mentioned model was used for determining customer satisfaction in the domain of public transportation [
23]. Besides SERVQUAL, the service quality and customer satisfaction might be analyzed by applying other models, such as the ACSI model. The ACSI model was used for the research in the mobile telecommunication industry [
22], where the input data were obtained through the questionnaire and denoted as primary data. A structured questionnaire was conducted with closed-ended questions to customers of the mobile operators. The secondary data were collected from the directories of the companies that were used in this study, online articles, and journals. The data analysis was based on descriptive statistics and regression analysis.
Different mathematical bases might be employed for the customer satisfaction assessment using artificial neural networks (ANNs). In the research related to customer satisfaction and loyalty in the pharmaceutical industry [
18], 19 specific dimensions of products and services have been analyzed. The analysis of the obtained data is performed by using linear regression analysis and ANNs. In the presented research, the advantages of using ANNs are highlighted, and the managerial implications of using ANN modeling to identify the key drivers and set priorities for improvements are demonstrated. Similarly, the determination of customer satisfaction from mobile phone users is analyzed [
28]. In the first step of that research, the multiple linear regression (MLR) model with 12 variables was conducted. The measure of the adequacy of the stated model is 0.41, which might be seen as in compliance with other cross-sectional studies. Based on the correlation coefficients obtained, the set of input variables was determined, so 46 participants were included. The input data were divided into two groups: (1) factors with a positive impact on customer satisfaction and (2) factors with a negative impact on customer satisfaction. In compliance with the stated, it has been suggested that multiple linear regression is not adequately precise for customer satisfaction assessment, and a better result might be obtained by applying ANNs.
The adaptive neuro-fuzzy model (ANFIS) has been widely used in the literature to solve various engineering problems [
34]. Further, ANFIS was used to stabilize the operation of aerobic granular sludge [
35]. The mentioned research indicated ANFIS to be superior to other methods in solving this problem. In other research areas, such as dealing with the problem of optimal extraction of groundwater resources, ANFIS was used to predict optimal groundwater exploitation [
36]. It has also been applied for very short-term and accurate energy consumption forecasts for educational buildings [
37]. Recently, ANFIS was found as a suitable method for solving the problem of diagnosis of fault nodes in wireless sensor networks [
38].
The customer satisfaction assessment might be analyzed by applying different metaheuristics such as particle swarm optimization (PSO) and rough sets-based ANFIS approach [
19]. The proposed research involved the following: rough sets theory is introduced to determine indispensable design attributes for generating customer satisfaction models. The PSO-based ANFIS approach was introduced to develop nonlinear customer satisfaction models. The proposed model has been tested on a large set of data. By comparing the training error, mean validation errors, and mean absolute deviation obtained by applying the fuzzy least-squares regression, fuzzy regression, and genetic programming-based fuzzy regression, it has been shown that the proposed model has a certain advantage over other treated models proposed. The mentioned research is extended with a more comprehensive model [
39].
The main difference between the analyzed model [
39] and our model is the larger number of hierarchical data levels, which is propagated to the more complex structure of the ANFIS model. There, the learning algorithm of the mentioned ANFIS is determined by using PSO [
40], rough sets theory, PSO, and the least square estimation [
39]. In our research, it is accomplished by a Delphi technique with TFNs and a fuzzy logic system (FLS).
In the ANFIS application for determining customer satisfaction, the calculated customer satisfaction is compared with other methods by using different errors. PSO-based ANFIS [
40] was compared with fuzzy regression, ANFIS, and GA-based ANFIS by using mean absolute error, a variance of errors, and testing error. The rough sets and PSO-based ANFIS approaches [
39] were compared with fuzzy least-squares regression, fuzzy regression, and genetic programming-based fuzzy regression by using mean absolute error and variance of errors. The results of our research are compared with case base reasoning (CBR), MLR, ANN, and FLS by using MAD, MSE, and MAPE.
3. The Research Methodology
In this paper, five methods for the estimation of the customer satisfaction index (CSI) are applied. The emphasis is on the hybrid algorithm ANFIS. The model presented in this research incorporates ANFIS, while other methods are used to verify and compare the obtained results. It is worth mentioning that ANFIS represents the hybrid algorithm of ANN and FLS. The type of the proposed research is characterized as descriptive quantitative research employing survey techniques for obtaining the input data. The graphical representation of the proposed research is presented in
Figure 1.
The determination of the CSI is based on the delivery of ANFIS calculation. The calculation is dependent on fuzzy logic base rules and input data for determining CSI, which are defined in the form of a survey. When the value of objective CSI is obtained, it should be compared with other methods’ results for verification and comparison of the obtained results. The least deviation of the obtained results compared to the calculation on the real data indicates which method provides the most precise results.
The proposed methodology consists of four phases which are further explained.
Phase 1: The survey for the determination of customer satisfaction is defined in compliance with the ACSI methodology. A sample of 109 surveys is collected. The data filtering and cleaning procedures are performed, so eight surveys have been removed from further analysis due to suspicious answers. With 101 regular surveys, the input database is formed as well as the testing database. The explanation in detail is provided in
Section 3.1.
Phase 2: At the beginning of this phase, the definition of linguistic expressions based on fuzzy sets is performed. The group of decision-makers used those linguistic expressions while delivering the fuzzy Delphi algorithm to define the rule base for FLS. Further, we use ANFIS for fine-tuning the FLS membership functions.
Phase 3: To justify ANFIS employment, other quantitative methods are used for the assessment of CSI. For this purpose, MLR, CBR, and ANNs are used. This is explained in more detail in
Section 3.4.
Phase 4: The obtained results from ANFIS and other solution methods are compared by using well-known calculated errors: MAD, MSE, and MAPE.
3.1. The Definition of Survey for Customer Satisfaction Assessment in Dairy Production Enterprise and Data Collection
In compliance with the ACSI model [
22], three variables have been analyzed with the purpose of determining CSI: customer expectations (CEs), perceived quality (PQ), and perceived value (PV). In this case, the CSI variable is dependent. The values for the denoted variables are determined according to the survey results considering customers’ answers. A production company from the dairy industry that operates in Serbia with retail stores has asked their customers to fill out the surveys and provide the input data for testing the proposed methodology.
As usual in this kind of research, cross-sectional surveys are used since the intention is to collect data from different types of groups of customers that may be denoted as adults at a single time. The sampling procedure to be applied is simple random sampling where individuals are chosen randomly. The products that are used by customers belong to the dairy industry, so practically there are no specific target groups that consume these products more than others. The customers are randomly selected at different store locations, and they are informed that their opinions will be used for scientific research. As written surveys require minimum usage of resources in terms of time and costs and at the same time, they are very convenient for obtaining the needed information, an approach is employed. Written surveys enable the absence of direct contact between the person who is collecting data and respondents, so errors induced in their interaction are avoided.
The survey is defined according to the results of the best practice. The survey is designed in a way to include only benefit and cost-type questions rated on a scale of 1–7. Value 1 stands for the least degree of belief and value 7 stands for the greatest degree of belief that the statement is true. The objective is to collect more than 100 surveys that may be used for the testing and training data, as well as for the control input data. The surveys are examined carefully so all samples with identified errors and suspicious content are removed. The process of obtaining the input data is presented in
Figure 2.
The value of each variable in the model is obtained as a mean value of all answers corresponding to that variable at the customer expectations level of each customer that filled out the survey. The group of 90 randomly selected surveys was used for the calculation and training of the ANN, FLS, and ANFIS. In this way, the objective CSI is obtained, so any new customer that fills the survey might be checked if his satisfaction significantly deviates from the large group of his predecessors. This can be very useful when modification of the product is introduced to the market. The group of 11 randomly selected surveys was used to compare the proposed methods’ results with real data.
3.2. The Definition of Fuzzy Logic Rules—Fuzzy Delphi
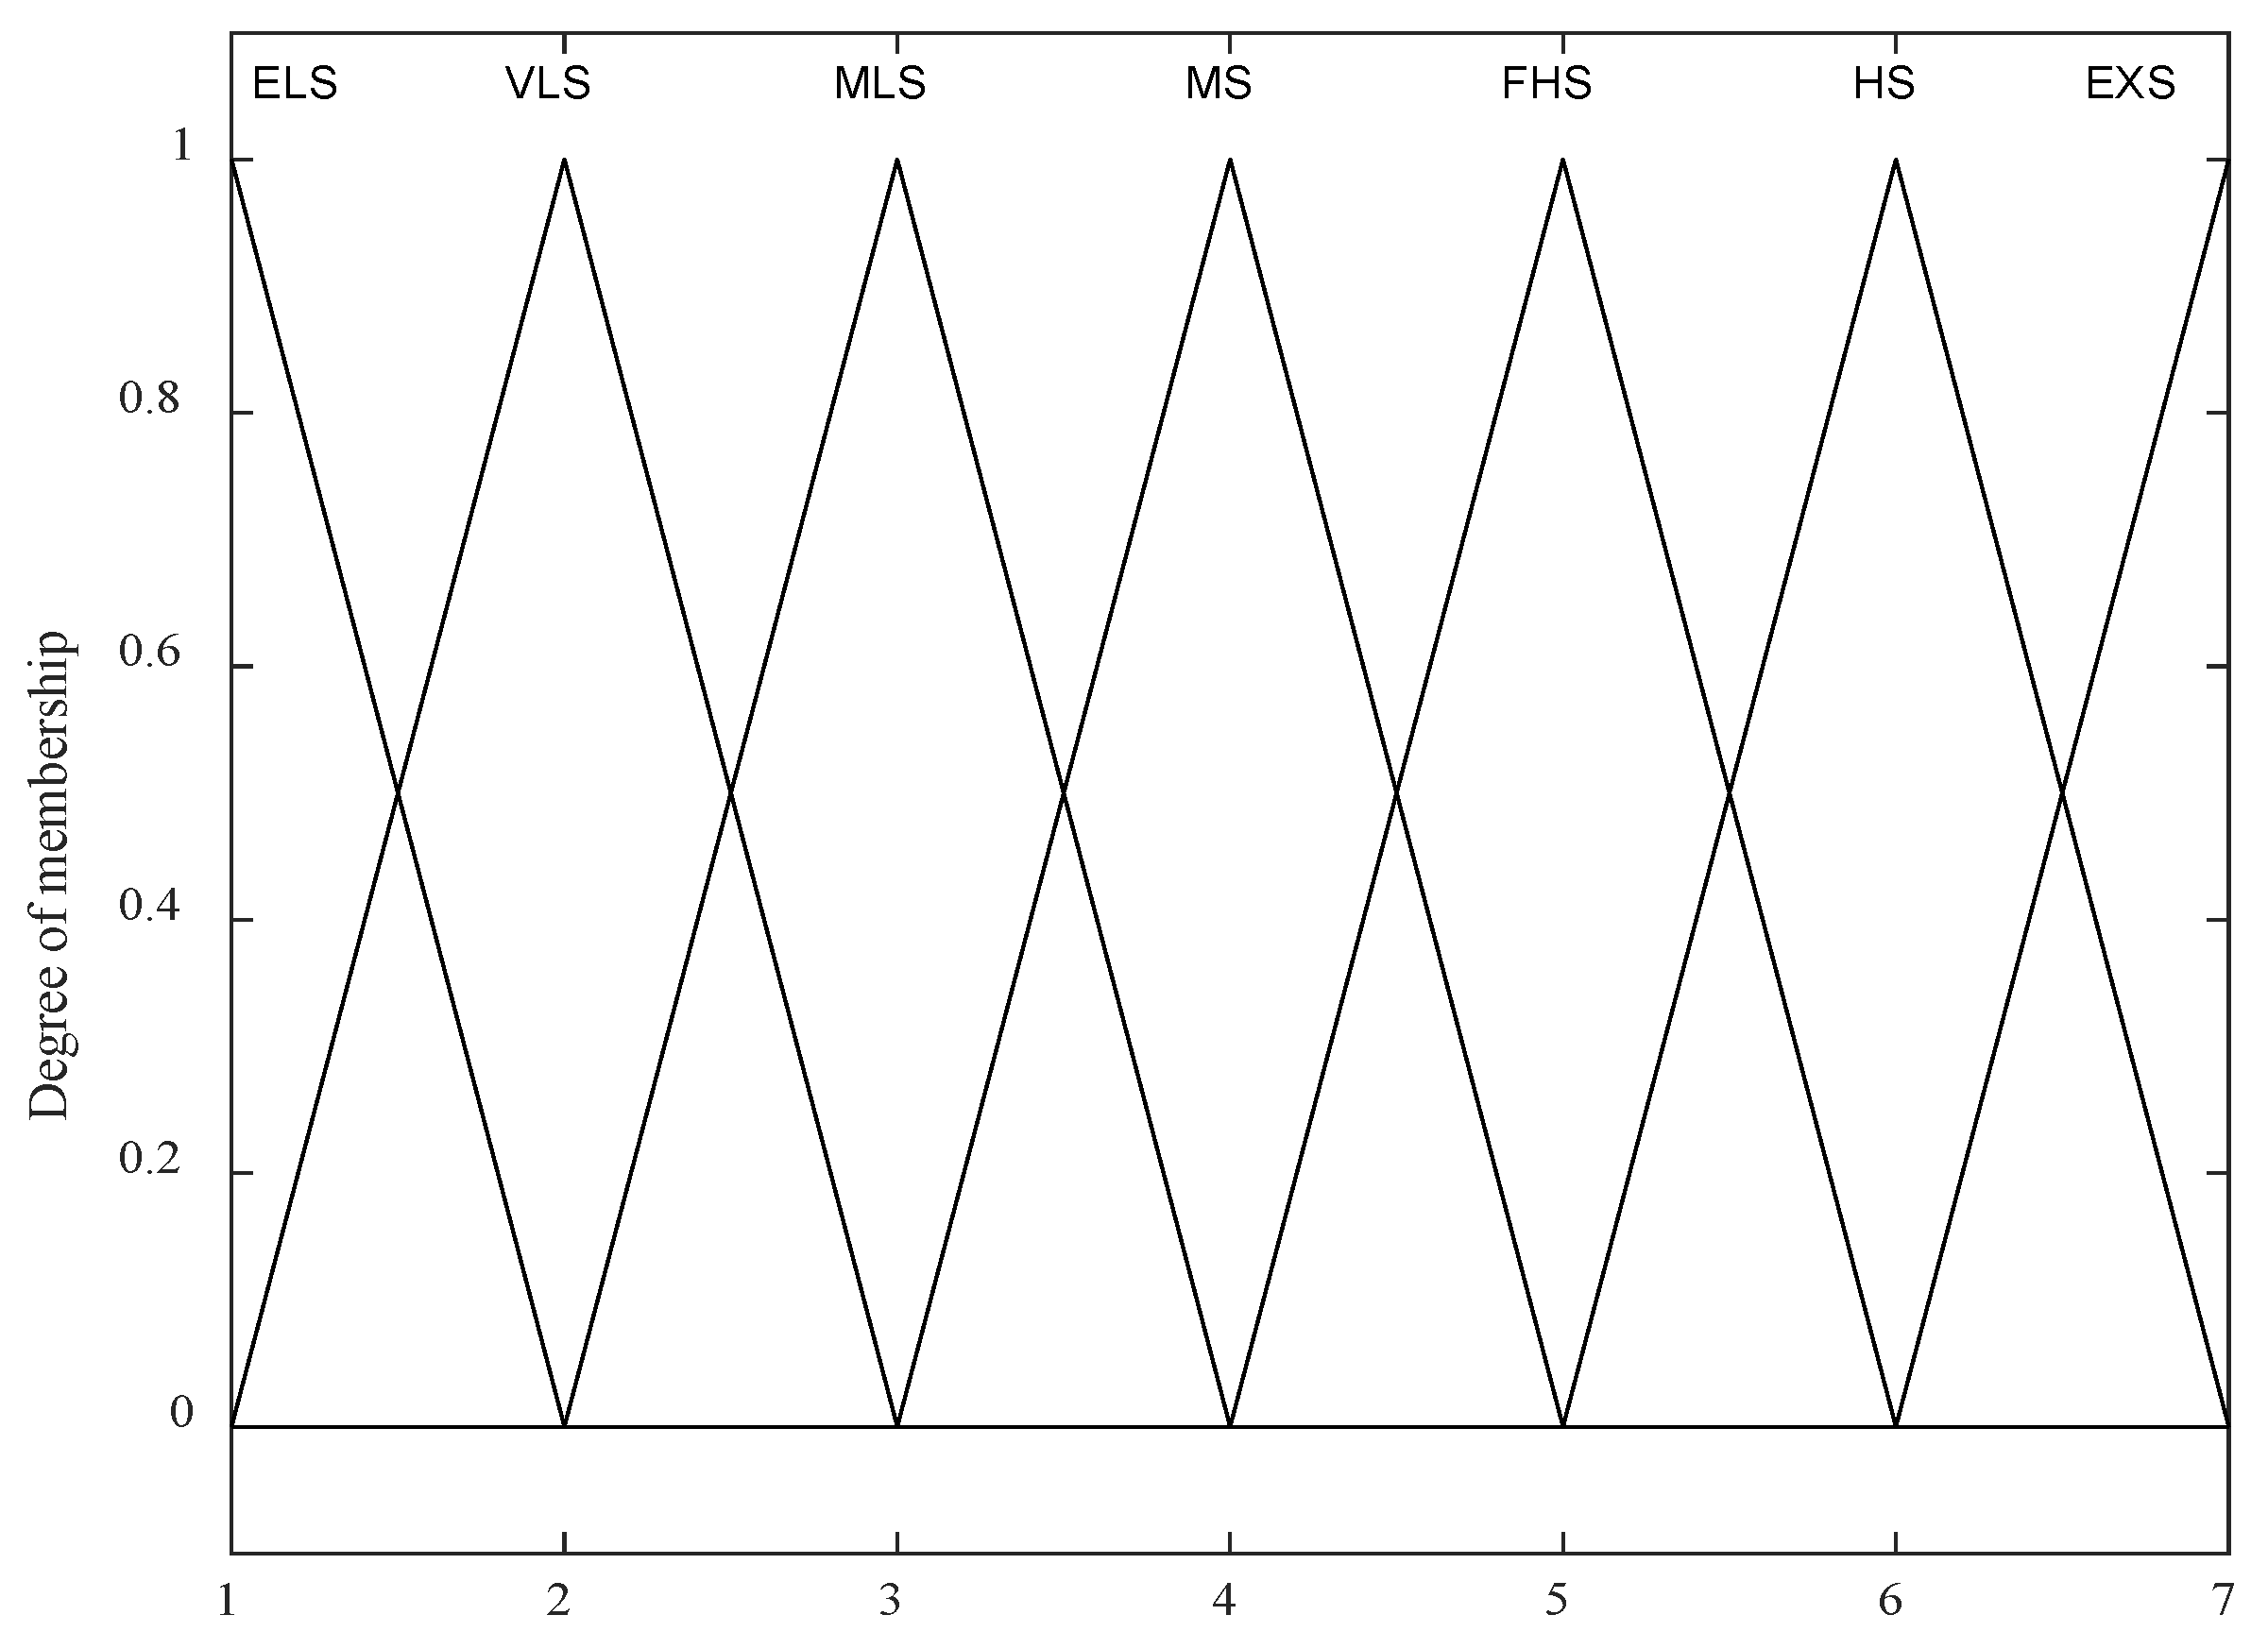
The fuzzy logic rules that are integrated into the ANFIS algorithm are defined by applying the fuzzy Delphi method proposed by this research. The used fuzzy linguistic expressions (
Figure 3) for the fuzzy Delphi method are distinguished from FLS, which is used for calculating CSI. These expressions are used to obtain crisp values representing the input in the rule base (
Table 1) for FLS and ANFIS.
It is assumed that the level of customer satisfaction depends on variables that can be described using three linguistic expressions: low, medium, and high. The fuzzy rule base is based on the fuzzy Delphi technique, where
decision-makers (DMs) participate. They may be formally presented by the set of indices
, and the index of DM is denoted as
. It is worth mentioning that there is anonymity of DMs who participate in the assessment of CSI since the survey does not reflect who has filled it. They submit their assessment in the written form after each iteration to the rest of the DMs. By respecting the values of input variables, DMs assess the level of customer satisfaction by using one of seven linguistic expressions (
Figure 3), which are modeled by triangular fuzzy numbers (TFNs):
Extremely low satisfaction (ELS);
Very low satisfaction (VLS);
Medium low satisfaction (MLS);
Medium satisfaction (MS);
Firmly high satisfaction (FHS)—;
High satisfaction (HS);
Extremely high satisfaction (EHS).
The values in the bracket represent the membership function parameters of the fuzzy set.
The domains of these TFNs are defined on the measurement scale . Value 1 and value 7 denote that the customer is completely unsatisfied or completely satisfied, respectively.
The proposed fuzzy Delphi algorithm is presented in
Figure 4.
The proposed fuzzy Delphi algorithm can be realized through the following steps.
Step 1. DM based on their knowledge and experience, respecting the values of input variables evaluates CSI, . In the presented research, there were DMs: marketing manager, sales manager, chief executive officer, chief financial officer, quality manager, and production manager.
Step 2. The aggregated value of DMs’ assessment,
, is obtained by applying the method of fuzzy geometric mean:
where the lowest and upper bounds of fuzzy numbers are denoted as
and
, respectively. The modal value is denoted as
.
Step 3. The distance TFN should be determined for each of the seven defined TFN , which are modeled by pre-defined linguistic expressions, , so that:
is the normalized Hamming distance [
41].
Step 4. The standard deviation (SD) should be determined:
where
represents the normalized Hamming distance.
Step 5. It may be assumed that the SD limit value, where the consensus is reached, is 0.01, or the total deviation of the DMs’ assessment compared to the aggregated value is 1% at most. Let us test the hypothesis at the 5% risk level that the obtained SD value is less than the assumed limit value. If the hypothesis is not fulfilled, then the process of assessment is brought back to step 1. Otherwise, step 6 is applied.
Step 6. Let us find the smallest deviation of the aggregated value of CSI from pre-defined linguistic expressions:
The aggregated CSI value can be at least away from the pre-defined linguistic expression .
Step 7. The defuzzified value of the linguistic expression
should be found by using the method of maximum possibility [
42]. It represents the crisp value of the CSI index (
Table 1).
As mentioned,
Table 1 represents the input for FLS and ANFIS.
3.3. The ANFIS
The calculation of CSI is based on “Sugeno” FLS with three input fuzzy sets and one output crisp set. All input fuzzy sets—Quality, Expectations, and Value—are described by three Gaussian membership functions (gmf): low gmf (1.247, 1), medium gmf (1.247, 4) and high gmf (1.247, 7), as shown in
Figure 5. The gmf is the abbreviation for the Gaussian membership function, which is characterized by two parameters: function center (c) and function width (
σ).
FLS was created based on “IF-THEN” rules. The “IF” part of the rule is a premise, while “THEN” represents a consequence. In our problem constellation, “THEN” represents a crisp value of CSI. The rule base is explained in
Table 1.
Due to the nonlinear dependence of the output variable on the input variables and the pronounced sensitivity of this dependence, it is necessary to fine tune the membership functions of the fuzzy logic system.
A hybrid algorithm that uses neural networks to optimize the shape of the fuzzy logic system membership functions was proposed by [
43].
Figure 6 reveals the layers of the ANFIS, with the 14 rules which are shown in the following form:
where
,
, and
are one of three membership functions of the input variables
(quality),
(expectation), and
(value), respectively.
Let
denote node
in layer
. The functions of each ANFIS layer from the network presented in
Figure 4 are the following.
Layer 1. The nodes of the first layer represent quantified values of input data sets. Each node is described by one of the Gaussian membership functions
, which are characterized by the two parameters—
(the function centre) and
(the function width):
Layer 2. Each node of this layer calculates the minimum value of three input values of the fuzzy neural network. The output values of the layer 2 nodes are the rule signification:
Layer 3. Each
-node in this layer calculates the total weight of
-rule from the rule base by the following equation:
Layer 4. This layer has 14 nodes that represent the output value CSI. Each node of this layer is connected with the normalized neuron from the previous layer. A defuzzification neuron computed the weighted consequent value of a given rule as:
where
is the total number of rules in the fuzzy rules’ base, while
and
are the consequence parameters of the
-th rule.
Layer 5. The only node of the fifth layer is the fixed node in which the output result of the ANFIS is calculated. It is a fuzzy set with determining membership degrees of the possible values of CSI for the determined customer. Defuzzification is performed in the fifth level node. The output value is a real number which is in the interval (1–7):
ANFIS Learning
The output ANFIS function is described in linear form from the consequences part of fuzzy rules.
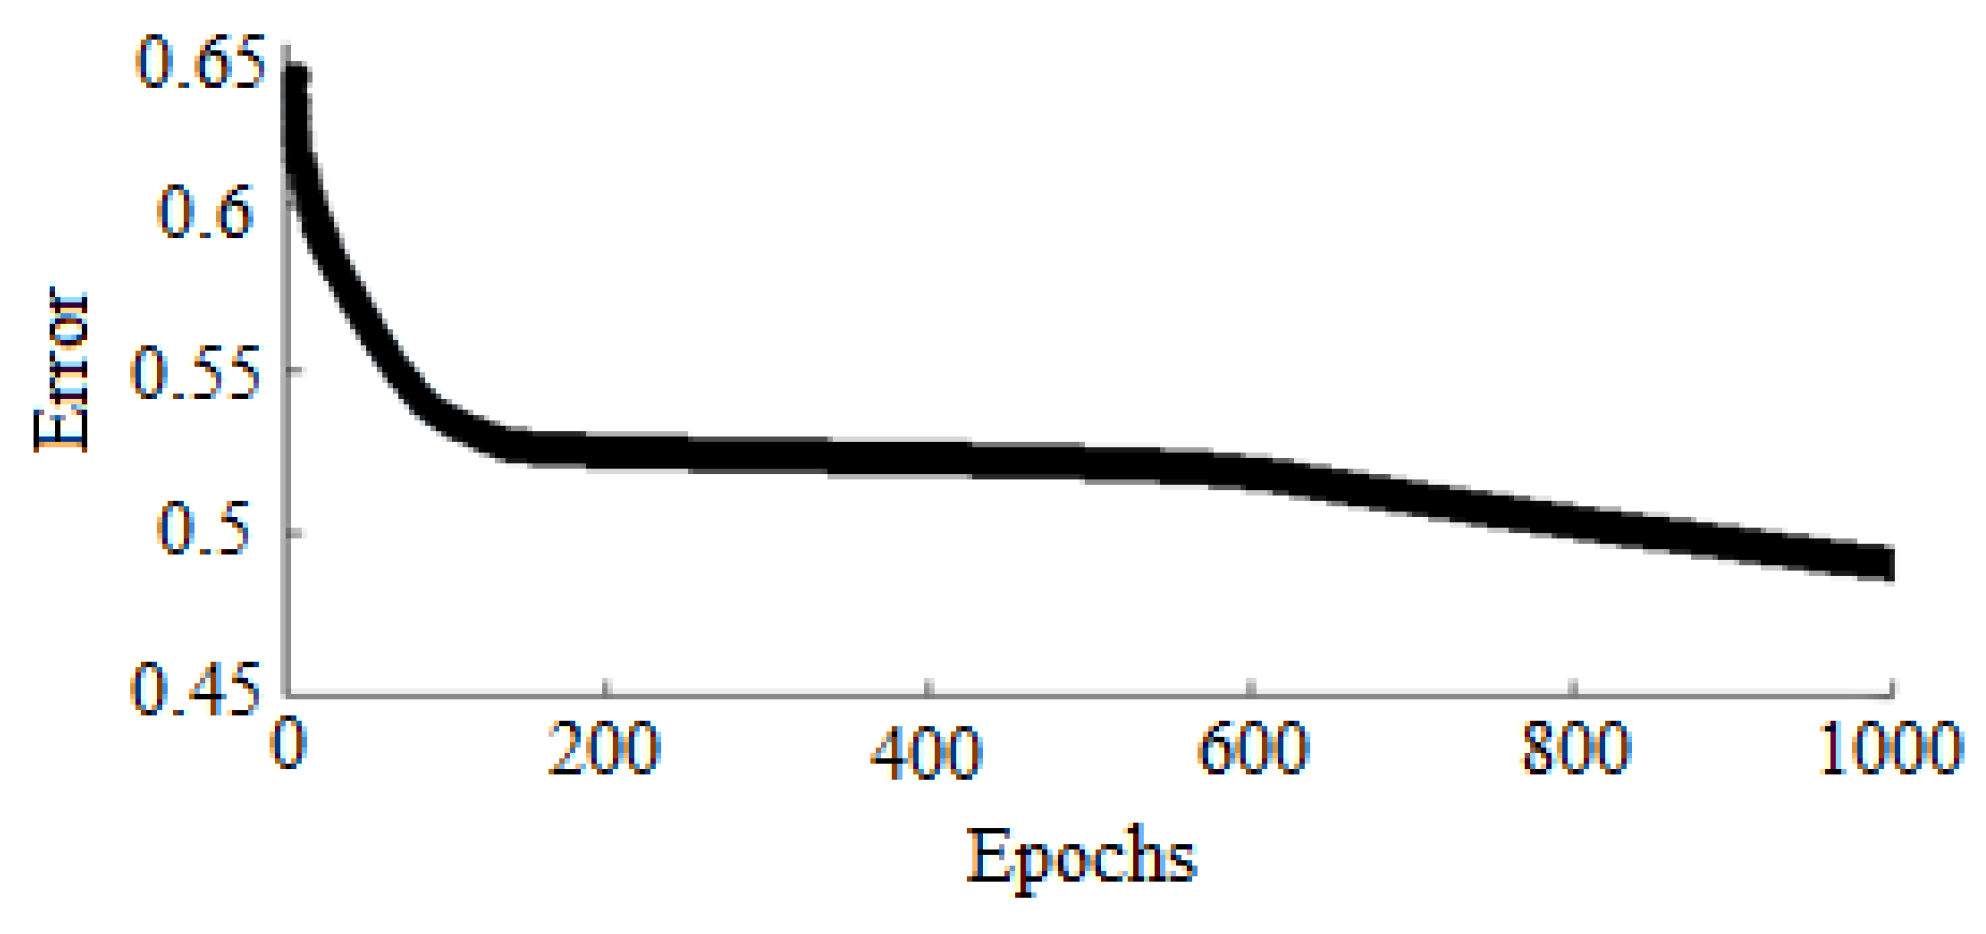
The error
is calculated in the same manner as in the case of ANN application to the subject problem. The number of epochs is set to 1000 (
Figure 7).
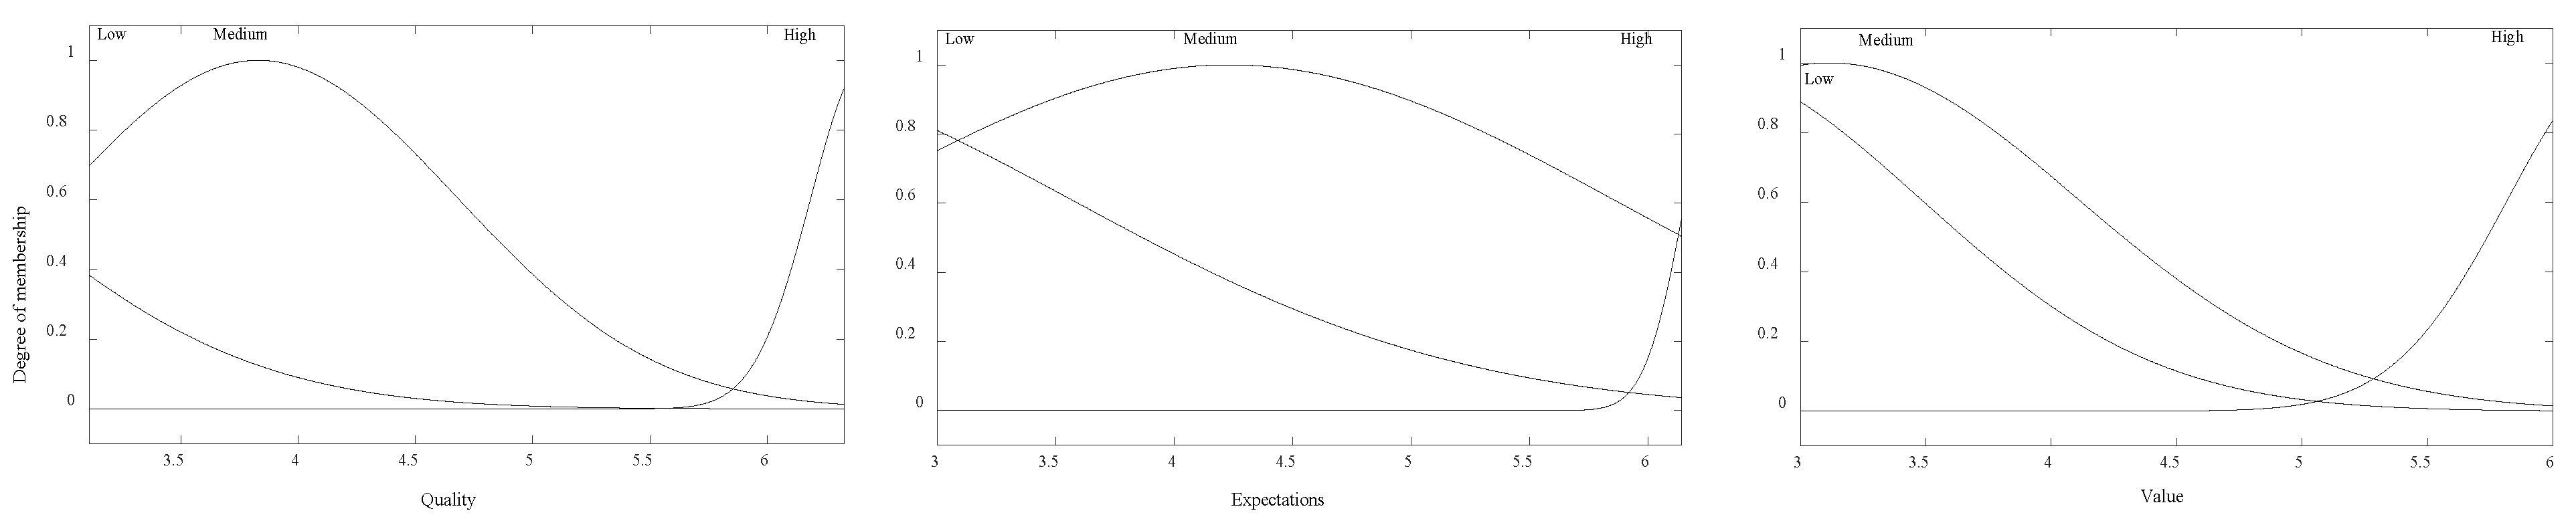
During the learning process, the membership functions have changed their shape. The parameters of the input value
are: low gmf (1.098, 1.591); medium gmf (0.847, 3.83); and high gmf (0.239, 6.426). The parameters of the input value
are: low gmf (1.641, 1.934); medium gmf (1.631, 4.232); and high gmf (0.166, 6.32). The parameters of the input value
are: low gmf (0.941, 2.544); medium gmf (0.995, 3.117); and high gmf (0.453, 6.271). The new look of the functions is presented in
Figure 8.
By application of the proposed ANFIS algorithm, the CSI values are obtained. Those values are represented in
Table 2.
3.4. Other Solution Methods
Customers have a wide choice of products at their disposal. The customers demand their product expectations to be met, so company management must continually seek new, innovative ways to meet the demands and expectations of its customers, all to survive in the marketplace.
Customer satisfaction is the opinion they have about a company or product, and it is based on comparing the perceived characteristics of the product with their expectations. Therefore, satisfaction needs to be measured to understand the experience that customers have while using the product. Satisfaction measurement involves data collection and analysis and is usually measured through a questionnaire. There are several methods of collecting data on customer satisfaction using a survey questionnaire, and the goal is to maximize the number of responses and have a representative sample.
3.4.1. Case-Based Reasoning (CBR)
CBR is a well-known method that provides a relatively quick and straightforward solution compared to other methods, making it very popular and applicable in solving a wide range of problems [
44].
The learning database consists of 90 input/output data pars. As there are 90 (out of learning database) input variables values, marked as a column vector , the CBR algorithm is suited for finding the most similar input variables from the learning database compared to vector. The input part of the learning database can be presented in the matrix form and the output part as the column vector
The measure of comparing mathematically can be formulated in the following way:
where
is associated with a new entry, and
is associated with the training base.
In each following step, it is necessary to generate s values that correspond to the criteria in Formula (1). Let
. Each of the obtained s couples of the input variables is associated with one value of the output variable
. In this way, three output values were obtained, arranged from the lowest to the greatest:
,
, and
. Each of these three values need to be assigned weight coefficients
. The final value
is obtained as the weighted average:
Adopted values for coefficients are 0.4, 0.35, and 0.25, respectively.
3.4.2. Multiple Linear Regression (MLR)
The method of machine learning that could be applied before more sophisticated tools of artificial intelligence such as FLS or ANN is MLR. According to this, the following linear equation is introduced:
where
are the coefficients and
is an intercept.
For the optimization of the regression coefficients and intercept, the following model of combinatory optimization is set:
The fitness function (FF) (14) minimizes the difference between the CSI from the learning database () and the CSI obtained by MLR () for all the m pairs of the training data. In the presented case, is equal to 90. The constraint (15) defines the interval for the feasible intercept values. The constraint (16) defines the interval for the feasible coefficients.
The following equation of multiple linear regression has been obtained:
The multiple coefficients of correlation
are calculated thus:
where
SD is the marked standard deviation. Adjusted R (
) is calculated as follows:
where
is the number of training data and
is the number of variables.
3.4.3. Artificial Neural Network (ANN)
ANN represents the universal approximator that maps one set of independent variables to another set of dependent variables. Since traditional analytical methods, such as CBR and MLR, do not always provide satisfactory results, it is necessary to examine the possibility of applying more sophisticated methods of machine learning.
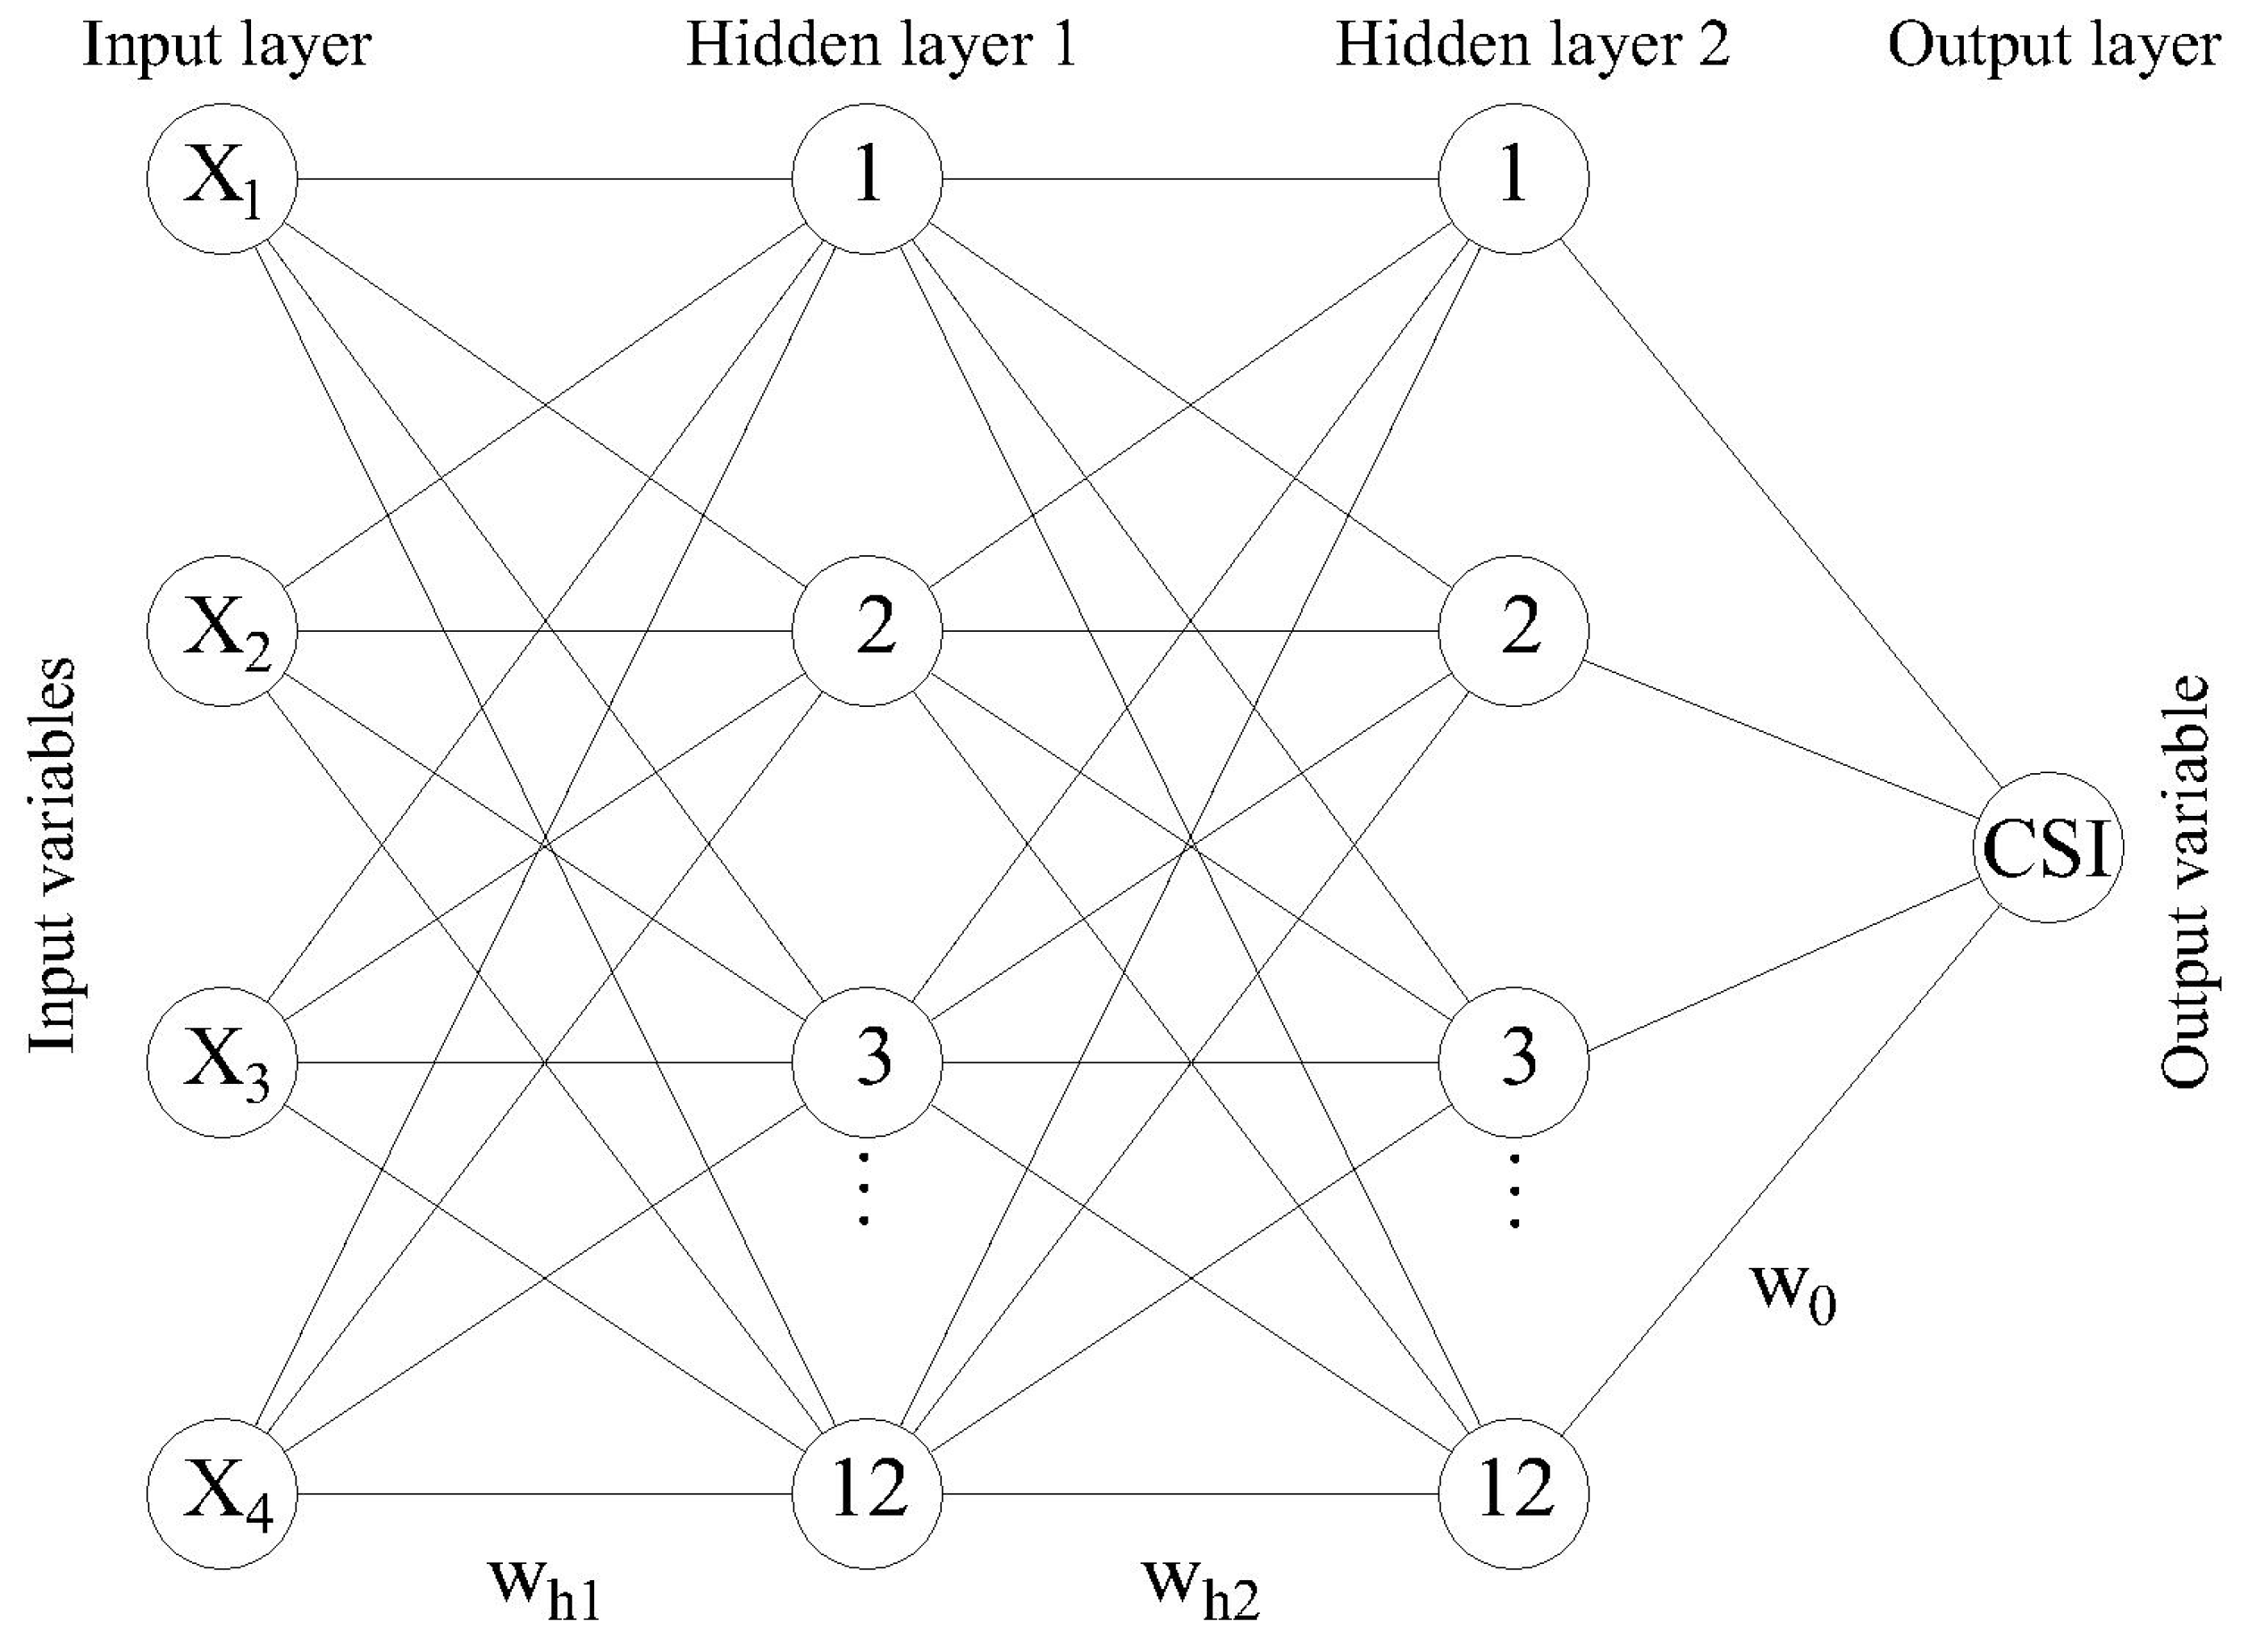
The method of trial and error led to the configuration of a neural network with two hidden layers and 20 neurons in each of the layers. The first layer of a neural network consists of input variables,
—quality;
—expectations;
—value, while the last, fourth layer, represents the output—CSI. The obtained configuration is presented in
Figure 9.
Each of the neural network layers consists of a number of neurons that are associated with the next layer by its weight. This connection (interdependence) extends in the direction from the input to the output layer. By fine-tuning weights and , the neural network is learning by estimating an error in each epoch (learning iteration).
The most widely used algorithm for the neural network learning process is backpropagation, which estimates an error (
) during the training as follows:
where:
—the neuron index,
,
—desired output, and
—obtained output. The ANFIS training was realized in 1000 epochs (
Figure 10).
More details about the backpropagation algorithm can be found in the work of the authors [
45] who initially proposed it.
4. Model Testing
The time duration of the data collection was one month since the data practice indicated no seasonality in demand during the year. All surveys that showed flaws and suspicious answers were removed from the research during data cleaning. The selected 101 surveys were used for data testing. The surveys that were divided into two groups with a ratio of 90:11 was randomly selected.
The output of the conducted calculations is the value of CSI regarding the products belonging to dairy products that are produced by one company in Central Serbia. It can be concluded that the customers are quite satisfied with the dairy products as the assessed CSI is relatively high no matter which methodology is used. However, there are small differences between the obtained results of each applied methodology, so results need to be compared. The management of the production company should choose the most precise methodology since their strategy decision might rely on customer satisfaction.
This section is set to compare the performance of the five solution methods CBR, MLR, ANN, FLS, and ANFIS algorithms to determine CSI. A numerical example on which the suggested methods are tested represents input data (), which have not been taken into consideration for the CBR, MLR, ANN, FLS, and ANFIS models. In other words, a comparison of the five models will be performed on the unknown input parameters.
In
Table 2, the testing results are shown for each of the suggested methods. The errors for each of these suggested methods were marked respectively. The error represents the gap between the database results and results that come from the proposed methods.
where:
is the value of CSI which is calculated based on the estimated values of customer satisfaction from the questionnaire,
is the calculated value of CSI, which is calculated by applying all the analyzed methods.
Results in
Table 2 reveal that ANFIS yielded a decrease of 44.44%, 54.54%, and 42.50% in MAD, MSE, and MAPE, respectively, compared to FLS.
Based on
Table 2, the linear dependence between the obtained data from all methods and data from the database is given in
Figure 11. The
values are 0.5756, 0.8072, 0.8169, 0.5814, and 0.8365 for CBR, MLR, ANN, FLS, and ANFIS, respectively. In comparison with the other methods, it can be concluded that ANFIS fits the database in the best way.
Taking into consideration MAD, MSE, and MAPE, ANFIS yielded a decrease of 16.67%, 16.67%, and 15.26%, respectively, compared to ANN. Also, ANFIS yielded a decrease of 21.05%, 0%, and 18.95% in MAD, MSE, and MAPE, respectively, compared to MLR. Finally, considering MAD, MSE, and MAPE, ANFIS yielded a decrease of 46.43%, 58.33%, and 44.06%, respectively, compared to CBR.
In the end, taking into consideration the sum of all error measures (MAD, MSE, and MAPE), the closest method to ANFIS is ANN (with an increase of 15.33%), while the farthest solution is provided by the CBR method (with an increase of 44.40%).
The graphical representation of MAD, MSE, and MAPE is presented in
Figure 12.
For the comparison of linear and nonlinear models, some authors consider the Akaike information criterion (AIC) to be the appropriate measure [
46]. For small samples,
could be calculated as [
47]:
where
k is the number of parameters of the analyzed methods.
According to values of 16.3086, 7.6606, 8.1295, 15.4976, and 5.6321 for CBR, MLR, ANN, FLS, and ANFIS, respectively, it could be concluded that ANFIS is better than MLR, as the second-best method, for 26.48%.
To describe the relationship between the input and output variables before (FLS, upper part of
Figure 13) and after (ANFIS, lower part of
Figure 13) the learning process, we show the inner sensibility of the model.
In the end, ANFIS can obtain reasonable and better data-fitted results compared to other methods: CBR, MLR, ANN, and FLS. Based on the insights and conclusions, decision-makers can make informed choices and develop strategies. These decisions can pertain to a wide range of areas, such as product development and marketing.
5. Discussion and Conclusions
Creating stronger and long-term relationships with customers and attracting and attaining loyal customers is the goal of every company. Loyal customers contribute to increased sales and profits and can serve as the company’s advocates, helping increase the market share. Satisfaction stems from expectations based on the degree of satisfaction of needs and desires, successful problem-solving, and satisfying consumer demands. A brand that customers recognize as the one that can meet their most important needs and wants will enjoy a high level of customer satisfaction and will build a base of loyal returning customers.
Positive customer feedback and testimonials can become a powerful marketing tool. This is of particular significance nowadays, with social networks as one of the main channels for customers to share their product feedback. Additionally, customer satisfaction insights can help identify areas for improvement and positively contribute to the company and brand. The proposed model bridges the identified gap in research, as explained in the introduction section. The shortcomings of the models based on pure MADM techniques, statistical analyses, and neural networks are overcome, which is shown in the previous section. The presented research deepens the understanding of the methods currently used for evaluating customer satisfaction and proposes a more accurate method for customer satisfaction assessment.
Research limitations and practical implications of the present study could be further presented. In the existing literature, only a few research studies assessed customer satisfaction without using self-reported measures collected through questionnaires. The determination of customer satisfaction through the questionnaires demands the engagement of resources in terms of personnel, money, and time with a noticeable constraint. The constraints are related to obtaining a representative sample in the survey study and the susceptibility to various types of biases due to the nature of survey studies, which requires a continuous validity check of the obtained data.
The FLS and ANFIS models are based on the fuzzy logic system that is obtained by employing the fuzzy Delphi technique. This fuzzy logic system is the base for future calculations, so those constraints are mastered. In the proposed model, the methods used for the determination of customer satisfaction are tested on the obtained input data whose validity is checked.
The practical implications of the research are summarized as follows. Five different methods are applied to calculate CSI. As fuzzy logic base is trained on the sample of 90 filled surveys, 11 are used for model testing. The gap between the actual value of customer CSI and the values obtained by applying the proposed methods is calculated by applying MAD, MSE, and MAPE. Considering the data provided in
Table 2, it may be concluded that the ANFIS algorithm provides the lowest gap between the real and calculated values of CSI. Successful companies define their strategic actions by data-driven decision-making. This is not a one-time process since it requires continuous monitoring and adjustment based on new data and changing circumstances. This iterative approach is allowed by the application of the proposed ANFIS model. It is worth mentioning that the obtained results could even be improved by testing it on a larger sample of input data so FLS could be enhanced.
Social implications are an essential aspect of the research since the proposed model is not a substitute for the original methodology of the customer satisfaction assessment. In this way, the CSI can be tracked throughout the whole year, so significant disruptions may be identified in real time. This can be used as a base for an agile and resilient response of the company. Further, the model can be applied when new products are introduced to the market or when some products are considered for pulling off the market. As customer satisfaction may have a positive impact even on the resilience of the company, this research is delivered in the scope of the project “Coping with unpredictable disruptions in the domain of Engineering Management—Organizational resilience enhancement—CODEMO”, supported by the University of Kragujevac.
The constraints of the research are mainly attributed to the need to conduct original research on customer satisfaction based on ACSI. Future research could analyze if all aspects of the customer satisfaction variables are embraced by the defined questions or those should be enhanced or expanded. Further, the consistency check of the input data might be delivered by some techniques. Future research could also investigate different industries, specifically the ones where there is a seasonality in customer demand, to compare the effectiveness of different methods for customer satisfaction assessment. Furthermore, other techniques, such as multi-gene genetic programming, which uses the genetic algorithm to find the best possible multiple regression model, will be used to solve the subject problem.


