1. Introduction
As global warming has impacted the earth’s environment, how to coexist with the natural environment has become an important issue. How to balance economic growth and sustainable development is an issue that governments and enterprises in various countries must face together [
1,
2]. Given this line of thinking, we must increase the extent of our responsibility for the social and ecological environment [
3,
4]. Therefore, corporate social responsibility (CSR) has now become a common business concept that is being promoted across the globe [
5]. It is clear that products must be produced with circular economy green thinking—reduce, reuse, and recycle—from development and design to production and processing [
6]. Only in this way can enterprises fulfill their social responsibilities and ease their burdens on society and the ecological environment.
Taiwan is the fifth largest exporter and the seventh largest producer of machinery and machine tools in the world [
7,
8]. For the machining industry, elevating the process quality of processed products can decrease the proportion of rework and scrap of processed products in the production stage. In addition, based on the concept of the Taguchi loss function, when the measured value of the processed product is closer to the target value
T, the mean time between failures (MTBF) of the product is longer [
9]. According to Kethley [
10], the Taguchi loss function is expressed as follows:
where
k is the multiplier and
T is the target value. In order to not lose generality, it was assumed that the tolerance of the product quality characteristics is
. For individual processed products, as the size of the processed product is closer to the target value
T, the process loss is lower. For the entire machining process, the expected process loss can be used as a tool through which to evaluate the process loss [
8]. In a normal manufacturing process, the expected value of the Taguchi loss function with
1 is displayed as follows:
where
and
. It is clear that
and
are two important factors that affect the expected value of process loss.
refers to the accuracy index, and
refers to the precision index [
8]. When the process mean
is closer to the target value
T, then the value of
is closer to 0, and the process expected loss is lower. Similarly, when the value of process variance
is smaller, then the value of
is also smaller, and the process expected loss is lower further still. In addition, the process yield of the product is also the function of
and
as per the following:
Based on the abovementioned, as the process mean
is closer to the target value
T, the value of
is closer to 0. Except for the lower process expected loss, the process yield is also higher. Likewise, when the value of process variance
is smaller, the process expected loss is lower, whereas the process yield is higher. Clearly, the decrease in the process expected loss can ensure an improvement in the process yield. Thus, the rates of rework and scrap for the processed product can be lowered in the manufacturing stage. In the meantime,
MTBF can also be extended after the product is sold, thereby achieving the effect of energy saving and carbon reduction [
11]. Based on the abovementioned, through aiming to assist all machining manufacturers, we examine whether the accuracy (
) and precision (
) of the process can meet the requirements of the Six Sigma quality level, whether improving the process allows it to reach the required level, and whether establishing a complete process loss evaluation and improvement model aids with this aim (which is an important issue).
Therefore, this paper uses the expected value of the Taguchi loss function as the evaluation index to develop a complete process loss evaluation and improvement model, which can not only assist machining manufacturers in enhancing process quality, but can also achieve the effect of energy saving and carbon reduction.
Since the process expected loss
has unknown parameters, the misjudgment led by sampling error may take place if the evaluation index
of the machining process loss is only evaluated by point estimation [
12]. In addition, companies emphasize the mechanism of quick responses, and—given costs and timeliness—usually the sample size is not big. Accordingly, the sample size will make statistical tests vary, and then inconsistent decisions will be made [
11,
13,
14,
15]. In addition, many studies have pointed out that the confidence interval-based fuzzy testing model can incorporate past accumulated data with experts’ experiences, so the precision of the test can be maintained in the state of small samples [
10]. Furthermore, according to the studies mentioned in the above literature [
8,
9,
13], fuzzy tests based on confidence intervals collect data with real numbers instead of fuzzy numbers, which are relatively simple and easy to collect. Therefore, in this paper, we propose a confidence interval-based fuzzy testing model for index
.
The remainder of this paper is organized as follows. In
Section 2, we derive a 100% confidence interval of
and develop a confidence interval-based fuzzy test for this index. In
Section 3, we derive a 100% confidence interval of the process expected loss and construct a confidence interval-based fuzzy test for the process expected loss. Next, in
Section 4, an application example is used to illustrate the application of the fuzzy evaluation model of the machining process that is proposed by this study. Lastly, conclusions are made in
Section 5.
2. Confidence Interval-Based Fuzzy Test of
According to Equation (2), the process expected loss is denoted as
, where
and
are two unknown parameters. As mentioned earlier,
is the accuracy index. As noted by Kethley [
11], accuracy can be leveled up by adjusting machine parameters; as such, the cost of improvement will be relatively low, and it will be relatively easy to succeed. Hence, this paper first develops a fuzzy test of the accuracy index
, as well as decides whether to improve it. In the era of IE 4.0 smart manufacturing, the offset that can stably control the process is viewed as quantity, even if the value of the accuracy index
is quite close to 0.
Let X
1, X
2, …, X
n be a random sample of random variable X; then, the maximum likelihood estimators of
and
are respectively expressed as follows:
and
where S
is the sample standard deviation. Thus, the estimator of the process expected loss
is denoted as follows:
In the normal manufacturing process, the expected value of the estimator is derived as follows:
It is clear that the expected value of the estimator is equal to . Thus, is an unbiased estimator of the process expected loss .
According to Chen et al. [
16], when the process quality reaches the
k-sigma quality level, then we have
and
. However, since the German government introduced Industry 4.0 in 2011, a number of companies have integrated information, communication technologies, and digital manufacturing technologies to promote a fully networked production environment of smart manufacturing [
17,
18]. Based on the studies of Liu et al. [
19], with the development and rapid evolution of emerging technologies such as the Internet of Things (IoT) and Big Data analysis, the manufacturing industry has also integrated and applied related technologies to move toward the goal of smart manufacturing. In addition, according to the research conducted by Askr et al. [
20], process offsets can be easily reduced by controlling optimal machine parameters. Clearly, we can reduce process losses by starting from lowering process offsets, as well as by striving to diminish the process variations to achieve the purpose of lowering process losses. In order to quickly control process shifts, process monitoring and adjustment must be carried out in the state of small samples and the non-mass production of defective sizes. This study first proposes a confidence interval-based fuzzy test of
. As mentioned earlier, the machining industry has been moving toward smart manufacturing since Industry 4.0. As such, the process mean, which is required to deviate from the target value
T, is quite small. Thus, the null hypothesis
is
, and the alternative hypothesis
is
, which is equivalent to
Let the random variable
T , then
T is distributed as a
t distribution with an
degree of freedom, which is denoted as
T. This study first adopts a confidence interval-based fuzzy test of
. Next, this study then derives the 100
% confidence limit of
as follows:
Therefore,
is the 100
% confidence interval of
, as shown below:
As noted by some studies, the
α-cuts of the triangular fuzzy number
is presented as follows:
When 0
0.01, then the set is
, where
It is clear that when
, then
, and the triangular fuzzy number of
is
, where
,
Therefore, the membership function of fuzzy number
is
where
is determined by
and
is determined by
Let set
be the area in the graph of membership function
as follows:
In addition, let the set
be the area in the graph of membership function
but to the right of the vertical line x
0, as depicted below:
where
such that
. As noted by Chen et al. [
21], let
, then
Let
, then
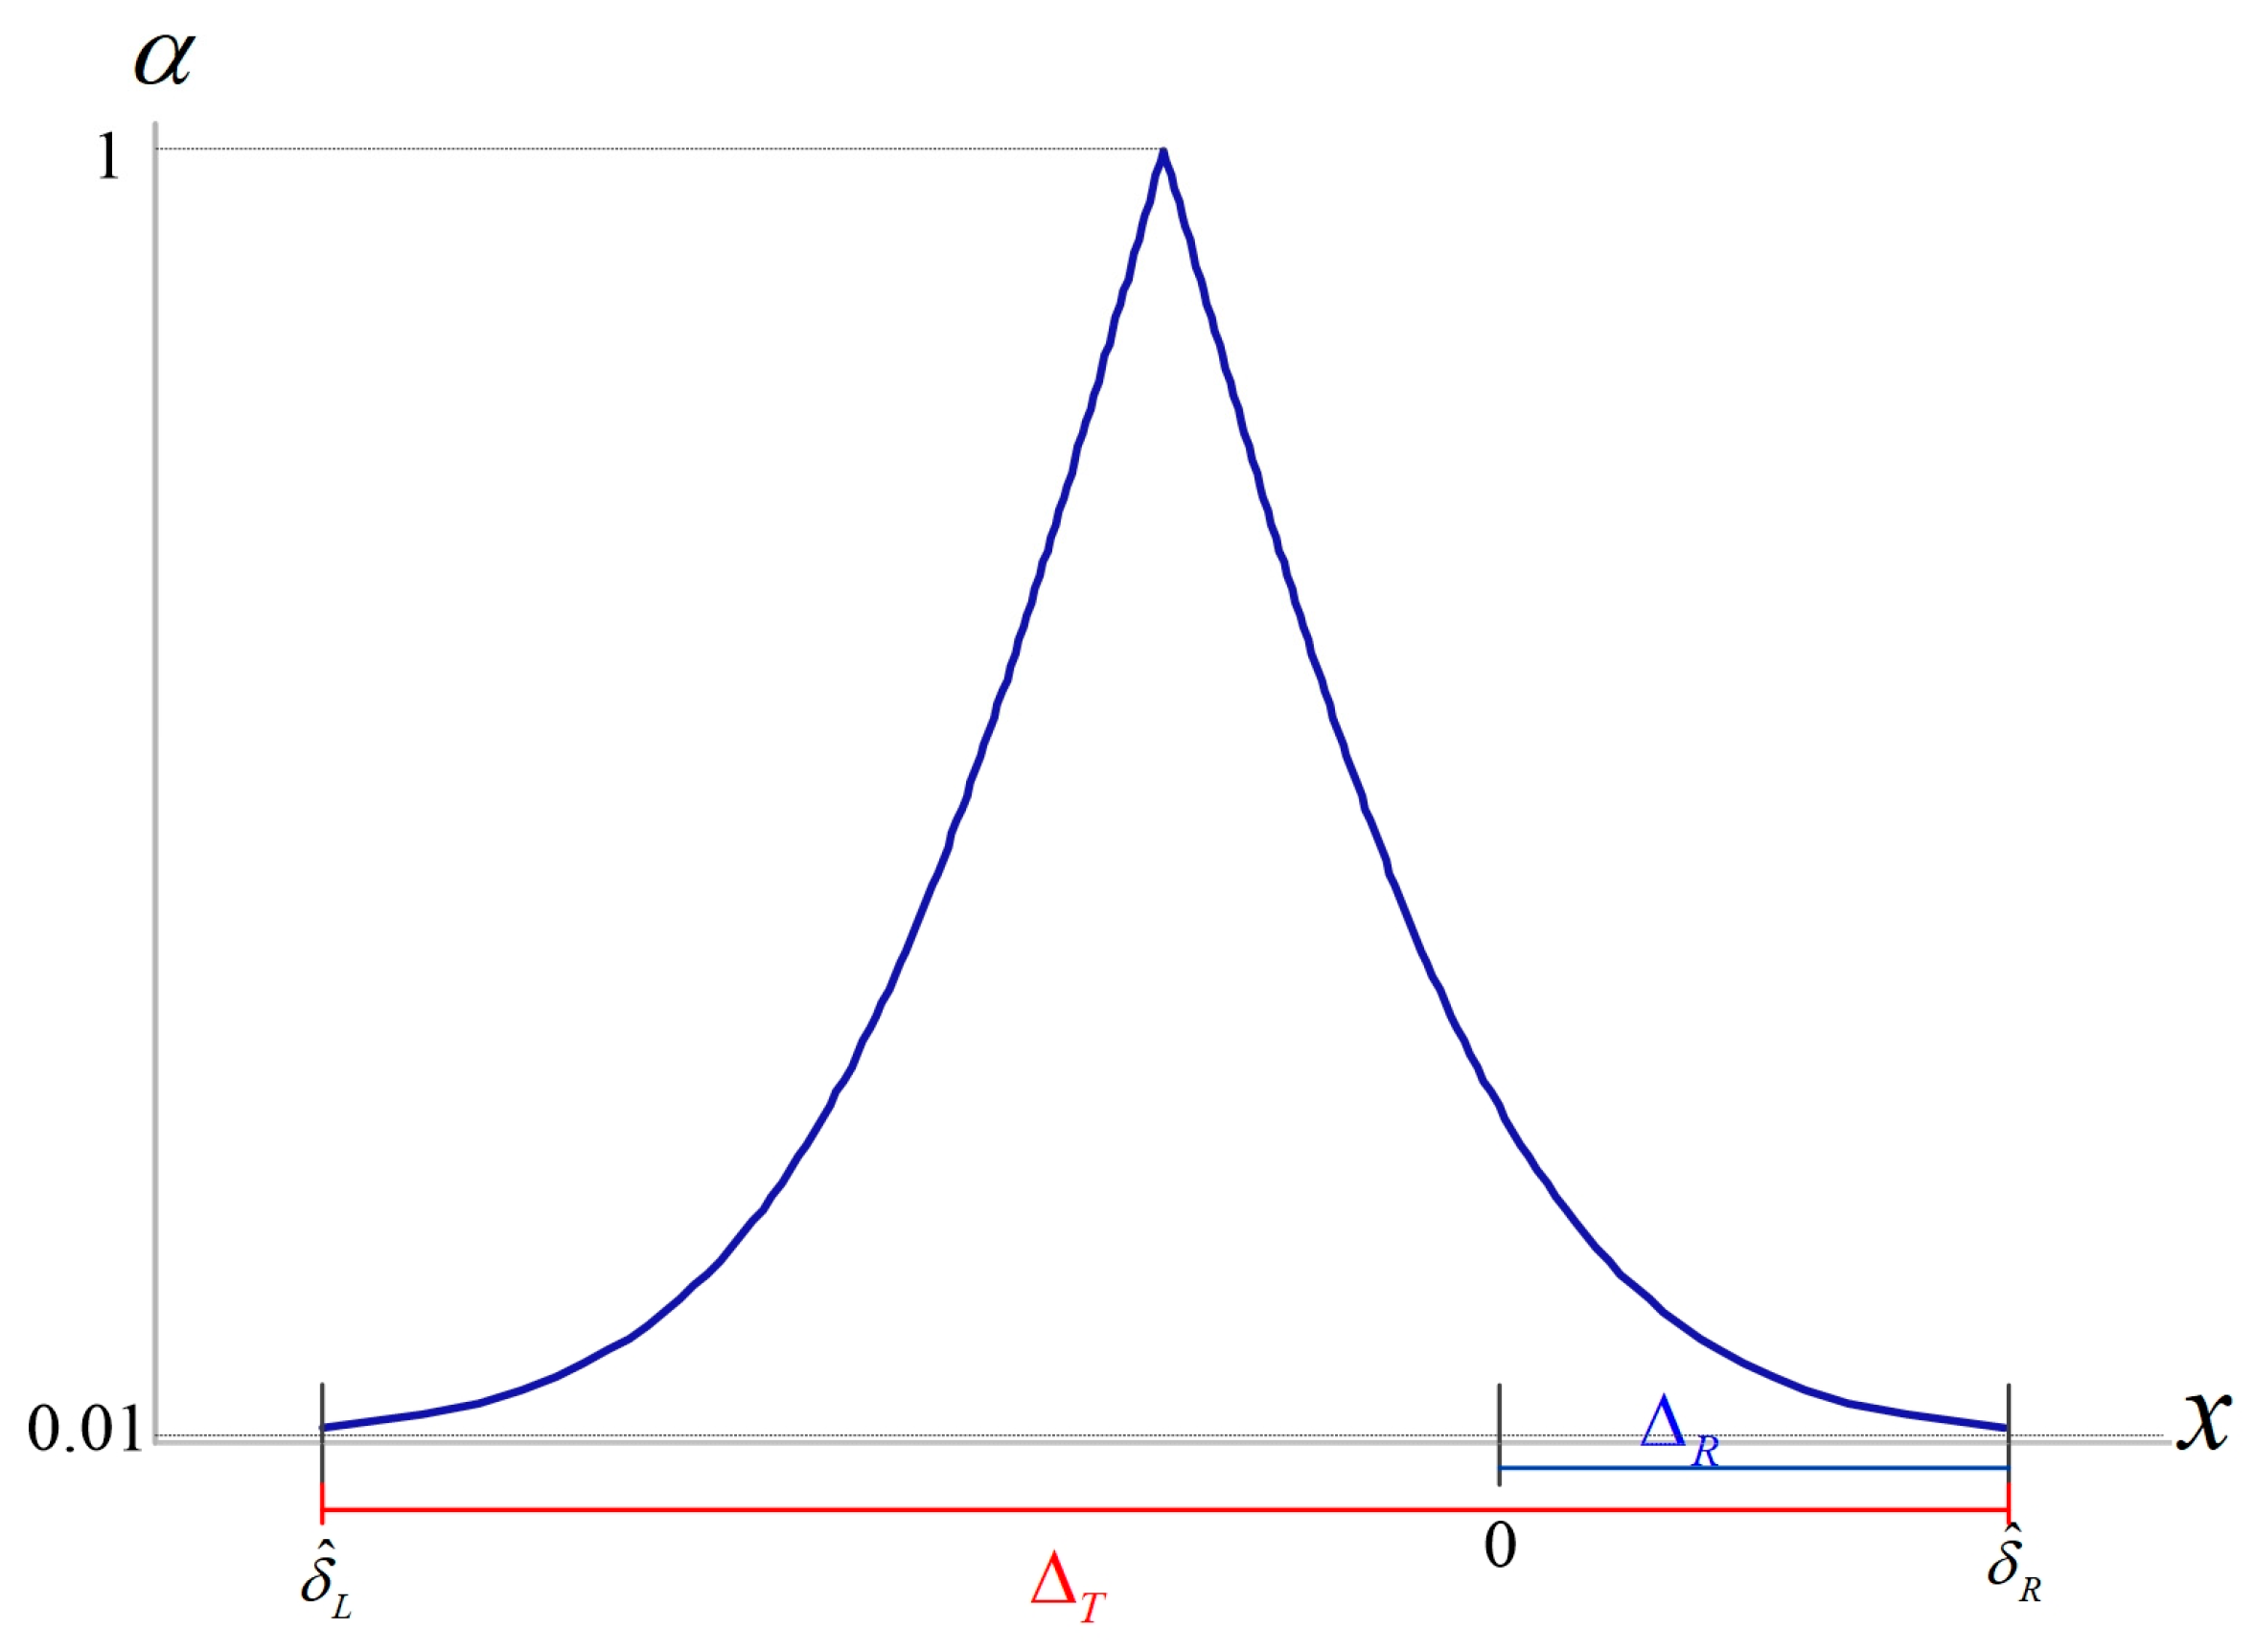
The membership function
relative to
and
is shown as follows (
Figure 1):
According to Chen and Yu [
22], let decision variable
be expressed as follows:
In this paper, we proposed fuzzy test rules and improvements in the measuring of the accuracy index based on the above decision variable D. Let the value of be between zero and 0.5, then the fuzzy test rules and improvement measures are made as follows:
When D , then reject and conclude 0, thus indicating that the process mean is shifted to the right. Thus, the process must be adjusted, and the mean must be moved to the left to lift the accuracy of the process.
When D , then do not reject and conclude 0, which means that the process mean is not deviated from the target value T; as such, the process does not need to be adjusted.
When D , then reject and conclude 0, thus showing that the process mean is shifted to the left. Therefore, the process must be adjusted, and the mean must be moved to the left to increase the accuracy of the process.
According to the above fuzzy test rules, the machining industry can deviate the process mean from the target value T to a relatively small degree in order to cut down process losses.
3. Confidence Interval-Based Fuzzy Test of Process Expected Loss
As mentioned in the previous section, in the era of industrial smart manufacturing, the Internet of Things and Big Data analysis technology have gradually matured, and the process offset that can be stably controlled is seen as a quantity, even if the value of accuracy index is quite close to 0. When the value of accuracy index is close to 0, the process expected loss () is the only remaining process variation that needs to be controlled. Therefore, this section develops the fuzzy test of the process expected loss based on this premise.
As mentioned before, the machining industry can make the process mean
deviate from the target value
T to a minimal degree in the environment of smart manufacturing. In addition, according to the abovementioned fuzzy test rules, the industry can tell whether the degree to which the process mean
is shifted from the target value
T is relatively small [
9]. At the same time, through the mechanism of improvement and adjustment, the deviation of the process mean
from the target value
T can be minimized. Based on this condition, we proposed a confidence interval-based fuzzy test of the process expected loss that is investigated in this paper. As noted above, when the process quality reaches the
k-sigma quality level, then the required value of
is smaller than or equal to 1/
k. When the process mean
deviates from the target value
T to a relatively low degree, i.e.,
0, then the required value of the process expected loss is smaller than or equal to 1/
. Then, the null hypothesis and alternative hypothesis can be shown as below:
Let a random variable be
K as follows:
where
is distributed as a normal distribution with a mean
and standard deviation
. Then,
K is distributed as a chi-square distribution with an
degree of freedom with
0, which is denoted as
K. Similar to
, this study first uses a confidence interval-based fuzzy testing model for the process expected loss
. Then, this study derives the 100
% confidence limits of the process expected loss
as follows:
Therefore,
represents the 100
% confidence interval of the process expected loss
as follows:
As noted by some studies, the
α-cuts of the triangular fuzzy number
is illustrated as follows [
10,
13]:
When 0
0.01, then set
, where
Based on the above, the triangular fuzzy number of
is
, where
Therefore, the membership function of fuzzy number
is
where
is determined by
and
is determined by
Let set
be the area in the graph of membership function
, as displayed below:
In addition, let set
be the area in the graph of membership function
but to the right of the vertical line y 1/
k, as expressed below:
where
such that
. As noted by Chen et al. [
21], let
, then
Let
, then
The membership function
relative to
and
is shown as follows (
Figure 2):
According to Chen and Yu [
22], let the decision variable be
, which is depicted as follows:
Then, in this study, test rules and improvement measures for the process expected loss were proposed based on the above decision variable . Let the value of fall between zero and 0.5. Then, the fuzzy test rules and improvement measures are to be made as follows:
When , then reject and conclude that the process expected loss does not meet the required level (), thus indicating that process variation must be reduced to cut down process losses.
When , then do not reject and conclude that the process expected loss meets the required level (), thus showing that the process does not require any improvement or adjustment.
According to the above two fuzzy test rules, the machining industry can make the process mean deviate from the target value T to a relatively low degree. Meanwhile, the process variation can be lowered to reduce the process loss.
4. Practical Application
As mentioned earlier, Taiwan is ranked fifth in the world’s export and seventh in global production of machinery and machine tools. For the machining industry, boosting the process quality of processed products can decrease the rework and scrap rates of processed products in the stage of production [
23]. In addition, according to the concept of the Taguchi loss function, the mean time between failures of the product is longer as the measured value of the processed product is closer to the target value
T. Since central Taiwan is a stronghold of the machinery and machine tool industry, it has not only the manufacturers of machinery and machine tools, but also many component processing factories in its surrounding area. In order to diminish the process losses of these components, this study takes the inner diameter of a gear processed by a machining factory in central Taiwan as an example through which to demonstrate the application of the two fuzzy testing models proposed in this paper. First, this study uses the confidence interval-based fuzzy test proposed in
Section 2 to test and monitor the process mean so as to ensure that the quantity of the process mean deviating from the target value
T is relatively small. Next, when the process mean is shifted from the target value
T to a relatively low degree, then the confidence interval-based fuzzy test of the process expected loss proposed in
Section 3 is employed to test and evaluate whether the process expected loss can meet the required level.
4.1. Fuzzy Test of
When aiming to minimize the process expected loss, engineers require that the deviation of the mean
from the target value
T must be small in the gear inner diameter machining process. Thus, the null hypothesis and alternative hypothesis
are defined as below:
In order to pursue a mechanism of rapid responses, the Taiwanese industry usually takes 15 or 16 samples from the production line for measurement and sampling. In order to perform the above fuzzy test, 16 samples were randomly selected from the processed product of a certain type of gear. The data of these 16 samples are listed as follows:
| 3.508, | 3.506, | 3.533, | 3.506, |
| 3.499, | 3.467, | 3.500, | 3.515 |
| 3.477, | 3.501, | 3.505, | 3.516, |
| 3.478, | 3.500, | 3.490, | 3.512 |
The tolerance of the inner diameter for this type of gear was found to be 3.5
0.05, that is, target
T 3.5 and
d 0.05. Then, the maximum likelihood estimators of
and
are respectively displayed as follows:
and
Therefore,
and the triangular fuzzy number is presented as
(−0.233, 0.02, 0.273). According to Equations (20) and (21),
and
are calculated as follows:
Thus, 0.273/0.506 0.540. Let 0.2, and, according to the fuzzy test rule (2), when 0.2 D 0.8, then do not reject and conclude 0. This represents that the process mean does not deviate from the target value T; as such, the process does not need to make any adjustment.
4.2. Fuzzy Test of Process Expected Loss
According to the abovementioned fuzzy test results, it was revealed that the process mean
that shifted from the target value
T was extremely small, i.e.,
0. As noted above, when the process quality reaches the Six Sigma quality level, then the required value of
is smaller than or equal to 1/6. Thus, the required value of the process expected loss
is smaller than or equal to 1/36. As such, the null hypothesis and alternative hypothesis are shown below:
In order to pursue a mechanism of rapid responses, the Taiwanese industry usually takes 15 or 16 samples from the production line for measurement and sampling. Let
, then 16 samples, after variable transformation is applied, are listed as follows:
| 0.154 | 0.129 | 0.656 | 0.127 |
| −0.018 | −0.664 | 0.008 | 0.299 |
| −0.460 | 0.017, | 0.106 | 0.322 |
| −0.443 | −0.007 | −0.209 | 0.246 |
Therefore, the sum of the squares of these 16 samples is denoted as
1.646, and the values of
,
, and
are calculated as follows:
Based on the above, the triangular fuzzy number of
is denoted as
(0.003, 0.085, and 0.150). According to Equations (38) and (39),
and
are calculated as follows:
Thus, 0.025/0.147 0.170. Let 0.2, and, according to the fuzzy test rule (1) of the process expected loss, when 0.2, then reject and conclude that the process expected loss does not meet the required level ( 1/36). This means that the process variation must be dwindled so as to lessen the process loss.
Based on the above evaluation results, the process engineers carried out improvement measures to lower the process variation. After collecting the improved 16 variables, the transformed sample data were written as follows:
| 0.114 | −0.027 | −0.168 | −0.175 |
| −0.064 | 0.358 | −0.246 | 0.275 |
| −0.299 | 0.046 | 0.021 | −0.152 |
| −0.109 | 0.130 | 0.156 | 0.368 |
Therefore, the sum of the squares of these 16 improved pieces of sample data was denoted as
0.644, and the values of
,
, and
were computed as follows:
Based on the above, the triangular fuzzy number of
was expressed as
(0.004, 0.053, and 0.094). According to Equations (38) and (39),
and
were calculated as follows:
Thus, 0.024/0.090 = 0.267. According to the fuzzy test rule (2) of the process expected loss with 0.2, when 0.2, then do not reject and conclude that the process expected loss meets the required level ( 1/36). This indicates the process improvement has a remarkable effect.
5. Conclusions
Governments and enterprises must take into account economic growth, as well as the natural environment, when dealing with the issue of global warming [
2,
3]. Under this thinking, we must shoulder the responsibility for the social and ecological environment; as such, corporate social responsibility (CSR) has now become a common business philosophy urged on by the state of the world [
5]. The expected value of the Taguchi loss function is
, and
and
are two key factors that affect the expected values of process losses. In addition, the product process yield is a function of
and
[
9]. As the process mean
is closer to the target value
T (the value of
is closer to 0), or as the value of the process variation is smaller (the value of
is smaller), then the process expected loss is lower, whereas the process yield is higher. It is clear that decreasing the process expected loss can ensure an increase in process yield. In addition to a decrease in the rework and scrap of the processed product in the stage of production,
MTBF can also be extended after the product is sold, thereby achieving the effect of energy saving and carbon reduction [
9]. Therefore, in this paper, the expected value of the Taguchi loss function was adopted as an evaluation index of the machining process loss. Since the process expected loss
contained unknown parameters, the misjudgment caused by sampling errors may be incurred if only the point estimates are used to assess the evaluation index
of the machining process loss [
16]. Furthermore, enterprises emphasize the mechanism of quick responses, and—given costs and timeliness—the sample size is usually not large. Consequently, statistical tests will vary due to the sample size, such that inconsistent decisions will be generated. As a result, this study first derived a 100
% confidence interval of
, as well as developed a confidence interval-based fuzzy test for this index [
13]. Next, this study derived a 100% confidence interval of the process expected loss, as well as established a confidence interval-based fuzzy test for the process expected loss. Numerous studies have suggested that the confidence interval-based fuzzy testing model can integrate past accumulated data with experts’ experiences, such that the accuracy of the test can be maintained in the case of small samples [
11,
13]. It is clear that the model proposed in this paper has the following advantages:
The expected value of the Taguchi loss function is used as an evaluation index, in which the accuracy index and the precision index can help the machining industry find the correct direction for improvement.
In addition to reflecting the process expected loss, this index can also reflect the process yield.
Since the fuzzy evaluation model based on the confidence interval can integrate experts’ experiences with past data, the evaluation accuracy can still be maintained in small samples in order to meet the requirements of enterprises for the purpose of rapid responses.
Apart from assisting machining manufacturers in boosting the quality of the machining process, the model can also effect energy saving and carbon reduction at the same time, such that machining manufacturers can reach their goals of fulfilling their corporate social responsibilities.
Overall, the evaluation model of the process loss built in this paper can help machining manufacturers review and enhance their own machining process capabilities through accuracy index and the fuzzy test of the process expected loss , thus achieving the effects of cost reduction, energy saving, and carbon reduction. The benefits of cost reduction and energy saving, as well as carbon reduction, are concepts; as such, they can be further explored in future research. In addition, an evaluation model could be established for the benefits of cost and carbon reduction so as to improve process capabilities.


