Article

Blood Gas Parameters and Acid–Base Balance during Extracorporeal Lung Support with Oxygenators: Semi-Empirical Evaluation

1
Institute of Physiology, University Hospital RWTH Aachen, 52074 Aachen, Germany
2
Clinic for Thoracic Surgery, University Hospital RWTH Aachen, 52074 Aachen, Germany
*
Author to whom correspondence should be addressed.
Mathematics 2023, 11(19), 4088; https://doi.org/10.3390/math11194088
Submission received: 25 August 2023 / Revised: 26 September 2023 / Accepted: 26 September 2023 / Published: 27 September 2023
(This article belongs to the Special Issue Trends and Prospects of Numerical Modelling in Bioengineering)

Abstract

:
Membrane artificial lungs (oxygenators) are used in cardiopulmonary surgery as well as, in some cases, in severe lung disease to support the natural lung by means of ECMO (extracorporeal membrane oxygenation). The oxygen and carbon dioxide transfer rates of any oxygenator are usually assessed by considering several blood gas parameters, such as oxygen saturation, hemoglobin concentration, partial pressure of oxygen and carbon dioxide, bicarbonate concentration, and p H . Here, we report a set of semi-empirical equations that calculate such parameters directly from their partial pressures and assess the acid–base balance during ECMO. The implementation of this equation set permits the evaluation of any oxygenator, existing or prototypes in development, as well as the development of clinical decision-making tools for predicting the blood gas state and acid–base balance during surgical interventions and ECMO. The predicted results are then compared with experimental data obtained from in vitro gas exchange investigations with a commercial oxygenator using fresh porcine blood. The high correlation, R 2 > 0.95 , between the predicted and the experimental data suggests a possibility of using such empirical equations in the simulation of gas transfer in a cardiopulmonary system with an oxygenator for any venous inlet blood gas data and also for estimating the acid–base balance during such therapy.

1. Introduction

Oxygenators [1,2], today mainly capillary membrane artificial lungs, are used in cardiopulmonary surgery as well as in some cases of severe lung disease to support the natural lung by means of ECMO (extracorporeal membrane oxygenation). In addition, they are also used for some specific therapies, such as extracorporeal carbon dioxide removal (ECCO2R) [3]. The partial pressure of oxygen p O 2 , partial pressure of carbon dioxide p C O 2 , oxygen saturation S , and oxygen and carbon dioxide transfer rates ( O T R s and C T R s ), together with p H and other acid-base parameters, are the main blood gas parameters that represent the physiological state of the blood. The oxygen transfer rate ( O T R ) and carbon dioxide transfer rate ( C T R ) of an oxygenator have been established as the determining factors of any oxygenator’s gas transfer performance. O T R depends primarily on the blood flow rate and blood saturation at the inlet of the oxygenator [4]. C T R , on the other hand, due to high diffusion capacity, is more affected by the gas flow rate and its ratio to the blood flow rate. The removal of carbon dioxide has a pronounced effect on p H and, subsequently, on the H C O 3 level of blood. It is, thus, essential to determine, beforehand, the impact of the C T R on the acid–base state of the patient before applying ECCO2R therapy.
Usually, the gas transfer performance of oxygenator prototypes is evaluated through in vitro investigations in compliance with the International Organization for Standardization (ISO) 7199:2016 [5] before proceeding to any clinical trials. To calculate O T R and C T R , various blood gas parameters need to be measured frequently at both the inlet and outlet ports of the oxygenator in the course of these in vitro investigations, such as oxygen and carbon dioxide partial pressure ( p O 2   mmHg and p C O 2   mmHg ), oxygen saturation S ( % ) , hemoglobin concentration c H b   ( g / dL ) , hematocrit H c t   ( % )   , p H , bicarbonate concentration [ H C O 3 ]   ( mmol / L ) etc. In this study, we evaluate the accuracy of semi-empirical equations for oxygen and carbon dioxide dissociation curves to directly calculate the O T R and C T R of an oxygenator from the p O 2 and p C O 2 at its inlet and outlet.
The oxygen dissociation curve expresses S as a function of p O 2 for defined p H , p C O 2 , and temperature. Oxygen saturation S and hemoglobin concentration c H b are required for the estimation of chemically bound oxygen concentration ( c O 2 , c h e m i c a l   mL / dL ) in blood. The concentration of physically dissolved oxygen c O 2 , p h y s i c a l ( mL / dL ) can be calculated directly from p O 2 using Henry’s law of solubility [6]. The carbon dioxide dissociation curve relates p C O 2 with the total carbon dioxide content c C O 2   ( mL / dL ) in blood for defined p H and S .
Apart from the estimation of carbon dioxide content directly from its partial pressure, this article also takes into account the relationship between p H , p C O 2 , and [ H C O 3 ] as according to the Henderson–Hasselbalch equation [7] to predict the acid–base state. The analysis further considers the initial condition of p H and [ H C O 3 ] and the slope of the corresponding buffer line. Such a prediction could help in predicting the direction and outcome of the respiratory compensation for p H balance, as provided by the extracorporeal carbon dioxide removal.

2. Materials and Methods

2.1. Estimation of Oxygen and Carbon Dioxide Content from Their Partial Pressure

Kelman subroutine [8] for the calculation of S ( % ) from p O 2   ( mmHg ) is given in Equations (1) and (2). The calculated S is then used for the calculation of oxygen concentration ( c O 2 mL / dL ) using Equation (3).
p O 2 , a d j = p O 2 × 10 0.024 ( 37 t e m p ) + 0.40 ( p H 7.4 ) + 0.06 ( l o g 40 l o g p C O 2 )
S ( % ) = 100 × a 1 x + a 2 x 2 + a 3 x 3 + x 4 a 4 + a 5 x + a 6 x 2 + a 7 x 3 + x 4 ;   x = p O 2 , a d j
c O 2 = 1.34 × c H b . S ( % ) 100 + α O 2 p O 2 ( 1 H c t ( % ) 100 )
H c t ( % ) = 3 × c H b
a 1 to a 7 are the coefficients for oxygen dissociation curve, and their empirically derived values are a 1 = 8532.2289 ,   a 2 = 2121.401 , a 3 = 67.073989 , a 4 = 935 , 960.87 , a 5 = 31 , 346.258 , a 6 = 2396.1674 , and a 7 = 67.104406 , 1.34 m l O 2 / g H b is the Hüfner constant, c H b ( g / dL ) is the hemoglobin concentration, H c t ( % ) is the hematocrit value, which is estimated to be thrice the value of the hemoglobin concentration c H b   ( g / dL ) [9], and α O 2 = 0.00317 mL / dL / mmHg is the solubility coefficient of oxygen at 37   o C .
Similarly, the equation for the calculation of carbon dioxide content ( c C O 2 mL / dL ) in blood from p C O 2 (mmHg) by Douglas et al. [10] is given in Equations (5) and (6).
c C O 2 , p l a s m a = 2.226 · α C O 2 · p C O 2 · 10 p H p K
c C O 2 , b l o o d = c C O 2 . p l a s m a ( 1   0.0289 c H b ( 3.352 0.00456 S ( % ) ) ( 8.142 p H ) )
α C O 2 and p K in Equations (5) and (6) are 0.0307 mmol / L / mmHg and 6.0907 [11], respectively, at 37 °C, and 2.226 is the conversion factor from mmol / L to mL / dL .

2.2. Estimation of Blood Gas Parameters Based on the Empirical Equations and Initial Conditions

It is apparent in Equation (5) that the concentration of carbon dioxide depends not only on the partial pressure of carbon dioxide but also on the p H value of the blood. The relation between p C O 2   mmHg , [ H C O 3 ]   mmol / L and pH is further explored via Henderson–Hasselbalch equation (Equation (7)). The additional equation for the relationship between p H and H C O 3 is obtained via the buffer line (Equation (8)).
p H = 6.1 + log 10 [ H C O 3 ] [ 0.03 p C O 2 ]
[ H C O 3 ] H i = m ( p H p i )
Here, H i and p i are the initial bicarbonate concentration and p H . From Equations (7) and (8), for any p C O 2 , p H value can be estimated based on the initial conditions. This, in return, will provide more accurate model for calculating the c C O 2 , b l o o d in blood. Furthermore, the buffer line Equation (8) determines the direction of acid–base state during the extracorporeal carbon dioxide removal.

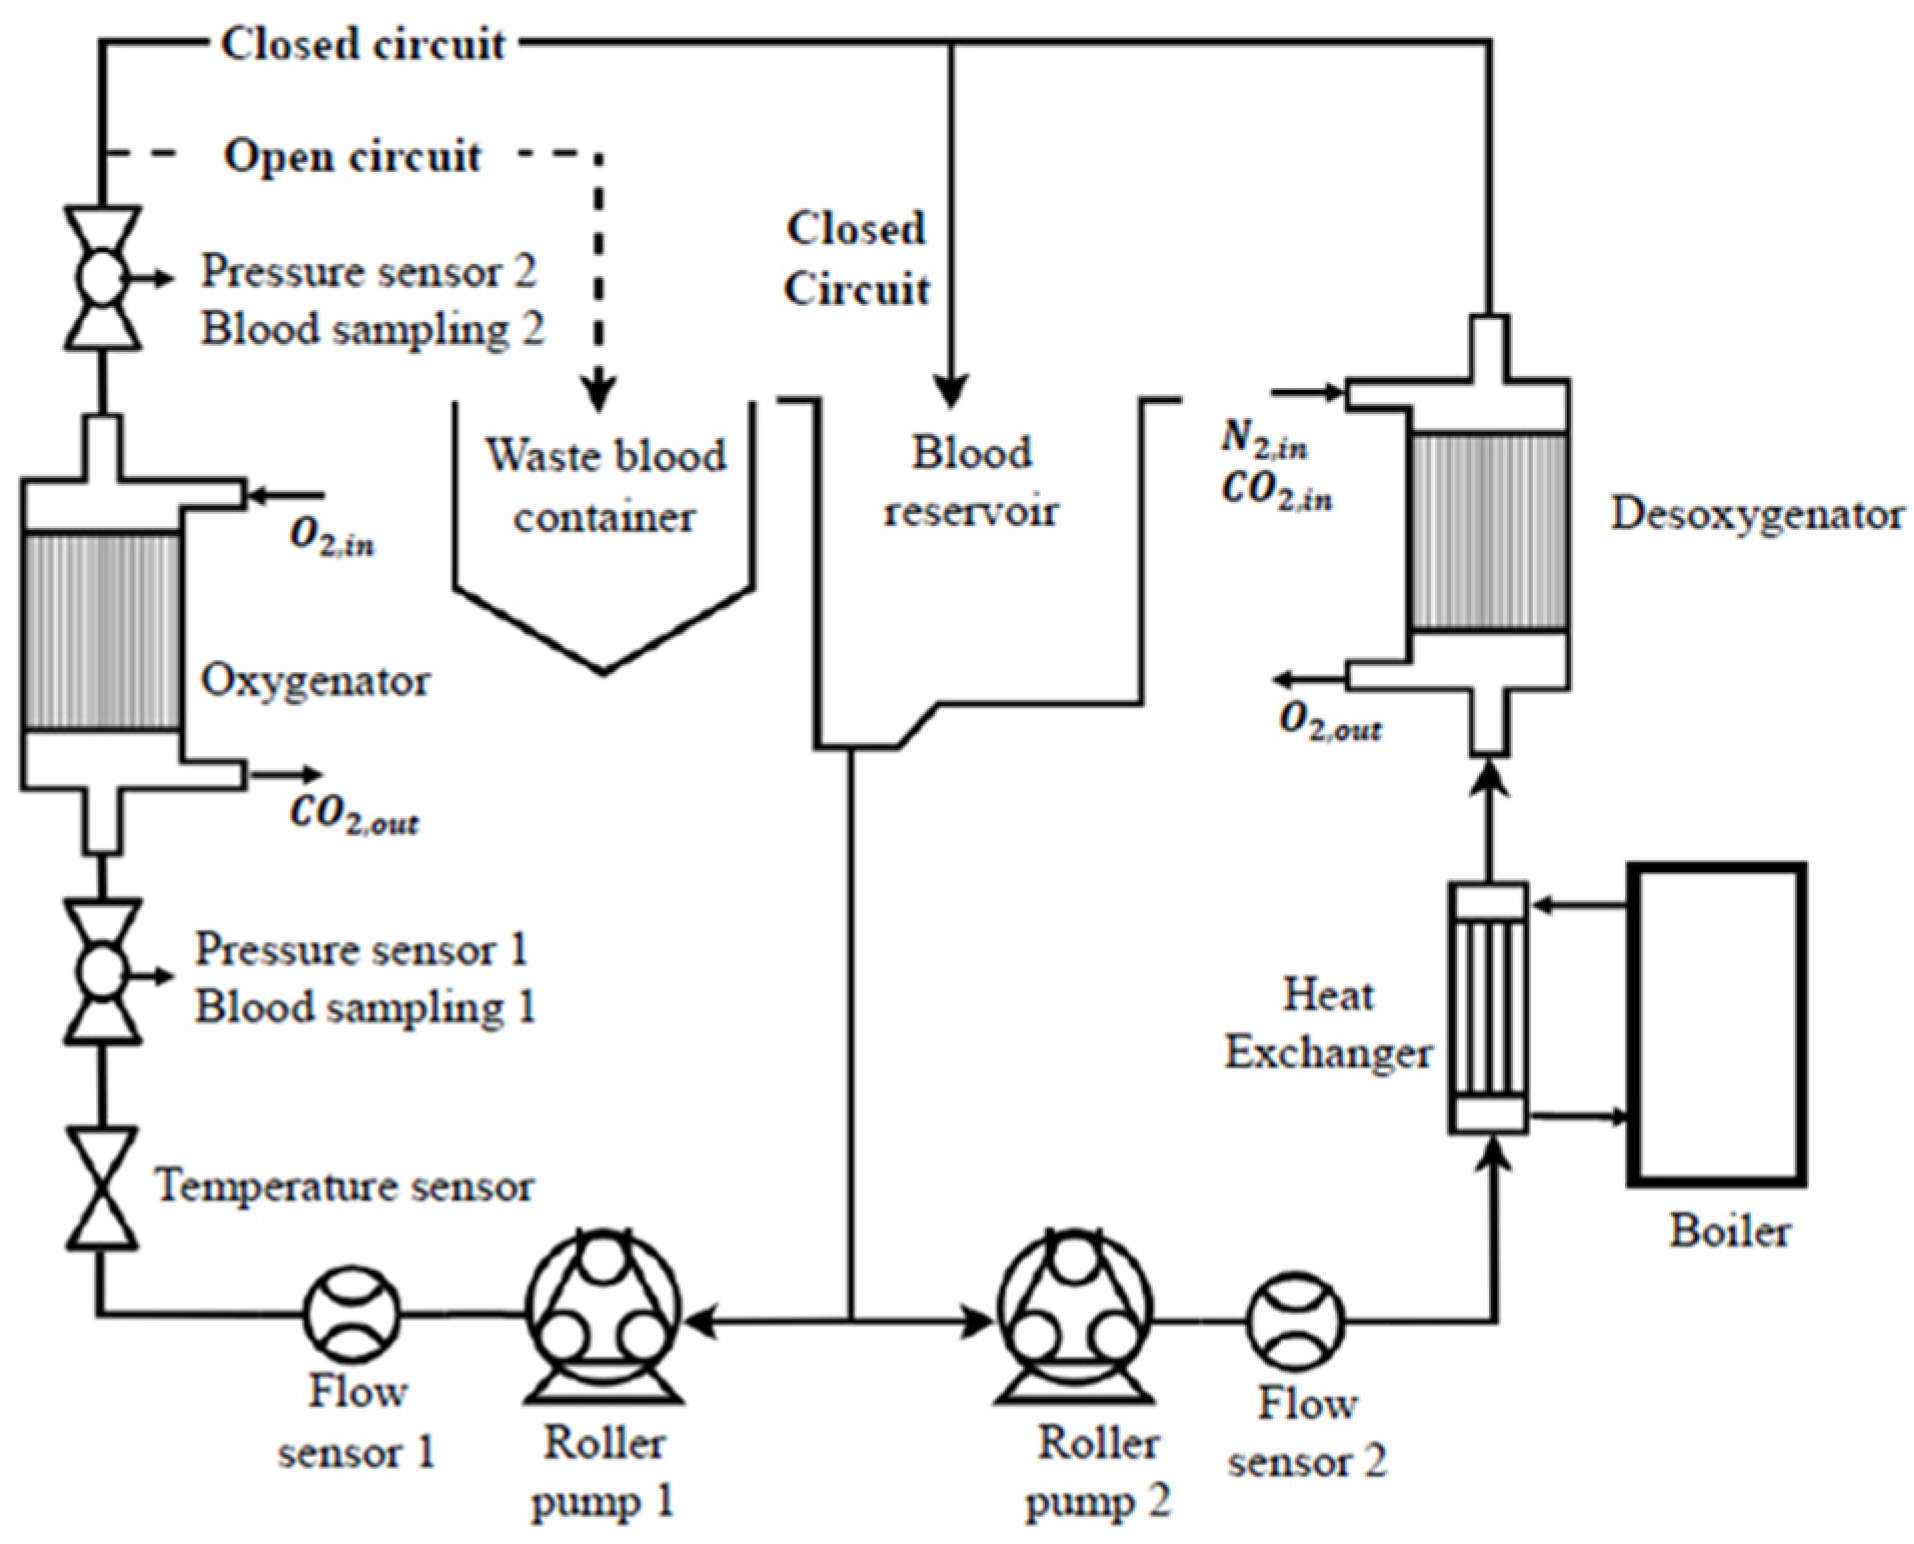
2.3. Experimental Circuit
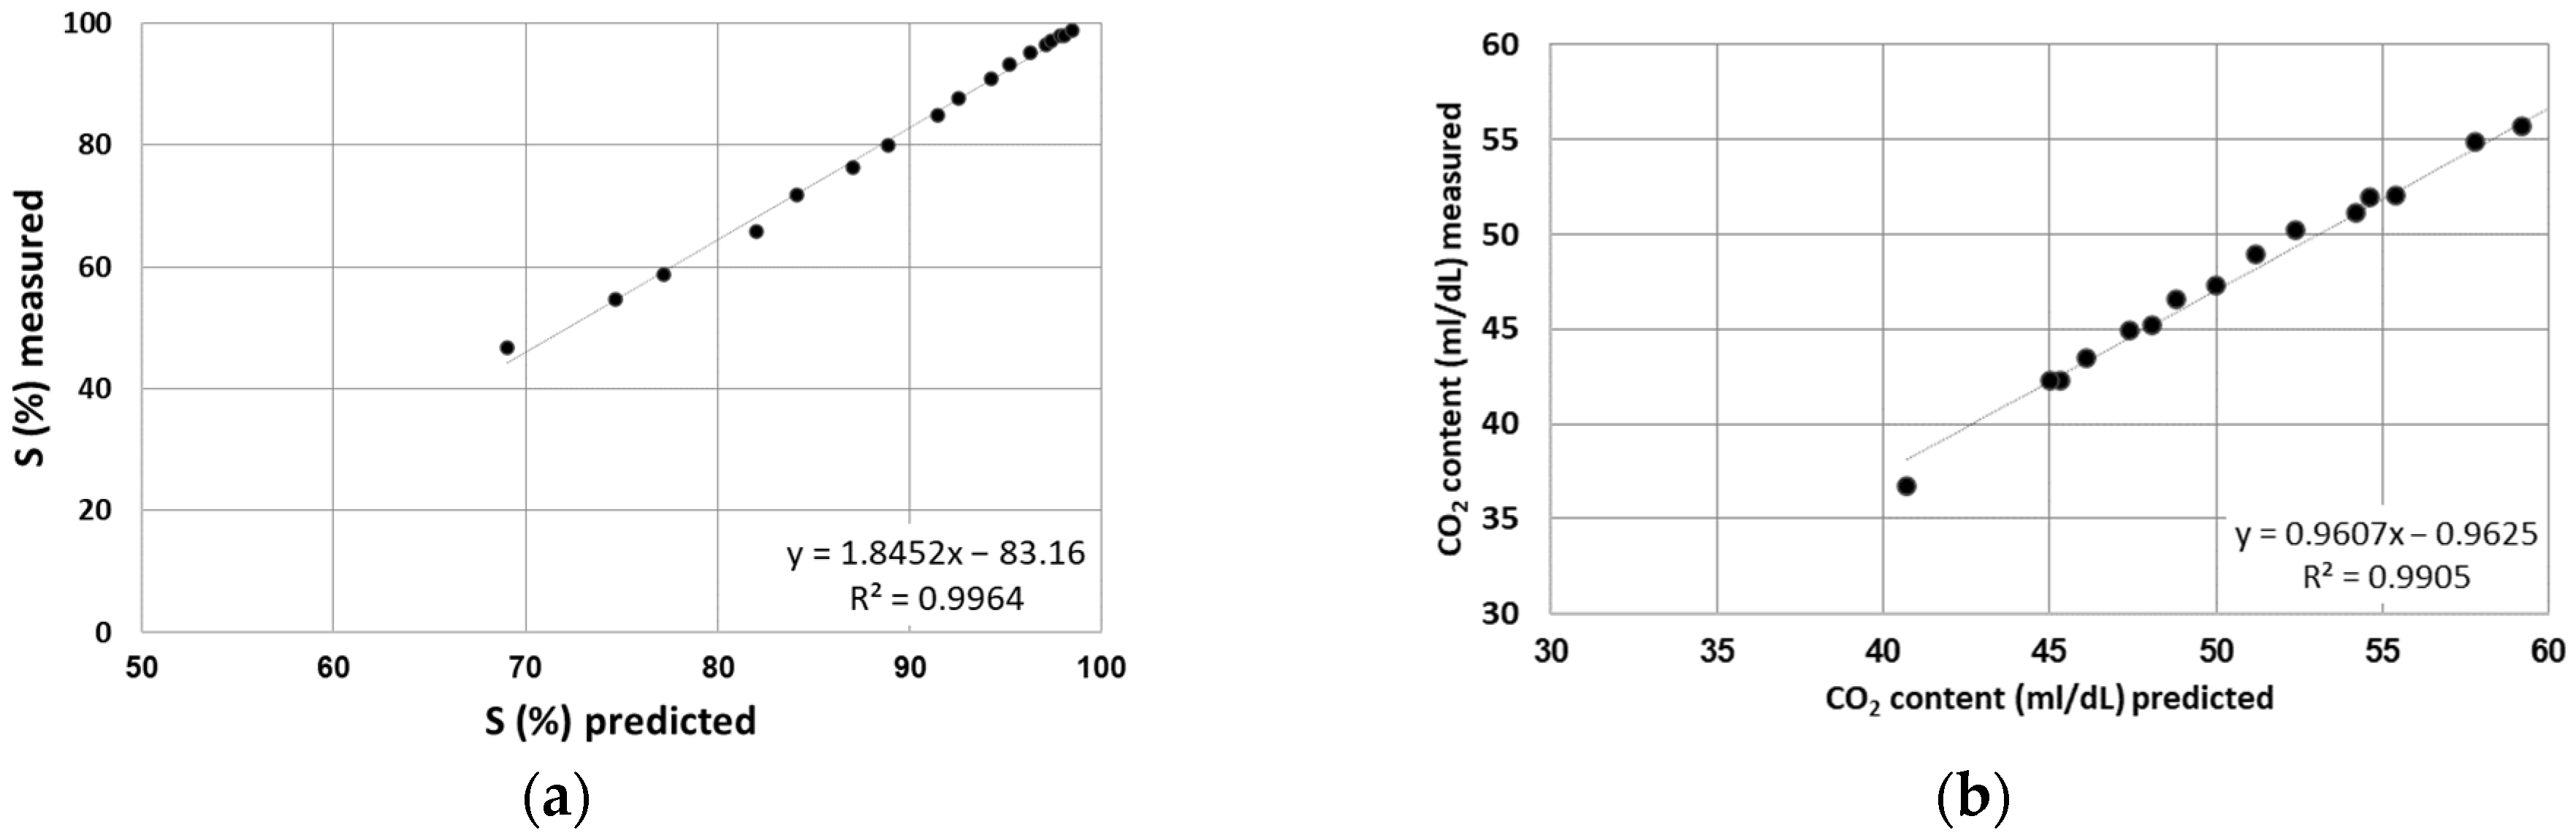
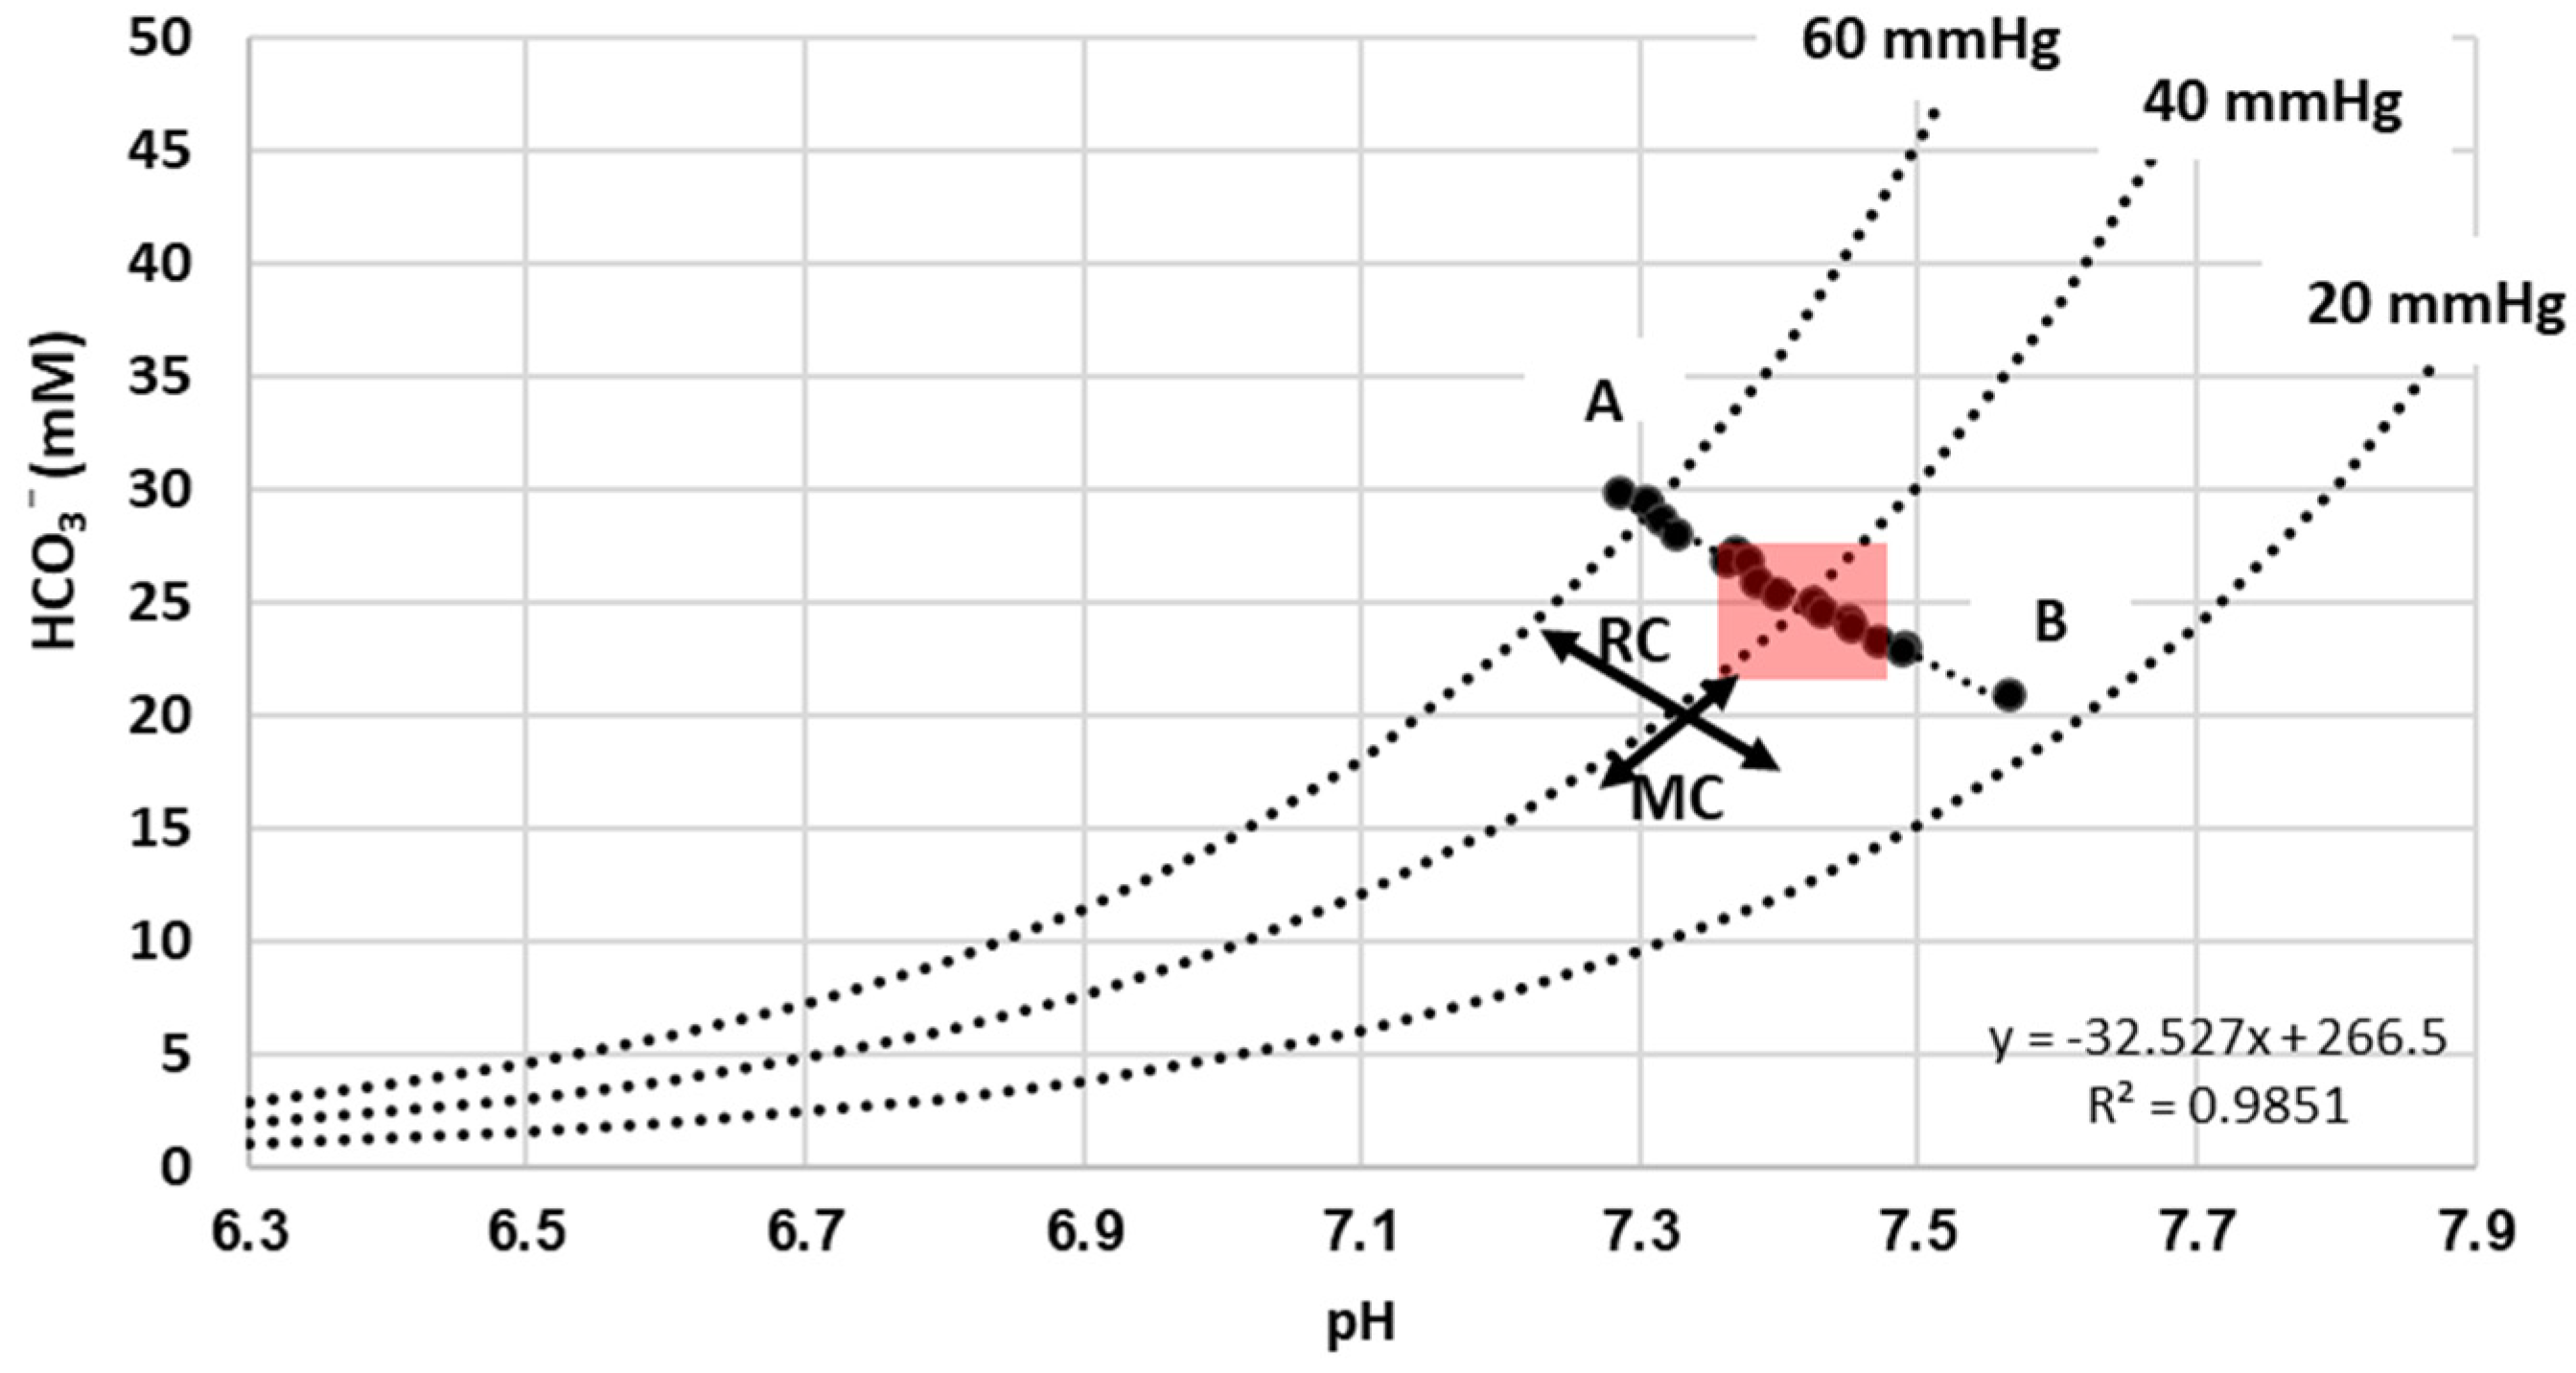
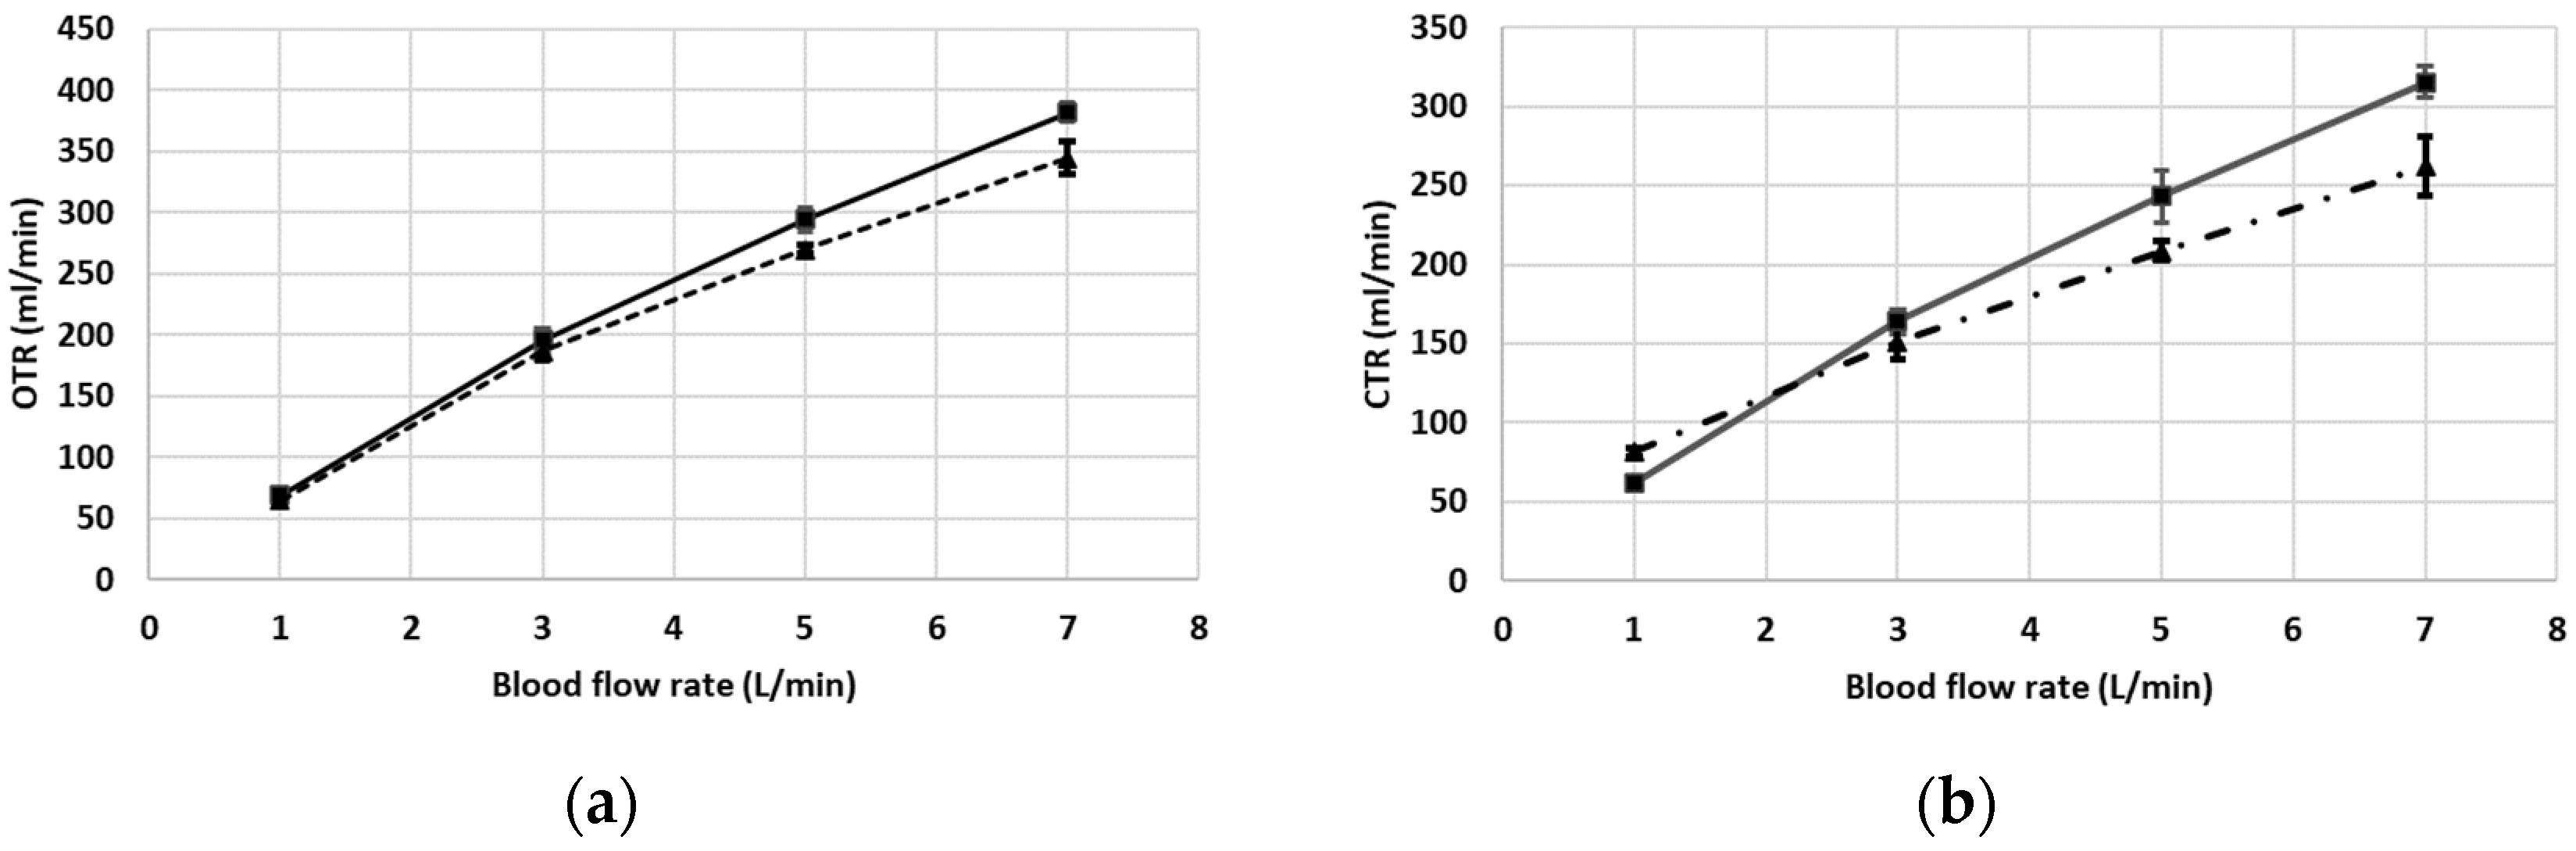
An in vitro experimental circuit (Figure 1) was assembled to evaluate the gas transfer performance of a hollow fiber oxygenator and to determine the influence of carbon dioxide removal on the overall acid–base balance, using two roller pumps (Stockert S3), a blood reservoir, adequate length of tubing, and two commercial oxygenators (one in the role of deoxygenator).
For the performance evaluation, the experiment was conducted in accordance with the established international standard for cardiovascular implants and artificial organ–blood–gas exchangers (ISO 7199:2016). A closed-loop in vitro circulation, with both oxygenator and deoxygenator being simultaneously perfused, is used until p O 2 , oxygen saturation , p C O 2 and p H in the reservoir reach values of 40 ± 5 mmHg, 65 ± 5%, 45 ± 5 mmHg and 7.35   ±   0.5 , respectively. Afterwards, the circuit is opened, and blood flow rates of 1 ,   3   ,   5 and 7   L / min are implemented through the oxygenator. Blood samples are taken from sampling ports located at the oxygenator’s inlet–outlet ports and analyzed using a blood gas analyzer (Radiometer ABL 800 FLEX) to measure the blood gas parameters of venous and arterial blood. Finally, the experimental data are compared with the predicted values to assess the accuracy and reproducibility of the empirical equations in calculating OTR and CTR.
O T R = 10 × Q ˙ B ( c O 2 , B o u t c O 2 , B i n )
C T R = 10 × Q ˙ B ( c C O 2 , B i n c C O 2 , B o u t )
where Q ˙ B ( L / min ) is the blood flow rate through the oxygenator, and c O 2 and c C O 2 are the concentrations of oxygen and carbon dioxide in mL / dL .   B i n and B o u t indices are for blood inlet and outlet of the oxygenator.
During the ECCO2R experiment, the initial condition was set to a p C O 2 of around 70   mmHg , in order to mimic a clinical situation where, for instance, the patient is suffering from severe acidosis; C O 2 was removed at constant gas and blood flow rate of 1   L / min , each. Blood samples were taken from the sampling port and analyzed in the commercial blood gas analyzer (Radiometer ABL 800 FLEX).

3. Results

Description of Results

For oxygen saturation and carbon dioxide content, the correlation coefficients are R 2 = 0.9964 and R 2 = 0.9905 , respectively, as shown in Figure 2a,b. However, in the case of the oxygen dissociation curve, the estimated result is consistently higher than the measured value; the average bias is 15.5% for saturations between 70% and 90%, but the bias decreases afterwards. The bias suggests a shift in the oxygen dissociation curve.
The respiratory compensation for p H balance during extracorporeal C O 2 removal is shown in Figure 3. In this experiment ,     p C O 2 decreases from an initial 64.9   mmHg to an eventual 23   mmHg . And, during the course of C O 2 removal, p H decreases monotonically from an initial acidosis ( p H   7.285 ) to a final alkalosis ( p H   7.566 ) state along the buffer line AB (the direction of change is indicated by the arrow). The slope of the buffer line depends primarily on the concentration of hemoglobin. The slope is 32.527 for the hemoglobin concentration of 12.9   g / dL in the experiment. The red region shown in Figure 3 is the normal physiological acid–base region ( p H around 7.4 and H C O 3 around 24 mM) [7].
In the performance evaluation of the oxygenator, p O 2 and p C O 2 at the blood inlet and outlet at different blood flow rates are provided in Table 1. The measured O T R and C T R means (sd) for the oxygenator at 1   ,   3   ,   5 ,   and   7   L min blood flow rate are 68.69   ( 2.68 ) and 61.67 (2.87), 195.22 (9.54) and 164 (7.48) , 294.1 (9.9) and 243.33 (16.50) , and 381.54 (7.95) and 315 (9.89)   mL / min , respectively. Similarly, the predicted O T R and C T R means (sd) based on the aforementioned equations are at 1   ,   3   ,   5 ,   and   7   L min blood flow rate are 64.58 (1.53) and 81.41(2.33), 186.46 (7.39) and 151   ( 10.39 ) , 269.58 (3.14) , and 208.62 (6.11), and 344.4   ( 13.42 ) and 262.5   ( 18.53 )   mL / min , respectively. The Pearson correlation coefficients between experimental and predicted values are R 2 > 0.99 for both O T R and C T R . The relationship between O T R and C T R with the blood flow rate is shown in Figure 4.

4. Discussion

Kelman and Douglas equations for the calculation of the course of oxygen and carbon dioxide curves were evaluated using fresh porcine blood in an in vitro experimental study. For Kelman, R 2 = 0.9964 , and for Douglas, R 2 = 0.9905 , suggest that the significant portion of variance in the measured values is explained by the predicted values. However, the predicted value for oxygen saturation is consistently higher than the experimental results, as seen from the regression graph, which diminishes when the curve reaches near its 100% saturation. The bias in the calculation of oxygen saturation or carbon dioxide content is due to the shift in the oxygen and carbon dioxide dissociation in accordance with Bohr and Haldane effects [12], physiological difference between oxygen and carbon dioxide dissociation curve between human and porcine blood, and blood trauma during in vitro investigations.
A non-linear relationship between p H ,   p C O 2 , and H C O 3 was developed from the Hendersen–Hasselbalch equation and the non-bicarbonate buffer. Furthermore, the in vitro investigations demonstrate the linear relationship between p H and H C O 3 , as represented by a buffer line, during extracorporeal carbon dioxide removal. From the Hendersen–Hasselbalch equation and the non-bicarbonate buffer, a non-linear relationship between p H , p C O 2 , and H C O 3 was developed that can be used to estimate p H from p C O 2 , given the initial conditions for respiratory compensation via ECMO. However, due to metabolic compensation, such as adjustment of H C O 3 in the renal system, this buffer line may shift; the slope of the buffer line remains the same. The extent of the influence of such metabolic compensation must be determined, along with the calculation of base excess, to develop a comprehensive model of acid–base balance.
Finally, the data from the oxygen and carbon dioxide dissociation curves were used to calculate the oxygen and carbon dioxide transfer rates of an oxygenator. Both O T R and CTR showed a linear relationship with the blood flow rate in both the experimental and predicted results. The predicted values were then compared with experimental data for blood flow rates of 1 ,   3 ,   5 , and 7   L min . Maximum errors were observed at 7 and 1   L min for average O T R and C T R , 10 % and 32 % , respectively. The high error in C T R calculation compared to O T R is due to the higher sensitivity of carbon dioxide concentration to blood pH and bicarbonate concentration. However, for both O T R and C T R , R 2 > 0.99 again suggests that a significant portion of variance in the measured values is explained by the predicted values.

5. Conclusions

The above results suggest that the presented empirical equations can be used in simulating cardiopulmonary systems with oxygenators as well as for extracorporeal lung support (ECLS) methods, e.g., ECMO, ECCO2R, or others, for the desired operating condition by manipulating variables, such as the gas and blood flow rate values, including inlet venous blood gas data. In the future, this model will be developed for different configurations of the extracorporeal lung support systems, such as veno-venous or veno-arterial, to predict oxygen and carbon dioxide transfer and acid–base status during such therapies. Furthermore, if needed, parameter optimization of the aforementioned equations for porcine blood can be conducted, in a large dataset with diverse inlet conditions, to minimize error in the overall prediction.

Author Contributions

L.B.K. (writing—original draft preparation, formal analysis), F.L.M. (writing—review and editing, data curation, methodology), A.K. (methodology, visualization), J.W.S. (conceptualization, supervision), F.H. (methodology, data curation) and K.M. (conceptualization, writing-review and editing, supervision). All authors have read and agreed to the published version of the manuscript.

Funding

This study has been partially supported by European Regional Development Funds (NRW EFRE).

Data Availability Statement

The data presented in this study are available on request from the corresponding author.

Conflicts of Interest

The authors declare no conflict of interest.

References

  1. Nosé, Y. Manual on Artificial Organs; The oxygenator; Mosby: St. Louis, MO, USA, 1973; Volume II. [Google Scholar]
  2. Iwahashi, H.; Yuri, K.; Nosé, Y. Development of the oxygenator: Past, present, and future. J. Artif. Organs 2004, 7, 111–120. [Google Scholar] [CrossRef] [PubMed]
  3. Mottaghy, K.; Bey, R.; Oedekoven, B.; Schaich-Lester, D.; Schmid-Schonbein, H. Extracorporeal CO2-removal: Pulmonary and extracorporeal equilibria in dogs and sheep. Eur. J. Appl. Physiol. Occup. Physiol. 1985, 54, 546–553. [Google Scholar] [CrossRef] [PubMed]
  4. Mottaghy, K.; Steyrer, K.; Freund, E.; Dringenberg, I. Eine standardisierte Methode zur Bestimmung der Gasaustauschkapazität der Oxygenatoren am Beispiel eines Bubble -und Liquid- Oxygenators. Biomed. Tech. 1978, 23, 126. [Google Scholar] [CrossRef]
  5. ISO 7199:2016; Cardiovascular Implants, and Artificial Organs—Blood-Gas Exchangers (Oxygenators). ISO: Geneva, Switzerland, 2016.
  6. Sander, R. Compilation of Henry’s law constants (version 4.0) for water as solvent. Atmos. Chem. Phys. 2015, 15, 4399–4981. [Google Scholar] [CrossRef]
  7. Fehler, J. Acid base physiology I: The bicarbonate buffer system and respiratory compensation. In Quantitative Human Physiology an Introduction, 2nd ed.; Elsevier Inc.: Amsterdam, The Netherlands, 2016. [Google Scholar]
  8. Kelman, G.R. Digital computer subroutine for the conversion of oxygen tension into saturation. J. Appl. Physiol. 1966, 21, 1375–1376. [Google Scholar] [CrossRef] [PubMed]
  9. Bain, B.J.; Lewis, M.; Bates, I. Basic haematological techniques. In Dacie and Lewis Practical Haematology, 10th ed.; Churchill Livingstone: London, UK, 2006; pp. 25–57. [Google Scholar]
  10. Douglas, A.R.; Jones, N.L.; Reed, J.W. Calculation of whole blood CO2 content. J. Appl. Physiol. 1988, 65, 473–477. [Google Scholar] [CrossRef] [PubMed]
  11. Austin, W.H.; Lacombe, E.; Rand, P.W.; Chatterjee, M. Solubility of carbon dioxide in serum from 15 to 38 C. J. Appl. Physiol. 1963, 18, 301–304. [Google Scholar] [CrossRef] [PubMed]
  12. Siggaard-Andersen, O.; Garby, L. The Bohr Effect and the Haldane Effect. Scand. J. Clin. Lab. Investig. 1973, 31, 1–8. [Google Scholar] [CrossRef] [PubMed]
Figure 1. Schematic representation of an in vitro experimental circuit for the evaluation of an oxygenator. Two flow sensors constantly monitor the blood flow rate through the oxygenator and deoxygenator. The heat exchanger regulates the temperature of blood within the physiological range of 37 ± 1 °C. Blood samples are drawn from the equivalent ports in regular intervals to measure the blood gas parameters.
Mathematics 11 04088 g001
Figure 2. (a) Comparison between predicted and experimental oxygen saturation. pH, pCO2, and temperature in the equations were set as 7.4 ,   40   mmHg and 37 °C. (b) Comparison between the predicted and measured carbon dioxide concentration. Hemoglobin concentration of 12.9 g / dL and S(%) 60%, and pH is calculated through the non-linear system of equations (Equations (7) and (8)) using fsolve function in SciPy (version 1.10.0) package of Python (version 3.10.9).
Mathematics 11 04088 g002
Figure 3. Change in pH during extracorporeal carbon dioxide removal provided in the Davenport diagram [7]. The red region represents the normal physiological pH and bicarbonate range. The arrow indicates the direction of change during carbon dioxide removal. The isobar 20 mmHg, 40 mmHg, and 60 mmHg depict the region of constant partial pressure of carbon dioxide. RC direction of respiratory compensation as provided by the buffer line, MC direction of metabolic compensation. A is the beginning of the experiment and B is the end of the experiment.
Mathematics 11 04088 g003
Figure 4. (a) Oxygen and (b) carbon dioxide transfer rates as a function of blood flow rate mean (sd) (n = 3).
Mathematics 11 04088 g004
Table 1. Inlet and outlet conditions for the oxygenator’s performance evaluation. Gas flow rate through the oxygenator is same as the blood flow rate. Average hemoglobin concentration is 12.9 g/dL.
Blood Flow
Rate (L/min)
InletOutlet
pO2 (mmHg)pCO2 (mmHg)pO2 (mmHg)pCO2 (mmHg)
136.05 (0.51)43.8 (0.67)518 (4.89)29.53 (0.17)
335.83 (0.7)43.63 (0.83)367.73 (18.05)34.27 (0.09)
537.7 (0.16)46.97 (0.42)210.33 (8.65)38.53 (0.33)
737.81 (0.83)45.97 (0.33)122.04 (5.83)38.47 (0.24)
Disclaimer/Publisher’s Note: The statements, opinions and data contained in all publications are solely those of the individual author(s) and contributor(s) and not of MDPI and/or the editor(s). MDPI and/or the editor(s) disclaim responsibility for any injury to people or property resulting from any ideas, methods, instructions or products referred to in the content.

