1. Introduction
Enterprises are an essential part of the economic system. Firms use different kinds of factors, such as labor, physical capital, and technology, to produce goods and services; at the same time, they pay wages and interest and earn profit, which are the main sources of consumption and investment. To improve resource allocation efficiency and government management, research on firm values is necessary. In the new era, knowledge capital and other kinds of intangible capital play more and more important roles. Investigating the impact of different kinds of investments, especially investments in knowledge capital, on firm value has not only academic value but also practical value. On the one hand, the study of enterprise market value can provide appropriate guidance for real-world investment decisions, and on the other hand, analyzing the influencing factors of enterprise market value with different methods can help us compare the applicability of different theoretical models.
There has been extensive research on firm value and optimal investment decisions, both from theoretical and empirical perspectives. Several theories, for example, Tobin Q, the multi-capital Q model, the capital asset pricing model (CAPM), investment-CAPM, and intellectual capital theory, were used to analyze the factors influencing firm value and investment decisions [
1,
2,
3,
4,
5]. Firms in the US, Japan, India, and other regions were chosen to analyze the factors affecting firm value [
4,
5,
6,
7,
8]. The firm values of Chinese-listed companies have also been analyzed in recent years [
9,
10,
11,
12,
13]. There are still some research gaps to be filled, as follows: (1) Most of the empirical research lacks an organic combination of theoretical model analysis, especially those for Chinese firms; (2) Different industries have different characteristics, so even the same kind of capital may have different impacts in different industries, and the existing literature has seldom investigated these differences; (3) The characteristics and impact mechanisms of optimal investment decisions have not been sufficiently studied.
To fill these research gaps, in this paper, we first build a generalized neoclassical investment model that contains three different kinds of capital: physical capital, labor, and knowledge capital, and incorporates quasi-fixed adjustment costs. Using Chinese firm data from 2009 to 2018, we analyze the dynamics of the proportions of these three kinds of capital in firm value decomposition for different kinds of industries. Furthermore, the characteristics and mechanisms of optimal investment decisions are investigated using simulation.
The analysis not only provides direct evidence of the importance of labor and knowledge capital in understanding Chinese firm market values but also illustrates the dynamics of their contributions to firm value. The neoclassical investment model provides a theoretical basis for firm value decomposition, and the optimal investment policies can provide guidance for managers. The empirical results show that for Chinese firms in the past decades, knowledge capital’s proportion to firm value has increased and labor’s proportion has decreased, while physical capital’s proportion has remained relatively stable. However, it is worth noting that Belo et al. [
7] found that for US companies, knowledge capital’s proportion to firm value was increasing, and physical capital’s proportion was decreasing, while labor’s proportion was relatively stable. This difference shows the different development stages and endowments of Chinese and US economies and the necessity of empirical tests for different countries to validate the applicability of the theoretical models.
2. Literature Review
Enterprise value is an important characterization of the state of a company, which is closely related to its investment decisions and also affects the performance of the stock market, and it thus receives a great deal of attention. In 1983, Abel built a model to investigate the effect of output price uncertainty on optimal investment decisions that maximized firm values [
14]. Then, in 1985, he further examined the relationships among the market value of the firm, marginal Q, and optimal investment rate theoretically [
1]. In 1993, Chirinko used a multiple capital Q model to investigate the effect of investment spending and Q. In his model, the three inputs added to the model were inventory, research and development, and labor, which were treated as quasi-fixed factors [
3]. Empirically, Hayashi and Inoue used a panel of Japanese listed firms to investigate the relationship between investment and Q [
4]. Belo et al. designed a new supply approach for valuation and used the Q theory of investment to pin down the cross-sectional asset prices [
15]. By introducing learning, Andrei et al. both theoretically and empirically proved that the investment-Q relation works better for research-intensive industries [
16]. In addition, Gonçalves et al. showed that models based on investments in physical capital and working capital can capture the variation in average returns across a large number of portfolios simultaneously [
2]. This study also demonstrated that the aggregation of physical capital and working capital in the Investment Capital Asset Pricing Model (ICAPM) helped to explain the variation in average returns across portfolios.
In the modern economy, intangible capital has become more and more important, and research has incorporated intangible capital to explain firm value. A growing body of literature suggests that intangible capital is progressively becoming more important for firms. Hall asserted that unmeasurable intangible capital was an important part of the modern economy [
17]; McGrattan and Prescott showed the importance of accounting for intangible assets in the valuation of stock market value [
18]. Carrado et al. investigated the importance of considering intangible capital in analyzing economic growth and suggested that intangible capital had made a significant contribution to labor productivity and, thus, economic growth [
19]. Li and Liu emphasized the importance of intangible capital for measuring firm values and found that incorporating adjustment costs and investment-specific technological change improved the model performance [
20]. Carrado and Hulten discussed the scope, characteristics, and measurement of intangible capital and showed the trend in intangible investment in the US economy [
21]. Hansen et al. used securities market data to measure intangible capital and illustrated the importance of intangible capital when measuring firm value [
22]. Falato et al. ascertained that the rise of intangible capital made US corporations hold more cash and less debt [
23]. Peters and Taylor investigated the intangible capital and investment-Q relationship and found that Tobin’s Q can explain both physical and intangible investment [
24].
Several kinds of capital were selected to represent intangible capital, for example, organization capital, customer capital, and brand capital. Eisfeldt and Papanikolaou posited that the intangible capital was embodied in the firm’s key employees’ organizational capital and found that firms with higher organizational capital would be riskier and have higher average returns [
25]. Lev and Radhakrishnan viewed organization capital as the major factor in production and often brought firms abnormal returns, thereby incentivizing firm growth, underlining that it was a persistent creator of value and growth for firms. They showed that organizational capital contributed significantly to the explanation of firm value [
26]. Gourio and Rudanko examined the impact of customer capital on firm value and investment dynamics, emphasizing the importance of adjustment costs in creating customer capital [
27]. Belo et al. studied brand capital, the primary form of intangible capital, and proved that more brand capital-intensive firms had higher stock returns, showing the importance of intangible assets on firm value [
28].
Intellectual capital is a kind of intangible capital that refers to collective knowledge and resources and can be categorized as human capital, relational capital, and structural capital. Researchers investigated intellectual capital from different perspectives and viewed it as a source of firm competitive advantage [
29,
30]. Ni et al. found evidence that for Taiwanese companies, intellectual capital positively affected firm values and suggested firms make efforts to develop intellectual capital [
5]. Smriti and Das used the value-added intellectual coefficient model to measure intellectual capital and its components. They found that Indian-listed companies performed better when enhancing intellectual capital [
6]. Lin et al. decomposed the firm’s unexpected stock returns into intellectual capital news and expected return news and found that intellectual capital news was the main driver of stock returns and excess stock returns, implying that intellectual capital played an important role in firm stock values [
31]. Shafiee used a structural equation model to investigate the impact of intellectual capital on a firm’s competitive advantage and found that intellectual capital increased the competitive advantage by improving business intelligence and brand image [
32].
Labor is an important input for production and growth, and the decisions of labor affect firm value. In 1986, Shapiro included labor adjustment costs in his analysis and found that the presence of labor adjustment costs played a key role in matching investment and dynamic employment [
33]. However, in 2004, Hall showed that the introduction of excessive adjustment costs in the model setup was ineffective [
34]. By analyzing the annual industry data for the US, Hall found that adjustment costs generate relatively small rental costs. This should not be an important factor in explaining the shift in the market capitalization of firms. Merz and Yashiv introduced the frictions of the labor market and treated labor as a quasi-fixed factor that affected firm value. The optimal hiring and investing determined the firm profit and, consequently, the firm market value [
35]. Belo et al. studied the impact of labor market frictions on asset prices and found that, due to the adjustment cost, a 10% increase in a firm’s hiring rate would cause a 1.5% decrease in its risk premium [
36]. Barkai used data on labor compensation in the US economy to track labor productivity and showed that after 1980, increases in labor productivity were accompanied by equally sized increases in labor compensation. The decline in the labor share was caused by sustained productivity growth and stagnant pay [
37].
Recently, some researchers studied the factors influencing Chinese firm values. Li found that the development of the digital economy enhanced firm value [
9]. Based on a text analysis method, Huang et al. empirically proved that the digital transformation increased Chinese listed firms’ value by increasing their innovation ability, factor allocation efficiency, and risk management [
10]. Xu et al. found that increasing information density brought higher firm value, and social trust positively moderated the relationship [
11]. Chen et al. investigated the capital–labor elasticity of substitution, biased technological progress, and factor-relative income shares of Chinese industrial firms and proved that changes in factor-relative prices affected their income shares. The results proved that changes in factor-relative prices affected factor-relative income shares mainly through direct ways and, to a lesser extent, through indirect ways [
12]. Yan and Kong studied the effect of managerial competence on the enhancement of enterprise value and proved that a free and equal, neutral competitive environment and the enhancement of managerial competence were important means to increase enterprise value [
13].
Studies have been conducted to analyze enterprise value both theoretically and empirically, and some valuable conclusions have been drawn. In terms of models, the portrayal of corporate behavior has become more and more detailed, the classification of capital has become more and more rational, and the importance of intangible capital has been recognized. In terms of empirical research, more and more samples have been used for the analysis of enterprise value and the testing of theories. On the basis of these studies, this paper will theoretically derive the decomposition of enterprise value by constructing a generalized neoclassical investment model, analyze the contribution of various types of capital to enterprise value by using the data of Chinese-listed companies, and portray the characteristics and mechanisms of the optimal investment behavior of enterprises. This contributes to the existing literature not only by providing a specific theoretical model for China—the largest developing country—but also by providing detailed descriptions of the evolution of proportions of different determinants of Chinese listed companies’ market values. The portrayal of optimal investment characteristics has practical guidance for managers and can help them make better investment decisions.
5. Results and Discussion
5.1. Enterprise Value Analysis
After the classification of companies and the collection and calculation of sample data, we minimized the distance between the actual price-to-book ratio and the model-implied price-to-book ratio by minimizing the distance between them, i.e., we used the Ordinary Least Squares (OLS) regression method to identify the optimal combination of parameters.
Regression analyses of the CSI 800 firm data give us the distribution of firm values across all industries and subtypes of industries. For the results obtained from the whole sample, the proportion of physical capital inputs to the market value of firms has increased from 22.0% to 25.7% over the 10-year period, the proportion of labor inputs to the market value of firms has decreased from 56.5% to 36.4%, and the proportion of knowledge capital inputs to the market value of firms has increased from 21.5% to 37.9%. Belo et al. [
7] found that, for US companies, knowledge capital contributed more and more and physical capital’s contribution was decreasing while labor’s contribution stayed stable from 1975 to 2016. It can be seen that the trend in knowledge capital is the same for Chinese companies and US companies, which shows that knowledge is more and more important in the modern economy. The different trends in physical capital and labor’s contribution can be ascribed to the different development stages and labor endowments. China is still at a low development level and has large amounts of low-cost labor. Thus, labor contributes the most to firm value, and with the development of the economy, physical capital accumulates and its contribution increases (
Figure 2).
This change in proportions in value decomposition is consistent with the facts. It also validates the realistic evolution of the economic transformation process that we often refer to, i.e., the gradual transformation from low-end labor-intensive industries to innovative technology-based industries. This means that, from the perspective of enterprise value, if a company’s managers want to increase the value of the company’s stock, they need to keep investing in research and development to become an innovation leader in their industry segment. From a workforce perspective, as companies create value by shifting from tedious labor-intensive work to innovation-based work, employers’ needs are also transforming from general labor to innovative talent needs. Therefore, in order to avoid being eliminated from the market, the workforce needs to upgrade their skills to be able to provide higher value-added labor outcomes.
At the meso-level, as mentioned earlier, this paper divides the CITIC level 1 industries into four broad categories: capital-intensive, labor-intensive, technology-intensive, and other industries. For different types of firms, the relative importance of physical, labor, and knowledge capital inputs to the firm’s market value varies. As shown in
Figure 3,
Figure 4 and
Figure 5, the results of the study show the following:
First, for capital-intensive industries, the proportion of physical capital input in the enterprise value increased from 28.8% in 2009 to 40.1% in 2018, while the proportion of labor input in the enterprise market value decreased from 53.7% in 2009 to 33.6% in 2018. The proportion of knowledge capital input in the enterprise market value increased from 17.5% in 2009 to 26.3% in 2018.
Second, for labor-intensive industries, the proportion of physical capital input in the enterprise market value remained at about 28.5%, and the proportion of labor input in the enterprise market value dropped from 44.8% in 2009 to 31.7% in 2018. The proportion of knowledge capital input in the enterprise market value increased from 26.5% in 2009 to 39.9% in 2018.
Third, for technology-intensive industries, the proportion of physical capital input in the enterprise market value decreased from 13.6% in 2009 to 12.3% in 2018, and the proportion of labor input in the enterprise market value decreased from 58.3% in 2009 to 30.0% in 2018. The proportion of knowledge capital input in the enterprise market value increased from 28.1% in 2009 to 57.7% in 2018.
Fourth, for other industries that do not have the above industry characteristics, the proportion of physical capital input in the enterprise market value increased from 21.2% in 2009 to 21.8% in 2018, while the proportion of labor input in the enterprise market value decreased from 60.3% in 2009 to 41.3% in 2018. The proportion of knowledge capital input in the enterprise market value increased from 18.5% in 2009 to 36.9% in 2018.
It is noteworthy that the results of the meso-level classifications (capital-intensive, labor-intensive, technology-intensive, and other industries) show a trend toward technological transformation. Typically, technological transformation of the economy in the popular sense implies an increase in the number of technological firms or an increasing share of the total market values of technological firms as a percentage of GDP. In recent years, the penetration of smartphones, mobile payments, 3G to 4G to 5G, and so on into daily life has been increasing, and the prices of all kinds of technology stocks in the financial markets have been rising. Intuitively, we may think that the share of technology-based companies in the overall economy is increasing. However, the data show that this increase has not been significant. The share of the total market value of technology-intensive firms has not increased dramatically and has grown at a rate not too dissimilar to the growth of the overall market. One possible explanation is that the data used in this study are the constituents of the CSI 800 Index, which does not include leading technology companies listed overseas, such as Alibaba, Tencent, and Meituan.
In addition, the share of the total market value of traditional labor-intensive companies has been declining every year over the past decade, from 19.7% in 2009 to 12.0% in 2018 (
Figure 6 and
Figure 7); in terms of the absolute volume of the total market value, labor-intensive companies still rose slightly, from CNY 5600 billion in 2009 to CNY 5800 billion in 2018, slower than the overall growth. However, we can still see that the best companies in this industry are still adding value to their businesses by increasing their R&D investment. Their R&D expenditure as a proportion of total revenue has risen every year, from 0.7% in 2009 to 2.1% in 2018 (
Figure 8).
5.2. Simulation Analysis of Enterprise Optimal Investment Behavior
Based on the above results of enterprise value decomposition, we further analyze the optimal investment behavior of the enterprise using numerical simulation. We assume that the production function of the enterprise is as follows:
For simplicity, the subscript
indicating enterprise characteristics is omitted.
is the total productivity,
is exogenous technological shock,
is physical capital,
is labor, and
is knowledge capital. The motion of total productivity and technological shock are given using the following equations:
where
is a fixed productivity level,
and
are the persistence coefficients of aggregate productivity and technological shock,
and
are the conditional volatilities, and
and
are i.i.d. standard normal shocks.
The accumulation equation of different types of capital is as follows:
where
and
are the depreciation rate of physical capital and knowledge capital, respectively,
is the employee quit rate,
and
are the annual investment in physical capital and knowledge capital, respectively, and
is the amount of newly added (or decreased) labor.
Assuming that the wage
is fixed and the change in capital and labor will generate adjustment costs, the adjustment cost of each period can be expressed as follows:
The net profit of the enterprise in each period is as follows:
Assume that the product price is unit 1, and the enterprise’s goal is to select the physical capital and knowledge capital input of each period as well as the amount of newly hired labor in order to maximize the enterprise value.
To achieve maximum value, the enterprise must choose the optimal physical capital investment, labor investment, and knowledge capital investment. Without a loss of generality, we adopt the following parameters to simulate firm behavior in different states. The selection of parameters refers to Belo et al. [
28], but necessary adjustments are made (
Table 2).
Based on the above parameters, we first write a function to calculate the value function at given investment levels, and then, with the help of the Matlab fminbnd function, we can obtain the maximum firm value and optimal capital investments for different cases. Matlab R2016a was used for the simulation.
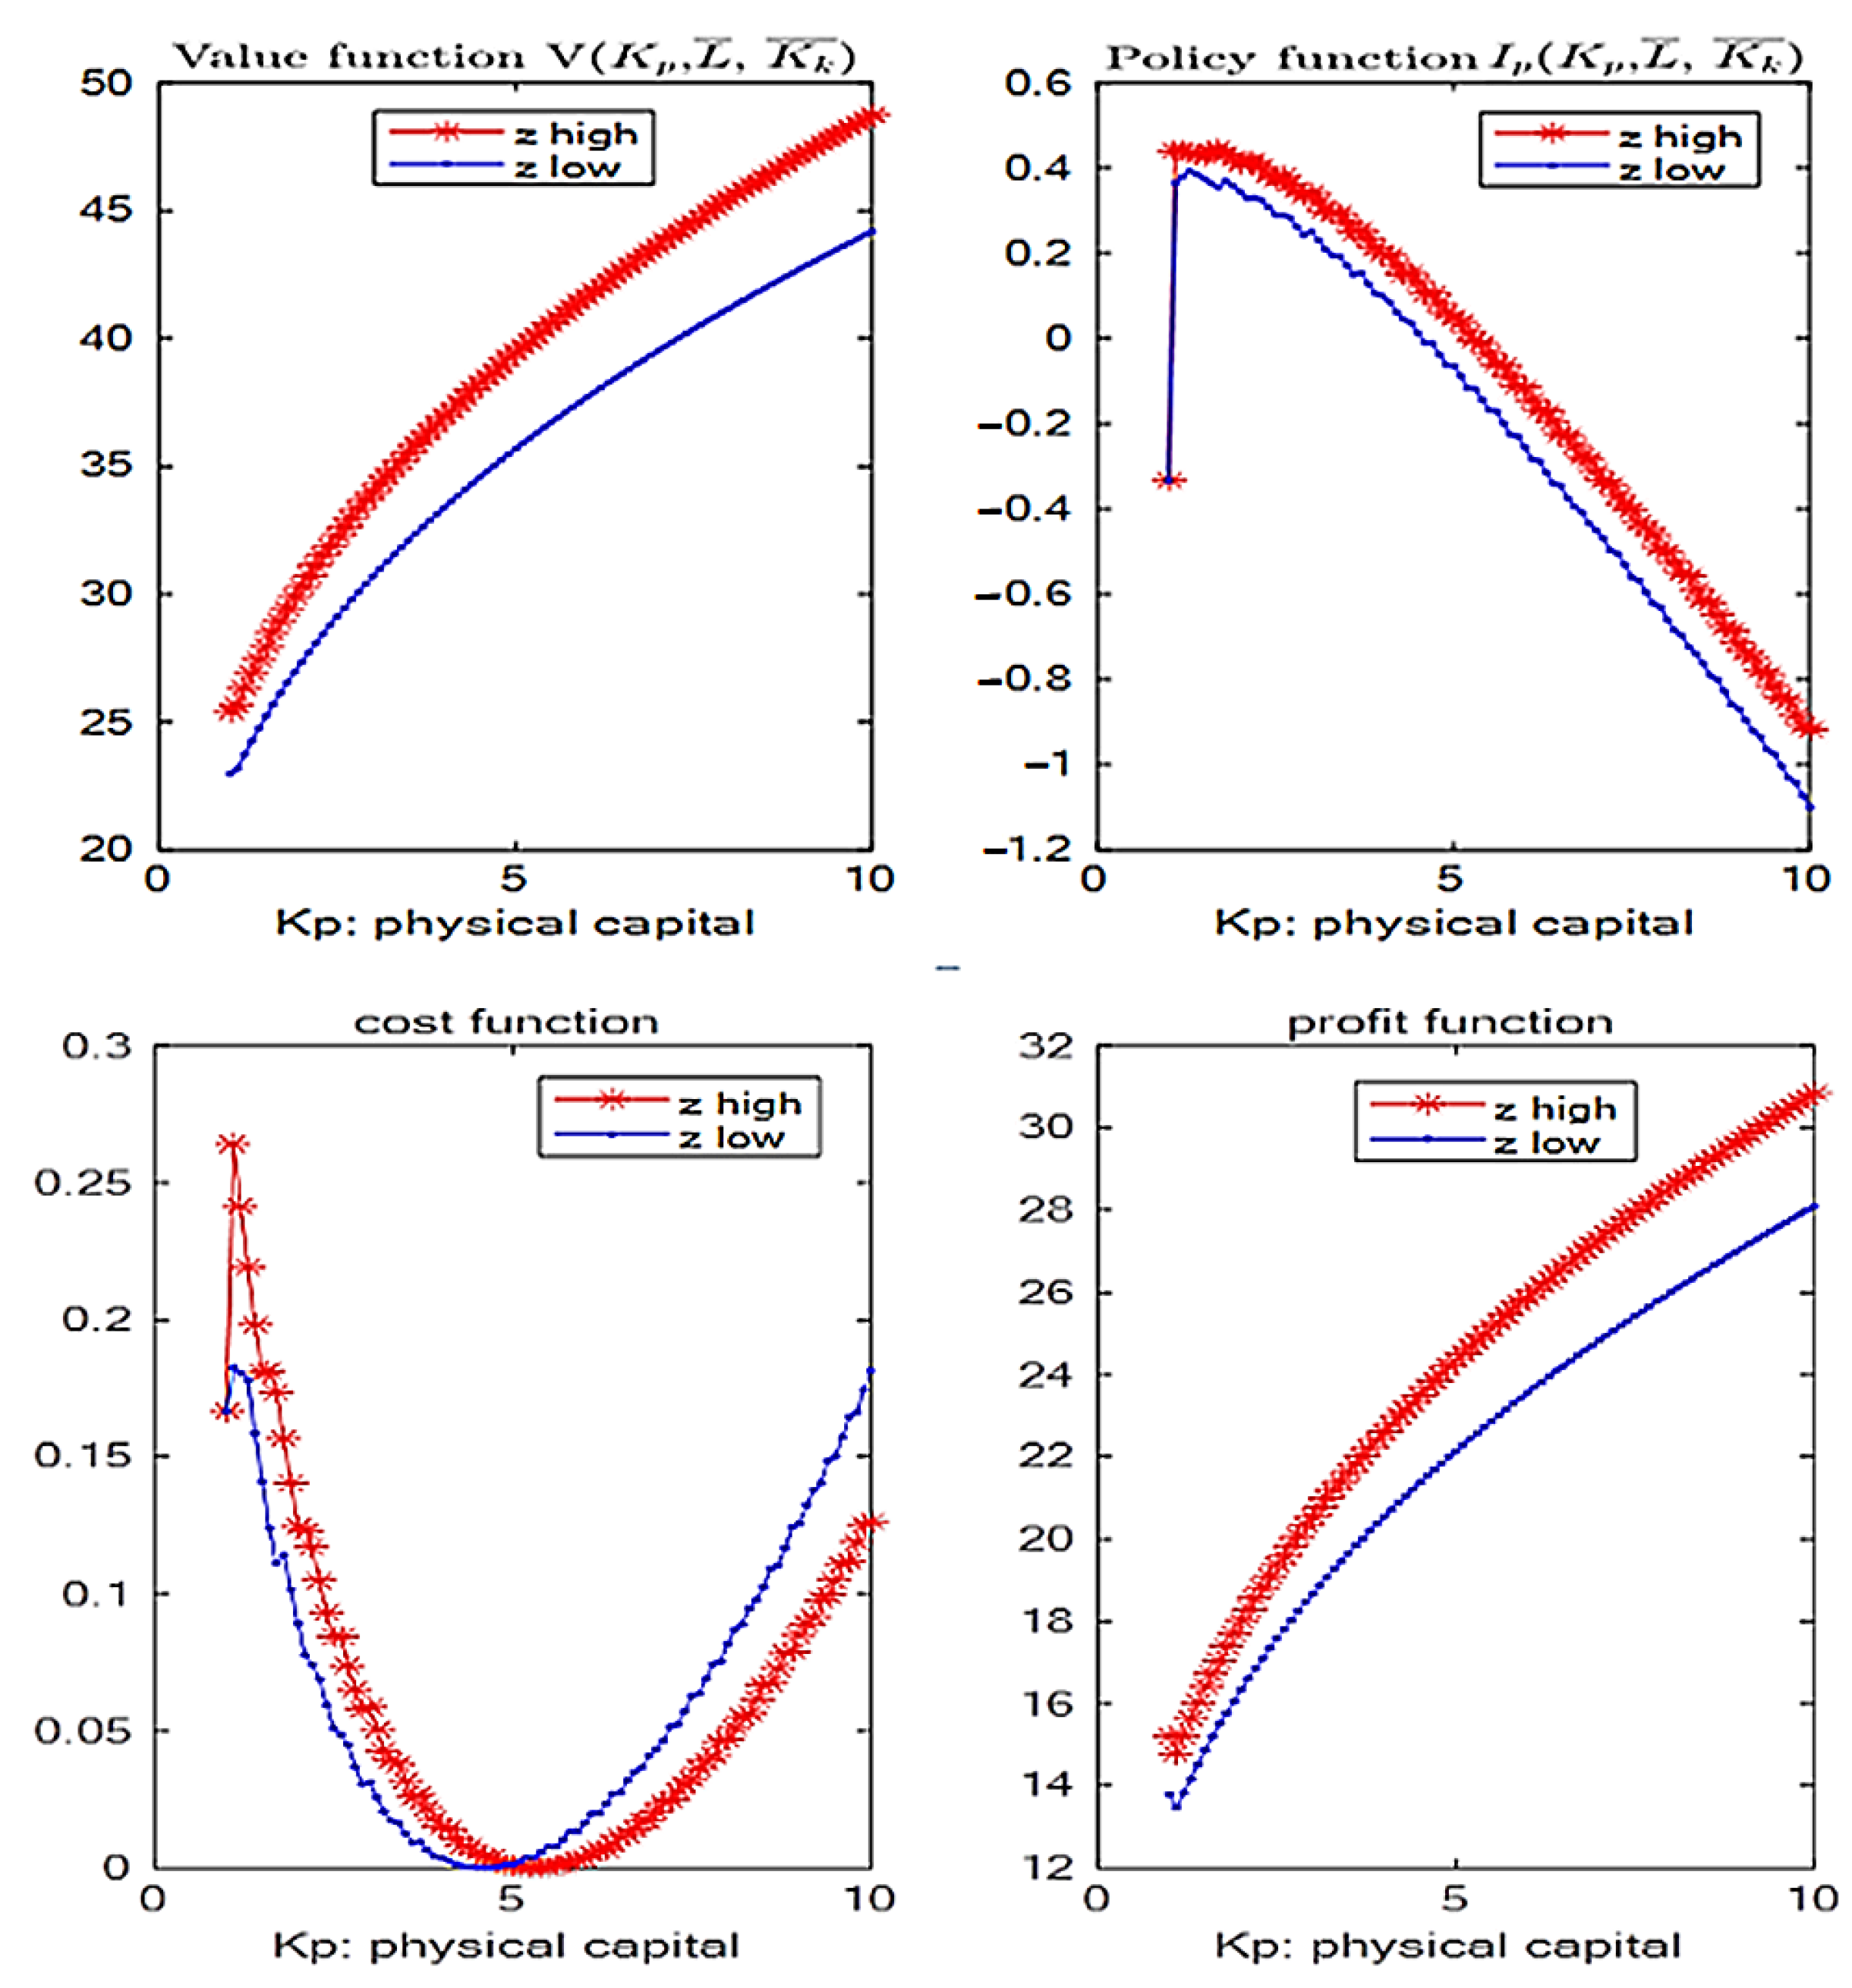
5.2.1. Relationship between Physical Capital Investment and Physical Capital Stock
Enterprises are divided into high-technology enterprises and low-technology enterprises according to their types, with corresponding
-values of 1.1 (
high) and 1.0 (
low), respectively. As for the relationship between enterprise market value (
) and physical capital stock
, it can be seen from
Figure 9 that the higher the physical capital stock, the higher the technical level, the greater the enterprise value, and the distance between high-tech enterprises and low-technology enterprises will gradually expand. For the relationship between physical capital investment
and physical capital stock
, it can be seen that when the physical capital is low, the investment in physical capital should continue to increase, that is,
should increase. However, when the physical capital is high, the physical capital investment can be appropriately reduced. It is worth noting that new investment in physical capital is negative when physical capital is very high. On the whole, there is an inverted U-shaped relationship between the investment of physical capital and the stock of physical capital. In addition, the higher the technological level (
z value), the more physical capital investment can be maintained.
For the relationship between the adjustment cost and the physical capital stock (), the cost function is , and increases gradually and then decreases gradually, so the cost function presents a U-shape with the increase in the physical capital stock. When the capital stock is small, is large and is small, so the cost is large. When is 0, the cost is 0. However, when the capital stock is large, is negative, the absolute value of gradually increases, and gradually decreases, so the cost gradually increases. As for the relationship between the profit and the physical capital stock (), it can be seen that although the adjustment cost changes in a curvilinear form, because the enterprise can choose the optimal adjustment method to arrange the production, with the increase in capital stock, the profit increases gradually.
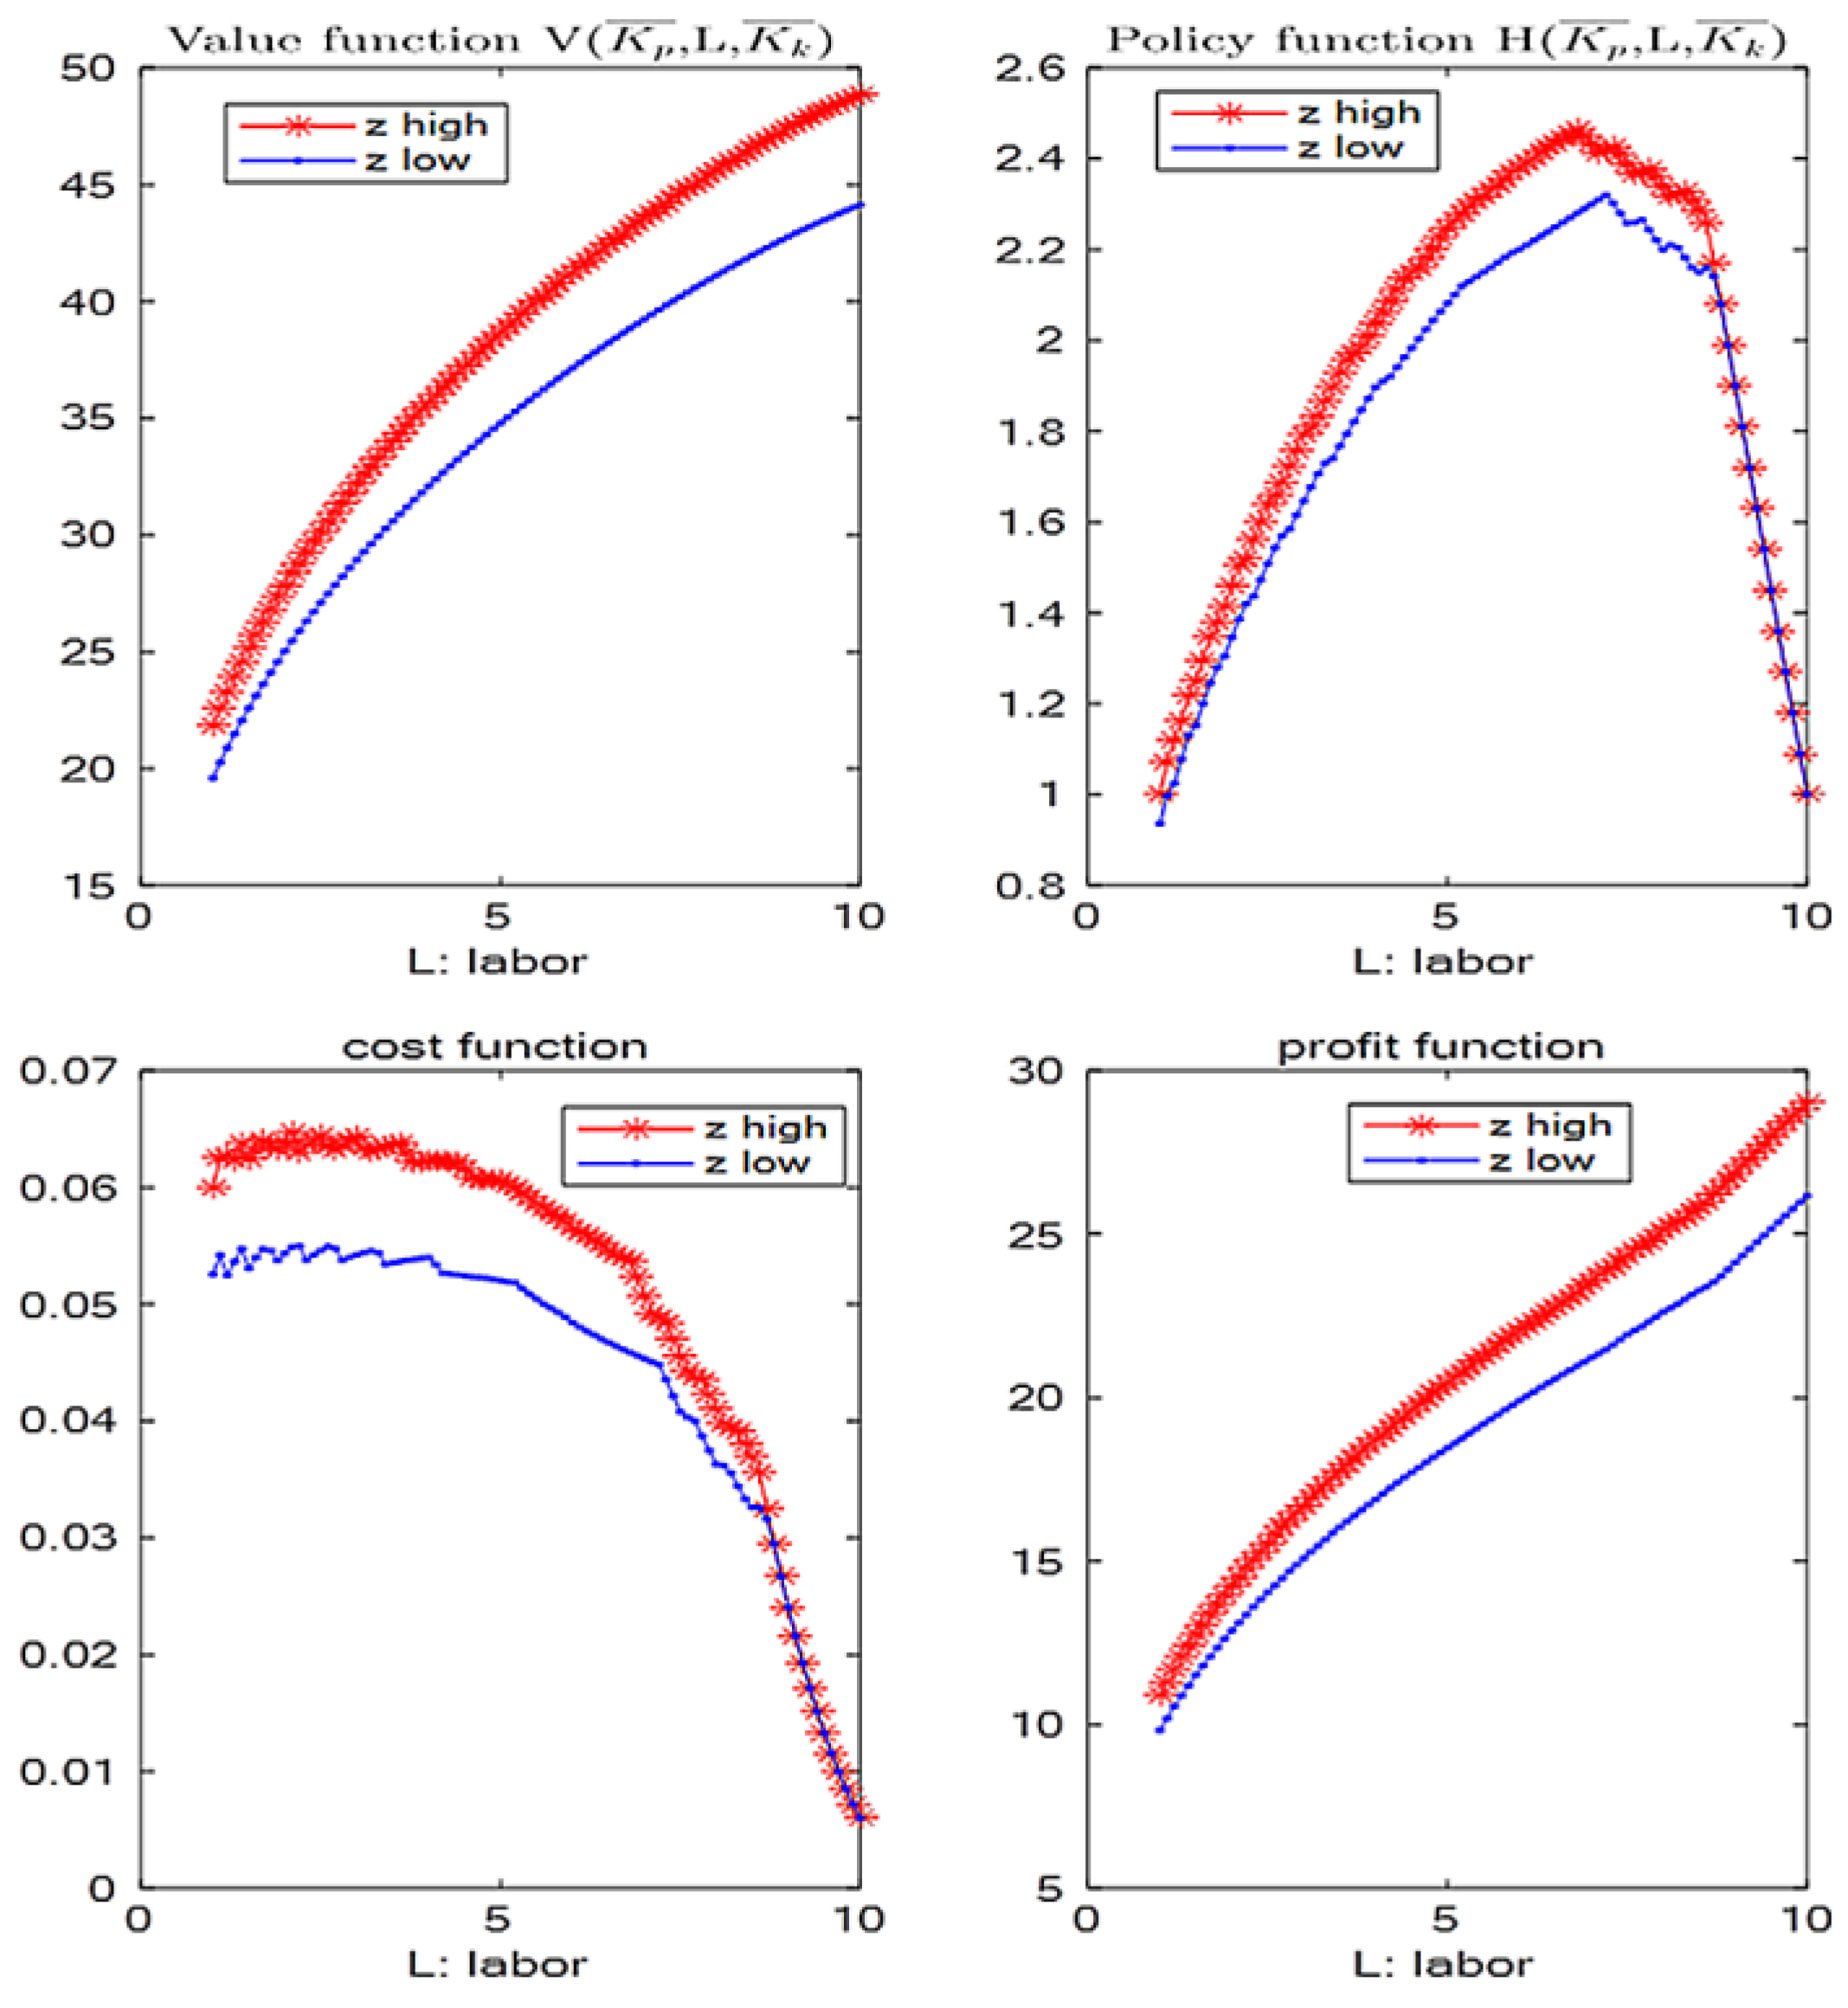
5.2.2. Relationship between Recruitment and Labor Stock
Enterprises are similarly divided into high-technology enterprises and low-technology enterprises according to their types, with corresponding
z-values of 1.1 (
z high) and 1.0 (
z low), respectively. As for the relationship between enterprise market value (
V) and labor stock (
), it can be seen from
Figure 10 that the larger the labor force and the higher the technology level, the greater the enterprise value. When the enterprise is short of labor force, it should constantly add new labor force, and when the labor force reaches a certain level, it should reduce the growth rate of the labor force until it is stable at a certain level. The higher the technical level, the more the labor force can be used effectively. Beyond a certain level, the new labor force is only used to make up for the separating staff.
Although the cost function is , since is always positive, keeps increasing until it reaches an optimal level. Therefore, with the small increase in , keeps increasing, and the cost shows an increasing trend. However, with the increase in , gradually decreases. So, the cost becomes smaller. Since firms can adjust their production level according to the available labor, more labor leads to greater profits.
5.2.3. Relationship between R&D Investment and Knowledge Capital Stock
Enterprises are similarly divided into high-technology enterprises and low-technology enterprises according to their types, corresponding to
z values of 1.4 (
z high) and 1.0 (
z low), respectively. As shown in
Figure 11, the higher the knowledge capital, the higher the technology level and the greater the enterprise value. At the stage of low technology level, and low knowledge capital, the income brought by knowledge capital investment cannot cover the cost, so the best choice is to reduce the investment in this area and devote more resources to production. When the knowledge capital stock exceeds a certain level, knowledge investment can bring positive returns, so it is necessary to increase knowledge investment to make up for the adverse effects of knowledge capital depreciation. When the knowledge capital stock reaches a high level, the speed of knowledge investment should be slowed down. If the overall technology level is low, the knowledge capital stock may need to be reduced.
Since the cost function is assumed to be , the adjusted cost coefficient and the depreciation rate of knowledge capital are both large and the cost is high at the low stage and decreases with the increase in knowledge capital. When the knowledge capital is large, the depreciation of the knowledge capital needs more R&D investment and the adjustment cost increases. Thus, similarly to physical capital, the cost function of knowledge capital shows a U-shaped trend. The higher the knowledge capital and the higher the level of technology, the higher the profit the firm can obtain.
6. Conclusions
The empirical results show that the average proportion of physical capital in the enterprise market value increased from 22.0% in 2009 to 25.7% in 2018 in the whole sample (the constituents of the China Securities 800 Index). The average share of labor decreased from 56.5% in 2009 to 36.4% in 2018. The average share of knowledge capital increased from 21.5% in 2009 to 37.9% in 2018. The same trends can be seen in all four types of industries. In particular, in technology-intensive industries, the proportion of knowledge capital in enterprise value increased from less than 30% in 2009 to 56.5% in 2018. This means that knowledge capital is an important, if not decisive, component of the market value of technology-intensive firms.
The growing importance of knowledge capital diminishes the importance of labor. This finding also coincides with China’s economic transformation. Physical capital does not show a clear trend for the market value of enterprises and remains relatively stable. The decline in the share of labor in the market value of firms corresponds to an increase in the contribution of knowledge capital to the value of firms. This trend occurs in labor-intensive, capital-intensive, and technology-intensive industries (although the change is more visible in technology-intensive industries).
Simulations of firms’ investment behavior show that it is not always better to invest more in physical capital, labor, or knowledge capital. Firms need to make optimal decisions based on the level of technology and current capital stock. Moreover, the firm value distance between high-technology firms and low-technology firms will gradually increase. With a higher level of technology, more labor can be used efficiently, and greater firm value can be obtained. Although the more physical, labor, and knowledge capital a firm has, the greater the value of the firm, too much investment leads to larger adjustment and adaptation costs and also accelerates the amount of depreciation of capital, as new inputs bring adjustment costs. Therefore, enterprises must invest and expand moderately according to the actual situation.
The following policy recommendations are made:
First, firms need to pay more attention to R&D investment. Empirical results show that the importance of knowledge capital is rising gradually each year. Moreover, this trend is present in all sectors, not just technology-intensive ones. Currently, some industries (e.g., the food and beverage industry) are still stuck in channel expansion and brand marketing investment while ignoring the benefits of technological improvement. This has a detrimental effect on the development of the industry. Technological transformation is a process that every industry needs to go through.
Second, China needs to be more vigilant about labor shortages. From the perspective of population size, the growth rate of China’s labor force will further decline; from the perspective of wages, the minimum wage and various employee benefits are also gradually increasing. It can be predicted that the average labor cost growth rate will be higher than the economic growth rate in the future. Although the empirical results show that the labor share (% enterprise market value) has declined over the past decade and the share of enterprise market value of knowledge capital has risen, the sustained rise in labor costs may lead to an increase in the total costs of enterprises, which will in turn crowd out the enterprises’ relevant inputs of knowledge capital and physical capital. The Chinese government may consider fully liberalizing its fertility policy so as to prepare policies to alleviate the long-term labor shortage problem.
Third, the effectiveness of capital investment should be improved. In the past, firms could receive subsidies from the Chinese central or local governments for various capital investments (e.g., building factories and buying equipment). Firms did not pay much attention to capital investment in technological upgrading. With the phasing out of government subsidies (e.g., in the new energy automotive sector) and the opening of China’s market, the number of foreign companies coming to China is increasing, and their business scope is expanding. Increased competition has further prompted Chinese domestic investors to think about how to improve the effectiveness of their capital investments. Therefore, the government should regularly encourage and guide companies to enhance their capital investments to avoid losing the industry’s global competitiveness.
There are some limitations to this research. First, the theoretical model only considers the behaviors of the firm without considering households or consumers. A more general model that includes firms, households, and government can give us more interesting insights. Second, the measurement of knowledge capital is calculated using R&D investment; however, as Das and other researchers [
42,
43] pointed out, R&D may not bring direct firm performance or economic growth, and some firms may use R&D to enact some symbolic innovations for government subsidies. A more direct measurement and detailed analysis of knowledge capital is needed. Third, we only investigated the firm value decomposition trend before the COVID-19 pandemic. Studying the effect of this pandemic on firm values and behaviors would constitute important and interesting research; however, this may need a new model to take into account a great shock. Fourth, we decomposed the firm value using the neoclassical investment model, which contains physical capital, labor, and knowledge capital. There are some studies that used intellectual capital theory and models to explain the firm value. A detailed analysis to compare the assumptions and empirical evidence would be useful for understanding the determinants of firm values.


