Abstract
In this article, we introduce a novel bivariate probability distribution that is absolutely continuous. Considering the Farlie–Gumbel–Morgenstern (FGM) copula and the unit-Weibull distribution, we can obtain a bivariate unit-Weibull distribution. We evaluate the main properties of the new proposal and use two estimation methods to estimate the parameter for the bivariate probability distribution. A brief Monte Carlo simulation study is conducted to assess the behavior of the employed estimation method and the characteristics of the estimators. Ultimately, as an illustration, a real-life application is presented, demonstrating the utility of the proposal.
Keywords:
bivariate probability distribution; distribution for bounded data; proportion data; two-step estimation; copula MSC:
60E05; 62H05
1. Introduction
The probability distribution of proportion or rate data has been extensively studied as it is a prevalent finding in research across all domains of knowledge. The beta distribution is perhaps the most widely recognized. Furthermore, many extensions have been made, such as the beta regression model proposed by Ferrari and Cribari-Neto [1], studied later by Branscum et al. [2], and the beta distribution with an excess of zeros and/or ones of Ospina and Ferrari [3], which was extended to the class of inflated beta regression models, see [4], among others. Other outstanding works are those of Paolino [5], Cribari-Neto and Vasconcellos [6], Kieschnick and Mccullough [7] and Vasconcellos and Cribari-Neto [8].
Alternatives to the beta distribution for analysis of bounded data have been considered by other authors. Martínez-Flórez et al. [9] introduced a mixture model between a Bernoulli process and the power normal distribution to model proportions or rates with inflation at zero and/or one values. Given the flexibility of the power normal distribution to fit high degrees of kurtosis and skewness, this proposal is a viable alternative to the beta model. On the other hand, from the logarithmic transformation of the type , where Y is an absolutely continuous random variable with positive support, it is possible to define new families of adequate distributions to fit data in the interval . Such obtained distributions are generically called unit-f, where f is the density to which the transformation is applied. Based on this idea, the unit-Gamma distribution, see [10], the log-Lindley distribution, see [11], and unit-Weibull, unit-Birnbaum–Saunders and unit-Lindley distributions, see work by Mazucheli et al. [12,13,14], have been developed. In addition, Martínez-Flórez et al. [15] introduced a class of distributions to model rates and proportions through an extension of the alpha-power extension of the skew normal distribution. The authors proposed a regression model based on this distribution for bounded responses.
An extension of the unit-Birnbaum–Saunders distribution and its associated regression model was introduced by Martínez-Flórez and Tovar-Falón [16], while another proposed method capable of fitting data between zeros and/or ones (inclusive) with inflation on the zeros/ones values was considered by Martínez-Flórez et al. [17].
Although there are many proposals developed to model proportion or rate data, there are few works that address the problem of this type of response from a multivariate perspective, that is, models capable of jointly modeling two or more responses in the interval in such a way that the possible correlations existing in the responses can be considered. In relation to this, some authors have recently made some contributions, among which the works of Lemonte and Moreno-Arenas [18] and more recently Martínez-Flórez et al. [19] stand out.
This paper aims to introduce a novel multivariate distribution to handle responses in the region jointly. The new distribution, which is called the bivariate unit-Weibull distribution is obtained from an extension of the univariate unit-Weibull distribution introduced by Mazucheli et al. [12] by using the Farlie–Gumbel–Morgenstern (FGM) copula, see [20].
In all areas of knowledge, the proposed model can be used to model proportion, rate, or index data. Particularly in the field of engineering, it is common to come across this type of information as a result of investigations, for example, to model the percentage of carbon dioxide and the concentration of ozone in the atmosphere, see [21,22], among others. The proposal can also prove to be advantageous for analyzing data sets from other domains of study, such as the social sciences and civic culture. For instance, it can be utilized to analyze data on laws pertaining to drunk driving and traffic fatalities in 48 states in the United States of America, see [23], or data on the Human Development Index and illiteracy rate, see [18,24].
The main benefits of using this proposal are related to the applicability of a usual regression model, which is the prediction or estimate of the mean response, given the values of the covariates considered in the model. Studying the relationship between the dependent variables and the covariates in such a way means that that this can be used in making decisions that help solve real-life problems.
The univariate unit-Weibull distribution has the follow cumulative distribution function (cdf) and probability density function (pdf), respectively.
where , and
where are the scale and shape parameters, respectively. More details and properties of the univariate unit-Weibull distribution can be found in [12].
The following describes the remainder of the article. Section 2 presents the bivariate UW distribution and some of its structural properties are also derived. In Section 3, the statistical inference process is carried out considering two estimation methods. The expected and observed information matrices are also derived. The outcomes of a simulation study and its corresponding discourse are presented in Section 4. Finally, application to real data is provided in Section 5.
2. Bivariate Unit-Weibull Distribution
In this section, a bivariate extension of the unit-Weibull (UW) distribution [12] is proposed. This extension is obtained from the Farlie–Gumbel–Morgenstern (FGM) copula discussed by Gumbel [20] and is called the bivariate unit-Weibull (BVUW) distribution. This new distribution is very attractive, since it allows modeling bivariate data whose response lies on the plane .
To introduce the BVUW distribution, we follow the idea of Almetwally et al. [25] using the FMG copula. Thus, according to the theorem of Sklar [26], Definition 1 follows.
Definition 1.
A random vector is said to have a BVUW distribution, if its joint pdf is given by,
where and .
For the joint pdf given in (3), the notation is used. The picture in Figure 1 shows how the BVUW distribution looks in three dimensions for certain values of , , , and . In the figure, one can observe the different shapes that the UW density can fit, for example, symmetrical and asymmetrical shapes in the shape of a bell or a bathtub.
Figure 1.
Joint probability density function of the BVUW distribution with parameter vector for (a) (b) , (c) , (d) , (e) , (f) .
The joint cdf of the BUW distribution can be written as
where ; ; .
From Definition 1, we have the following theorem.
Theorem 1.
Let , then
- 1.
- for
- 2.
- The pdf of , given , iswhere , for ,
- 3.
- The pdf of , given , iswhere , for .
- 4.
- The cdf , given , is
2.1. Generating Random Variables
The conditional distribution method proposed by Nelsen [27] is employed to generate a random sample from a joint unit-Weibull distribution. It is noteworthy that the joint distribution function can be formulated as follows,
By utilizing the subsequent procedures, we can generate a bivariate sample by utilizing the conditional approach.
- From a uniform distribution, generate and independently of each other.
- Let .
- Allow to determine through numerical simulation.
- Repeat Steps 1 to 3 n times to get the result , .
2.2. Product Moments
Proposition 1.
Let be a random vector with a distribution, with ; then, the rth and sth moments about zero can be computed in the following way
2.3. Correlation Coefficient
Let be a random vector with a distribution, then the correlation coefficient between and is given by:
where
By means of a numerical simulation carried out in the R Development Core Team [28] software, it was found that the range of possible values for the correlation coefficient is:
Table 1 shows some values of the correlation coefficient for certain parameters.

Table 1.
Correlation coefficient values for some selected parameter values.
2.4. Reliability Function
The joint survival function can be expressed as a copula of its marginal survival functions using the reliability function, where and are random variables with survival functions and , see Almetwally et al. [25].
Proposition 2.
The reliability function of the marginal unit-Weibull distributions for the univariate case is given as follows:
Proposition 3.
The joint survival function for the FGM copula Nelsen [27] is
It then follows that the reliability function of the joint FGM distribution for the bivariate UW distribution is
Proposition 4.
Basu [29] defines the hazard function for the bivariate case as
Then, the hazard function of the FGM joint BUW distribution is,
3. Statistical Inference for the BUW Distribution
In this section, two distinct estimation techniques are presented that are employed to estimate the parameters of the BVUW distribution, namely, maximum likelihood estimation (MLE) and estimation by inference functions for margins (IFM). These methods were also considered by Almetwally et al. [25].
3.1. Maximum Likelihood Estimation (MLE)
Under this parametric method, the MLE is found to estimate the parameters of the model jointly and in a single step. The log-likelihood function is given by
To obtain estimates for each parameter, we use the log-likelihood function. We define
A bivariate unit-Weibull distribution has a likelihood function defined by
The corresponding log-likelihood function of a BVUW distribution is subsequently provided by
To obtain the estimations, we equate the derivatives of the log-likelihood function with respect to each parameter to zero. This is performed by determining the equation score in the following manner:
and
The MLE can be obtained by simultaneously solving the score equations.
It is possible to obtain the MLE by solving the score equation,
The estimates are obtained by performing iterative numerical methods such as Newton–Raphson or quasi-Newton methods.
3.2. Information Matrix
In this section, we shall explicate the components of the information matrix for the BUW distribution that have been observed and expected. According to the definition, the elements of the observed information matrix are found using the expression
where is the log-likelihood function associated with the parameter vector . These elements are presented in detail in Appendix A. The expected information matrix is determined by taking the expected value of the observed information matrix and using the expression.
The above values are obtained numerically by using iterative methods, and therefore the information matrix can also be obtained numerically. Using the theory of large samples, the maximum likelihood estimator asymptotically follows a normal distribution with
where . The approximation to can be used to construct confidence intervals for , , , and ; these are given by for , where is on the diagonal of the matrix for each parameter and is the quantile of the standard normal distribution.
3.3. Estimation by Inference Functions for Margins (IFM)
This two-step estimation parametric method was proposed by Joe [30]. Each marginal distribution parameter is evaluated separately in the initial stage.
The subsequent step entails maximizing the log-likelihood function of the copula density by utilizing the maximum likelihood estimates of the marginals and to estimate the copula parameter. For a UW marginal distribution, the log-likelihood function is defined as follows.
The maximum likelihood estimators can be obtained by simultaneously solving the likelihood equations,
That is,
then,
As per the preceding procedure, the IFM estimation of a bivariate unit-Weibull distribution is defined as follows,
Based on this, the differentiation of the log-likelihood function with respect to thus is
The estimate of the parameter is computed numerically by letting
The closed form expression for the maximum likelihood estimator is not available, and its computation necessitates numerical execution using a nonlinear optimization algorithm such as optimize or uniroot in R Development Core Team [28].
For the IFM method, the asymptotic variance matrix does not have a closed form. Joe [30] defines the inference functions as,
where , for , corresponding to the equation,
Thus, the asymptotic variance matrix is given by,
where and .
Other approaches can be used to perform the inference on the model in practical situations, for example, Bayesian methods. Nevertheless, in this work, the classical estimation of the parameters is considered using the methods described above. Based on the research conducted by Kundu and Gupta [31], Zhou et al. [32] and Peralta et al. [33], Bayesian methods can be proposed.
4. Monte Carlo Simulation Study
In this particular section, a Monte Carlo simulation study was conducted with the objective of comparing two copula-based estimation techniques, namely maximum likelihood and estimation by inference of marginal functions, in order to determine the BVUW distribution parameters.
For this simulation, the maxLik function of the statistical software [28] was used and data from the BVUW distribution were generated considering the following values of the parameters , , , and :
- Scenario 1: .
- Scenario 2: .
- Scenario 3: .
- Scenario 4: .
- Scenario 5: .
- Scenario 6: .
For each scenario, 5000 random samples were generated using the algorithm presented in Section 2.1 for the sample sizes and 500. As quality measures to evaluate the benefits of the MLE and IFM methods, the bias, mean square error (MSE), confidence interval length (CIL) and the interval coverage rate (ICR) were used. These measurements were calculated as
and
where is the estimate of for the ith sample, and is the standard error of . The ICR is calculated as the proportion of the confidence interval that contain the true value of the parameter below the nominal 95% level. The outcomes of the simulation study are shown in Table A1, Table A2 and Table A3 in Appendix B.
Based on the data presented in the tables, it can be observed that, in general, as the sample size increases, the bias, MSE and CIL of all parameter estimators tend to decrease with the implementation of MLE and IFM methods. In regard to the ICR, the values obtained are very similar to the reference value of 95%. On the other hand, for large n sample sizes, the MLE and IFM methods produce very similar results in terms of bias, MSE and CIL values. Furthermore, both estimation methods have better results in terms of estimations when the copula parameter is not high, that is, for values of the parameter in the interval .
The IFM method produces better results when estimating the copula parameter theta. This phenomenon can be attributed in part to the fact that the IFM methodology comprises two estimation steps: the first step involves the estimation of the marginal distribution parameters, followed by the estimation of the copula parameter by incorporating the estimates of the previous marginal distribution parameters.
5. Illustration
This application demonstrates the relevance of the WUB model in a practical context. To accomplish this goal, a collection of facts is considered, focusing on the legislation governing drunk driving and fatalities from traffic collisions in states of the United States of America during the period from 1980 to 2004, as revealed by a thorough investigation conducted by Freeman [23].
The database is accessible within the woolridge library of R Development Core Team [28] software, where it is designated as driving. It contains information related to current legislation, accident records and demographic characteristics. For this particular application, the variables unemployment rate () and the percent population aged 14 to 24 () were employed, and the BUW distribution was subsequently adjusted. Likewise, to compare with our proposal, the bivariate Johnson SB (BVSJB) distribution of Lemonte and Moreno-Arenas [18], the bivariate normal (BVN) distribution and the conditional bivariate skew normal (BVSN) distribution of Arnold et al. [34] were studied.
For the purpose of comparison, the Akaike information criterion (AIC) [35] and the Bayesian information criterion (BIC) [36] were employed. These measures are defined in the following:
The parameter p represents the number of parameters and the log-likelihood function was evaluated at the MLEs of the parameters. It is best to choose the model with the smallest AIC or BIC. We used the maxLik function of the statistical package [28] to fit the bivariate model.
The parameters of these models were estimated using the maximum likelihood method. The standard errors are shown in parentheses in Table 2. According to the AIC and BIC criteria, the BVUW distribution provides the best fit.
Table 2.
MLE (SE) for the fitted models.
The graphs in Figure 2 show the contours of the BVN, BVSN and BVUW distributions. We carried out a bivariate Kolmogorov–Smirnov test. For the special case of the BVUW model,
therefore, it is possible to conclude that the BVUW model is well suited to the present data set.
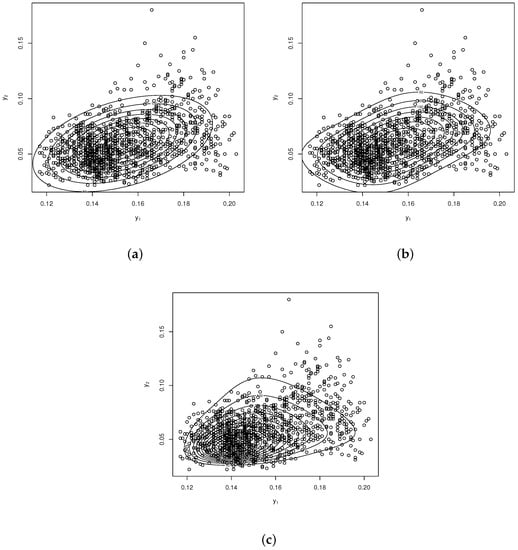
Figure 2.
Contour plots for the fitted models. (a) BVN, (b) BVSN and (c) BVUW.
6. Concluding Remarks
Although there are several proposals for fitting proportion, rate or index data, very few focus on the problem of fitting multivariate responses, for example, in the region .
In this work, a new bivariate distribution was proposed to model data whose response falls within the region . It is possible to obtain the new distribution by extending the univariate unit-Weibull distribution introduced by Mazucheli et al. [12]. For the proposed distribution, the main properties such as the joint density function and the joint distribution function were studied. The moments were also studied and two methods of estimation of the parameters involved in the model were considered. The results of a Monte Carlo-type simulation study showed good asymptotic properties of the parameter estimators and that the two estimation methods are equally efficient. Finally, application to a real data set showed that the proposed model is a viable alternative to analyze proportion, rate or index data in a multivariate context.
Future work could use the results of this proposal to consider how to extend the case of regression models and make inferences about the models from a Bayesian perspective.
Author Contributions
Conceptualization, R.T.-F. and G.M.-F.; methodology, R.T.-F., G.M.-F. and L.P.-M.; software, R.T.-F. and G.M.-F.; validation, R.T.-F., G.M.-F. and L.P.-M.; formal analysis, R.T.-F., G.M.-F. and L.P.-M.; investigation, R.T.-F. and G.M.-F.; resources, R.T.-F. and G.M.-F.; data curation, R.T.-F. and G.M.-F.; writing—original draft preparation, R.T.-F. and G.M.-F.; writing—review and editing, R.T.-F., G.M.-F. and L.P.-M.; visualization, R.T.-F. and G.M.-F.; supervision, R.T.-F. and G.M.-F.; project administration, R.T.-F. and G.M.-F.; funding acquisition, R.T.-F. and G.M.-F. All authors have read and agreed to the published version of the manuscript.
Funding
The research of R. Tovar-Falón and G. Martinez-Flórez was supported partially by project: Resolución de Problemas de Situaciones Reales Usando Análisis Estadístico a través del Modelamiento Multidimensional de Tasas y Proporciones; Esquemas de Monitoreamiento para Datos Asimétricos no Normales y una Estrategia Didáctica para el Desarrollo del Pensamiento Lógico-Matemático. Universidad de Córdoba, Colombia, Acta de Compromiso Número FCB-05-19.
Institutional Review Board Statement
Not applicable.
Informed Consent Statement
Not applicable.
Data Availability Statement
Details about available data are given in Section 5.
Acknowledgments
G. Martínez-Flórez and R. Tovar-Falón acknowledge the support given by Universidad de Córdoba, Montería, Colombia.
Conflicts of Interest
The authors declare no conflict of interest.
Appendix A. Elements of the Observed Information Matrix
This section presents the elements of the observed information matrix presented in Section 3.
The following elements are obtained using the expression in (7) and after some algebraic simplifications:
Appendix B. Simulation Tables
Table A1.
Quality measure (QM) of the estimates obtained under the MLE and IMF methods: Scenarios 1 and 2.
Table A1.
Quality measure (QM) of the estimates obtained under the MLE and IMF methods: Scenarios 1 and 2.
| Scenario 1 | MLE Method | IFM Method | |||||||||
|---|---|---|---|---|---|---|---|---|---|---|---|
| QM | |||||||||||
| 30 | Bias | 0.0405 | 0.1680 | 0.0048 | 0.0845 | −0.0647 | 0.0408 | 0.1676 | 0.0044 | 0.0854 | −0.0701 |
| MSE | 0.0907 | 0.3265 | 0.0168 | 0.1211 | 0.1956 | 0.0910 | 0.3229 | 0.0166 | 0.1195 | 0.2005 | |
| CIL | 1.1173 | 2.0657 | 0.4760 | 1.1742 | 2.0777 | 1.1157 | 2.0645 | 0.4749 | 1.1736 | 2.0586 | |
| ICR | 0.9549 | 0.9542 | 0.9246 | 0.9386 | 0.9689 | 0.9573 | 0.9542 | 0.9245 | 0.9390 | 0.9741 | |
| 50 | Bias | 0.0235 | 0.0906 | 0.0029 | 0.0543 | −0.0320 | 0.0248 | 0.0926 | 0.0029 | 0.0543 | −0.0342 |
| MSE | 0.0482 | 0.1672 | 0.0097 | 0.0617 | 0.1535 | 0.0489 | 0.1682 | 0.0097 | 0.0614 | 0.1558 | |
| CIL | 0.8501 | 1.5614 | 0.3678 | 0.8916 | 1.6133 | 0.8508 | 1.5624 | 0.3678 | 0.8917 | 1.6055 | |
| ICR | 0.9550 | 0.9543 | 0.9331 | 0.9338 | 0.9451 | 0.9533 | 0.9533 | 0.9331 | 0.9393 | 0.9428 | |
| 75 | Bias | 0.0189 | 0.0551 | 0.0048 | 0.0296 | −0.0181 | 0.0197 | 0.0552 | 0.0048 | 0.0296 | −0.0206 |
| MSE | 0.0323 | 0.1062 | 0.0063 | 0.0375 | 0.1121 | 0.0326 | 0.1067 | 0.0062 | 0.0373 | 0.1113 | |
| CIL | 0.6904 | 1.2591 | 0.3011 | 0.7176 | 1.3245 | 0.6909 | 1.2596 | 0.3013 | 0.7177 | 1.3186 | |
| ICR | 0.9448 | 0.9550 | 0.9373 | 0.9366 | 0.9441 | 0.9455 | 0.9544 | 0.9408 | 0.9374 | 0.9415 | |
| 100 | Bias | 0.0119 | 0.0405 | 0.0026 | 0.0222 | −0.0154 | 0.0123 | 0.0400 | 0.0029 | 0.0219 | −0.0166 |
| MSE | 0.0239 | 0.0808 | 0.0047 | 0.0260 | 0.0869 | 0.0239 | 0.0808 | 0.0047 | 0.0259 | 0.0859 | |
| CIL | 0.5944 | 1.0851 | 0.2601 | 0.6189 | 1.1532 | 0.5948 | 1.0853 | 0.2604 | 0.6190 | 1.1485 | |
| ICR | 0.9477 | 0.9510 | 0.9403 | 0.9544 | 0.9477 | 0.9450 | 0.9490 | 0.9389 | 0.9537 | 0.9477 | |
| 200 | Bias | 0.0079 | 0.0258 | 0.0008 | 0.0083 | −0.0007 | 0.0080 | 0.0258 | 0.0009 | 0.0081 | −0.0013 |
| MSE | 0.0119 | 0.0383 | 0.0022 | 0.0125 | 0.0439 | 0.0119 | 0.0383 | 0.0022 | 0.0125 | 0.0437 | |
| CIL | 0.4184 | 0.7630 | 0.1836 | 0.4342 | 0.8182 | 0.4187 | 0.7633 | 0.1838 | 0.4343 | 0.8160 | |
| ICR | 0.9467 | 0.9533 | 0.9453 | 0.9540 | 0.9393 | 0.9473 | 0.9527 | 0.9467 | 0.9527 | 0.9387 | |
| 500 | Bias | 0.0025 | 0.0063 | −0.0008 | 0.0062 | −0.0010 | 0.0025 | 0.0062 | −0.0008 | 0.0061 | −0.0012 |
| MSE | 0.0044 | 0.0146 | 0.0009 | 0.0052 | 0.0172 | 0.0044 | 0.0146 | 0.0009 | 0.0052 | 0.0172 | |
| CIL | 0.2634 | 0.4794 | 0.1160 | 0.2743 | 0.5192 | 0.2636 | 0.4796 | 0.1160 | 0.2744 | 0.5183 | |
| ICR | 0.9507 | 0.9547 | 0.9467 | 0.9427 | 0.9547 | 0.9513 | 0.9527 | 0.9480 | 0.9420 | 0.9540 | |
| Scenario 2 | |||||||||||
| 30 | Bias | 0.0593 | 0.1801 | 0.0029 | 0.0908 | −0.2892 | 0.0625 | 0.1920 | 0.0034 | 0.0916 | −0.2993 |
| MSE | 0.0997 | 0.3186 | 0.0159 | 0.1133 | 0.2248 | 0.1049 | 0.3375 | 0.0165 | 0.1185 | 0.2341 | |
| CIL | 1.1301 | 2.0703 | 0.4740 | 1.1771 | 1.9724 | 1.1329 | 2.0781 | 0.4744 | 1.1778 | 2.0189 | |
| ICR | 0.9568 | 0.9568 | 0.9290 | 0.9424 | 0.9302 | 0.9557 | 0.9547 | 0.9241 | 0.9389 | 0.9505 | |
| 50 | Bias | 0.0291 | 0.1007 | 0.0012 | 0.0637 | −0.1823 | 0.0263 | 0.1021 | 0.0006 | 0.0637 | −0.1826 |
| MSE | 0.0495 | 0.1678 | 0.0093 | 0.0644 | 0.1246 | 0.0495 | 0.1703 | 0.0094 | 0.0651 | 0.1251 | |
| CIL | 0.8510 | 1.5651 | 0.3658 | 0.8948 | 1.5255 | 0.8517 | 1.5682 | 0.3669 | 0.8962 | 1.5299 | |
| ICR | 0.9545 | 0.9516 | 0.9370 | 0.9302 | 0.9486 | 0.9536 | 0.9536 | 0.9366 | 0.9290 | 0.9612 | |
| 75 | Bias | 0.0229 | 0.0679 | 0.0026 | 0.0417 | −0.1263 | 0.0238 | 0.0673 | 0.0030 | 0.0404 | −0.1264 |
| MSE | 0.0321 | 0.1070 | 0.0060 | 0.0378 | 0.0777 | 0.0326 | 0.1077 | 0.0061 | 0.0381 | 0.0783 | |
| CIL | 0.6900 | 1.2622 | 0.2990 | 0.7203 | 1.2294 | 0.6927 | 1.2644 | 0.3006 | 0.7215 | 1.2356 | |
| ICR | 0.9486 | 0.9593 | 0.9398 | 0.9486 | 0.9575 | 0.9477 | 0.9582 | 0.9425 | 0.9442 | 0.9747 | |
| 100 | Bias | 0.0172 | 0.0522 | 0.0015 | 0.0302 | −0.1007 | 0.0172 | 0.0523 | 0.0015 | 0.0297 | −0.1016 |
| MSE | 0.0240 | 0.0827 | 0.0047 | 0.0266 | 0.0576 | 0.0243 | 0.0830 | 0.0047 | 0.0266 | 0.0575 | |
| CIL | 0.5946 | 1.0875 | 0.2586 | 0.6200 | 1.0706 | 0.5967 | 1.0897 | 0.2599 | 0.6211 | 1.0661 | |
| TCR | 0.9452 | 0.9486 | 0.9351 | 0.9503 | 0.9646 | 0.9432 | 0.9491 | 0.9307 | 0.9524 | 0.9766 | |
| 200 | Bias | 0.0095 | 0.0325 | 0.0004 | 0.0101 | −0.0368 | 0.0102 | 0.0313 | 0.0005 | 0.0099 | −0.0363 |
| MSE | 0.0120 | 0.0391 | 0.0022 | 0.0126 | 0.0277 | 0.0122 | 0.0390 | 0.0022 | 0.0126 | 0.0278 | |
| CIL | 0.4169 | 0.7626 | 0.1823 | 0.4334 | 0.7398 | 0.4193 | 0.7647 | 0.1837 | 0.4347 | 0.7382 | |
| ICR | 0.9463 | 0.9553 | 0.9433 | 0.9530 | 0.9605 | 0.9453 | 0.9542 | 0.9424 | 0.9549 | 0.9749 | |
| 500 | Bias | 0.0023 | 0.0078 | −0.0009 | 0.0063 | −0.0068 | 0.0026 | 0.0070 | −0.0008 | 0.0061 | −0.0052 |
| MSE | 0.0044 | 0.0145 | 0.0009 | 0.0052 | 0.0125 | 0.0044 | 0.0147 | 0.0009 | 0.0052 | 0.0129 | |
| CIL | 0.2619 | 0.4782 | 0.1151 | 0.2735 | 0.4667 | 0.2636 | 0.4797 | 0.1160 | 0.2744 | 0.4621 | |
| TCR | 0.9563 | 0.9549 | 0.9494 | 0.9460 | 0.9706 | 0.9506 | 0.9526 | 0.9438 | 0.9445 | 0.9675 | |
Table A2.
Quality measure of the estimates obtained under the MLE and IMF methods: Scenario 3 and 4.
Table A2.
Quality measure of the estimates obtained under the MLE and IMF methods: Scenario 3 and 4.
| Scenario 3 | MLE Method | IFM Method | |||||||||
|---|---|---|---|---|---|---|---|---|---|---|---|
| QM | |||||||||||
| 30 | Bias | 0.0374 | 0.1699 | 0.0068 | 0.0826 | 0.0878 | 0.0429 | 0.1724 | 0.0074 | 0.0821 | 0.0927 |
| MSE | 0.0868 | 0.3288 | 0.0167 | 0.1187 | 0.2061 | 0.0940 | 0.3299 | 0.0168 | 0.1182 | 0.2156 | |
| CIL | 1.1148 | 2.0670 | 0.4777 | 1.1732 | 2.0815 | 1.1176 | 2.0667 | 0.4767 | 1.1715 | 2.0661 | |
| ICR | 0.9527 | 0.9566 | 0.9310 | 0.9380 | 0.9744 | 0.9533 | 0.9563 | 0.9337 | 0.9352 | 0.9721 | |
| 50 | Bias | 0.0225 | 0.0900 | 0.0043 | 0.0517 | 0.0400 | 0.0214 | 0.0903 | 0.0047 | 0.0511 | 0.0450 |
| MSE | 0.0487 | 0.1688 | 0.0099 | 0.0602 | 0.1509 | 0.0486 | 0.1682 | 0.0098 | 0.0598 | 0.1514 | |
| CIL | 0.8496 | 1.5605 | 0.3685 | 0.8906 | 1.6170 | 0.8489 | 1.5606 | 0.3686 | 0.8904 | 1.6097 | |
| ICR | 0.9532 | 0.9546 | 0.9362 | 0.9376 | 0.9489 | 0.9519 | 0.9534 | 0.9385 | 0.9350 | 0.9519 | |
| 75 | Bias | 0.0175 | 0.0519 | 0.0045 | 0.0300 | 0.0158 | 0.0176 | 0.0518 | 0.0044 | 0.0303 | 0.0138 |
| MSE | 0.0328 | 0.1063 | 0.0063 | 0.0370 | 0.1133 | 0.0326 | 0.1062 | 0.0062 | 0.0370 | 0.1136 | |
| CIL | 0.6896 | 1.2578 | 0.3009 | 0.7181 | 1.3217 | 0.6899 | 1.2582 | 0.3011 | 0.7184 | 1.3177 | |
| ICR | 0.9420 | 0.9556 | 0.9413 | 0.9365 | 0.9427 | 0.9450 | 0.9552 | 0.9409 | 0.9382 | 0.9402 | |
| 100 | Bias | 0.0114 | 0.0393 | 0.0031 | 0.0214 | −0.0051 | 0.0113 | 0.0392 | 0.0031 | 0.0212 | −0.0044 |
| MSE | 0.0239 | 0.0807 | 0.0047 | 0.0257 | 0.0850 | 0.0238 | 0.0809 | 0.0047 | 0.0258 | 0.0844 | |
| CIL | 0.5940 | 1.0847 | 0.2603 | 0.6189 | 1.1487 | 0.5943 | 1.0851 | 0.2605 | 0.6191 | 1.1441 | |
| ICR | 0.9489 | 0.9482 | 0.9408 | 0.9509 | 0.9509 | 0.9456 | 0.9489 | 0.9415 | 0.9489 | 0.9469 | |
| 200 | Bias | 0.0079 | 0.0258 | 0.0010 | 0.0082 | −0.0005 | 0.0080 | 0.0258 | 0.0009 | 0.0083 | 0.0001 |
| MSE | 0.0119 | 0.0383 | 0.0022 | 0.0124 | 0.0446 | 0.0119 | 0.0383 | 0.0022 | 0.0124 | 0.0444 | |
| CIL | 0.4184 | 0.7630 | 0.1837 | 0.4342 | 0.8182 | 0.4187 | 0.7633 | 0.1838 | 0.4344 | 0.8158 | |
| ICR | 0.9493 | 0.9513 | 0.9507 | 0.9507 | 0.9407 | 0.9473 | 0.9527 | 0.9540 | 0.9527 | 0.9400 | |
| 500 | Bias | 0.0025 | 0.0062 | −0.0008 | 0.0060 | −0.0013 | 0.0025 | 0.0062 | −0.0008 | 0.0061 | −0.0011 |
| MSE | 0.0044 | 0.0146 | 0.0009 | 0.0051 | 0.0173 | 0.0044 | 0.0146 | 0.0009 | 0.0051 | 0.0172 | |
| CIL | 0.2634 | 0.4794 | 0.1160 | 0.2743 | 0.5193 | 0.2636 | 0.4796 | 0.1160 | 0.2744 | 0.5184 | |
| ICR | 0.9513 | 0.9540 | 0.9507 | 0.9447 | 0.9573 | 0.9513 | 0.9527 | 0.9513 | 0.9447 | 0.9573 | |
| Scenario 4 | |||||||||||
| 30 | Bias | 0.0402 | 0.1742 | 0.0083 | 0.0899 | 0.2911 | 0.0463 | 0.1864 | 0.0093 | 0.0926 | 0.2995 |
| MSE | 0.0844 | 0.3241 | 0.0166 | 0.1144 | 0.2160 | 0.0988 | 0.3481 | 0.0172 | 0.1169 | 0.2258 | |
| CIL | 1.1148 | 2.0707 | 0.4777 | 1.1762 | 1.9978 | 1.1207 | 2.0754 | 0.4778 | 1.1774 | 2.0209 | |
| ICR | 0.9588 | 0.9631 | 0.9262 | 0.9360 | 0.9393 | 0.9508 | 0.9559 | 0.9231 | 0.9364 | 0.9579 | |
| 50 | Bias | 0.0235 | 0.1047 | 0.0044 | 0.0544 | 0.1941 | 0.0271 | 0.1017 | 0.0049 | 0.0550 | 0.1966 |
| MSE | 0.0496 | 0.1712 | 0.0099 | 0.0591 | 0.1292 | 0.0515 | 0.1708 | 0.0103 | 0.0603 | 0.1295 | |
| CIL | 0.8488 | 1.5659 | 0.3677 | 0.8918 | 1.5209 | 0.8523 | 1.5661 | 0.3687 | 0.8926 | 1.5376 | |
| ICR | 0.9553 | 0.9553 | 0.9329 | 0.9377 | 0.9436 | 0.9478 | 0.9573 | 0.9307 | 0.9402 | 0.9658 | |
| 75 | Bias | 0.0167 | 0.0658 | 0.0027 | 0.0365 | 0.1315 | 0.0198 | 0.0598 | 0.0021 | 0.0373 | 0.1324 |
| MSE | 0.0325 | 0.1136 | 0.0060 | 0.0379 | 0.0813 | 0.0329 | 0.1130 | 0.0061 | 0.0381 | 0.0809 | |
| CIL | 0.6872 | 1.2606 | 0.2992 | 0.7198 | 1.2148 | 0.6910 | 1.2610 | 0.3003 | 0.7215 | 1.2337 | |
| ICR | 0.9400 | 0.9472 | 0.9463 | 0.9418 | 0.9346 | 0.9435 | 0.9496 | 0.9426 | 0.9417 | 0.9664 | |
| 100 | Bias | 0.0114 | 0.0495 | 0.0025 | 0.0245 | 0.0905 | 0.0104 | 0.0495 | 0.0016 | 0.0261 | 0.0895 |
| MSE | 0.0238 | 0.0842 | 0.0045 | 0.0250 | 0.0544 | 0.0238 | 0.0850 | 0.0045 | 0.0253 | 0.0543 | |
| CIL | 0.5918 | 1.0856 | 0.2588 | 0.6192 | 1.0481 | 0.5940 | 1.0885 | 0.2601 | 0.6213 | 1.0537 | |
| ICR | 0.9503 | 0.9435 | 0.9409 | 0.9572 | 0.9563 | 0.9452 | 0.9427 | 0.9435 | 0.9536 | 0.9755 | |
| 200 | Bias | 0.0084 | 0.0297 | 0.0013 | 0.0100 | 0.0387 | 0.0089 | 0.0287 | 0.0011 | 0.0100 | 0.0399 |
| MSE | 0.0120 | 0.0386 | 0.0022 | 0.0125 | 0.0285 | 0.0120 | 0.0383 | 0.0022 | 0.0125 | 0.0285 | |
| CIL | 0.4166 | 0.7617 | 0.1825 | 0.4337 | 0.7375 | 0.4189 | 0.7638 | 0.1839 | 0.4350 | 0.7376 | |
| ICR | 0.9482 | 0.9512 | 0.9497 | 0.9474 | 0.9684 | 0.9461 | 0.9528 | 0.9506 | 0.9513 | 0.9813 | |
| 500 | Bias | 0.0024 | 0.0071 | −0.0008 | 0.0063 | 0.0040 | 0.0023 | 0.0069 | −0.0007 | 0.0061 | 0.0036 |
| MSE | 0.0044 | 0.0147 | 0.0009 | 0.0051 | 0.0127 | 0.0044 | 0.0148 | 0.0009 | 0.0051 | 0.0129 | |
| CIL | 0.2619 | 0.4781 | 0.1151 | 0.2735 | 0.4650 | 0.2635 | 0.4797 | 0.1161 | 0.2744 | 0.4621 | |
| ICR | 0.9526 | 0.9560 | 0.9464 | 0.9444 | 0.9547 | 0.9517 | 0.9523 | 0.9510 | 0.9462 | 0.9598 | |
Table A3.
Quality measure of the estimates obtained under the MLE and IMF methods: Scenario 5 and 6.
Table A3.
Quality measure of the estimates obtained under the MLE and IMF methods: Scenario 5 and 6.
| Scenario 5 | MLE Method | IFM Method | |||||||||
|---|---|---|---|---|---|---|---|---|---|---|---|
| QM | |||||||||||
| 30 | Bias | 0.1408 | 0.0687 | 0.0665 | 0.0435 | −0.0683 | 0.1419 | 0.0716 | 0.0653 | 0.0424 | −0.0720 |
| MSE | 0.3577 | 0.0572 | 0.1152 | 0.0302 | 0.1945 | 0.3623 | 0.0592 | 0.1125 | 0.0299 | 0.1997 | |
| CIL | 2.0970 | 0.8835 | 1.1390 | 0.5880 | 2.0834 | 2.0962 | 0.8848 | 1.1362 | 0.5866 | 2.0627 | |
| ICR | 0.9664 | 0.9578 | 0.9445 | 0.9391 | 0.9766 | 0.9633 | 0.9541 | 0.9442 | 0.9388 | 0.9755 | |
| 50 | Bias | 0.0780 | 0.0391 | 0.0420 | 0.0274 | −0.0310 | 0.0804 | 0.0397 | 0.0429 | 0.0271 | −0.0353 |
| MSE | 0.1716 | 0.0309 | 0.0613 | 0.0155 | 0.1540 | 0.1740 | 0.0309 | 0.0611 | 0.0154 | 0.1553 | |
| CIL | 1.5612 | 0.6693 | 0.8616 | 0.4460 | 1.6160 | 1.5625 | 0.6696 | 0.8620 | 0.4458 | 1.6061 | |
| ICR | 0.9592 | 0.9529 | 0.9424 | 0.9339 | 0.9487 | 0.9588 | 0.9532 | 0.9455 | 0.9392 | 0.9441 | |
| 75 | Bias | 0.0552 | 0.0239 | 0.0313 | 0.0149 | −0.0176 | 0.0559 | 0.0237 | 0.0319 | 0.0148 | −0.0206 |
| MSE | 0.1094 | 0.0197 | 0.0370 | 0.0094 | 0.1123 | 0.1101 | 0.0196 | 0.0370 | 0.0093 | 0.1113 | |
| CIL | 1.2555 | 0.5397 | 0.6963 | 0.3588 | 1.3253 | 1.2558 | 0.5398 | 0.6967 | 0.3589 | 1.3186 | |
| ICR | 0.9632 | 0.9537 | 0.9469 | 0.9367 | 0.9442 | 0.9592 | 0.9544 | 0.9462 | 0.9374 | 0.9415 | |
| 100 | Bias | 0.0367 | 0.0174 | 0.0206 | 0.0110 | −0.0149 | 0.0374 | 0.0172 | 0.0212 | 0.0109 | −0.0166 |
| MSE | 0.0800 | 0.0148 | 0.0268 | 0.0065 | 0.0872 | 0.0803 | 0.0148 | 0.0267 | 0.0065 | 0.0859 | |
| CIL | 1.0753 | 0.4651 | 0.5980 | 0.3094 | 1.1532 | 1.0757 | 0.4651 | 0.5984 | 0.3095 | 1.1484 | |
| ICR | 0.9631 | 0.9510 | 0.9370 | 0.9544 | 0.9484 | 0.9624 | 0.9490 | 0.9362 | 0.9537 | 0.9477 | |
| 200 | Bias | 0.0237 | 0.0111 | 0.0065 | 0.0041 | −0.0012 | 0.0238 | 0.0110 | 0.0065 | 0.0041 | −0.0013 |
| MSE | 0.0393 | 0.0070 | 0.0118 | 0.0031 | 0.0436 | 0.0393 | 0.0070 | 0.0118 | 0.0031 | 0.0437 | |
| CIL | 0.7532 | 0.3270 | 0.4180 | 0.2171 | 0.8183 | 0.7535 | 0.3271 | 0.4183 | 0.2172 | 0.8160 | |
| ICR | 0.9453 | 0.9533 | 0.9460 | 0.9540 | 0.9400 | 0.9480 | 0.9527 | 0.9487 | 0.9527 | 0.9387 | |
| 500 | Bias | 0.0069 | 0.0027 | 0.0015 | 0.0031 | −0.0010 | 0.0069 | 0.0027 | 0.0015 | 0.0031 | −0.0012 |
| MSE | 0.0147 | 0.0027 | 0.0046 | 0.0013 | 0.0172 | 0.0147 | 0.0027 | 0.0046 | 0.0013 | 0.0172 | |
| CIL | 0.4716 | 0.2055 | 0.2633 | 0.1372 | 0.5192 | 0.4717 | 0.2055 | 0.2634 | 0.1372 | 0.5183 | |
| ICR | 0.9533 | 0.9547 | 0.9507 | 0.9427 | 0.9547 | 0.9533 | 0.9527 | 0.9493 | 0.9420 | 0.9533 | |
| Scenario 6 | |||||||||||
| 30 | Bias | 0.1775 | 0.0747 | 0.0646 | 0.0428 | −0.2893 | 0.1901 | 0.0834 | 0.0664 | 0.0470 | −0.2994 |
| MSE | 0.3854 | 0.0579 | 0.1121 | 0.0281 | 0.2221 | 0.4210 | 0.0615 | 0.1114 | 0.0298 | 0.2341 | |
| CIL | 2.1327 | 0.8858 | 1.1364 | 0.5872 | 2.0001 | 2.1476 | 0.8912 | 1.1369 | 0.5895 | 2.0130 | |
| ICR | 0.9701 | 0.9590 | 0.9369 | 0.9435 | 0.9391 | 0.9684 | 0.9568 | 0.9399 | 0.9389 | 0.9515 | |
| 50 | Bias | 0.0854 | 0.0433 | 0.0442 | 0.0308 | −0.1791 | 0.0858 | 0.0435 | 0.0437 | 0.0320 | −0.1838 |
| MSE | 0.1687 | 0.0306 | 0.0552 | 0.0157 | 0.1200 | 0.1726 | 0.0312 | 0.0559 | 0.0162 | 0.1253 | |
| CIL | 1.5643 | 0.6708 | 0.8600 | 0.4471 | 1.5351 | 1.5669 | 0.6721 | 0.8619 | 0.4482 | 1.5338 | |
| ICR | 0.9639 | 0.9513 | 0.9561 | 0.9318 | 0.9581 | 0.9630 | 0.9526 | 0.9554 | 0.9298 | 0.9649 | |
| 75 | Bias | 0.0669 | 0.0297 | 0.0356 | 0.0200 | −0.1269 | 0.0672 | 0.0288 | 0.0359 | 0.0202 | −0.1264 |
| MSE | 0.1082 | 0.0197 | 0.0365 | 0.0095 | 0.0776 | 0.1091 | 0.0198 | 0.0366 | 0.0095 | 0.0783 | |
| CIL | 1.2607 | 0.5412 | 0.6959 | 0.3600 | 1.2439 | 1.2628 | 0.5419 | 0.6984 | 0.3607 | 1.2354 | |
| ICR | 0.9654 | 0.9592 | 0.9504 | 0.9459 | 0.9690 | 0.9616 | 0.9582 | 0.9538 | 0.9442 | 0.9738 | |
| 100 | Bias | 0.0486 | 0.0223 | 0.0244 | 0.0150 | −0.0983 | 0.0500 | 0.0224 | 0.0234 | 0.0148 | −0.1014 |
| MSE | 0.0807 | 0.0153 | 0.0266 | 0.0067 | 0.0576 | 0.0823 | 0.0152 | 0.0268 | 0.0066 | 0.0575 | |
| CIL | 1.0801 | 0.4660 | 0.5972 | 0.3100 | 1.0676 | 1.0827 | 0.4670 | 0.5992 | 0.3106 | 1.0655 | |
| ICR | 0.9582 | 0.9465 | 0.9406 | 0.9498 | 0.9632 | 0.9608 | 0.9491 | 0.9391 | 0.9525 | 0.9750 | |
| 200 | Bias | 0.0307 | 0.0139 | 0.0068 | 0.0049 | −0.0361 | 0.0294 | 0.0134 | 0.0071 | 0.0048 | −0.0359 |
| MSE | 0.0402 | 0.0072 | 0.0118 | 0.0032 | 0.0277 | 0.0402 | 0.0072 | 0.0119 | 0.0031 | 0.0278 | |
| CIL | 0.7541 | 0.3268 | 0.4160 | 0.2167 | 0.7413 | 0.7557 | 0.3277 | 0.4184 | 0.2173 | 0.7375 | |
| ICR | 0.9480 | 0.9554 | 0.9546 | 0.9524 | 0.9673 | 0.9454 | 0.9543 | 0.9550 | 0.9550 | 0.9742 | |
| 500 | Bias | 0.0070 | 0.0033 | 0.0011 | 0.0030 | −0.0059 | 0.0073 | 0.0029 | 0.0014 | 0.0030 | −0.0051 |
| MSE | 0.0147 | 0.0027 | 0.0045 | 0.0013 | 0.0126 | 0.0147 | 0.0027 | 0.0046 | 0.0013 | 0.0129 | |
| CIL | 0.4702 | 0.2049 | 0.2617 | 0.1367 | 0.4666 | 0.4718 | 0.2056 | 0.2634 | 0.1372 | 0.4620 | |
| ICR | 0.9544 | 0.9558 | 0.9483 | 0.9455 | 0.9741 | 0.9527 | 0.9520 | 0.9466 | 0.9446 | 0.9655 | |
References
- Ferrari, S.; Cribari-Neto, F. Beta regression for modelling rates and proportions. Appl. Stat. 2004, 31, 799–815. [Google Scholar] [CrossRef]
- Branscum, A.J.; Johnson, W.O.; Thurmond, M.C. Bayesian beta regression: Applications to household expenditure data and genetic distance between foot-and-mouth diseases viruses. Aust. N. Z. J. Stat. 2007, 49, 287–301. [Google Scholar] [CrossRef]
- Ospina, R.; Ferrari, S.L.P. Inflated beta distribution. Stat. Pap. 2010, 51, 111–126. [Google Scholar] [CrossRef]
- Ospina, R.; Ferrari, S.L.P. A general class of zero-or-one inflated beta regression models. Comput. Stat. Data Anal. 2012, 56, 1609–1623. [Google Scholar] [CrossRef]
- Paolino, P. Maximum likelihood estimation of models with beta-distributed dependent variables. Political Anal. 2001, 9, 325–346. [Google Scholar] [CrossRef]
- Cribari-Neto, F.; Vasconcellos, K.L.P. Nearly unbiased maximum likelhood estimation for the beta distribution. J. Stat. Comput. Simul. 2002, 72, 107–118. [Google Scholar] [CrossRef]
- Kieschnick, R.; Mccullough, B.D. Regression analysis of variates observed on (0, 1). Stat. Model. 2003, 3, 193–213. [Google Scholar] [CrossRef]
- Vasconcellos, K.L.P.; Cribari-Neto, F. Improved maximum likelihood estimation in a new class of beta regression models. Braz. J. Probab. Stat. 2005, 19, 13–31. [Google Scholar]
- Martínez-Flórez, G.; Bolfarine, H.; Gómez, H.W. Power-models for proportions with zero/one excess. Appl. Math. Inf. Sci. 2018, 12, 293–303. [Google Scholar] [CrossRef]
- Grassia, A. On a family of distributions with argument between 0 and 1 obtained by transformation of the Gamma distribution and derived compound distributions. Aust. J. Stat. 1977, 19, 108–114. [Google Scholar] [CrossRef]
- Gómez-Déniz, E.; Sordo, M.A.; Calderín-Ojeda, E. The Log-Lindley distribution as an alternative to the Beta regression model with applications in insurance. Insur. Math. Econ. 2013, 54, 49–57. [Google Scholar] [CrossRef]
- Mazucheli, J.; Menezes, A.F.B.; Ghitany, M.E. The unit-Weibull distribution and associated inference. J. Appl. Probab. Stat. 2018, 13, 1–22. [Google Scholar]
- Mazucheli, J.; Menezes, A.; Dey, S. The unit-Birnbaum-Saunders distribution with applications. Chil. J. Stat. 2018, 9, 47–57. [Google Scholar]
- Mazucheli, J.; Menezes, A.F.B.; Chakraborty, S. On the one parameter unit-Lindley distribution and its associated regression model for proportion data. J. Appl. Stat. 2019, 49, 700–714. [Google Scholar] [CrossRef]
- Martínez-Flórez, G.; Azevedo-Farias, R.B.; Tovar-Falón, R. New Class of Unit-Power-Skew-Normal Distribution and Its Associated Regression Model for Bounded Responses. Mathematics 2022, 10, 3035. [Google Scholar] [CrossRef]
- Martínez-Flórez, G.; Tovar-Falón, R. New Regression Models Based on the Unit-Sinh-Normal Distribution: Properties, Inference, and Applications. Mathematics 2021, 9, 1231. [Google Scholar] [CrossRef]
- Martínez-Flórez, G.; Gómez, H.W.; Tovar-Falón, R. Modeling Proportion Data with Inflation by Using a Power-Skew-Normal/Logit Mixture Model. Mathematics 2021, 9, 1989. [Google Scholar] [CrossRef]
- Lemonte, A.J.; Moreno-Arenas, G. On a multivariate regression model for rates and proportions. J. Appl. Stat. 2019, 46, 1084–1106. [Google Scholar] [CrossRef]
- Martínez-Flórez, G.; Lemonte, A.J.; Moreno-Arenas, G.; Tovar-Falón, R. The Bivariate Unit-Sinh-Normal Distribution and Its Related Regression Model. Mathematics 2022, 10, 3125. [Google Scholar] [CrossRef]
- Gumbel, E.G. Bivariate exponential distributions. J. Am. Stat. Assoc. 1960, 292, 698–707. [Google Scholar] [CrossRef]
- Gokhale, S.; Khare, M. Vehicle wake factor for heterogeneous traffic in urban environments. Int. J. Environ. Pollut. 2007, 30, 97–105. [Google Scholar] [CrossRef]
- Martínez-Flórez, G.; Azevedo-Farias, R.B.; Tovar-Falón, R. An Exponentiated Multivariate Extension for the Birnbaum-Saunders Log-Linear Model. Mathematics 2022, 10, 1299. [Google Scholar] [CrossRef]
- Freeman, D.G. Drunk Driving Legislation and Traffic Fatalities: New Evidence on BAC 08 Laws. Contemp. Econ. Policy 2007, 25, 293–308. [Google Scholar] [CrossRef]
- Martínez-Flórez, G.; Vergara-Cardozo, S.; Tovar-Falón, R.; Rodriguez-Quevedo, L. The Multivariate Skewed Log-Birnbaum–Saunders Distribution and Its Associated Regression Model. Mathematics 2023, 11, 1095. [Google Scholar] [CrossRef]
- Almetwally, E.M.; Muhammed, H.Z.; El-Sherpieny, E.S.A. Bivariate Weibull Distribution: Properties and Different Methods of Estimation. Ann. Data. Sci. 2020, 7, 163–193. [Google Scholar] [CrossRef]
- Sklar, A. Random variables, joint distributions, and copulas. Kybernetica 1973, 9, 449–460. [Google Scholar]
- Nelsen, R.B. An Introduction to Copulas, 2nd ed.; Springer: New York, NY, USA, 2010. [Google Scholar]
- R Development Core Team. R: A Language and Environment for Statistical Computing; R Foundation for Statistical Computing: Vienna, Austria, 2021; Available online: http://www.R-project.org (accessed on 31 July 2021).
- Basu, A. Bivariate failure rate. J. Am. Stat. Assoc. 1971, 66, 103–104. [Google Scholar] [CrossRef]
- Joe, H. Asymptotic efficiency of the two-stage estimation method for copula-based models. J. Multivar. Anal. 2005, 94, 401–419. [Google Scholar] [CrossRef]
- Kundu, D.; Gupta, A.K. Bayes estimation for the Marshall-Olkin bivariate Weibull distribution. Comput. Stat. Data Anal. 2013, 57, 271–281. [Google Scholar] [CrossRef]
- Zhou, S.; Xu, A.; Tang, Y.; Shen, L. Fast Bayesian Inference of Reparameterized Gamma Process With Random Effects. IEEE Trans. Reliab. 2023, 1–14. [Google Scholar] [CrossRef]
- Peralta, D.; DeOliveira, R.P.; Achcar, J.A. A hierarchical Bayesian analysis for bivariate Weibull distribution under left-censoring scheme. J. Appl. Stat. 2023, 1–20. [Google Scholar] [CrossRef]
- Arnold, B.C.; Castillo, E.; Sarabia, J.M. Conditionally specified multivariate skewed distributions. Sankhya Indian J. Stat. Ser. A 2002, 64, 206–226. [Google Scholar]
- Akaike, H. A new look at statistical model identification. IEEE Trans. Autom. Control 1974, 19, 716–722. [Google Scholar] [CrossRef]
- Schwarz, G. Estimating the dimension of a model. Ann. Stat. 1978, 6, 461–464. [Google Scholar] [CrossRef]
Disclaimer/Publisher’s Note: The statements, opinions and data contained in all publications are solely those of the individual author(s) and contributor(s) and not of MDPI and/or the editor(s). MDPI and/or the editor(s) disclaim responsibility for any injury to people or property resulting from any ideas, methods, instructions or products referred to in the content. |
© 2023 by the authors. Licensee MDPI, Basel, Switzerland. This article is an open access article distributed under the terms and conditions of the Creative Commons Attribution (CC BY) license (https://creativecommons.org/licenses/by/4.0/).