1. Introduction
The rapid advancements in sensor technologies and the advent of Deep Learning and Computer Vision techniques have enhanced the development of outdoor mobile robots and anticipated high market need for various applications, such as pavement sweeping, landscaping, pest control, inspection, logistics, and security. As per ABI research, the expected shipment of outdoor mobile robots by 2030 is 350,000 units, compared with 40,000 units in 2021, a compound annual growth rate (CAGR) of 27% [
1]. The state-of-the-art technology for outdoor mobile robots is more focused on operational performance, for instance, understanding the outdoor scene and environmental perception [
2], pose estimation and localization [
3], visual navigation [
4], motion control design [
5], path planning [
6], and pedestrian safety [
7]. Since outdoor mobile robots are exposed to uneven terrain and weather extremities, the system deterioration rate in outdoor mobile robots is higher compared with those for indoor applications. Terrainability in outdoor mobile robots, the ability to negotiate various terrain irregularities, has been studied mainly to classify typical terrain types, such as tiles, stone, gravel, sand, asphalt, and grass. It is generally conducted by two approaches [
8]: a wheel–terrain interactive vibration proprioceptive traversability analysis (retrospective techniques) and geometry or appearance-based exteroceptive analysis (prospective methods) using onboard sensors and adopting suitable Artificial Intelligence (AI) techniques for accurate classification. Some examples include terrain classification studies using an Inertial Measurement Unit (IMU) in [
9,
10], camera-based classification in [
11], and a combination of camera and IMU-based classification in [
12]. Similarly, a traversability analysis using 3D LiDAR is conducted in [
13], and a comparative study showed better terrain classification under different lighting conditions using a 3D LiDAR sensor than a camera in [
14]. These approaches will help to classify undesired terrain features; however, they are not an ideal solution for monitoring system deterioration caused by long-term usage or to alert if exposed to any unstructured terrain which causes an accelerated system failure or potential hazards, allowing to opt for a suitable maintenance strategy. Hence, an automated condition monitoring (CM) method is vital for outdoor mobile robots to ensure the robot’s health and operational safety. CM is an enabler to predict potential failure so that maintenance or corrective actions can be promptly triggered [
15,
16]. This can foster a Condition-based Maintenance (CbM) strategy for mobile robots’ deployments, i.e., trigger a proper action based on the health condition of the robot or workspace terrain features only when needed, assuring productivity and safety [
17].
The CM frameworks for mobile robots exploring the onboard typical proprioceptive and exteroceptive sensors, considering both the robot’s internal and external conditions, are an unexplored research area. The existing research works are focused mainly on autonomous and functional enhancements. This is crucial because of the vast demand for mobile robots, optimized maintenance resources, and assured operational safety. Our research focuses on utilizing the typical onboard sensors for CM applications, other than their usual uses for perception, navigation, obstacle avoidance, path planning, etc. Towards this research objective, we have been developing suitable CM frameworks for indoor mobile robots and presented the works based on an IMU sensor [
18] and camera [
19]. Developing an appropriate CM framework for an outdoor mobile robot is more challenging considering the hostile, dynamic, unpredictable, and highly uneven terrain and climate changes in the outdoor workspace environment, especially for fumigation or fogging, lawn mowing, and pavement sweeping applications. Hence, in the proposed work, we explore a 3D LiDAR sensor, an inevitable sensor for mapping and navigation in outdoor autonomous robots, for the CM application of outdoor mobile robots addressing various challenges.
1.1. Problem Statement
It is crucial to monitor and ensure the health conditions of an outdoor mobile robot and that its workspace terrain features are safe or at acceptable levels during its entire course of operation, as here the robot is exposed to undetected and uneven terrain features and adverse weather conditions, which causes an accelerated mode of system degradation resulting unexpected downtime, catastrophic failure, high maintenance cost, operational hazards, and customer dissatisfaction. The terrainability studies mentioned in [
9,
10,
11,
12,
13,
14] will help to plan paths, especially for last mail delivery or security robots, where the end destination or point-to-point travel can be executed with a suitable path planner, minimizing the traverse through unstructured terrain. However, such plans may need to be revised often as the terrain features may keep changing in an outdoor environment. Besides, this approach is not an ideal solution for the robots deployed for outdoor cleaning and maintenance applications, such as pavement sweeping, fogging or fumigation, and lawn mowing or pruning branches because, here, the robot has to cover a predefined area, completely following a traverse pattern which may include uneven terrain such as curbs, cliffs, exposed tree-roots, broken or missing paved stones, pits, gutters, raised utility hole lids, drainage system, etc. Such uneven terrain features, which cause adverse effects on the robot’s health, will not be captured as obstacles in the environment mapping due to their small size. This scenario is the worst in lawn mowing and fumigation or fogging robots, as grass fields usually cover such undesired terrain imperfections. Hence, the passable or impassable exteroceptive terrain classification method is also impractical. Here, due to continuous operation of such sweeping, fumigation, and lawn mowing tasks on uneven areas, the robot degrades at a faster rate, which eventually causes damage to wheels and their alignment, structural deformation and instability, quick wear out of sweeping brushes, looseness of perception sensors assembly, etc., affecting functional performance, safety, and maintenance cost. The system will also degrade naturally and fail due to long-term continuous deployment, even if the terrain is structured and well-retained. Hence, depending on the robot’s design capabilities, applications, terrain types, and changes in climate conditions, the rate of system degradation and potential hazards varies, and a periodic maintenance strategy may not be an ideal solution. As per our knowledge, there is no automated real-time monitoring system to evaluate how good or bad the health condition of the robot and the given workspace for deployment, especially for outdoor environment maintenance robots, other than the human visual inspection method currently followed. The aforementioned facts reveal that an automated real-time CM system is crucial for outdoor mobile robots considering system degradation, terrain flaws, and safety, which supports a CbM strategy to optimize the maintenance resources.
The key challenges involved in the proposed 3D-LiDAR-based CM framework include integrating a 3D Lidar as a reliable vibration indicator sensor posing technical difficulties, as its primary function is for mapping and navigation. Developing an algorithm extracting the vibration-indicated data from the numerous point cloud data for a fast and low computational cost for real-time application is a complex task. Identifying different internal and external factors to assess the states of the robot and extreme outdoor terrain features including severity levels for classification to fit outdoor CM applications is crucial and needs a representative ruggedized outdoor robot for real-world data acquisition, and much trial and error is involved. Adapting a suitable AI model to detect the unique features of vibration-indicated data from dynamically changing outdoor environments for each class with high accuracy is challenging. As the proposed study is based on 3D LiDAR point clouds, the dynamically changing outdoor features and range of 3D LiDAR are tough for performance accuracy, unless a robust and sophisticated data processing algorithm is developed.
1.2. Contributions
This research proposed an automated CM framework for outdoor mobile robots to alert the system deterioration and terrain-related flaws of the workspace causing accelerated degradation or threat to decide whether the robot can easily traverse, traverse with caution, or avoid continuous operation.
Vibration are used as a key indicator of system degradation or uneven terrain; the classified vibration threshold levels in an outdoor robot are safe, moderately safe, and unsafe. Further, the causes of abnormal vibrations are classified as system-generated or terrain-induced to assist proper maintenance or corrective actions.
We explored a novel approach of using a 3D LiDAR sensor for condition monitoring applications in outdoor mobile robots based on point cloud data instead of its usual application for navigation.
The 3D LiDAR point cloud data affected by changes in the linear and angular motion of the robot due to vibration threshold classes are used as vibration-indicated data.
A data extracting algorithm was developed, assuring low computational cost without losing vibration characteristics, by forming cuboids for two prominent clusters in each point cloud frame with computed motion points at its corners and centroid. The vector displacements of these points on three axes, based on the vibration-affected clusters, are compiled from consecutive frames and used as vibration indication data for training each class.
A simply structured 1D-CNN-based vibration threshold class prediction model was developed for fast, accurate, and real-time execution.
A 3D CbM map was generated, developing a framework to map the predicted classes on the 3D occupancy map of the workspace in real time, enabling the maintenance team to trigger prompt actions based on the robot’s condition or workspace, thereby fostering a CbM strategy.
The remainder of this paper is structured as follows:
Section 2 briefs the related published works.
Section 3 overviews the proposed framework, including vibration-indicated data modeling.
Section 4 elaborates on data acquisition, 1D CNN model training, results, and discussion. Real-time field case studies and observations are presented in
Section 5. Finally, the work is summarized in
Section 6.
2. Related Works
The vibration data for fault detection and prognosis of equipment is typically measured using micro-electro-mechanical systems (MEMS) or piezoelectric accelerometers [
20,
21,
22,
23], mainly for bearings, motors, and machinery. Accelerometers are also used for terrain classification in outdoor mobile robot applications, for instance, classifying indoor floor, paving, asphalt, gravel, boule court, and grass in [
24], as well as in [
25] for a four-wheeled planetary exploration rover to classify sand, gravel, and clay. Though CNN-based Deep Learning models are generally used for image pixel-based data, there are many studies where a 1D CNN is used for feature learning on vibration-signal-based raw sensor data for multinomial classification. For instance, a human activity recognition and classification task was conducted using accelerometer and gyroscope sensor raw data applying a 1D CNN model in [
26]. One-dimensional CNN models are widely used to to extract vibration-affected features effectively to classify and predict various defects or severity conditions accurately in real-time, mainly due to their simple structure, low computational complexity, and easy deployability [
27]. For instance, vibration and 1D-CNN-based CM or fault diagnosis and prognostics studies are conducted for machine components [
20,
28], structural systems [
29], and industrial robots [
30]. However, such vibration-based CM research works are not much explored for assuring the health and safety of autonomous indoor and outdoor mobile robots even though there is great research scope by utilizing typical onboard sensors, as well as considering their vast market demand for various applications. To fill such research gaps, two vibration and 1D-CNN-based CM frameworks were proposed previously for indoor mobile cleaning robots, mainly to predict the internal and external sources of abnormal vibrations which cause accelerated system deterioration or threats, thereby enabling a CbM strategy. Firstly, there was an IMU sensor-based study [
18] where the vibration-affected change in linear acceleration, angular velocity, and angular acceleration of the robot was modeled as vibration data. In the second work, a monocular camera sensor [
19] was used, and the vibration was modeled as sparse optical flow. Here, the change in optical flow vector displacement over consecutive frames due to the robot’s vibrations are used as vibration indication data for training different abnormal vibration source classes.
An outdoor mobile robot’s operational conditions and system degradation differ from indoor robots due to its extreme workspace nature. The current studies mainly focus on terrain classification using various sensors to classify terrain types using suitable AI models to conclude passable or impassable terrain. For example, in the study in [
9], terrain classification of mainly asphalts, mud, gravel, and grass, based on magnitude frequency response on X and Y axis rotation and Z axis acceleration rate, is captured through an IMU sensor in an autonomous ground vehicle, using a Probabilistic Neural Network (PNN). A similar study using IMU sensor data on a wheeled mobile robot was conducted to classify typical outdoor terrain types adapting MultiLayer Perceptron (MLP) neural networks in [
10]. Here, the authors also indicated a lower prediction accuracy of classes when using the accelerometer and gyroscope separately. Camera-based visual terrain classification for such terrain features was conducted in [
11] using various texture-based descriptors and applying Random Forest (RF) as the classifier. An IMU-and-camera-based sensor fusion method was applied in the study in [
12] to classify 14 types of terrain classes adapting Support Vector Machine (SVM), which also mentioned a faster classifier is needed for real-time prediction. Semisupervised learning with a positive Naive Bayes classifier was conducted in [
13] using 3D LiDAR data for traversability analysis in outdoor mobile robots by defining the feature vectors with different dimensions. The study in [
14] shows that 3D-LiDAR-based outdoor terrain classification is better under different lighting conditions due to its illumination-invariant property compared with the camera study, and both used RF as the classifier. These studies are limited to the terrainability or traversability of the robot without considering the internal system degradation level or assessing the safe threshold levels to continue the operation in a given workspace, which includes uneven and unseen terrain features. Also, the existing works do not consider ground-level negative obstacles, such as minor pits and gutters, which affect traversability and the robot’s health, which is crucial for CM, too. Besides, to assess the performance of the terrainability/traversability for extreme, uneven outdoor terrains, a ruggedized platform representative of real-world outdoor applications is necessary; however, it mostly uses a small, lightweight simple prototype with the required sensors mounted.
Three-dimensional LiDAR is an inevitable sensor in an outdoor autonomous robot for navigation based on its point cloud data. Recently, many algorithms have been developed using 3D LiDAR point cloud data for fast and accurate prediction of the 3D motion of points in dynamic environments, mainly scene flow estimation, enabling various real-time applications for outdoor robots and autonomous vehicles. For example, FlowNet3D, an architecture explained in [
31], specifies the motion between two frames estimating translation vector flow for each point in the frame, assisting 3D scan registration and motion segmentation applications, enabling better point feature learning and predicting the flow of original points. Any Motion Detector (AMD-Net), a class agnostic scene dynamics estimation architecture proposed in [
32], outputs a static and dynamic segmentation of each cell and its velocity. Instead of handling object detection and scene flow estimation separately, the PillaFlowNet network [
33] takes both simultaneously, providing fast and accurate results. A Fast Hierarchical Network (FH-Net) method is proposed in [
34], minimizing the cost and latency issues of typical scene flow methods and directly computing the key points flow from the source point to its target points. These studies show that the recent point-cloud-based works are more focused on dynamic object detection, motion segmentation, and tracking to assist autonomous outdoor robots or vehicles. Hence, there is a research scope to explore for CM applications analyzing vibration-affected point cloud data to assure outdoor mobile robots’ health and operational safety.
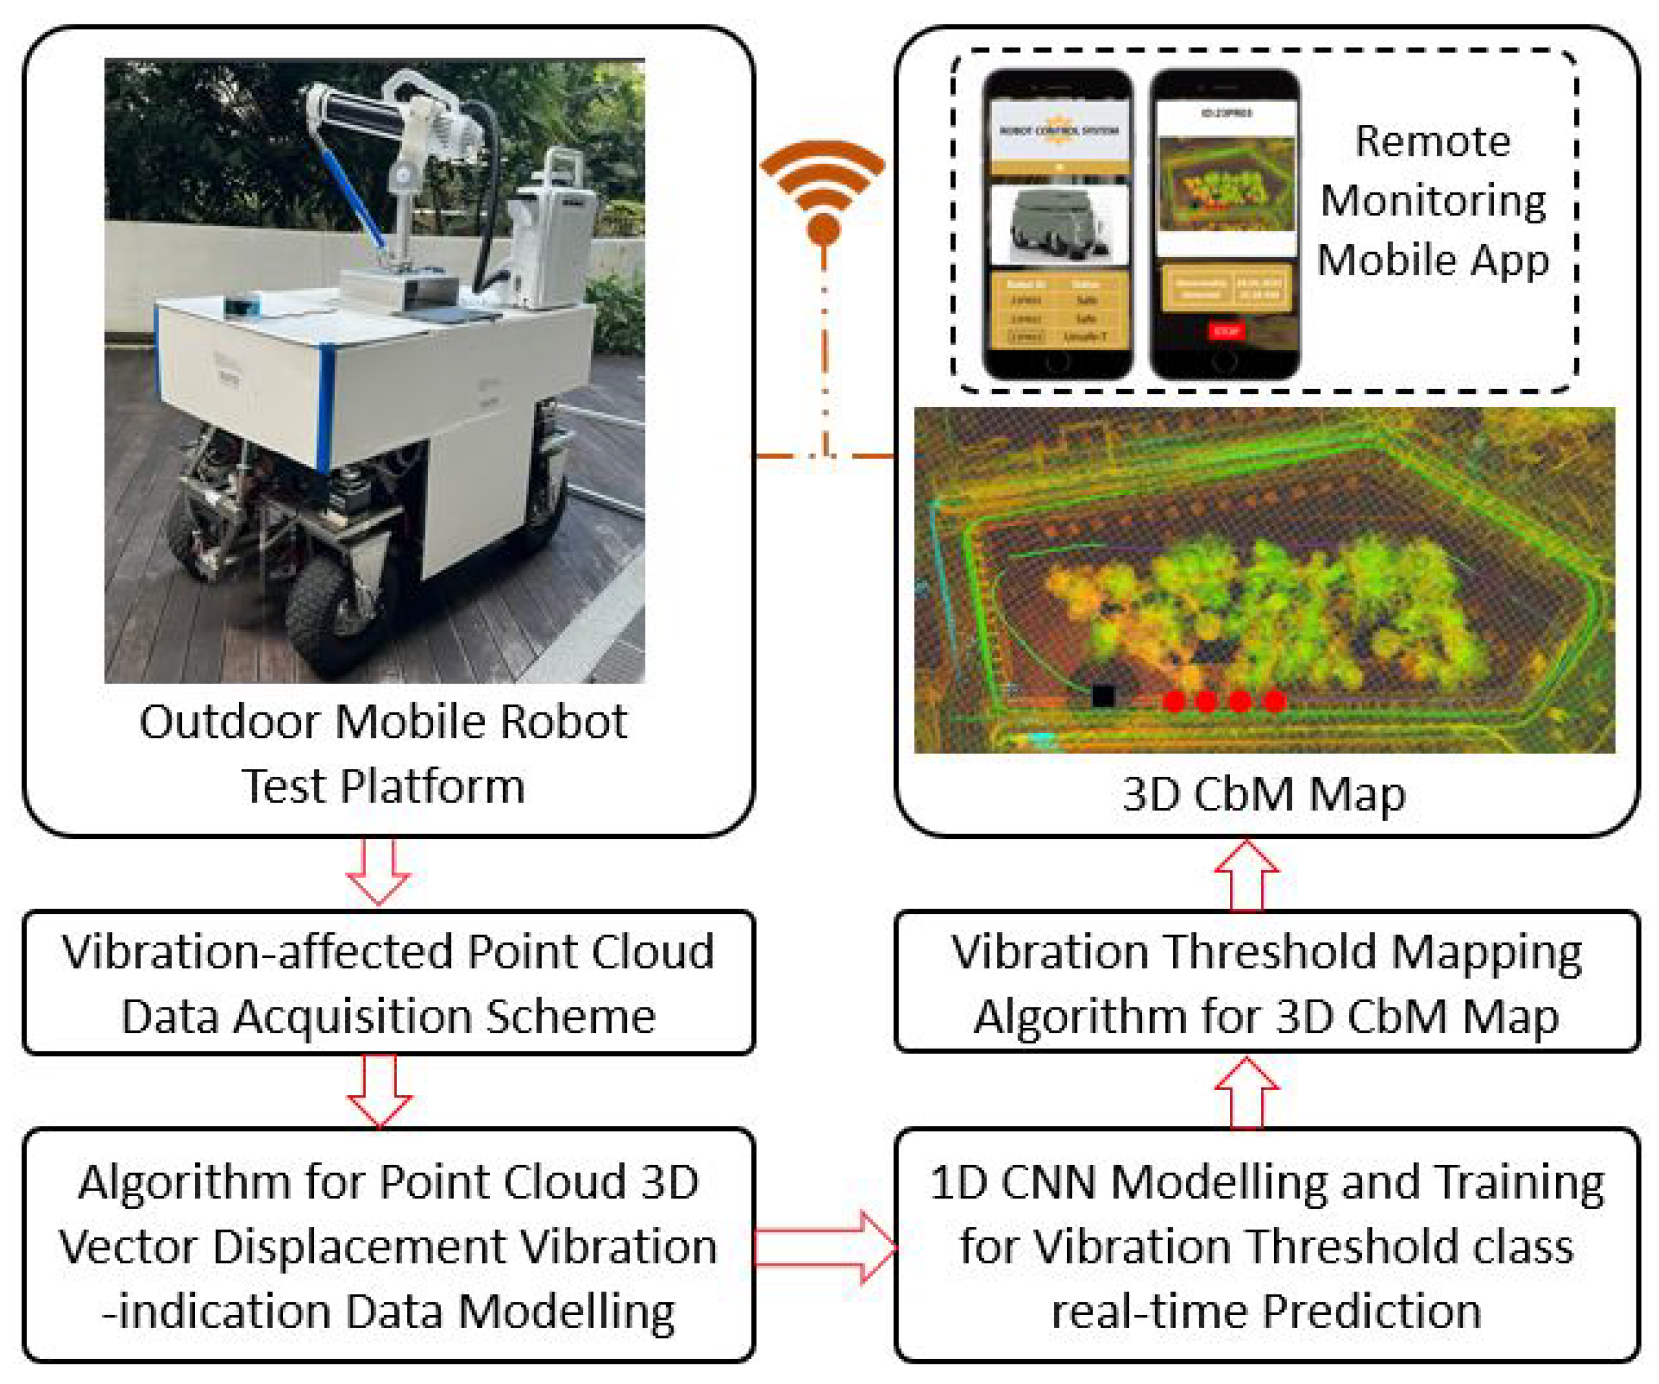
3. Overview of the Proposed Framework
The overview of the proposed 3D LiDAR point-cloud-based CM framework for outdoor mobile robots, predicting the vibration threshold classes in real-time to trigger proper maintenance or corrective action promptly, is illustrated in
Figure 1 and elaborated in the following sections.
3.1. Outdoor Mobile Robot for Data Acquisition and Trials
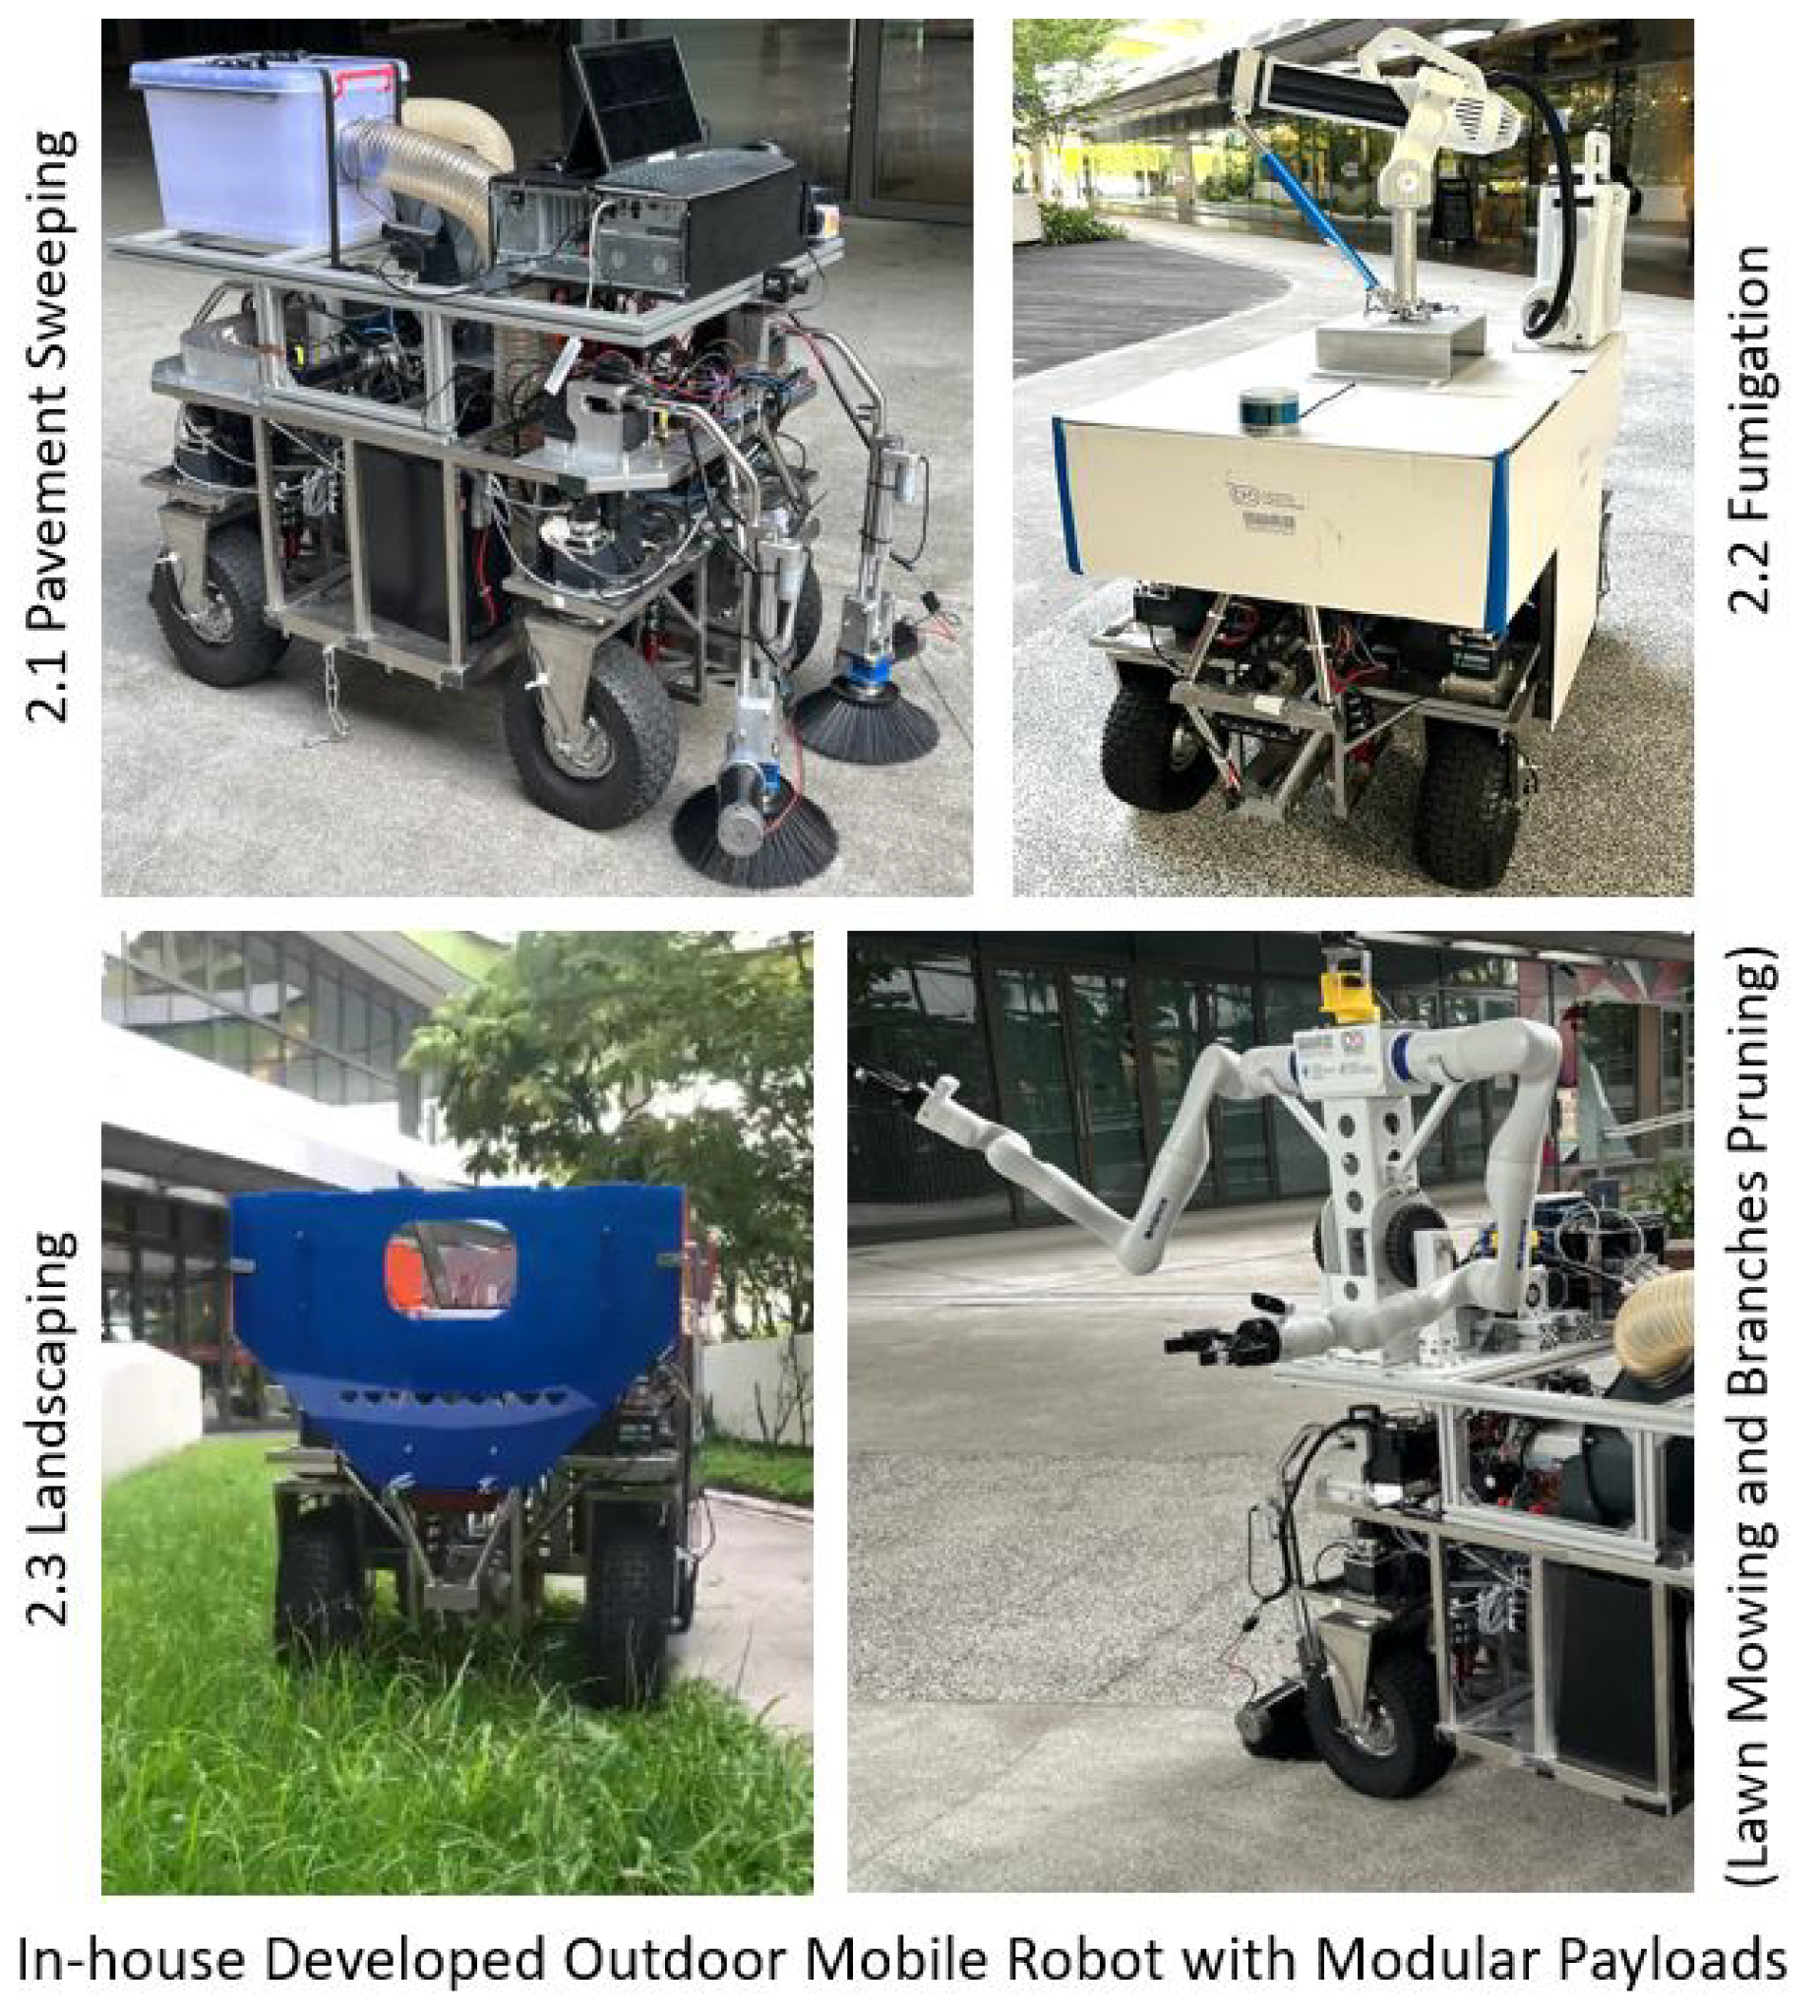
An in-house-designed autonomous wheeled mobile robot is used in this work for vibration-affected point cloud data acquisition for different threshold classes for 1D CNN training and real-time field case studies. The robot base platform is developed in a way to easily mount various modular payloads for diverse outdoor applications, such as pavement sweeping, fumigation or fogging (pest control), and landscaping applications, as shown in
Figure 2, i.e., a vacuum motor–brush–bin assembly for pavement sweeping (
Figure 2(2.1), a sprayer with tank assembly for fumigation (
Figure 2(2.2)), and a grass cutting wire (lawn mowing), and a robotic biarm assembly (pruning branches) for landscaping applications (
Figure 2(2.3)) are integrated for specific outdoor applications. However, for the extensive data acquisition and field trials of this study, we used the fumigation robot (
Figure 2(2.2)), as this robot has to traverse both pavements and grass fields to serve its purpose, ensuring all the potential extreme outdoor terrain features are covered and studied.
The overall size and weight of the robot without payload are 1.6 (L) × 0.85 (W) × 1 (H) m and 300 Kg, respectively, and designed for an additional payload of up to 200 Kg. A ruggedized chassis is built with the weldment of stainless-steel hollow sections and plates, machined stainless steel shafts, aluminum brackets for mounting all critical parts, and a double-wishbone suspension system to fit outdoor driving environment applications. Four hub wheel motors with 250 W of power and a wheel size of 38 (outer diameter) × 15 (width) cm were used for transmission, with 100 W steering motors designed as independent steering drive wheels for omnidirectional mobility. A 3D LiDAR Velodyne VLP-16 is used for perception and localization, and subsequently in autonomous navigation, and a Vectornav VN-100 IMU sensor and wheel encoders are included for dead reckoning to estimate the robot’s position. A 300 Ah 48 V DC lithium iron phosphate (LFP) battery is used to power the system, including payloads. An Industrial PC Anewtech IPC970-10WF5E1A is integrated for steering the entire operation and data storage, and the Robot Operating System (ROS) middleware in the Ubuntu Noetic operating system is used to execute all communications. A TP-Link LTE 4G Router is added for Internet and networking, including for the robot’s remote health monitoring.
3.2. Vibration Threshold Classes for Condition Monitoring
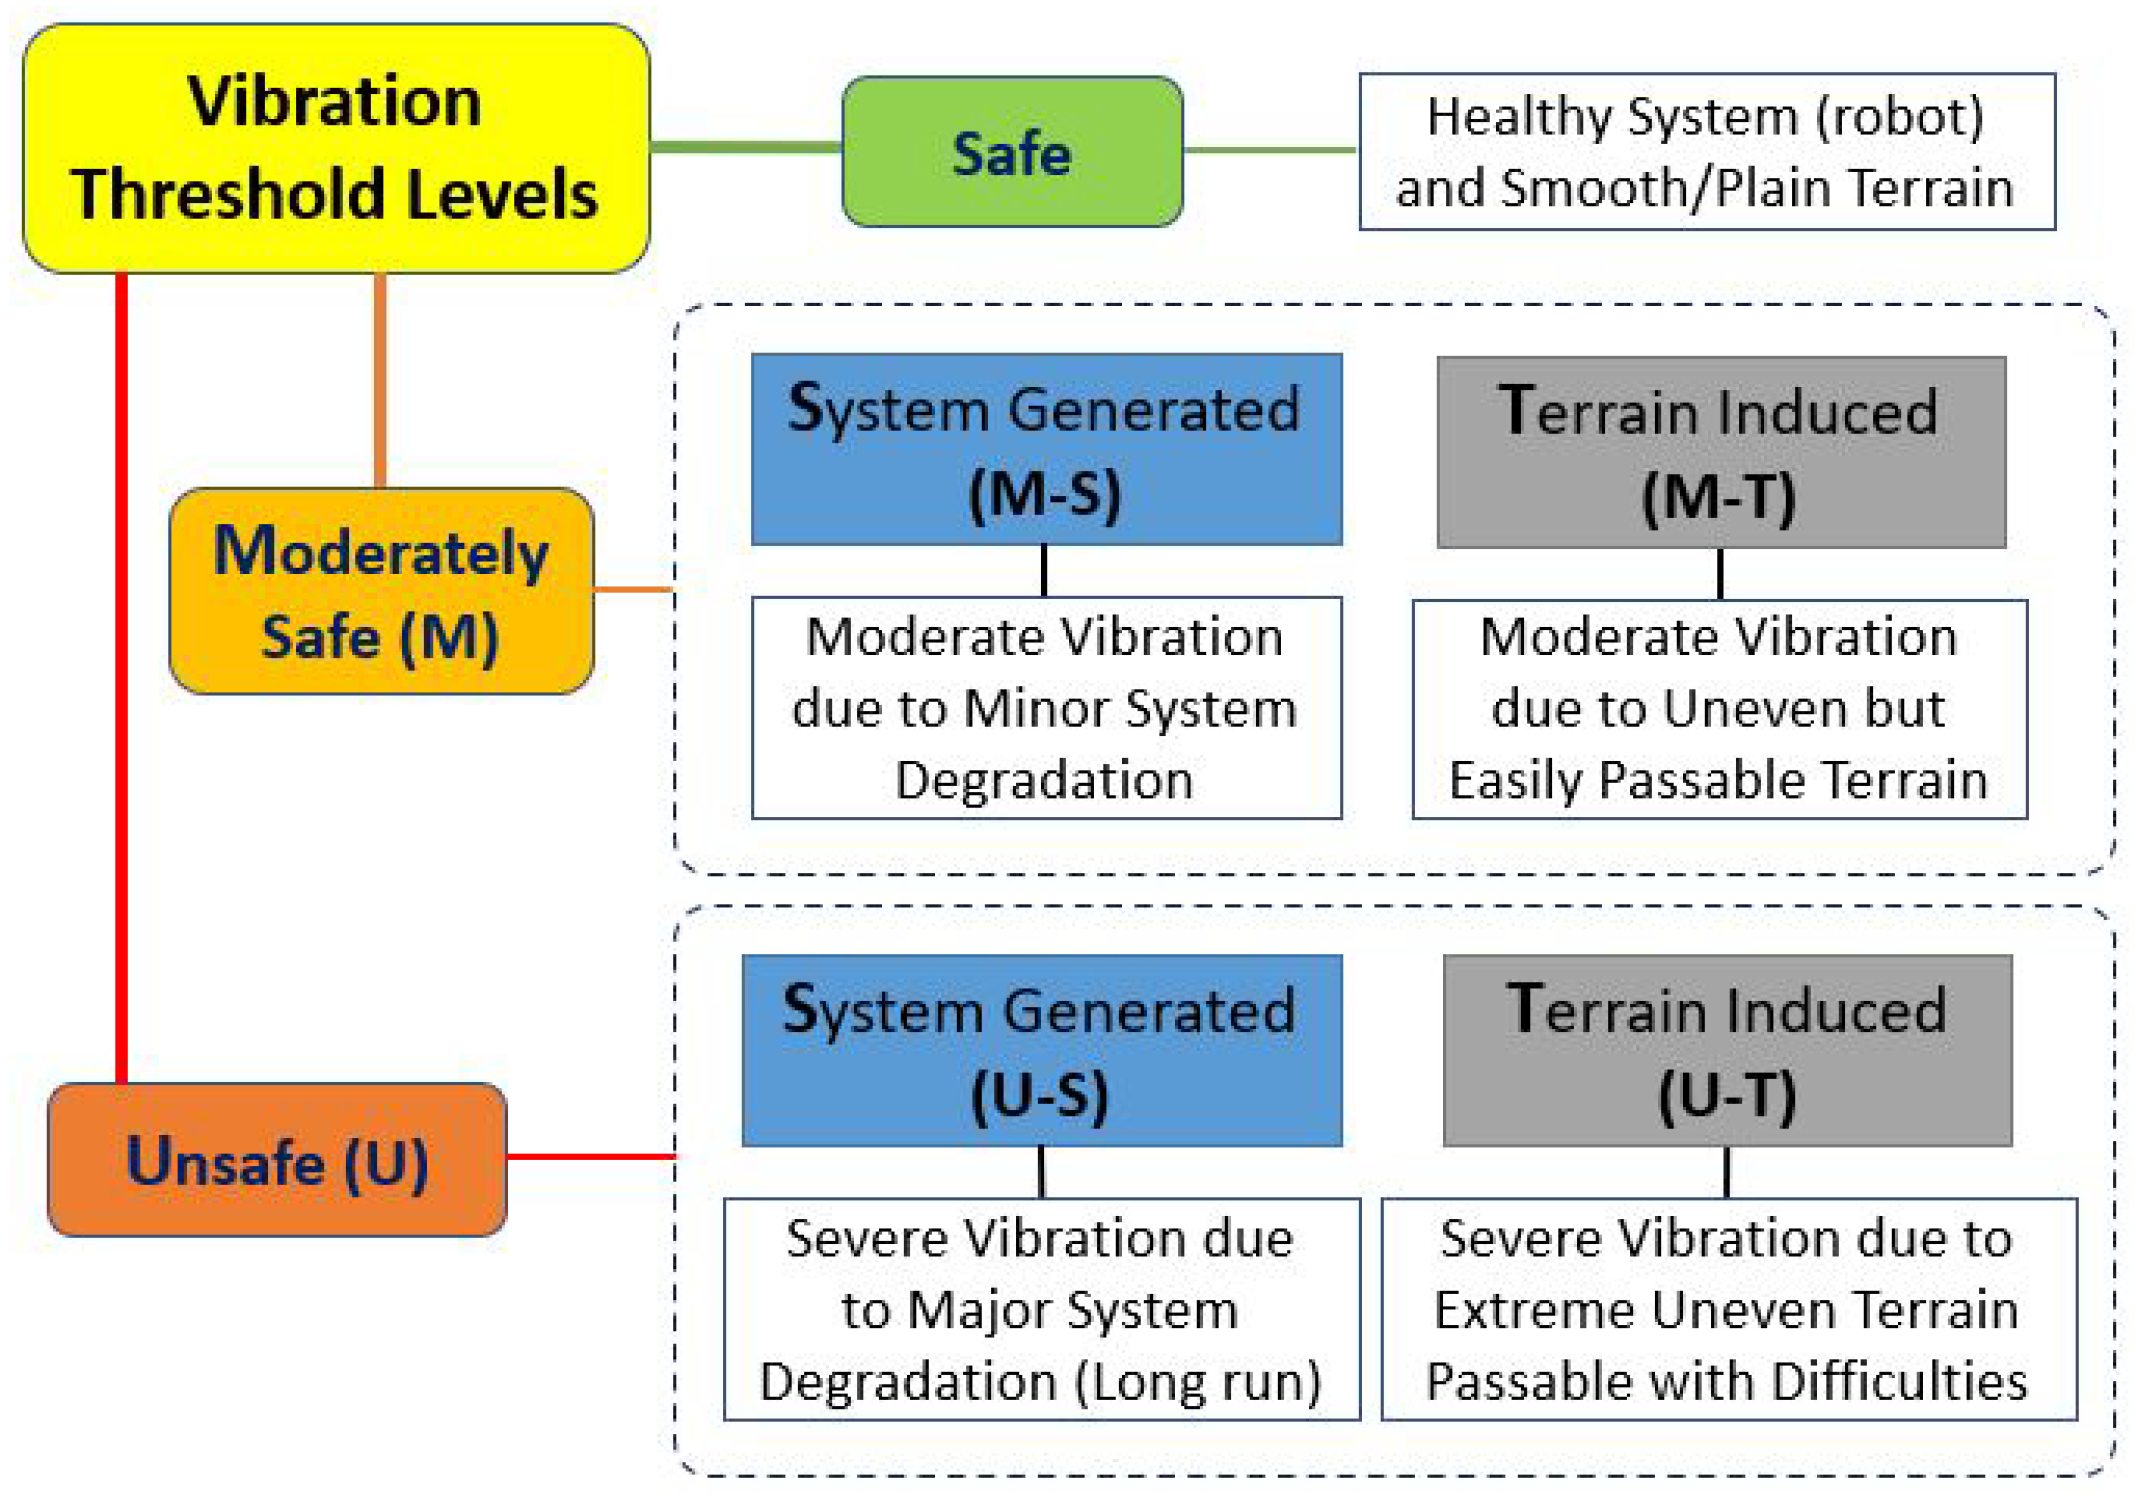
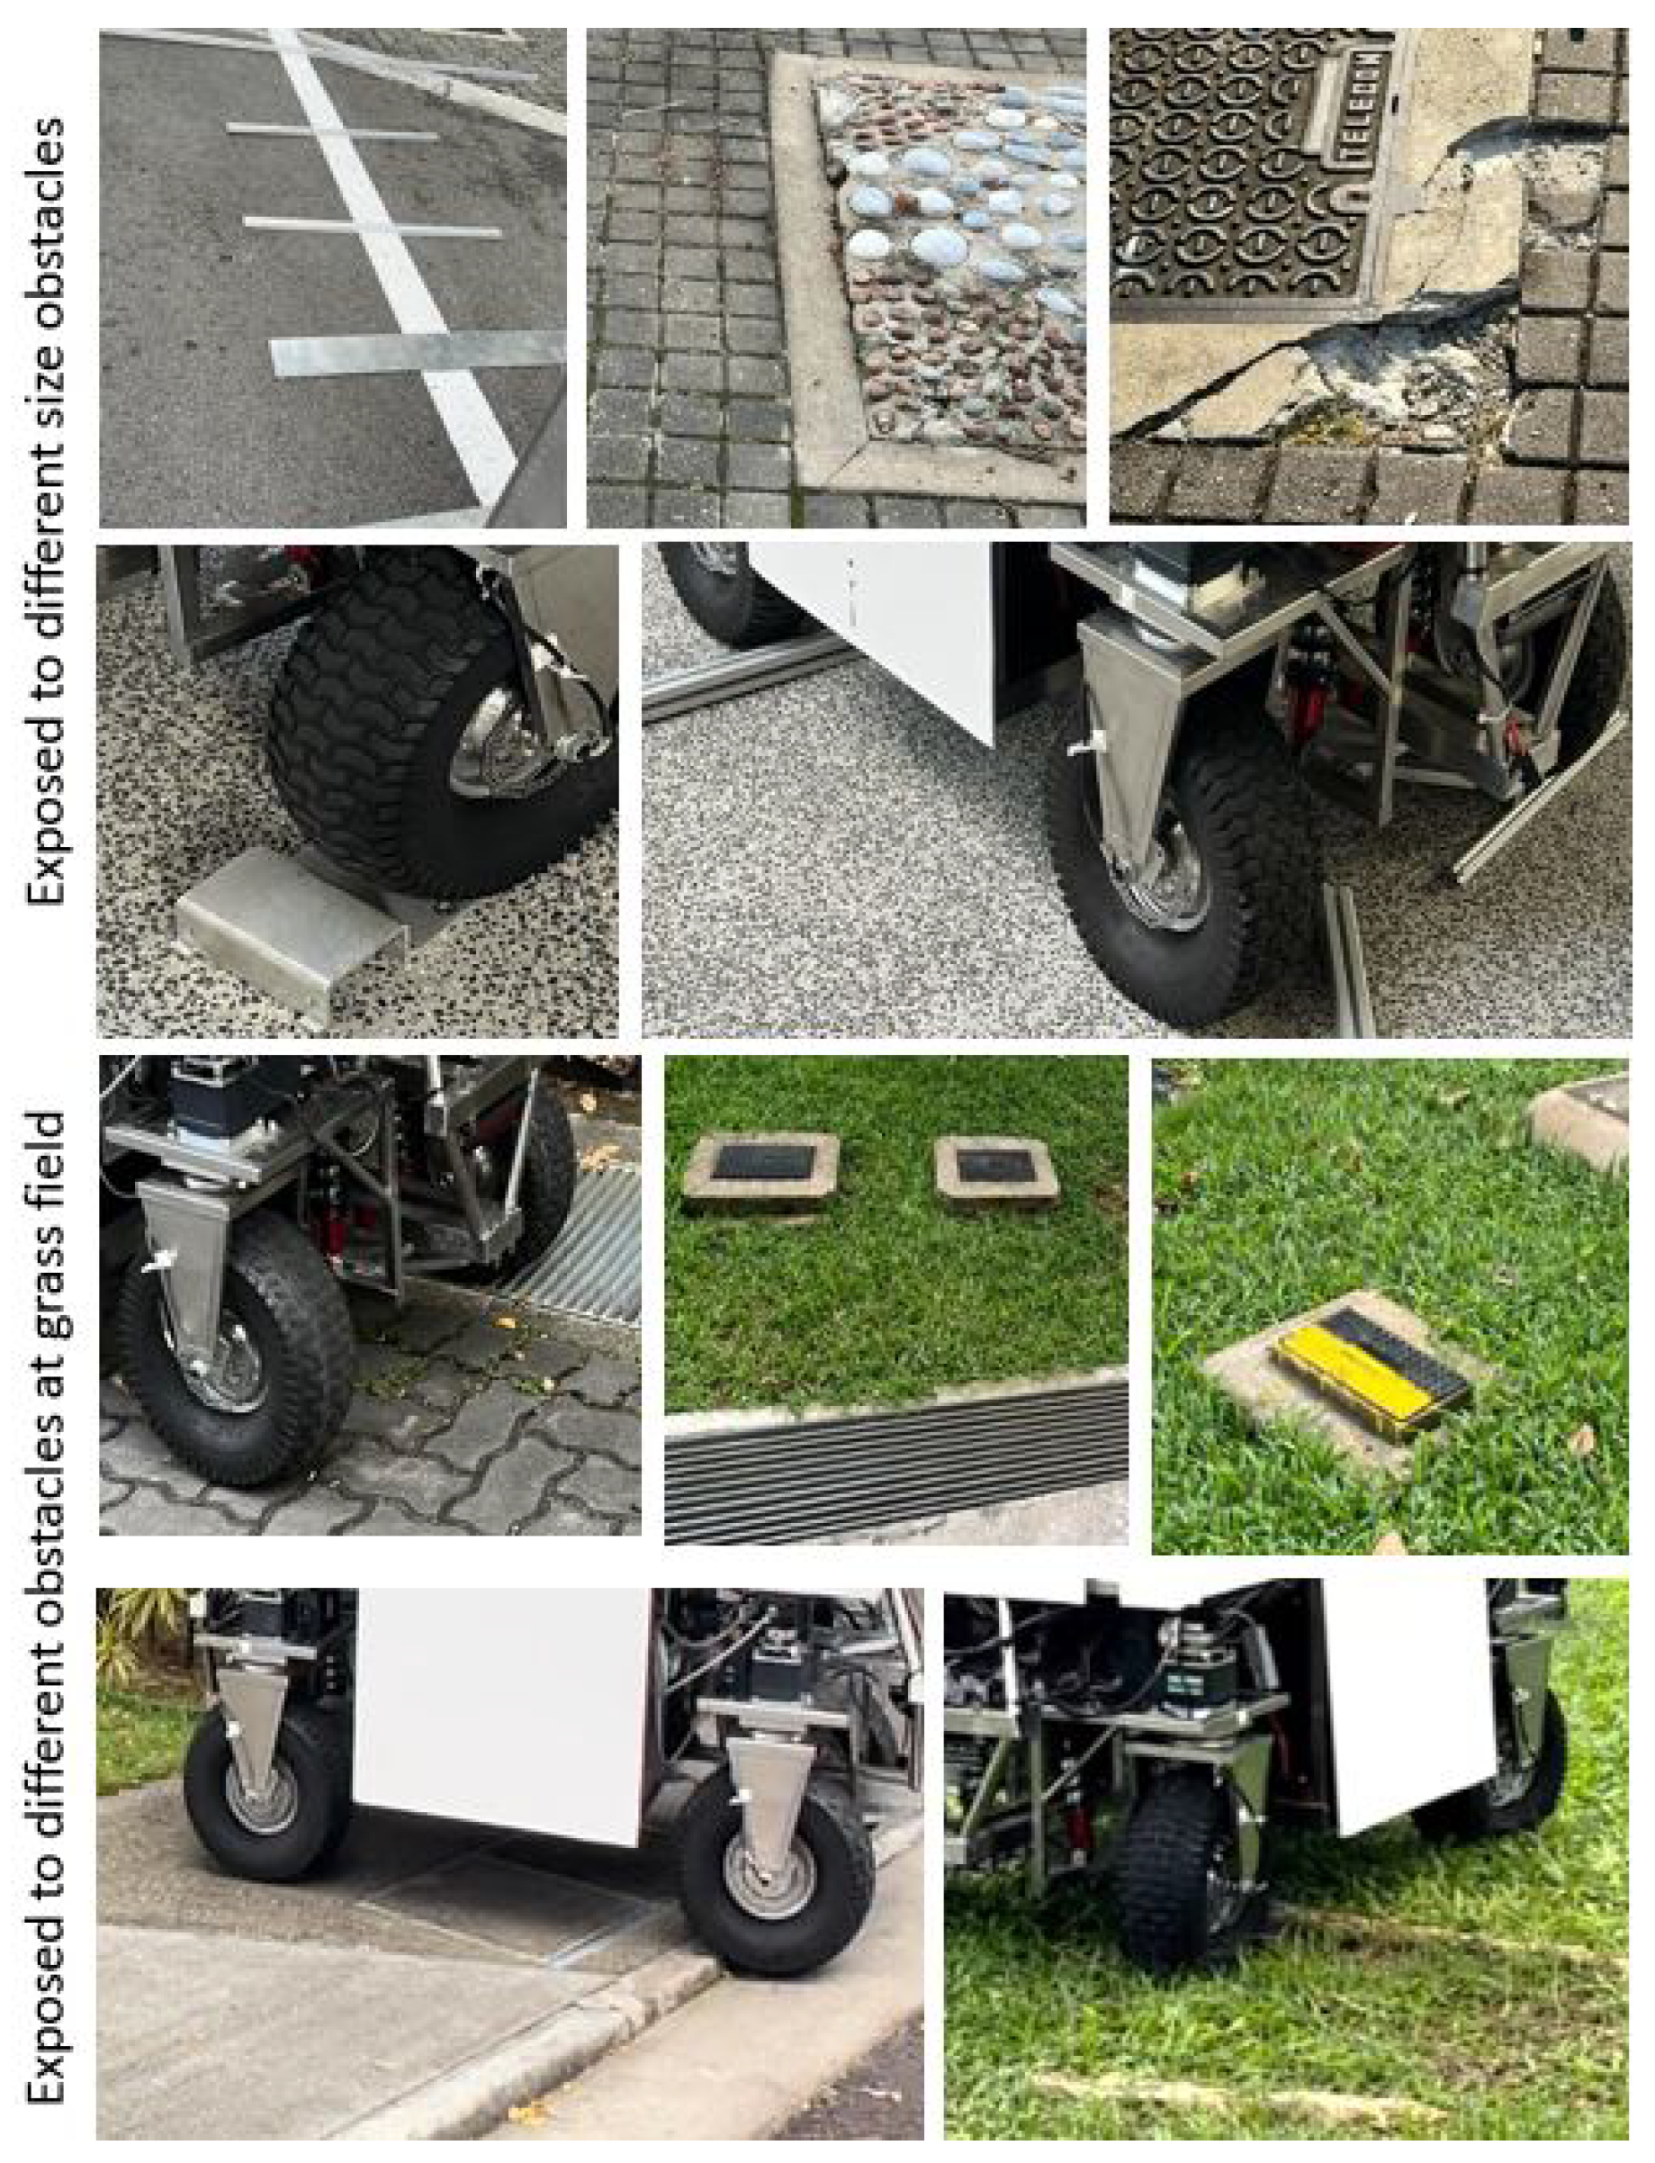
An outdoor wheeled mobile robot is generally designed in a ruggedized manner, anticipating uneven terrain, compared with an indoor mobile robot. However, the chances of system degradation or risk of hazardous operations are still high because of the unexpected and uncontrolled changes in terrain features, as explained in the problem statement section, especially while deploying the robot in autonomous mode. A wheeled mobile robot produces aberrant vibration as an early failure symptom, and its amplitude level depends on the system deterioration severity or the extremity of the terrain defects or undetected features. Hence, a vibration-level-based assessment or threshold level classification is a prerequisite to executing an automated CM system. Based on the robot design and application use cases furnished, the vibration threshold levels are broadly classified as safe, moderately safe, and unsafe. Further, the moderately safe and unsafe classes are classified based on the causes of vibration, either system-degradation-generated or terrain-induced. Hence, a total of five vibration-threshold-level classes are identified in this study for outdoor mobile robots, as illustrated in
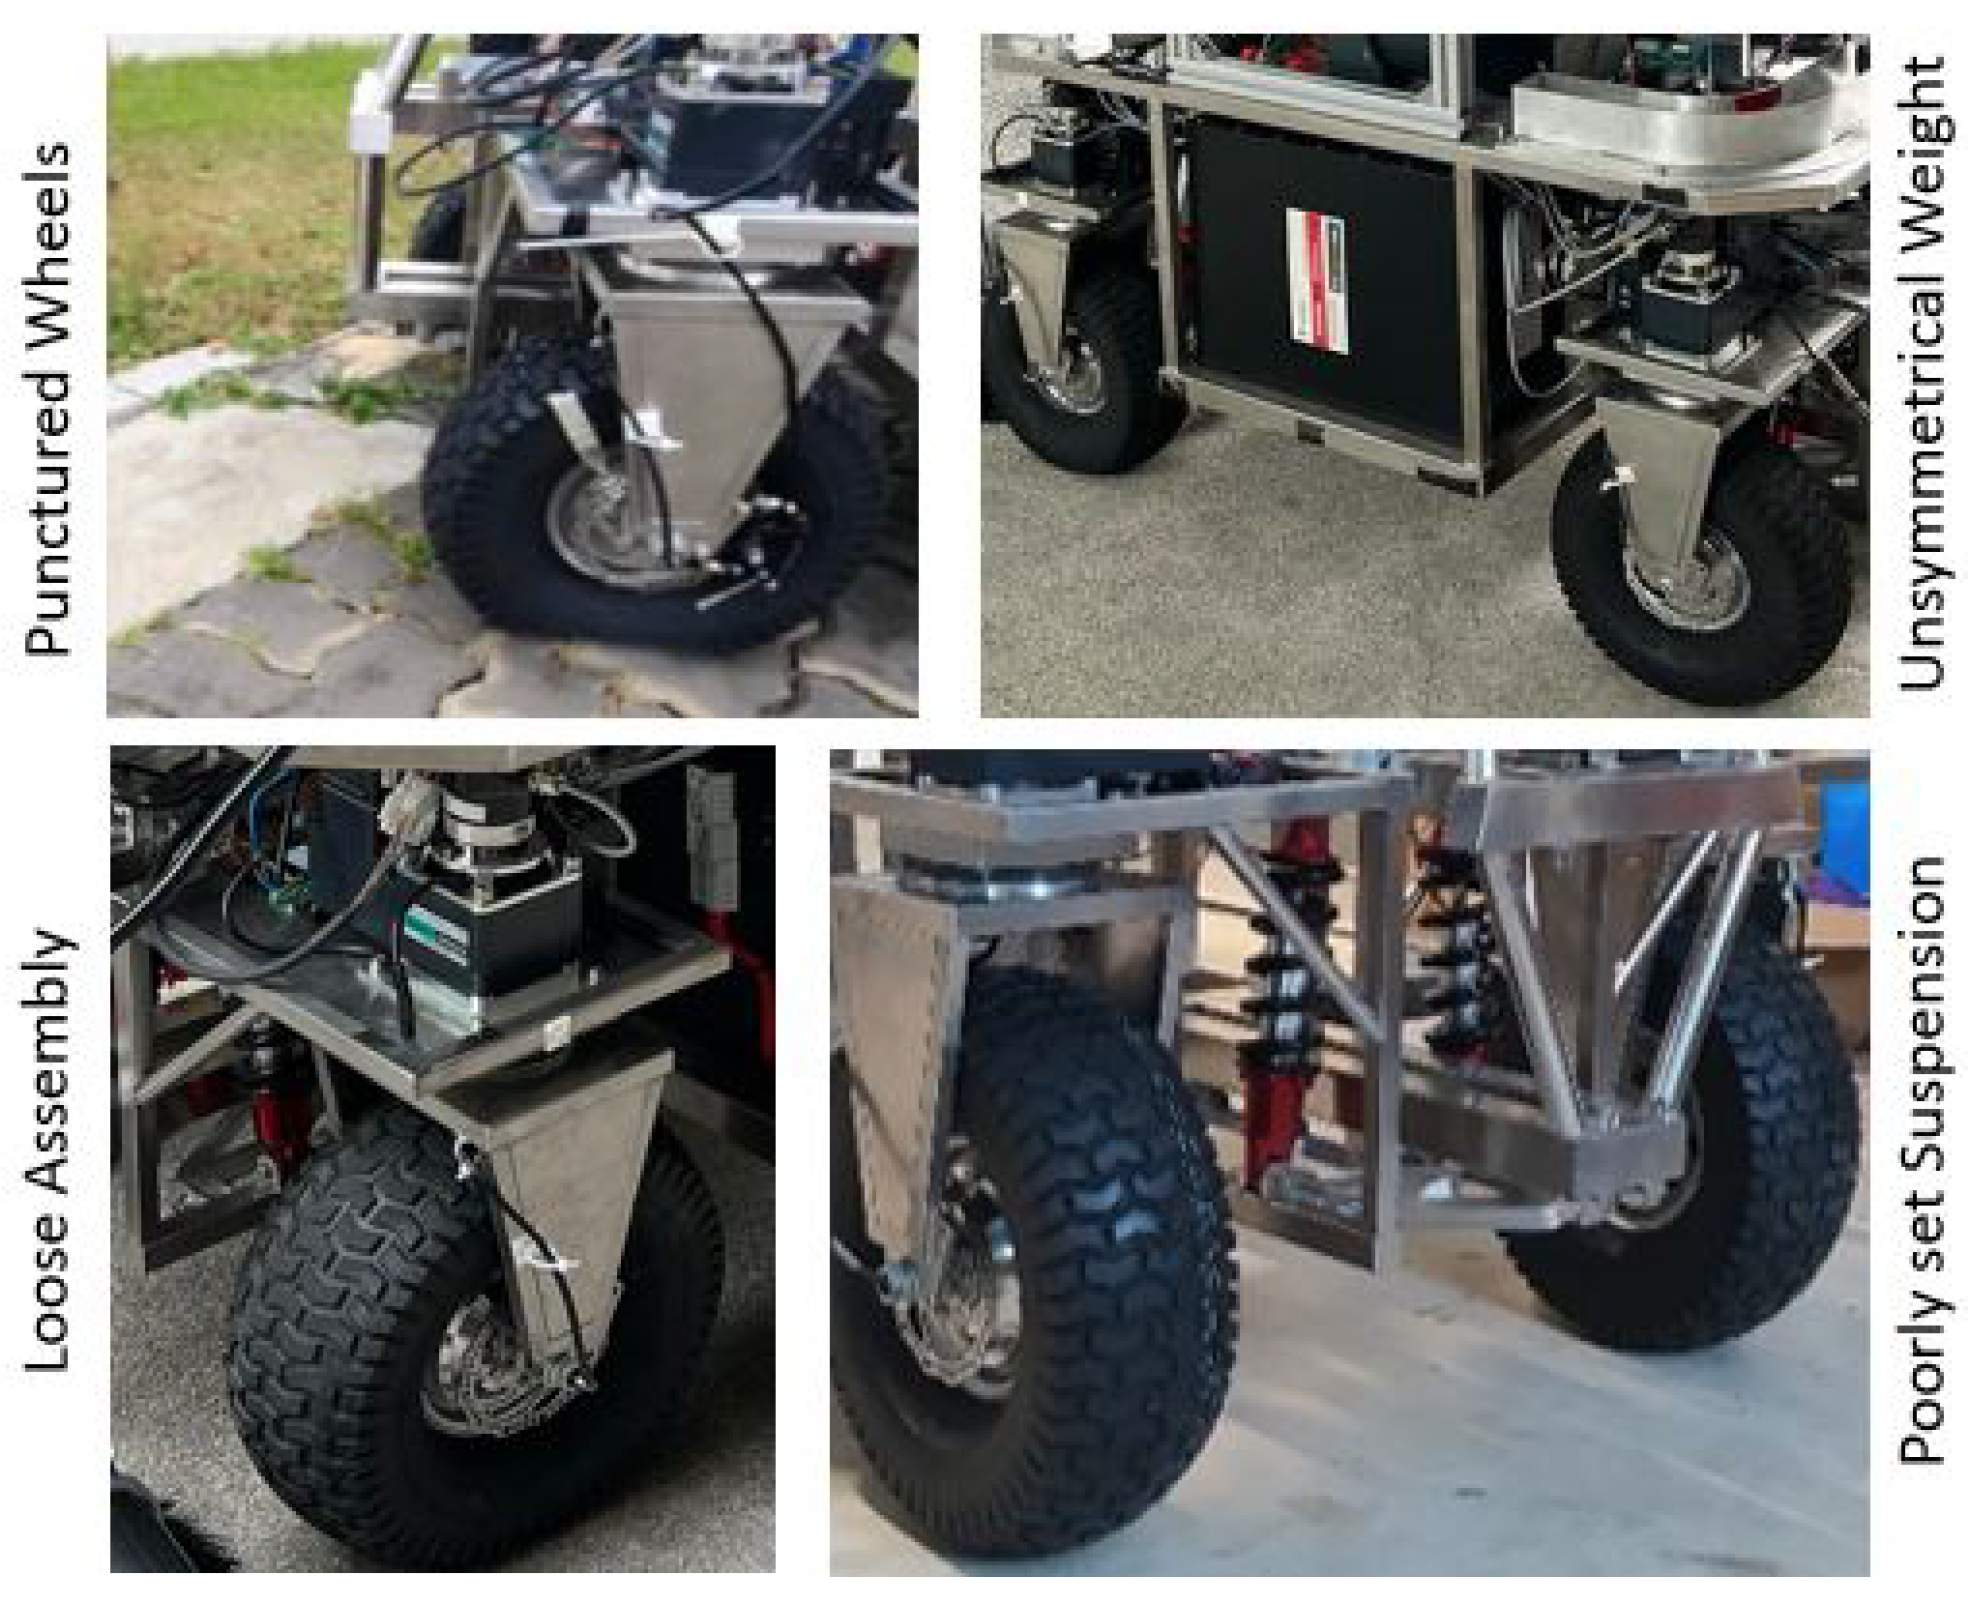
Figure 3. Here, the safe class is the acceptable vibration level, considering the robot is healthy and deployed at a smooth/plain terrain workspace. Moderately safe (M) is an acceptable class, but it is monitored as the condition may worsen faster. The unsafe (U) class advises not to continue the operations long term due to high chances of total system failure and operational hazards. The moderately safe vibration generated by the system (M-S) represents system deterioration, such as wheels wobbling, worn out or punctured wheels, etc., including unbalanced loading, and here, the exposed terrain is considered even and well-maintained. The moderately safe vibration due to poor terrain (M-T) class is due to uneven and undetected terrain features, which cause accelerated system degradation. Similarly, the unsafe system-generated (U-S) and unsafe terrain-induced (U-T) classes comparatively represent severe vibrations due to these distinguished causes.
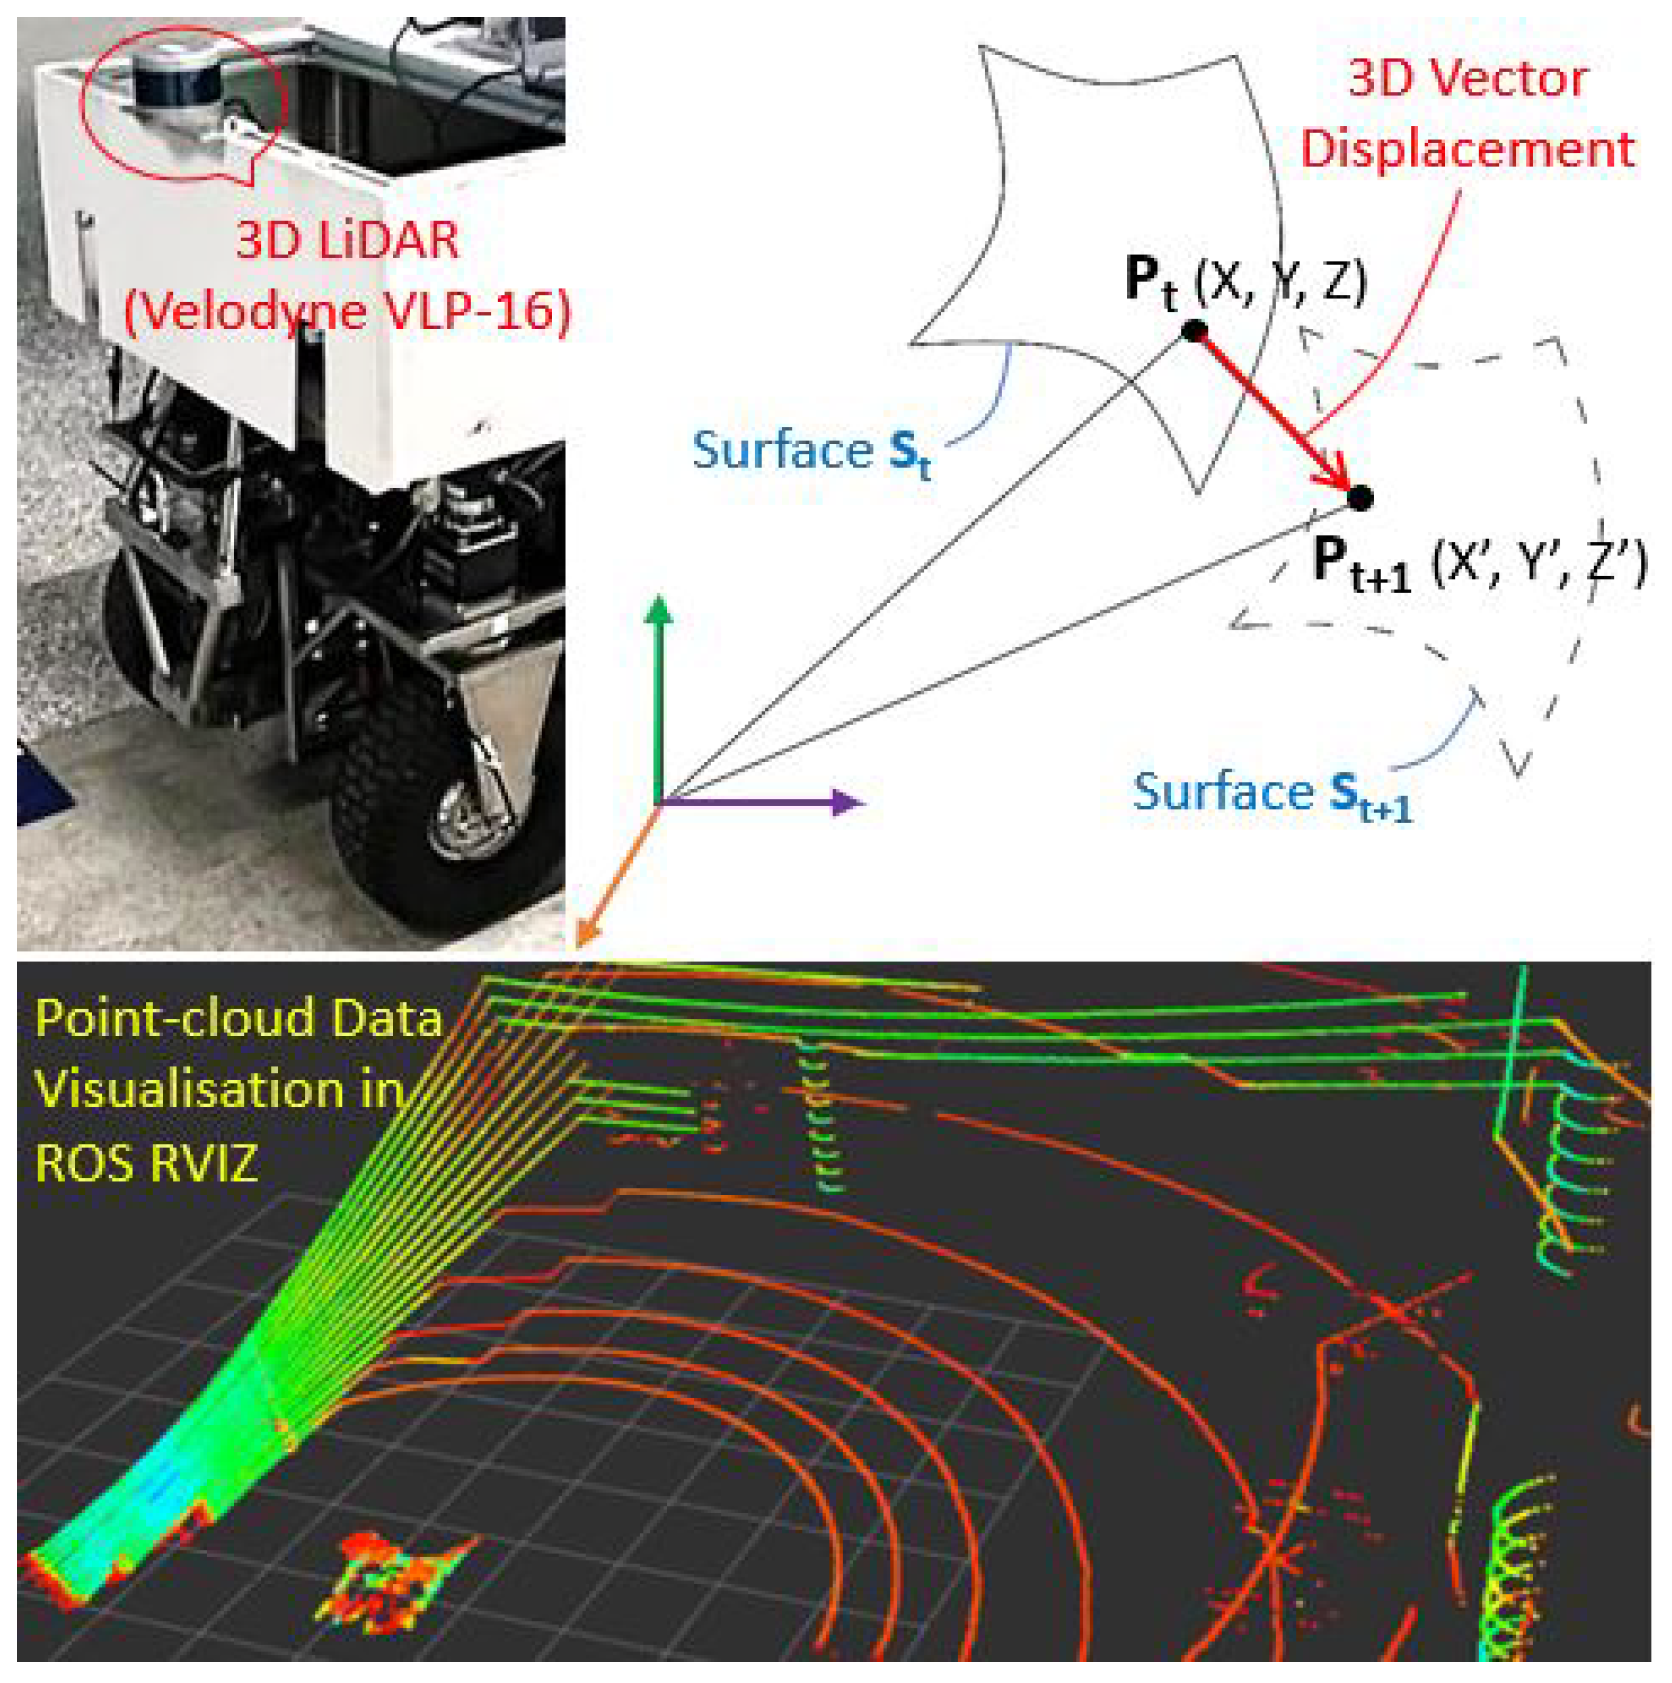
3.3. Point-Cloud-Based Vibration-Indicated Data Modeling
A mobile robot vibrates or jerks moderately or severely in angular and linear ways, caused by system deterioration or undesired terrain features. As 3D LiDAR is a prevalent sensor for outdoor autonomous mobile robots, we exploited the behavior of 3D LiDAR point cloud data across the five vibration threshold classes to develop a methodology to model the vibration-affected point cloud data as vibration indication data for CM applications in outdoor mobile robots. The onboard 3D LiDAR Velodyne VLP-16 sensor is set at a subscription rate of 10 Hz, and the change in the three-dimensional motion field of points in a point cloud due to vibration classes is analysed and tracked through consecutive frames, similar to scene flow techniques. The 3D LiDAR sensor set-up and the three-dimensional vector displacement of the motion point in point cloud space between two consecutive frames are illustrated in
Figure 4, including visualization of a point cloud frame captured through ROS graphical interface RVIZ. The 3D LiDAR sensor Velodyne VLP-16 was firmly mounted directly to the metal chassis at the front side of the robot on the top–middle area, and other payload mounting configurations were considered as well.
The change in motion point displacement on three axes due to various vibration threshold levels of the robot is modeled as 3D vector displacement data, as represented in Equation (
1), which is used as the vibration-indicated data (
Vibdata). As illustrated in
Figure 4, the motion point
P is represented as (
X,
Y,
Z) in 3D space at time
t, and (
,
Y,
) is the displaced point in the consecutive frame at time (
t+1).
The Velodyne VLP-16 generates 3D images of the environment in 360
through 16 channels with a vertical field of view +15
to −15
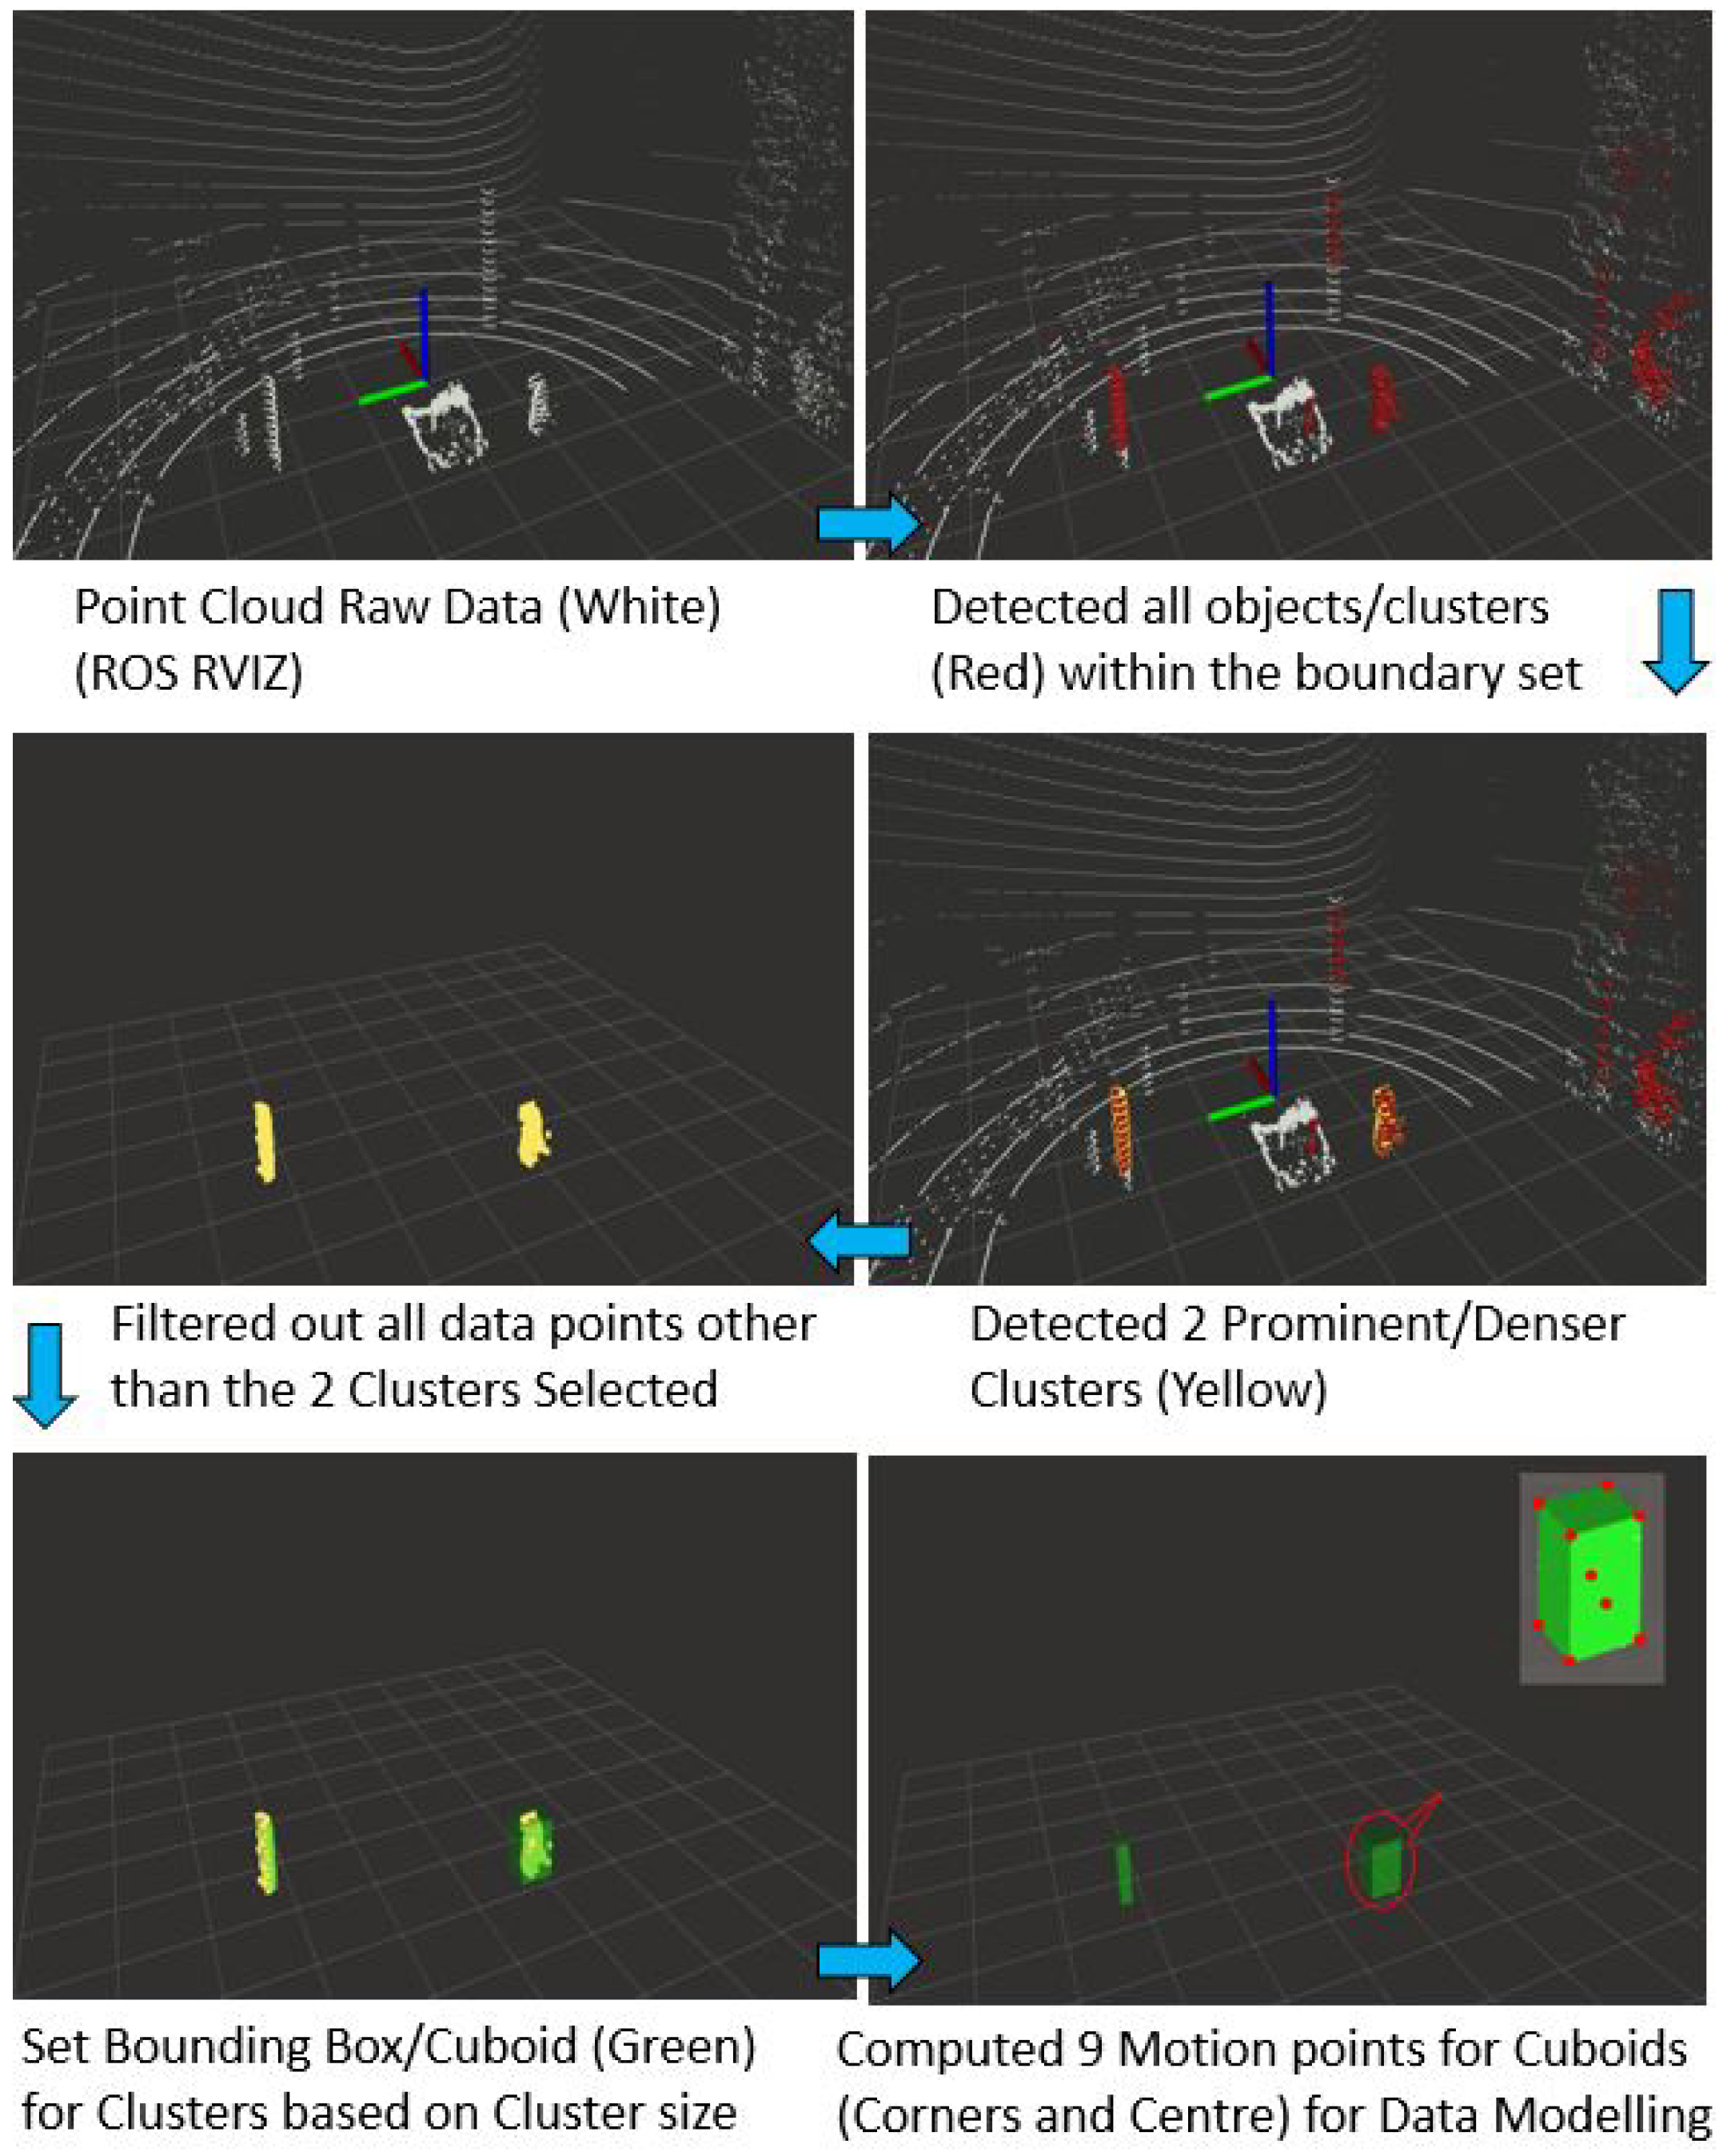
by acquiring around 300,000 points per second. It is not computationally recommended to consider every point for modeling as vibration-indicated data for real-time deployment. The point cloud for any prominent objects in the environment will generally be denser than its background or small objects. Hence, we developed a fast and computationally low-cost method by creating a vibration-indicated data modeling algorithm without losing the vibration characteristics. Firstly, the algorithm set a boundary around the 3D LiDAR position, starting from 1.5 m and limited to 10 m for every scene and detected all object clusters within this range/boundary. Then, the two most prominent clusters were selected, and all other points adding a filter layer were removed. A bounding box (cuboid) is set for each cluster based on size. The bounding box motion corresponds to the cluster motion, which is directly related to the linear and angular motion of the robot due to changes in vibration threshold levels. Next, a point is computed at each corner and the centroid of the cuboid as motion points and the three-dimensional vector displacement of these points is tracked through every consecutive frame. As the motion of these points in 3D space corresponds to the vibration-affected robot’s motion, finally, the vector displacement elements of these nine points on the three axes from each cluster are extracted and modeled as vibration-indication data, as represented in Equation (1). The vibration-indicated data are extracted as [
n × 3], where
n is the number of motion points, and 3 is for the vector displacement data on three axes.
Figure 5 depicts the steps to extract the vibration-indicated data from the point cloud, assuring low computation cost and representing vibration threshold classes.
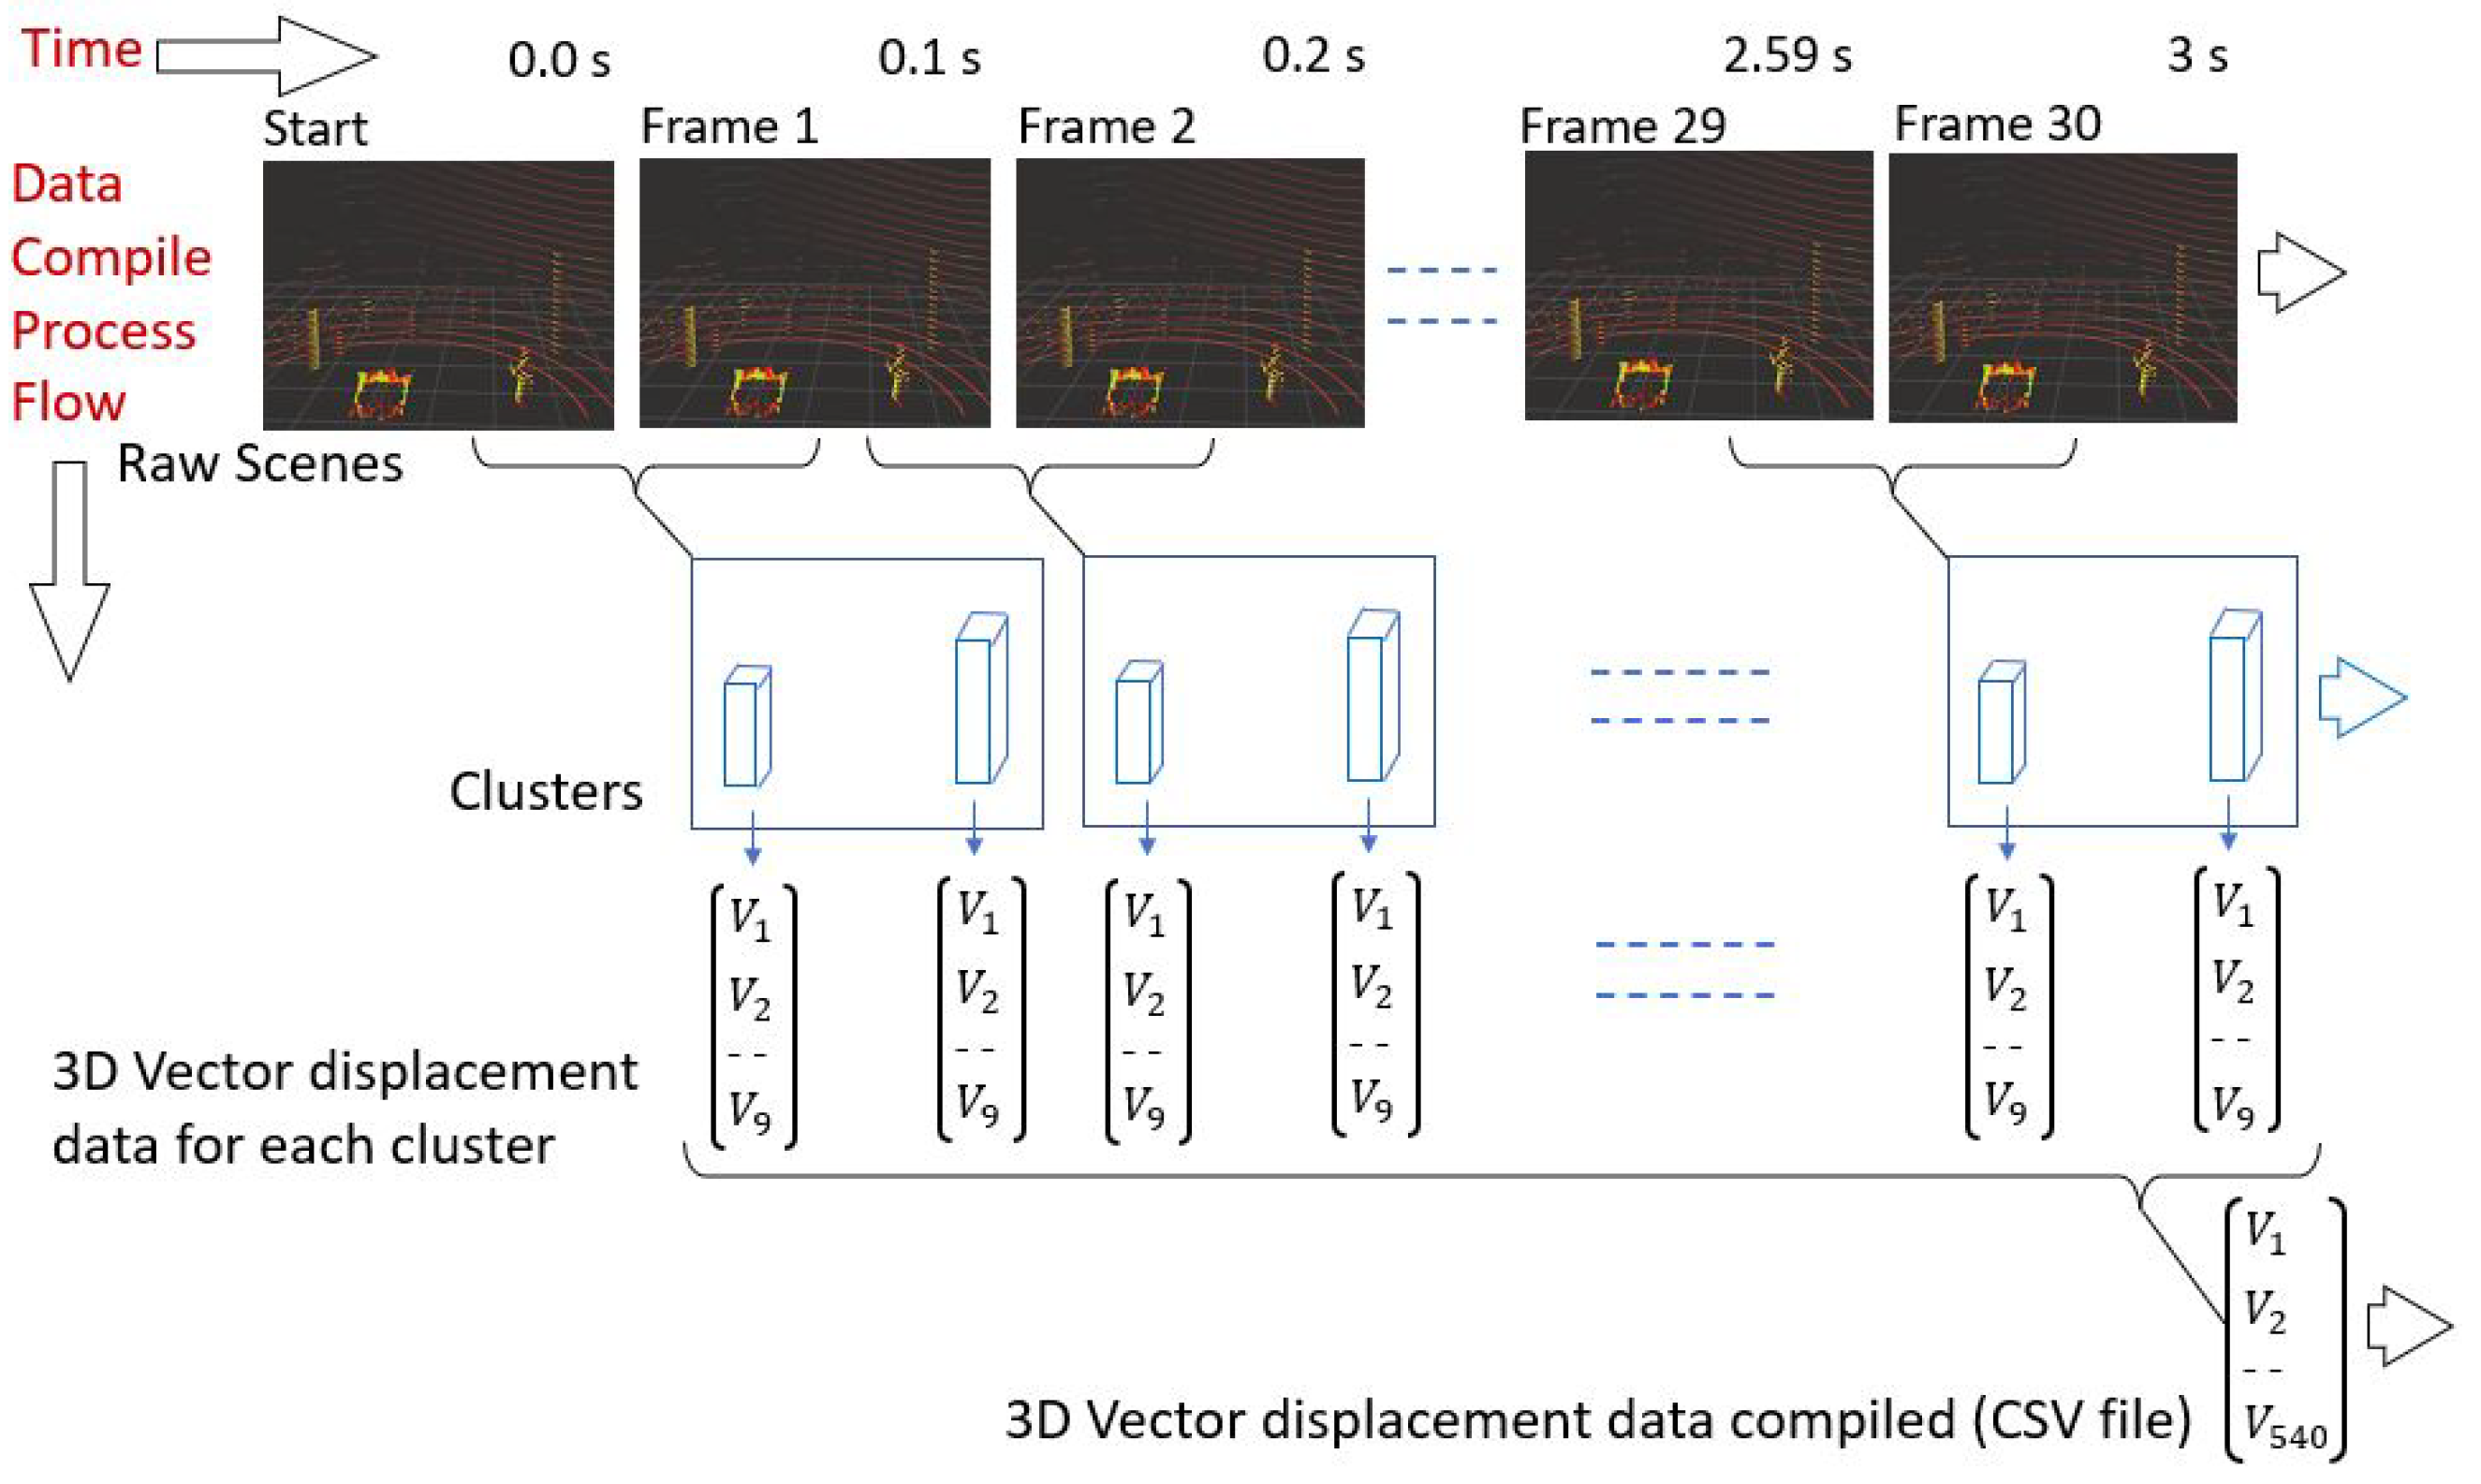
Further, the algorithm compiles the vibration-indicated data as follows. The 3D LiDAR data are subscribed at 10 Hz, i.e., every 0.1 s a new frame is generated. A total of 18 displacement points (9 points × 2 clusters) are formed from every two consecutive frames, each representing three axes elements. The sequential data collected from 30 frames, i.e., over 3 s, are treated as one sample of data for training and during real-time prediction, which is [540 × 3] and saved as a CSV file, as illustrated in
Figure 6. The CSV files for each vibration threshold class are labeled for preparing the training dataset.
3.4. One-Dimensional CNN Modeling for Threshold Level Classification
A good understanding of Deep Learning and convolutional operation is essential to adopt a suitable classification model based on the input data. It is also essential to develop the structure, mainly the convolutional layers, for fast, higher-accuracy, and real-time application. Convolutional Neural Networks can be used based on process data such as 1D signal, 2D image, and 3D video [
35,
36,
37,
38,
39]. In the proposed study, a 1D Convolutional Neural Network (1D CNN) model is adopted to classify the vibration threshold levels and for real-time prediction due to its simple structure and low computation cost, as well as from considering previous CM work [
18,
19] results compared with other AI models. A four-layer 1D CNN model is structured, and it works based on the convolution operations on data vectors, as mentioned in Equations (
2) and (
3) [
40]. Here, an input vector to output layer
c of length (
N −
L + 1) is convolved with a filter vector by applying a nonlinear activation function, where,
x = input data vector of length
N,
= filter vector of length
L, and
b = bias to best fit for given data. After the convolution layers, the max pooling output vector is used to distinguish the key characteristics and decrease the number of parameters. Here,
= kernel size,
u = window function, and
s = filter moving stride over the input vector
c.
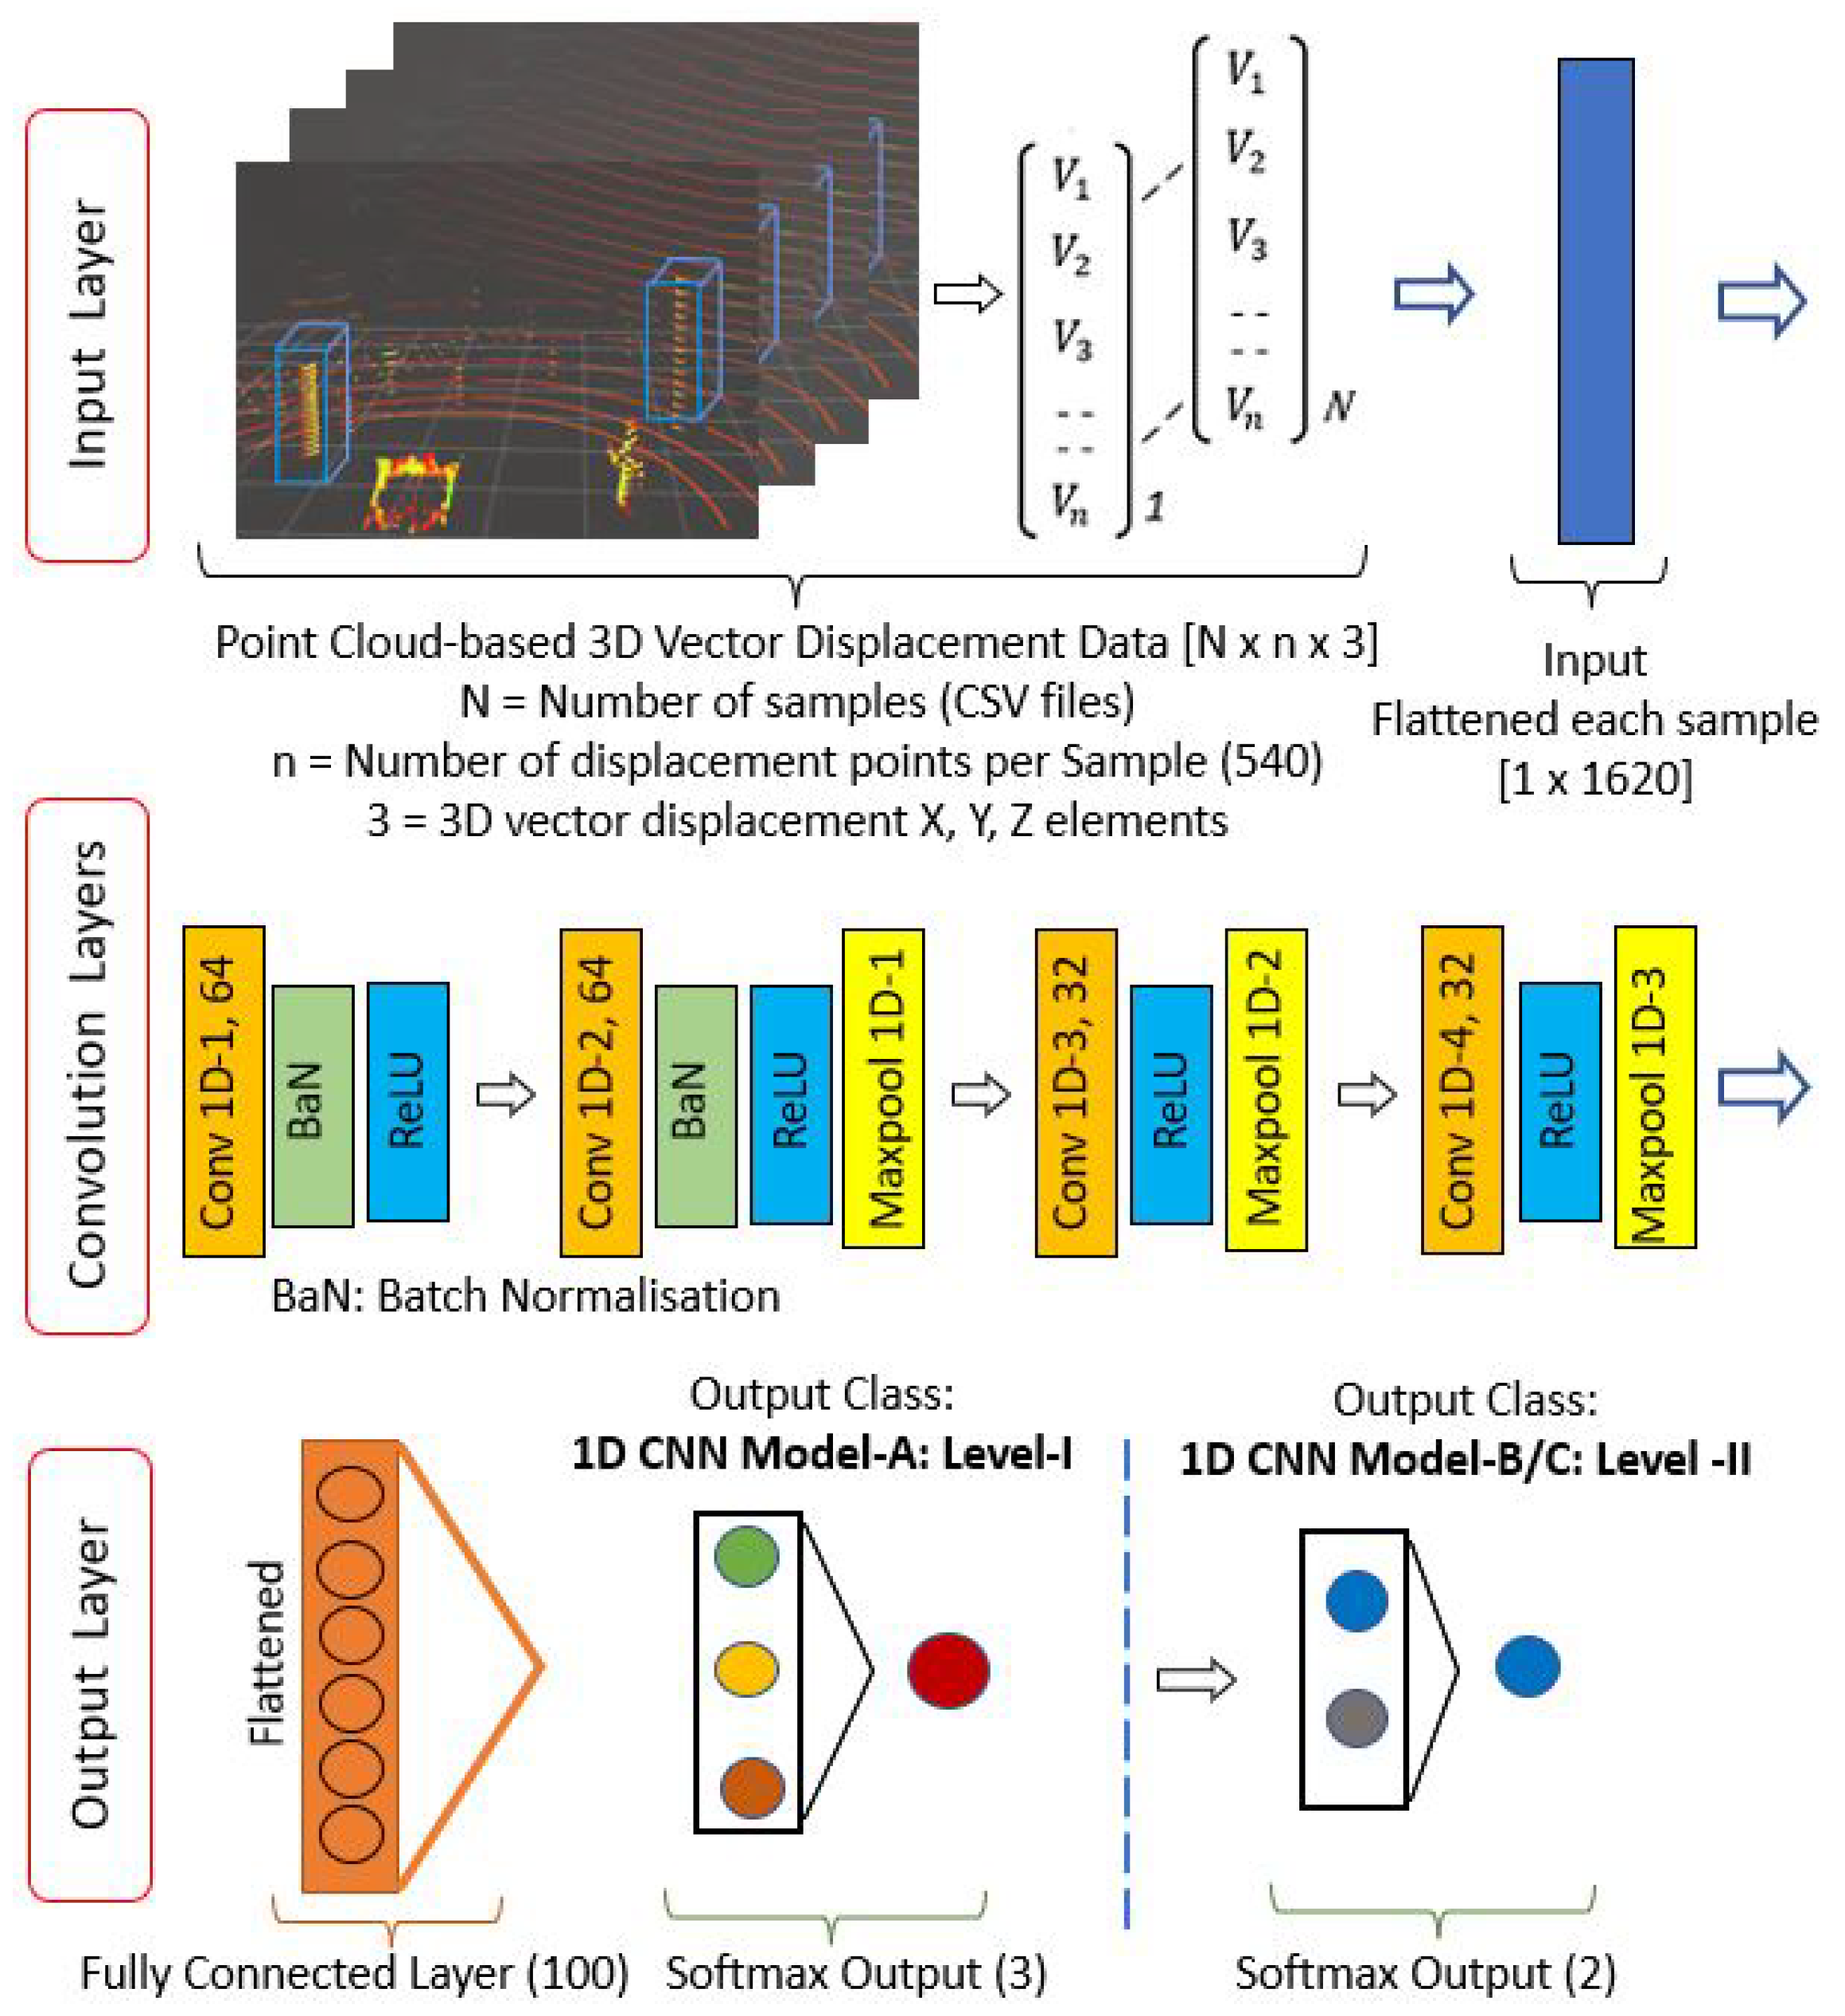
As explained in the data modeling section, the temporal-vibration-affected compiled data for every 30 frames form an array of [N × 540 × 3], where N = the total number of samples. This data structure is flattened into [1 × 1620] for each sample and fed into the 1D convolution layer as input data. A suitable standardization, filter size, activation function, and other measures are applied for fast and accurate classification. A batch normalization layer is used for the first two convolution layers for independent and higher learning rates, tested with different filter configurations and finalized as 64 for the first two layers and 32 for the rest for effective feature detection. A kernel (convolution window) size of 3 is opted for, moving in one direction over the input data, reducing the complexity of the model. We noticed a Rectified Linear Activation Unit (ReLU) helps to learn the nonlinear pattern of these input data; hence, we applied it for each convolutional layer. A dropout layer at a rate of 0.2 is added to prevent any overfitting of the training data. From the second convolutional layer onward, a max pooling layer of stride size two is applied, which helps lower computation time. Next, in the output layer, a fully connected layer is generated where the pooled feature is flattened, creating a 1D array. Finally, a Softmax function is applied as the final activation function in the output layer to predict the probability of vibration threshold classes.
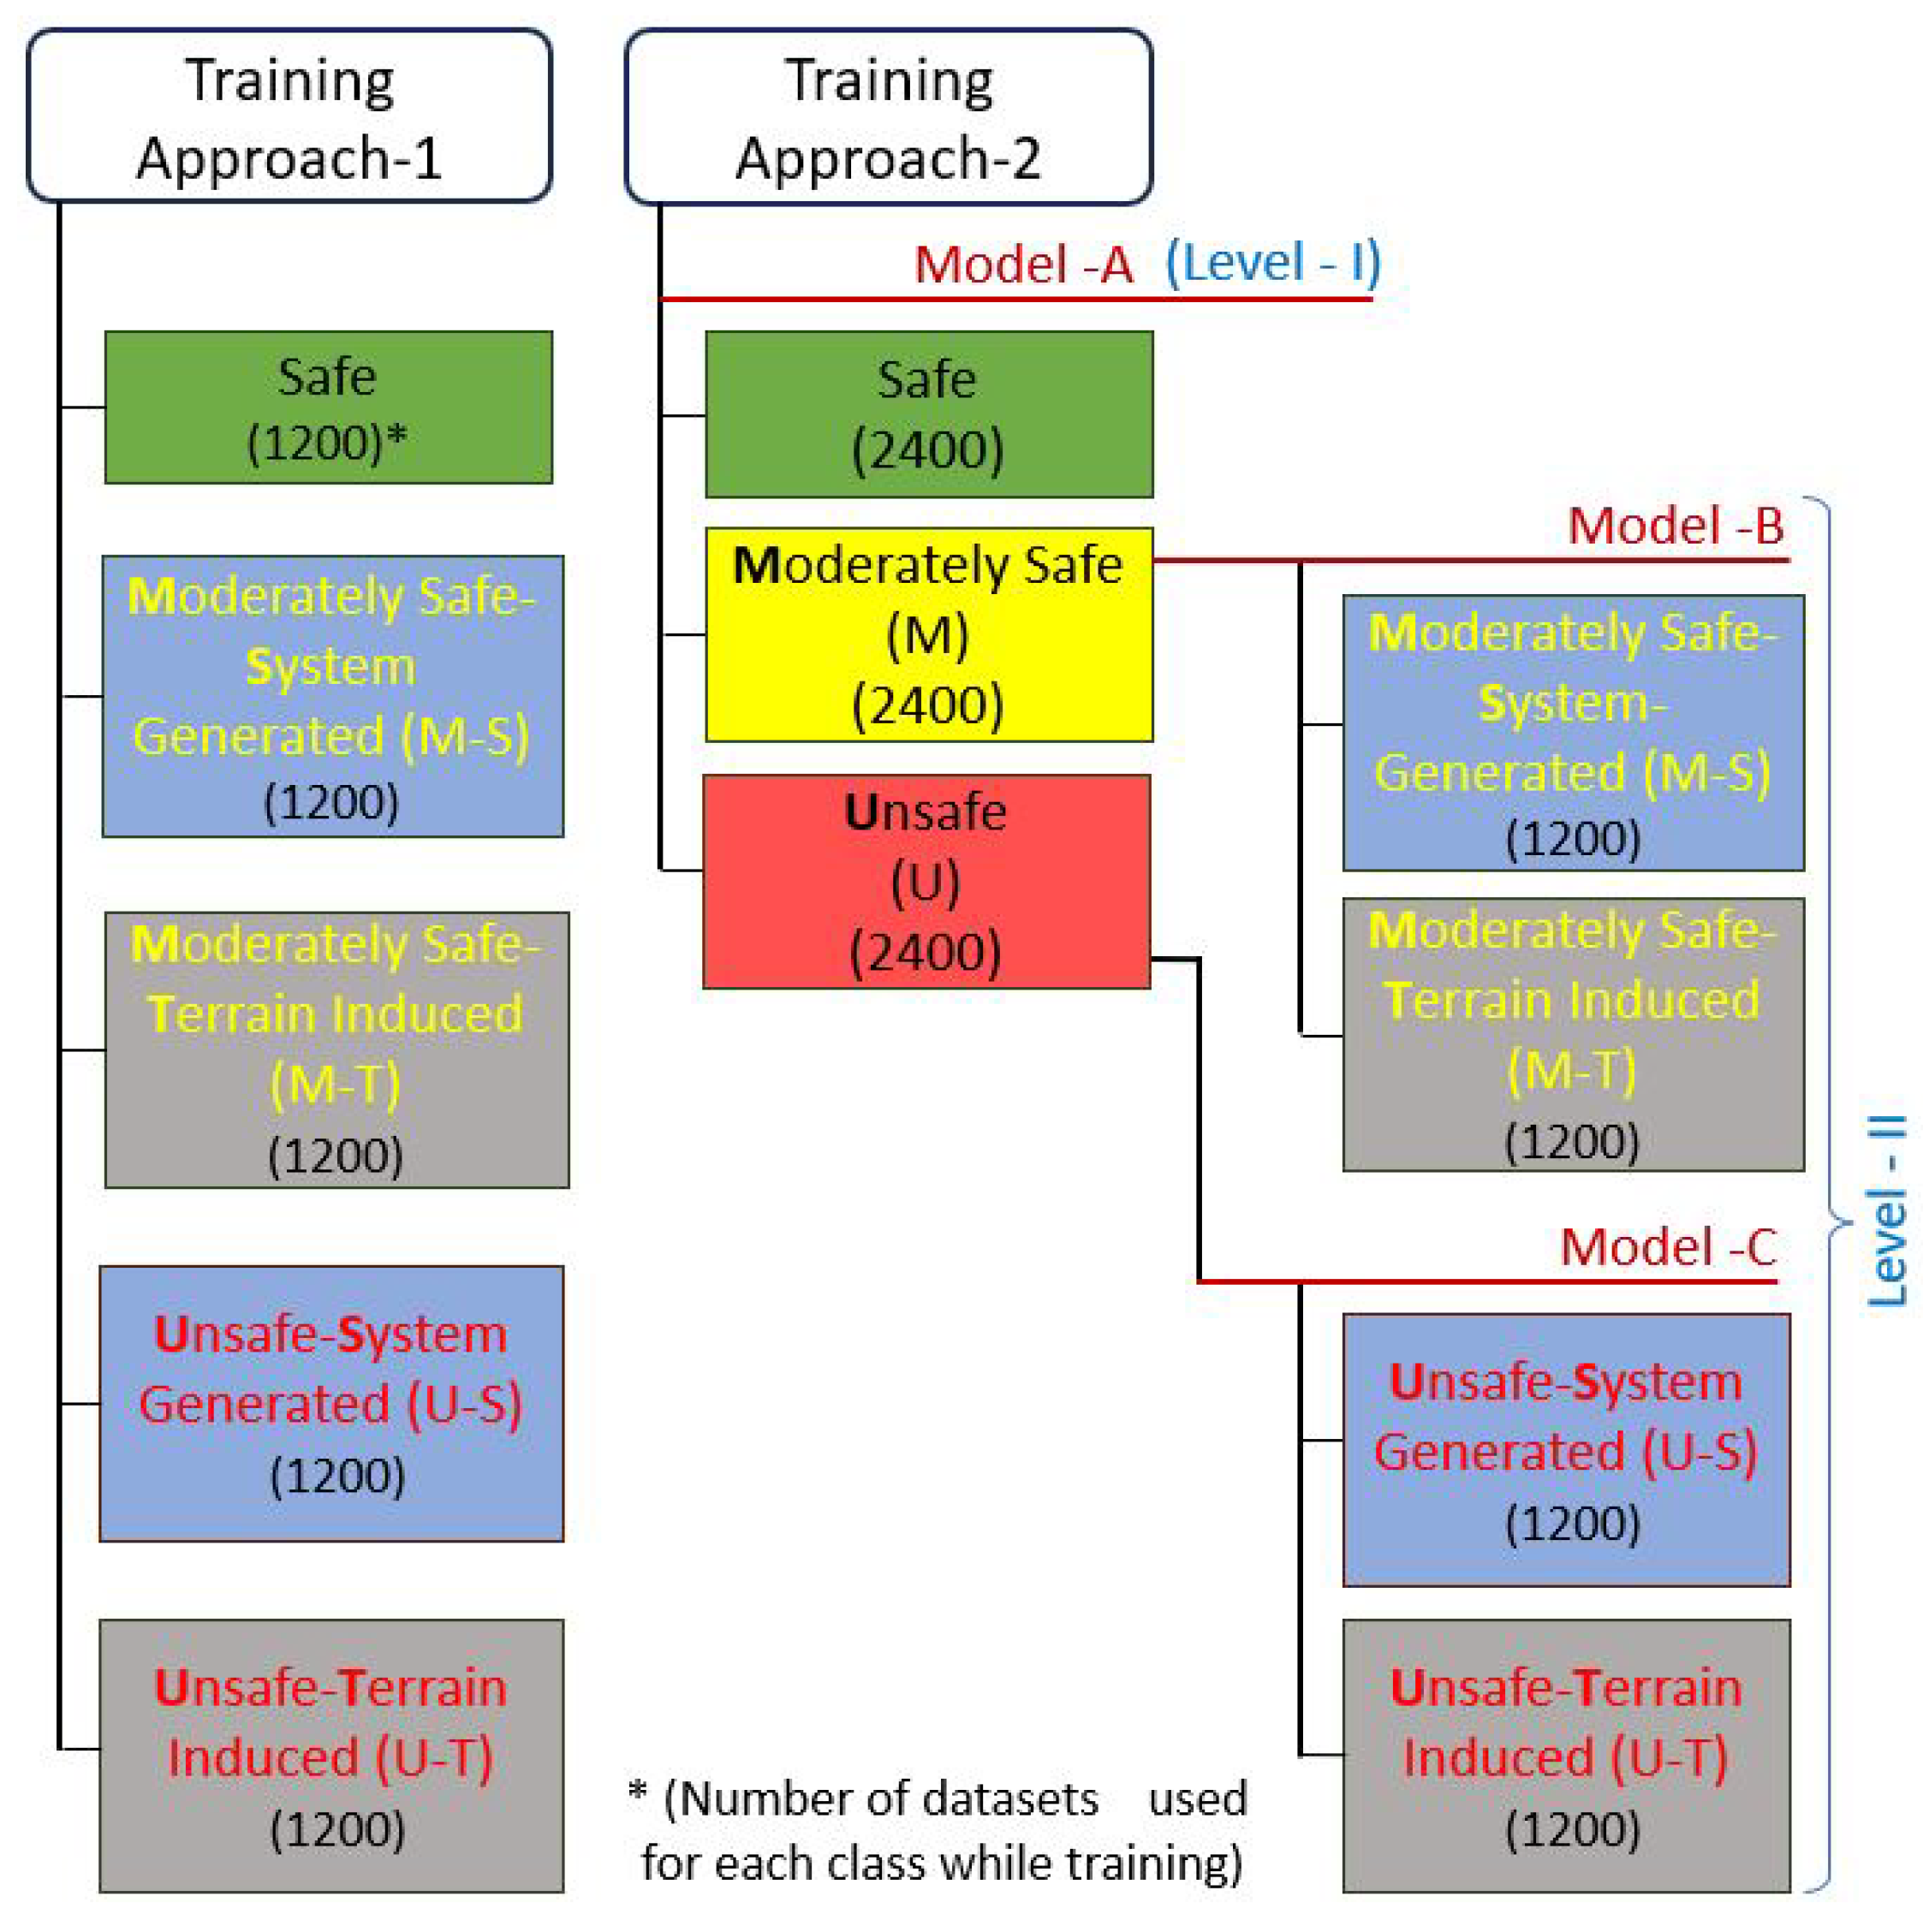
For better prediction accuracy, the training is conducted on two levels. Level I classifies the three higher classes—safe, moderately safe (M), and unsafe (U), saved as Model-A. Level II training is to find the cause of the undesired vibration, i.e., whether it is system-generated (S) or terrain-induced (T). Hence, for level II training, two models are developed; Model-B is trained to find the causes of the moderately safe class vibration, i.e., moderately safe due to system-generated/deteriorated vibration (M-S) or moderately safe due to terrain-induced vibration (M-T), and Model-C is for finding the causes of the unsafe class vibration, predicting U-S or U-T. Hence, based on the Model-A-predicted class (other than for the safe class), the algorithm will call either Model-B or C. More details of this two-level training approach are furnished in
Section 4.2. The proposed 1D-CNN-based model structure to fit with the given point-cloud-based vector displacement data is illustrated in
Figure 7.
3.5. Three-Dimensional CbM Map for Condition Monitoring
A vibration threshold mapping framework is developed to generate a 3D CbM map to visually track the robot’s health states and terrain-related workspace issues in real time. It is carried out in two stages; firstly, a 3D occupancy grid map is generated for the robot’s workspace using a 3D LiDAR sensor and a Simultaneous Localization and Mapping (SLAM) system [
41] based on the HDL-graph-SLAM algorithm [
42,
43]. Then, a vibration threshold class mapping algorithm is developed which fuses the threshold classes that need either attention or immediate actions, i.e., classes other than safe, on the 3D occupancy grid map. The mapping algorithm tracks the robot’s position based on the robot’s localization data, receives the predicted class, and fuses instantly at the geometrical coordinates of the robot’s footprint, with a square dot of unique color for each class, including a timestamp. The 3D CbM map maintains a top-down view, and the undesired classes are color-coded: orange, green, blue, and red for M-S, M-T, U-S, and U-T, respectively.
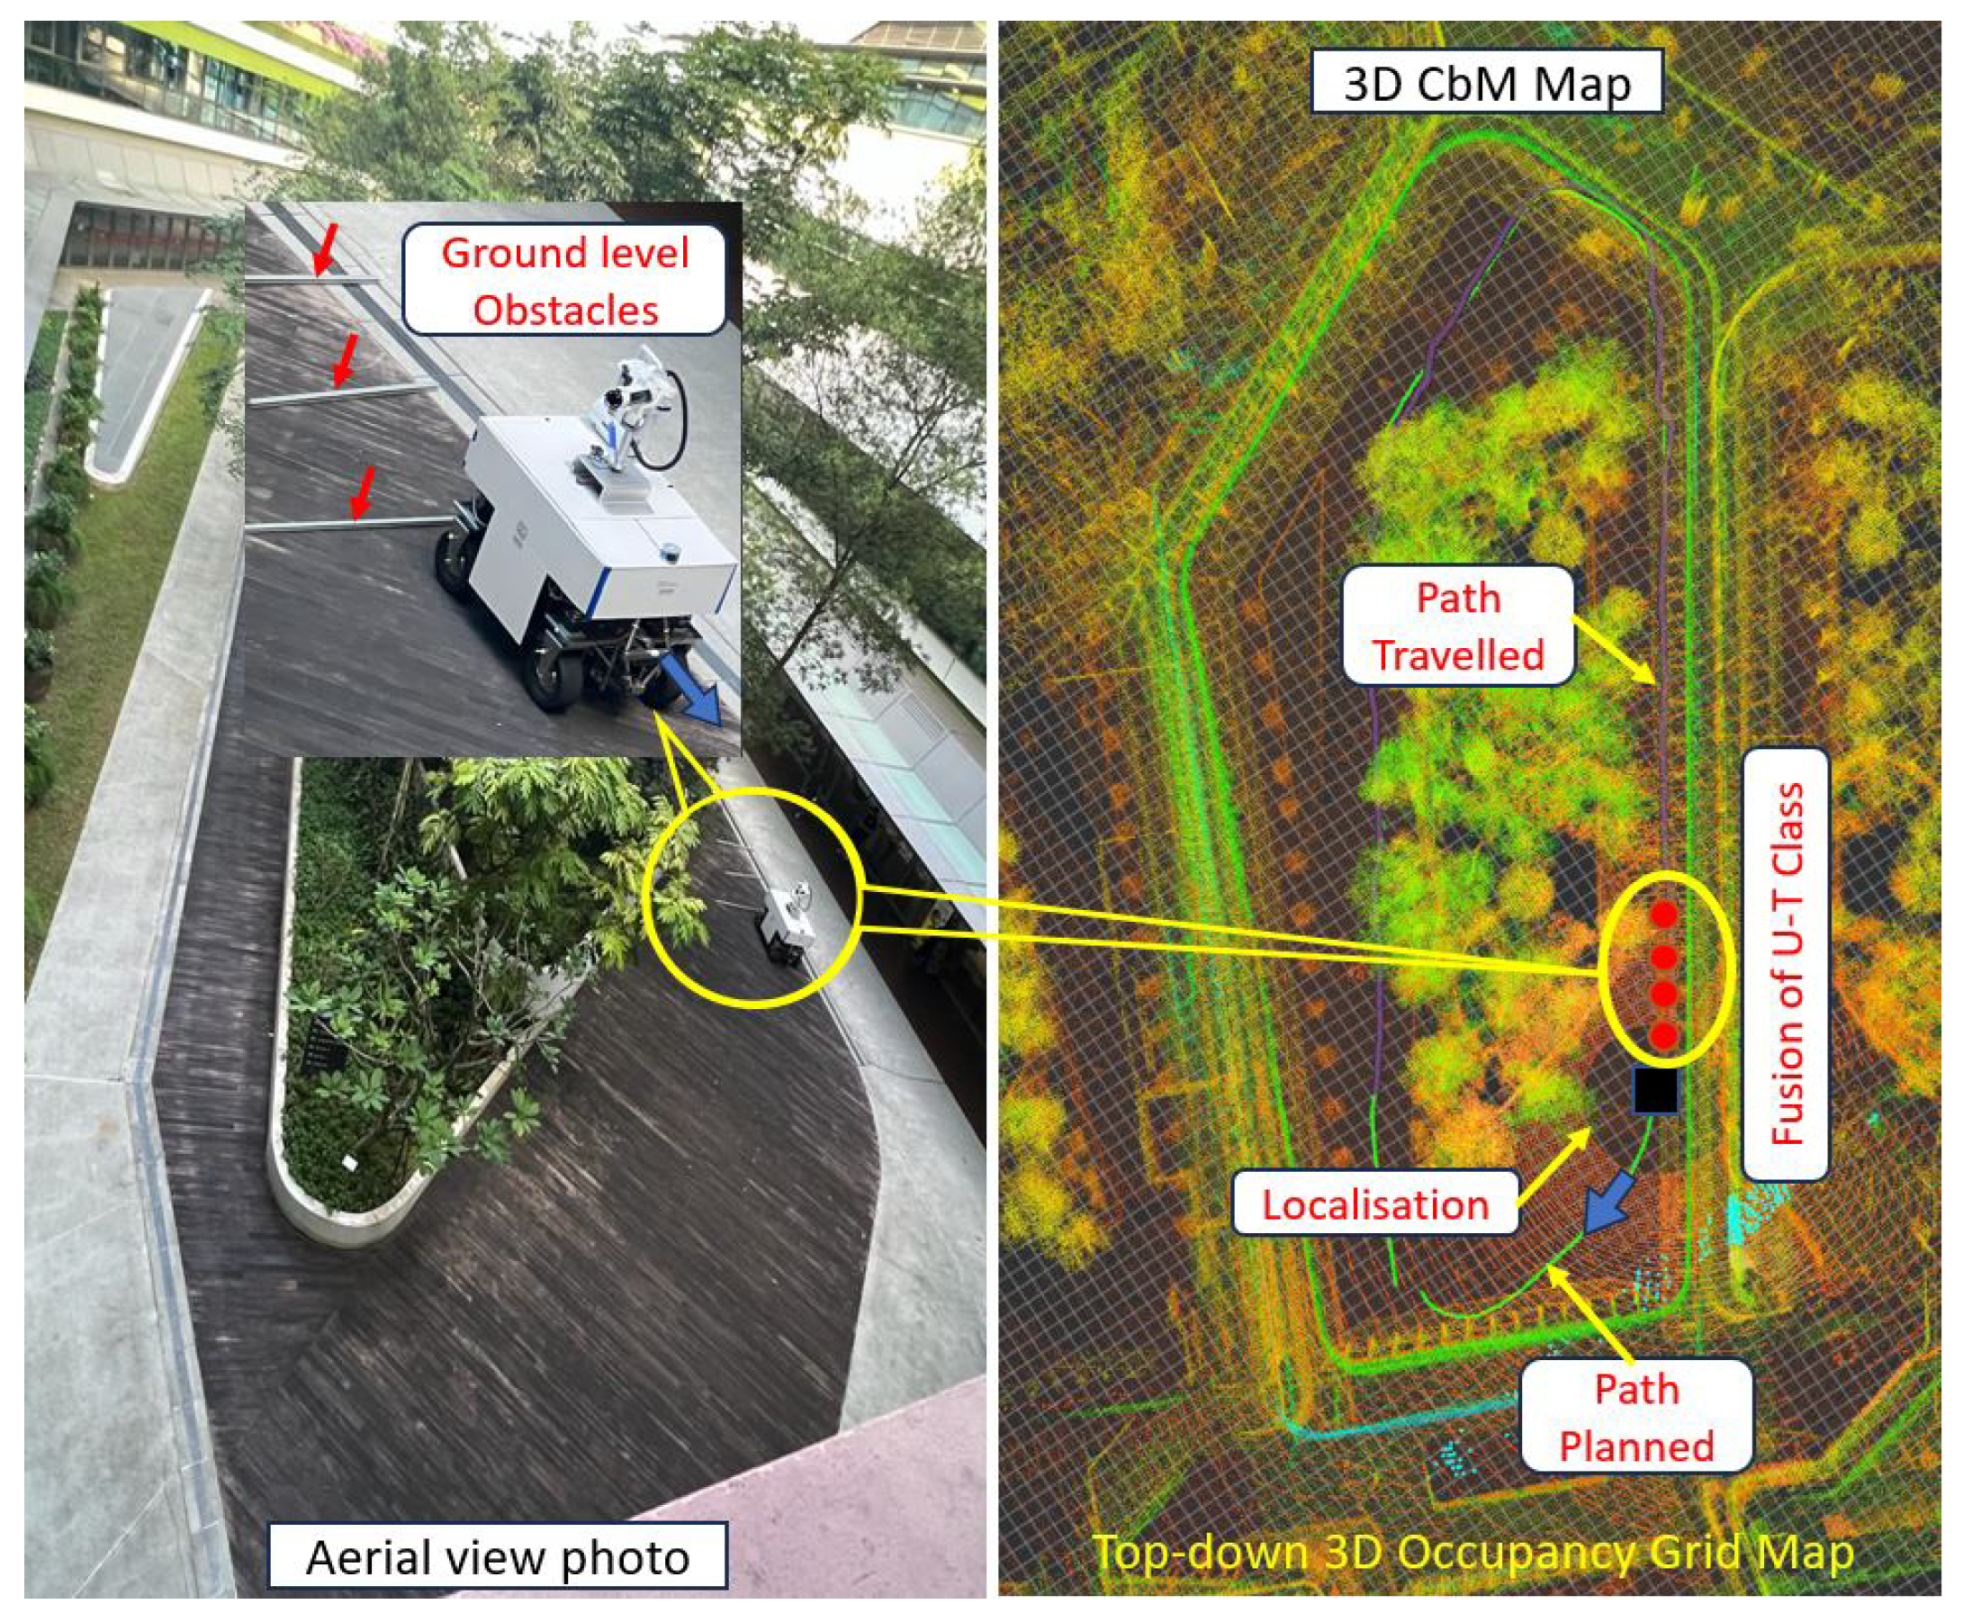
Figure 8 illustrates this framework generating a 3D CbM map, including the photograph of the robot and workspace. This is pavement at the SUTD campus, where we introduced some aluminum profiles around 4–6 cm in height to induce an unsafe-terrain-related class (U-T). Accordingly, the framework predicted the U-T class as the robot ran through this simulated uneven terrain and marked the class on the 3D occupancy grid map, matching the spot where the profiles are inserted. The maintenance team can monitor the system-generated health conditions of the robot or terrain-induced workspace features from the 3D CbM map in real time as required, enabling maintenance or corrective actions promptly based on the conditions of the robot or workspace, i.e., fostering a CbM strategy for productivity and safety.
5. Real-Time Field Case Studies
The proposed 3D LiDAR point-cloud-based CM framework is validated by conducting three real-time field case studies using the outdoor fumigation robot in different outdoor areas at the SUTD campus, including a grass field, representing real outdoor robot’s workspaces with varying terrain features. The areas selected and the ground-level obstacles or features introduced for these trials differed from those used during the training data acquisition phase. The onboard 3D LiDAR Velodyne VLP-16 sensor, its mounting position, and the 10 Hz subscription rate were kept the same as in the training phase. The healthy state of the robot was assured before starting each field trial. An Inference Engine (Algorithm 1) was developed based on the training Approach-2, covering levels I and II, and the models run on the TensorFlow platform to apply their knowledge for inferring a new data sample received in real time. The engine appends point cloud frames for a batch size of thirty and extracts the vibration-indicated 3D vector displacement data from the consecutive frames. Here, the temporal buffer (TempBuffer) is a 2D array of a [540, 3] placeholder for a single dataset, which is used as input to the 1D CNN model that returns the threshold class. The inference buffer(InfBuffer) is a placeholder for the inferred class (InfClass) for each class predicted, which will be sent to the mapping algorithm.
A 3D-occupancy grid map (map) was generated for each test area, selected as a prework for field trials. The vibration threshold class mapping algorithm, as illustrated in Algorithm 2, is used to fuse the abnormal threshold classes predicted (PC) instantly on the 3D occupancy map. The algorithm tracks the robot’s position on the map and receives the predicted class from Algorithm 1 in real time. Each class received will fuse/mark at the center point of the robot’s footprint (RFP) on the map concurrently with the timestamp and following the unique color for each class, thus generating a 3D CbM map.
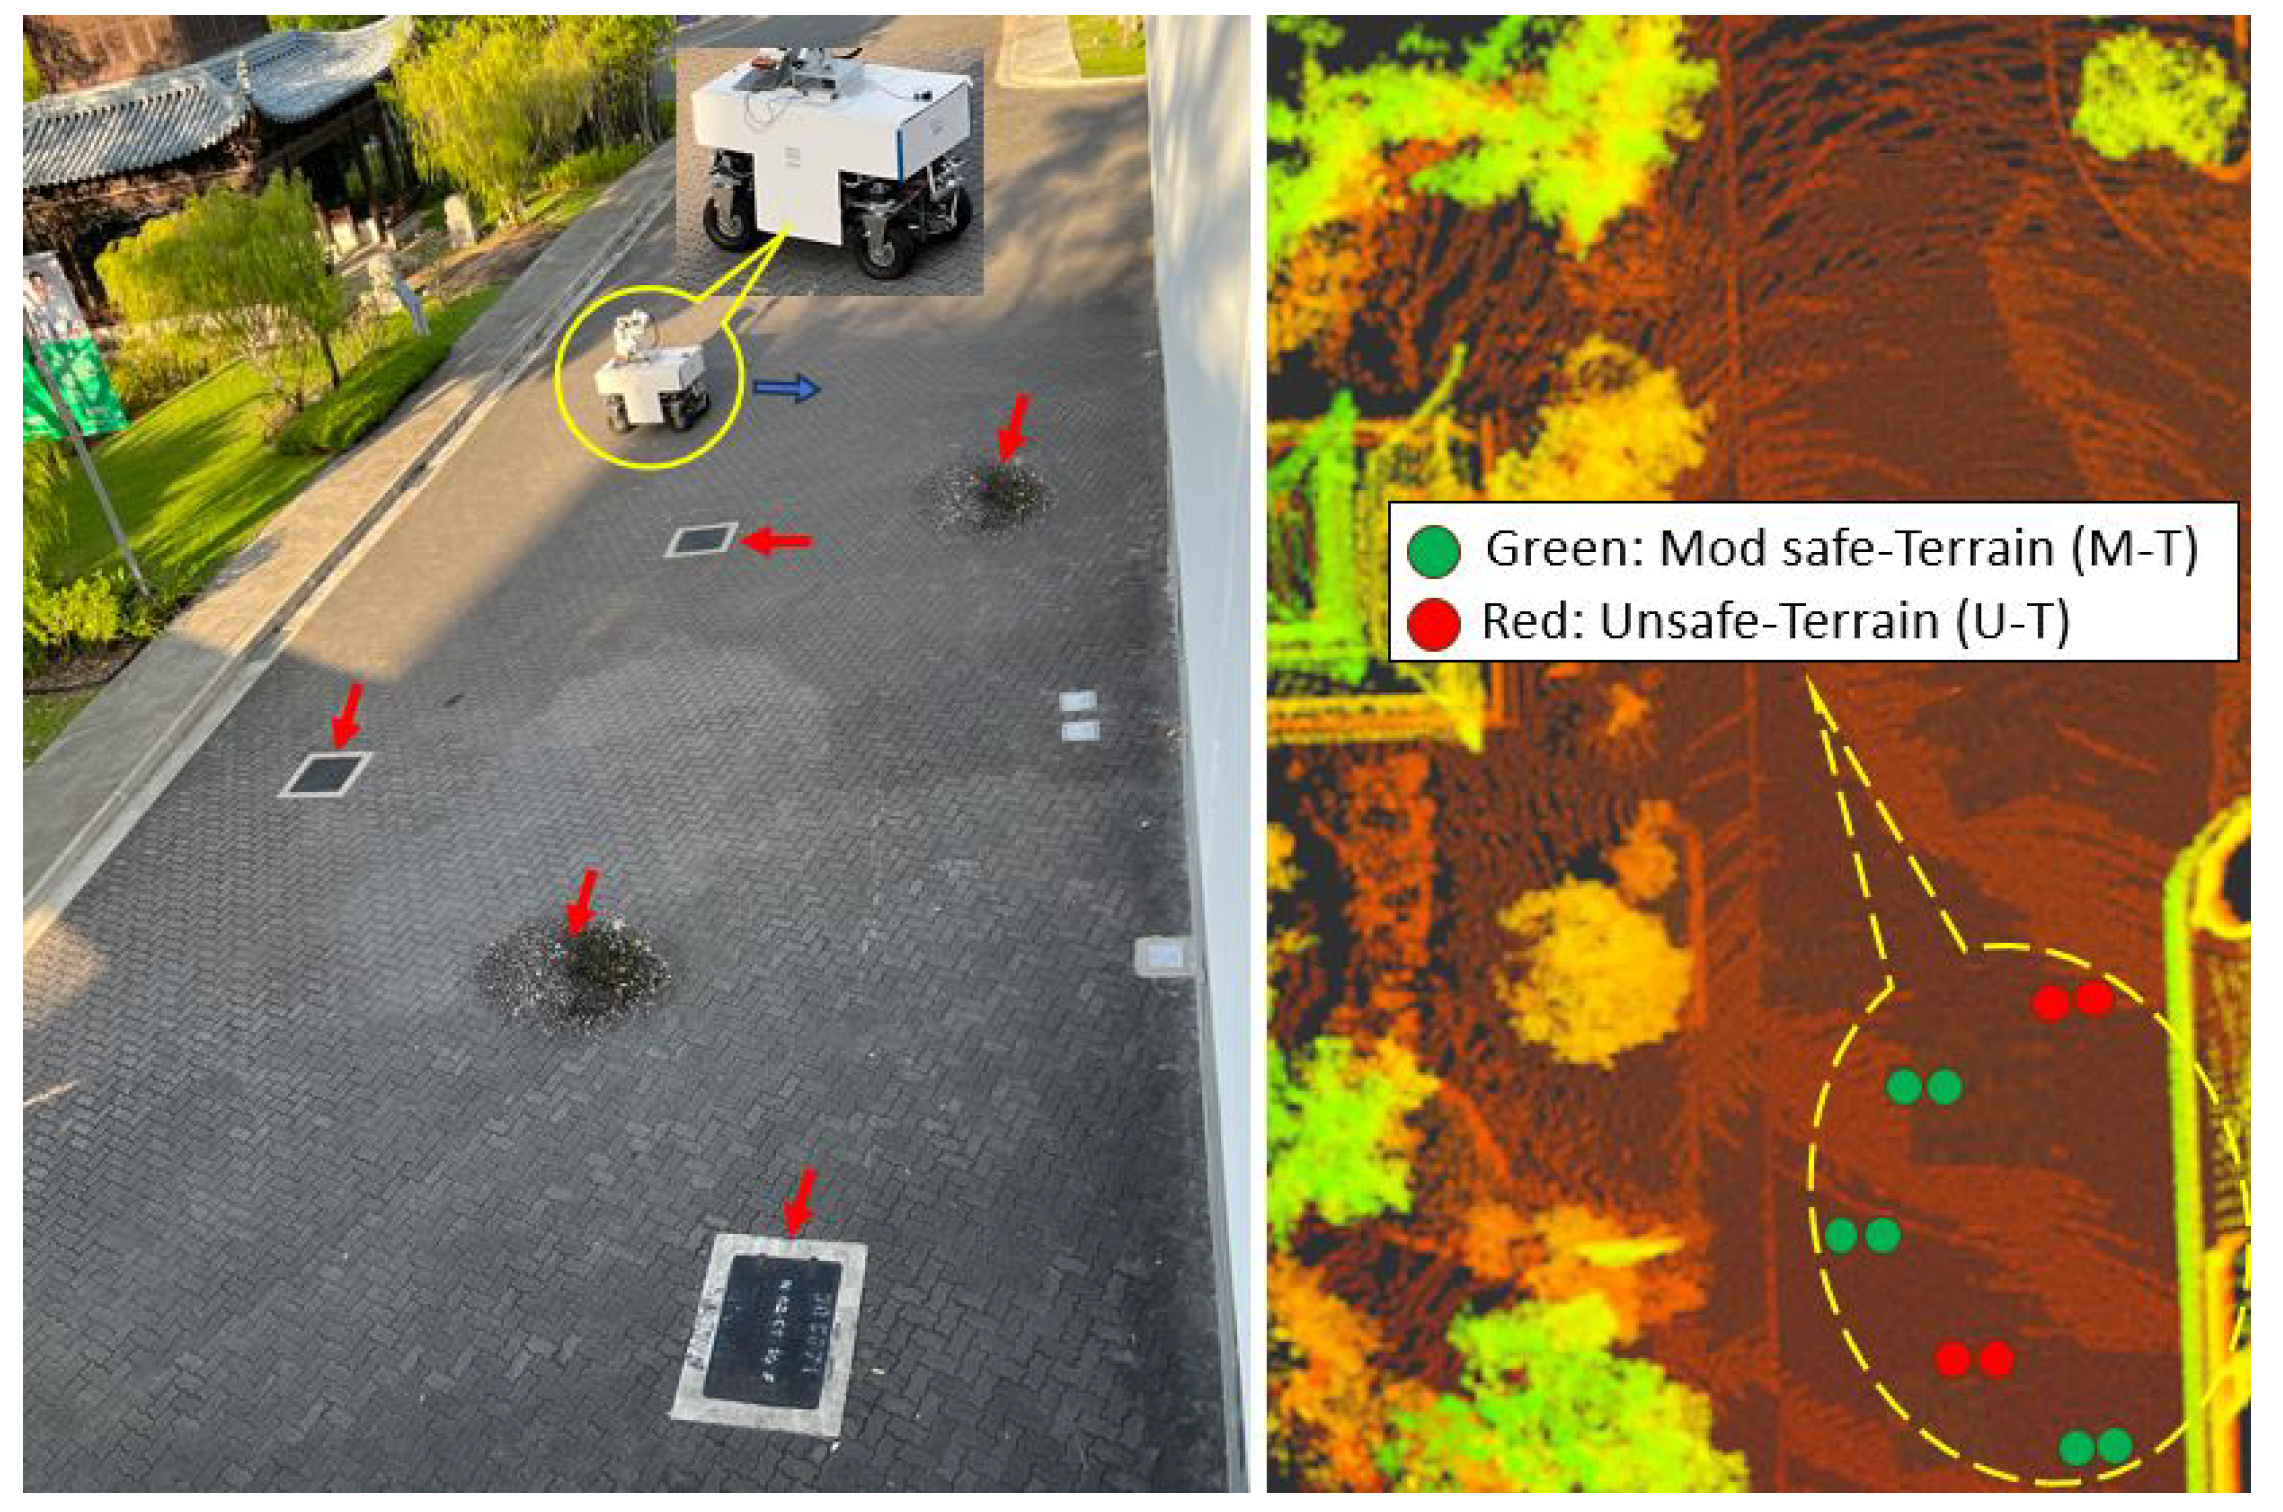
The first case study was conducted in an open-ground area with uniformly paved tiles, which include some pits under maintenance and drainage manholes with raised covers. For testing, we selected an area of around 12 × 22 m
2 and conducted a complete area coverage in a zig-zag travel pattern. The threshold class prediction and the 3D CbM map generation follow Algorithms 1 and 2, respectively. The terrain-induced moderately safe and unsafe classes were predicted when the robot overcomes the uneven spots mentioned. The tested area and the 3D CbM map fusing the moderately safe terrain-induced class (M-T) in green color and unsafe terrain-induced class (U-T) in red are shown in
Figure 13.
| Algorithm 1 Inference Engine |
while is not empty do
call
Format to have shape (n, 30)
Append to
if then
Call
if then
call
Clean
else if then
call
Clean
else if then
Clean
end if
end if
end while |
| Algorithm 2 Vibration Threshold Levels Mapping |
if is Safe then
else if is Abnormal then
if is M-S then
else if is M-T then
else if is U-S then
else if is U-T then
end if
end if
|
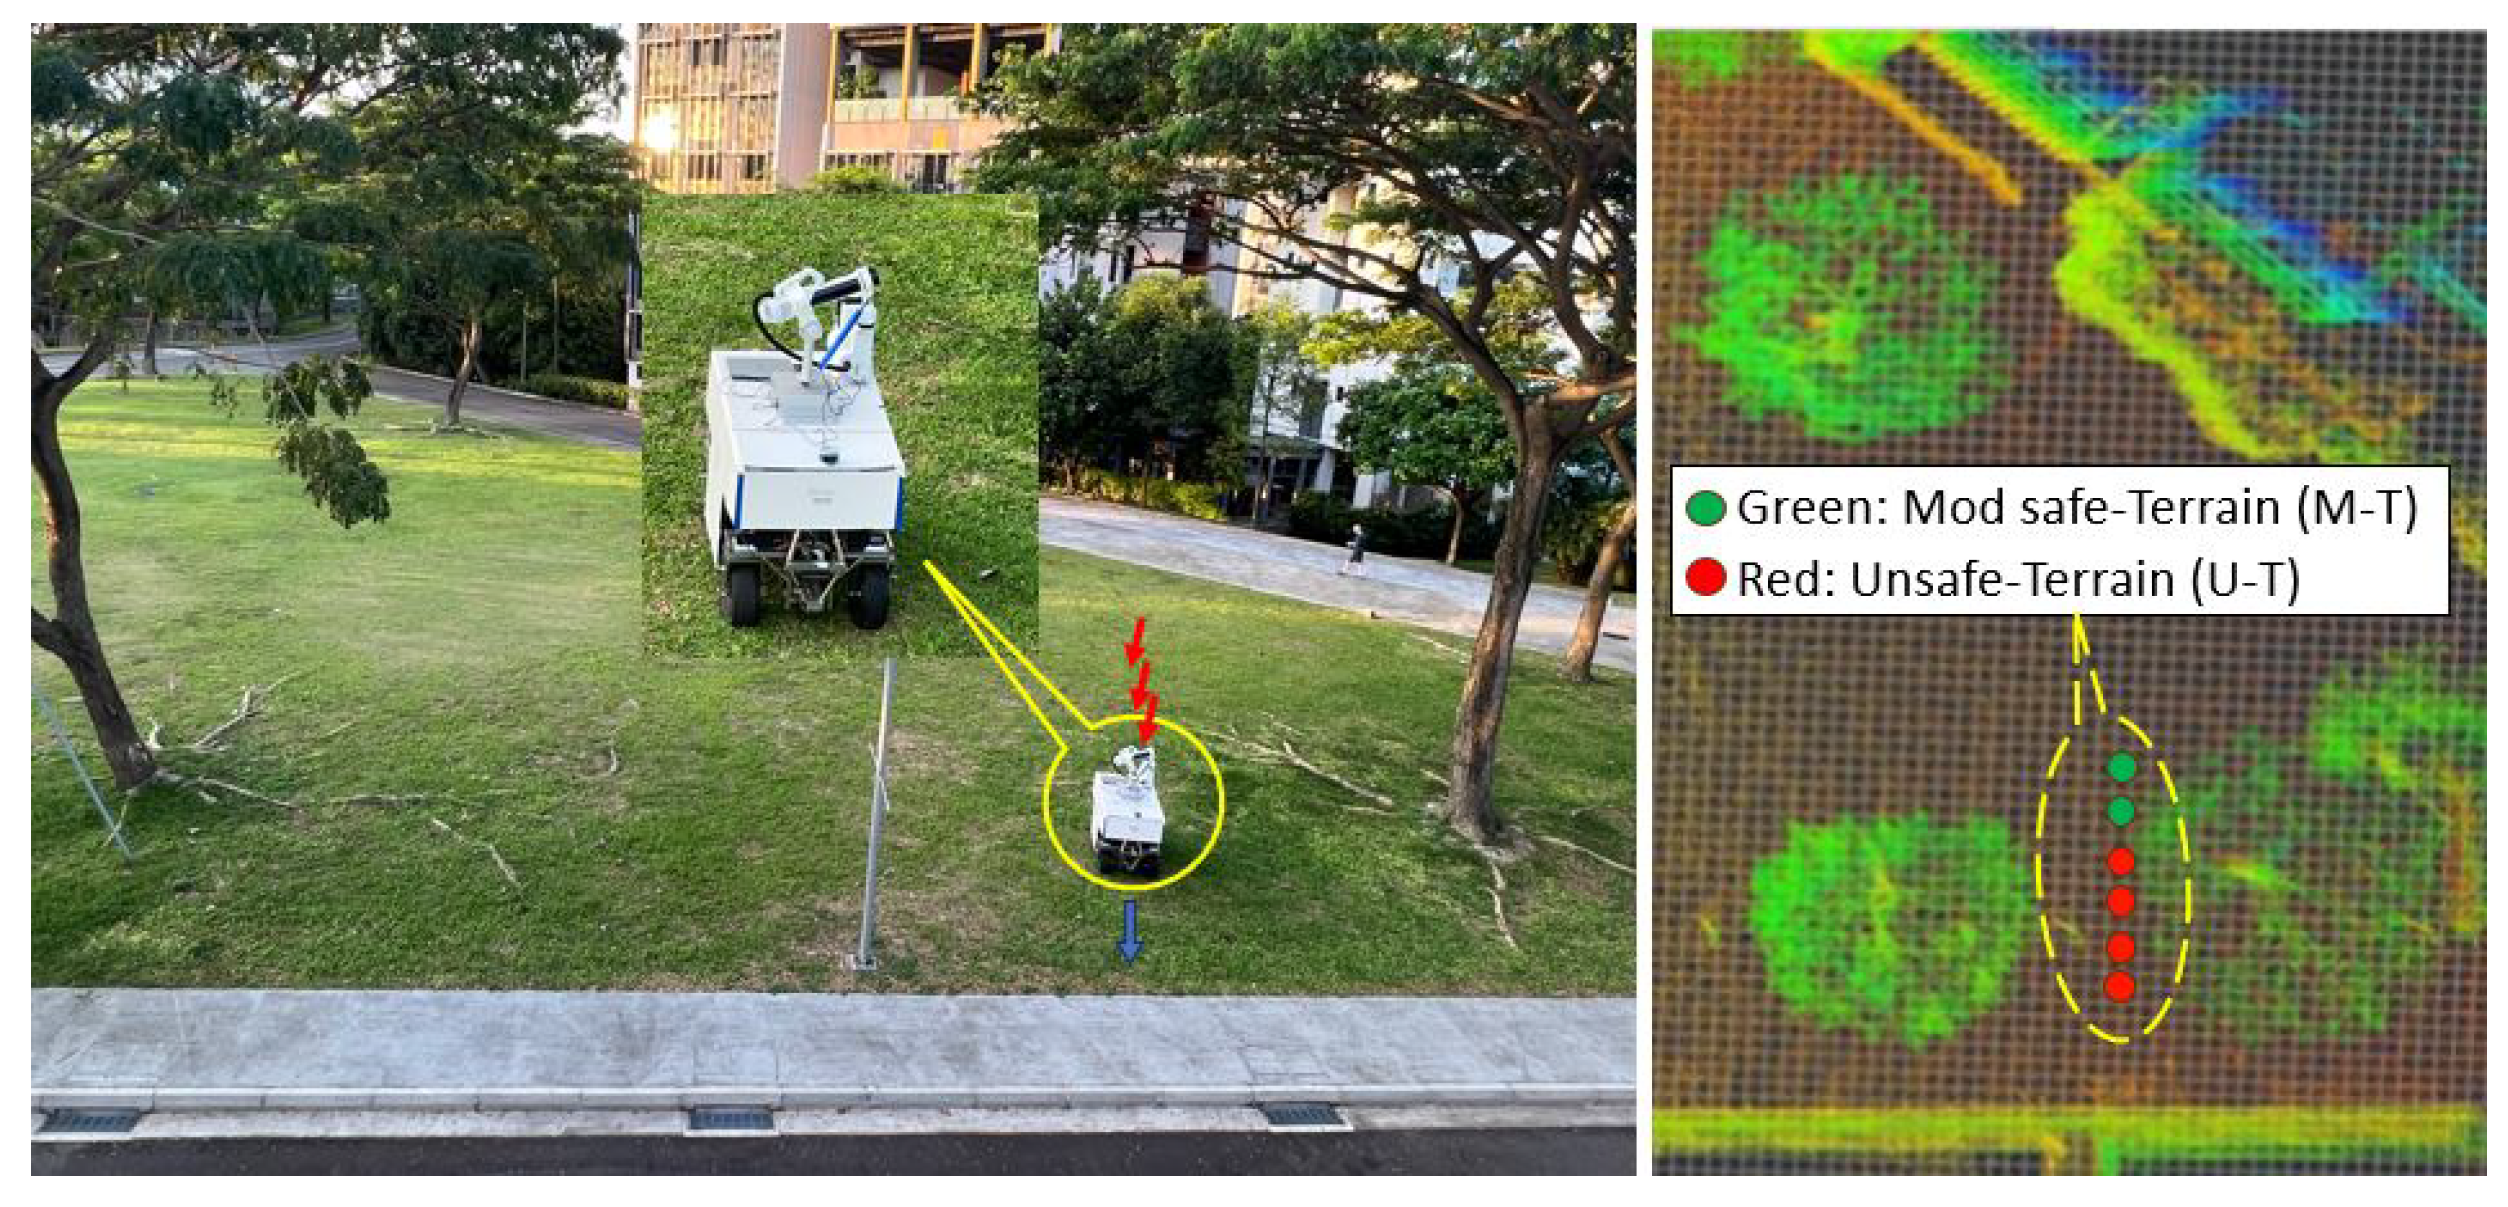
An open grass field at the campus was selected for the second case study, as well as an area of around 20 × 35 m
2 for trial runs. The ground is almost fully covered by grass with regions of slops, small hidden pits, many ground-level stones of different sizes and shapes, and long, short, small, and big tree root sizes are spread out on the ground and mostly covered by grass. The robot was tested with a zig-zag pattern and we observed the robot’s behavior closely. The 3D CbM map initially showed an intermittent M-T and U-T class while traversing, especially on pits and roots. Whenever the robot hit bigger roots, jerks were generated and it tried to deviate from its planned path; simultaneously, the robot keept predicting the U-T classes. The power tripped once due to power surges from the motors while overcoming roots. As more unsafe classes due to terrain were predicted, we stopped the robot after one hour to avoid any permanent damage to the robot or hazardous events. The threshold classes fused based on some last sample data selected are shown in the 3D CbM map together with the test environment photo in
Figure 14.
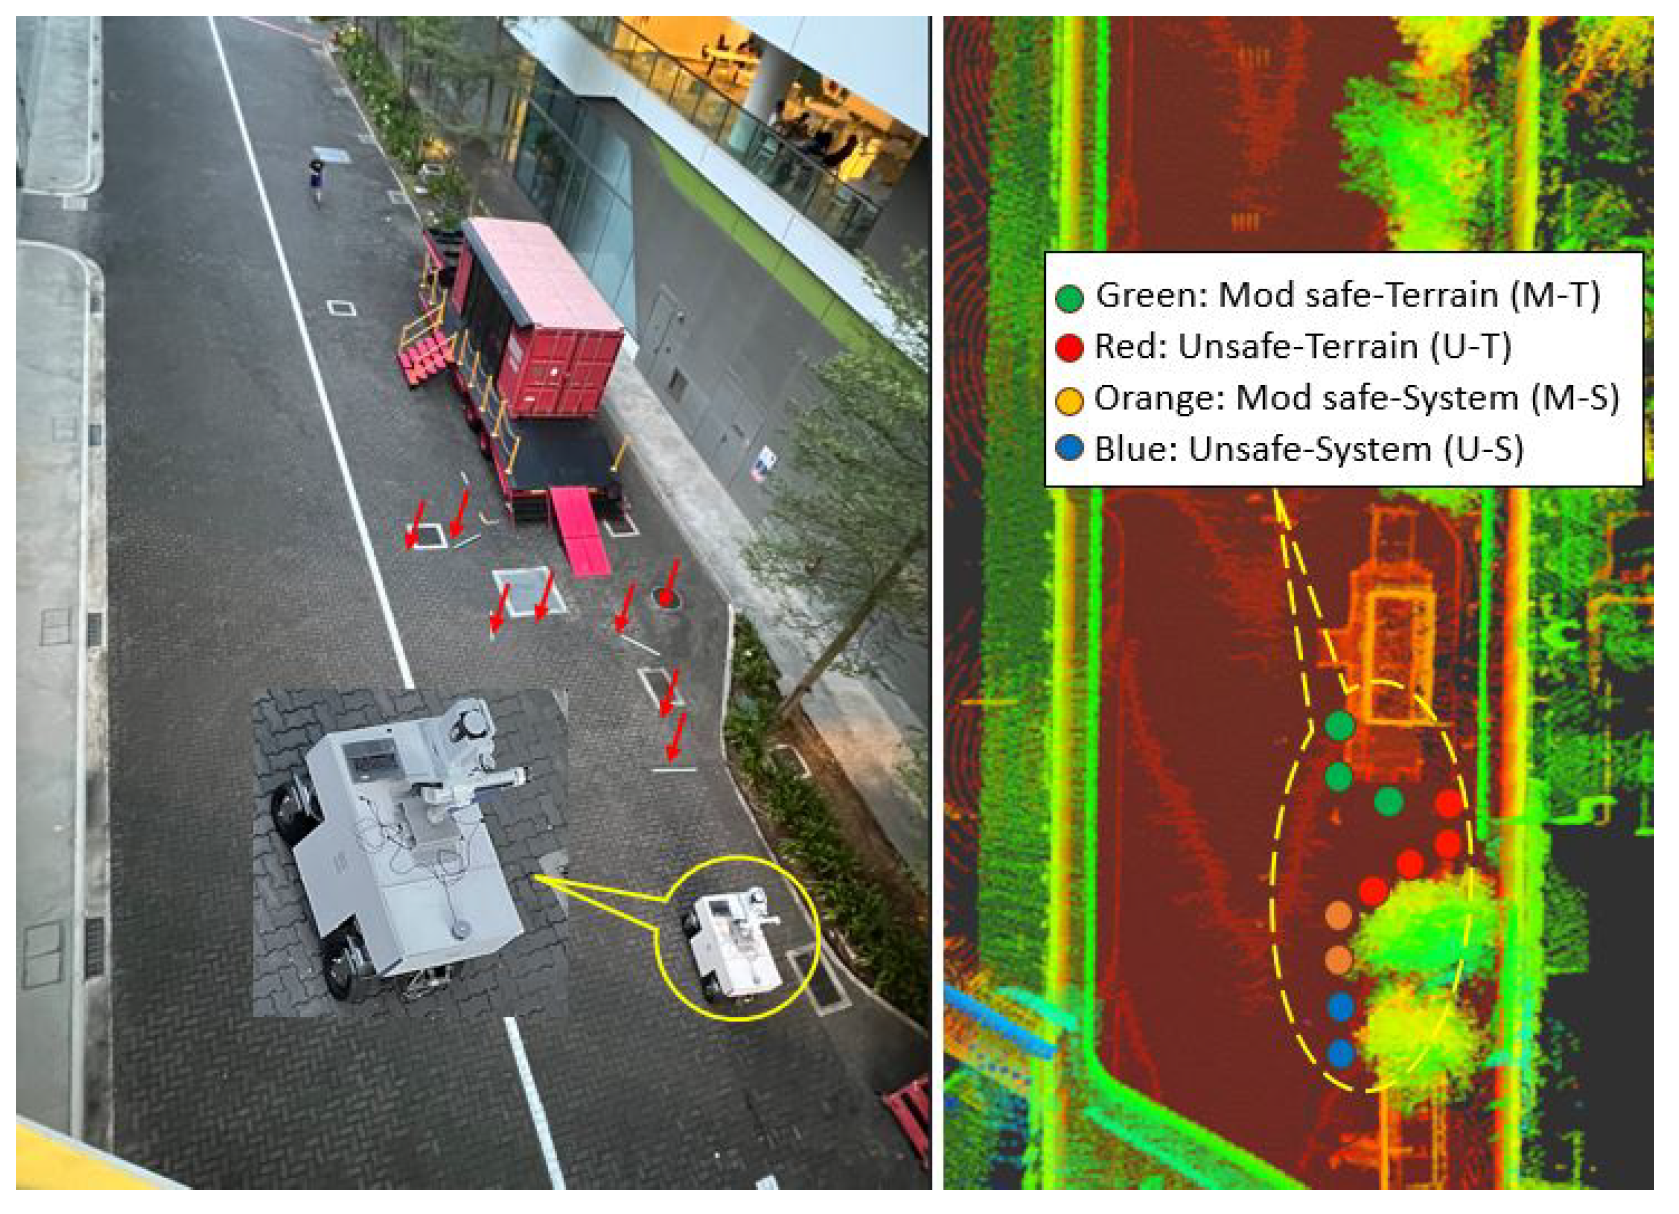
The final case study was focused mainly on representing the system-generated threshold classes. Hence, we selected minimally used pavement with uniformly paved tiles and an area of 10 × 25 m
2 for deployment. This area also includes uneven and unstructured spots such as missing or broken tiles, drainage cover at different heights, curbs, small pits, cliffs, gutters, etc. Additionally, some common hard trashes on the road were introduced, such as small stones, rods, bottles, cans, etc., to simulate the actual pavements. The robot was driven in the predefined hard-coded zig-zag path pattern for area coverage in a closed loop. The 3D LiDAR map generated during the prework of the experiment was used along with the hdl-localization algorithm for localization. An intermittent prediction of M-T and U-T classes was observed whenever the robot was exposed to medium and severe terrain features and fused on the 3D-occupancy grid map in real time. This test was planned on average four hours per day, and we continued testing for ten days with no corrective actions on terrain and noticed M-S classes fused occasionally and observed the robot’s vibrations when it traversed through the plain and even terrain. The robot was allowed to continue its operation without any maintenance actions, exposing it to the same unstructured terrain features. Further, the algorithm predicted system-generated unsafe classes (U-S) on the 15th day, and we noticed an obvious vibration in the robot. For the safety of the robot and environment, we stopped the experiment and discovered the hub wheel couplings assembly was getting looser than the original settings, and one of the wheels was punctured. The 3D CbM map with random samples from the last few fused vibration threshold classes is shown in
Figure 15, including the test environment photo.
We randomly collected 500 samples of each class from the above three case studies, observing the ground truth during the robot’s operation to assess the real-time prediction accuracy. Accordingly, the average accuracy found was 89%, and the individual classes’ accuracies are listed in
Table 3, which are close to the offline evaluation results; hence, the feasibility and consistent accuracy of the proposed CM framework for outdoor mobile robots is validated for real-time applications.
Other than helping maintenance engineers to trigger prompt maintenance or corrective actions based on the health condition of the robot or uneven terrain conditions through real-time monitoring, the proposed CM framework also helps robot deployment contract companies assess how good a given area is for deployment, assessing the terrain-induced classes and their moderate and unsafe class populations using the proposed 3D CbM map. This facilitates the revision of their robot’s maintenance and deployment rental strategies. As per our knowledge, this assessment is currently practiced manually, which is not representative, especially for outdoor fumigation or lawn mowing robots, as most of the ground-level terrain features are covered by grass. Other impacts of this work/3D CbM map are for robot manufacturers to improve the design and assembly processes based on the system generated and the effects of terrain classes predicted, mainly considering faster loosening of critical assembly, deterioration, wear and tear rate of components, unbalanced structure, etc. Compared with a camera sensor, a 3D LiDAR sensor is not affected by outdoor light conditions; also, a long range of up to 100 m is feasible with the 3D LiDAR used in this work, enabling it for the outdoor environment. However, the limitations and improvements needed for the proposed work include enhanced real-time prediction accuracy to avoid any False Positive predictions, performance degradation issues of 3D LiDAR sensor in bad weather conditions, especially heavy rain, fog, and snow, limitations to detect proper clusters if no surrounding objects, and 3D LiDAR is expensive.
The robustness of the proposed system, mainly the capability of the system to maintain performance, accuracy, and functionality under varying conditions and uncertainties, is important, i.e., good performance even in the worst internal or external scenarios [
47,
48]. Here, the 3D-LiDAR-based CM approach’s robustness refers to its capability to capture the vibration indicators and detect the system deterioration and the terrain conditions affecting the robot’s health across varying outdoor environments, which is validated through the real-time field case studies explained. For future works, the system’s resilience can be improved, i.e., reducing the risks involved due to inevitable disruptions, with the intrinsic capability of the system to recover and continue its functional performance [
49,
50]. The resilience of our proposed CM system can be improved using the onboard IMU sensor or integrating a camera sensor as a redundant CM sensor by modeling and training the relevant vibration-indicated data. We will explore such heterogeneous data from these additional independent sensors to improve the resilience of this 3D-LiDAR-based CM approach for future work.
6. Conclusions
An automated condition monitoring (CM) strategy for outdoor mobile robots is essential to assure productivity and safety, considering extreme outdoor terrain features and faster system deterioration. Vibration is a key indicator of system failure and terrain abnormalities, especially in mobile robots. Hence, in this work, we proposed and validated a novel CM framework using a 3D LiDAR sensor, applying it differently than its typical use for navigation, by developing an algorithm to extract the vibration-indicated data from the point cloud, assuring low computation cost without losing vibration characteristics. We identified five vibration threshold classes for CM in outdoor robots considering both system deterioration and terrain conditions, namely safe, moderately safe due to system (M-S) and terrain (M-T), and unsafe due to system (U-S) and terrain (U-T). The algorithm computed cuboids for two prominent clusters in every point cloud frame, and the 3D vector displacement of the points set at the corners and centroid of the cuboid, which correspond to the vibration-affected clusters, are compiled as vibration indication data. A simply structured 1D-CNN-based vibration threshold prediction model is developed for fast, accurate, and real-time execution. Further, a 3D CbM map is generated by developing a framework to map the predicted anomalous threshold classes on the 3D occupancy map of the workspace in real time, which allows monitoring of the robot’s health conditions and uneven terrain features.
The proposed CM framework for an outdoor mobile robot is unique in terms of the vibration classes that consider both the robot’s internal health state and external terrain features affected, including the threshold levels, 3D LiDAR sensor used for vibration-based CM application, the methodology developed for extracting vibration-indicated data, and the data acquisition and real-world scenario validation using the most representative outdoor robot; it achieved an average real-time prediction accuracy of 89%. The accurate and consistent prediction results of real-time field trials using the in-house-developed outdoor robot show that the proposed 3D-LiDAR-based CM framework is robust, which facilitates the maintenance team in triggering prompt maintenance or corrective actions based on the robot’s condition or its workspace, fostering a CbM strategy. This work also helps revise rental policies to fit intended workspaces and improves robot design and assembly processes. Further, we plan to explore more heterogeneous sensors to complement each other and sensor fusion approaches to improve the prediction accuracy of the vibration threshold classes, as well as enabling system resilience in case one sensor fails, for condition monitoring in outdoor mobile robots.


