Analysis of Judiciary Expenditure and Productivity Using Machine Learning Techniques
Abstract
1. Introduction
State of the Art on the Productivity of the Judiciary
2. Materials and Methods
2.1. Standardization of Variables
2.2. Creation of Models with 2, 3, and 4 Clusters Using the k-Means Algorithm
2.3. Creating a General Productivity Index
2.4. Normality Test of the Data
2.5. Selection of the Best Clustering Approach (2, 3, or 4 Clusters)
2.6. Neural Network Model
3. Results
3.1. Application of Machine Learning
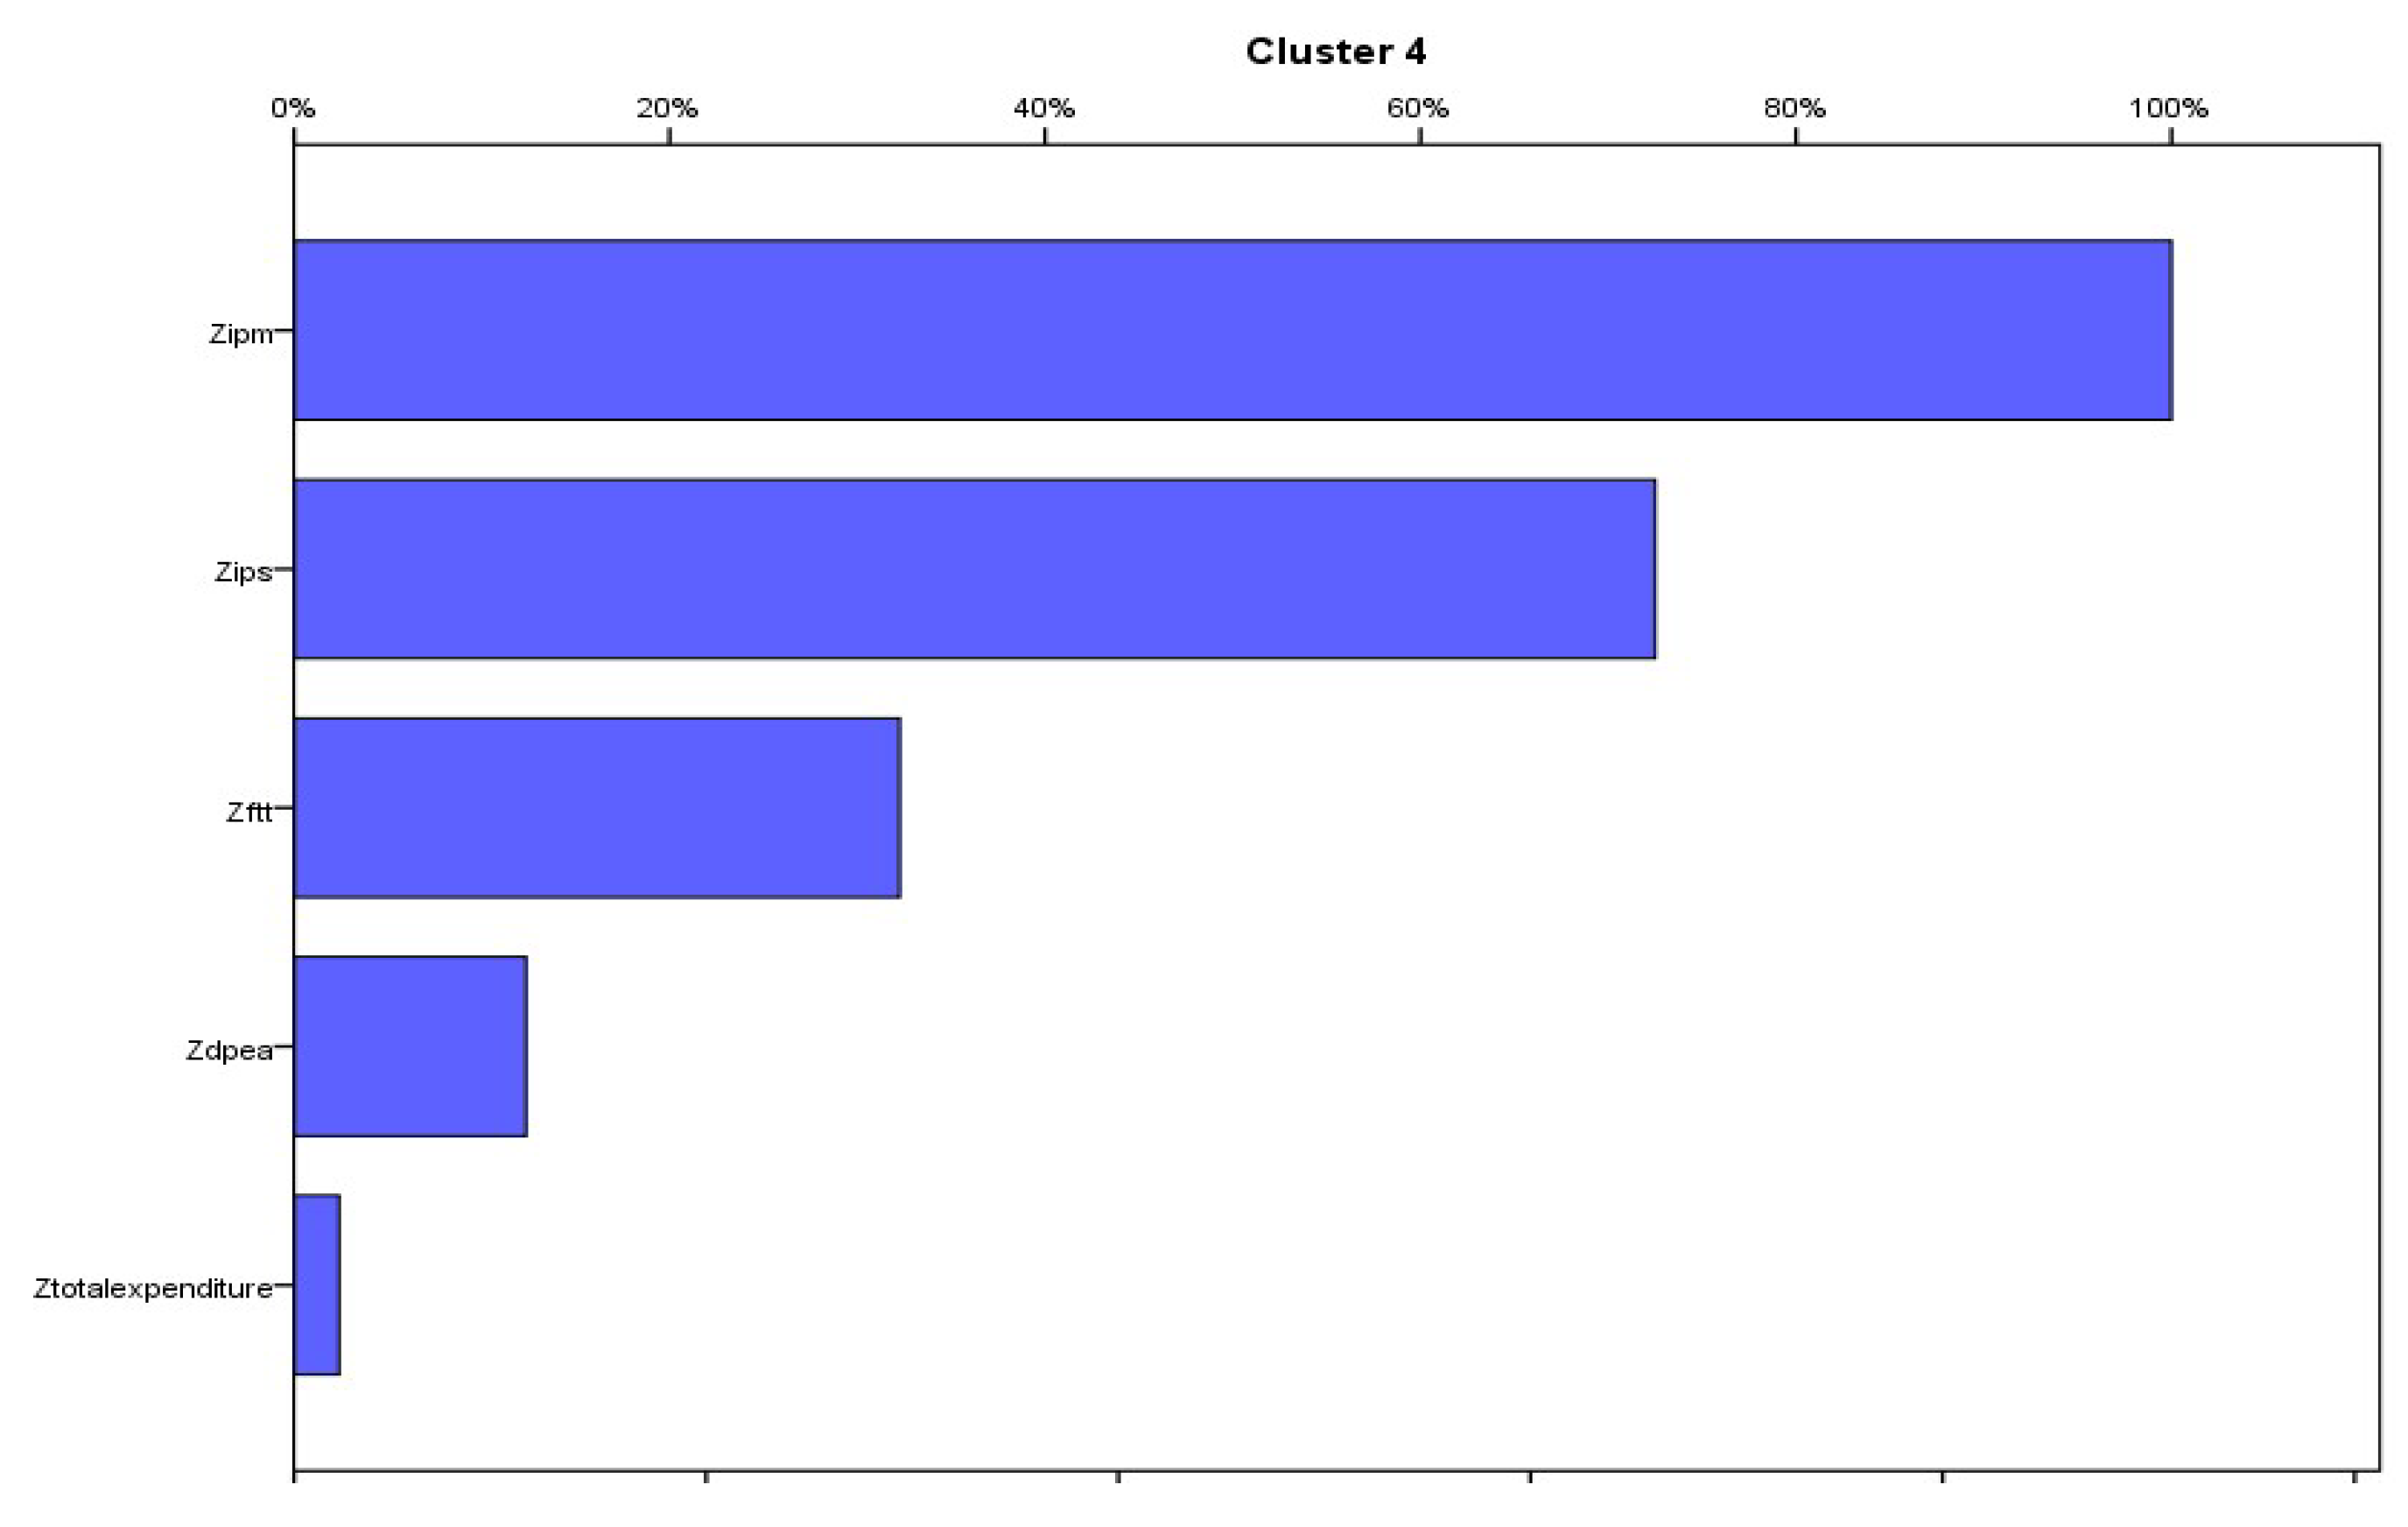
3.2. Neural Networks
4. Discussion
Author Contributions
Funding
Data Availability Statement
Conflicts of Interest
References
- Voigt, S.; El-Bialy, N. Identifying the determinants of aggregate judicial performance: Taxpayers’ money well spent? Eur. J. Law Econ. 2016, 41, 283–319. [Google Scholar] [CrossRef]
- Gico, I.T., Jr. Anarquismo Judicial e Teoria dos Times Judicial. Econ. Anal. Law Rev. 2013, 4, 269–294. [Google Scholar] [CrossRef]
- Sadek, M.T.A. Judiciário: Mudanças e reformas. Estud. Avançados 2004, 18, 79–101. [Google Scholar] [CrossRef]
- Gomes, A.O.; Freitas, M.E.M.D. Correlação entre demanda, quantidade de juízes e desempenho judicial em varas da Justiça Federal no Brasil. Rev. Direito GV 2017, 13, 567–585. [Google Scholar] [CrossRef]
- Beer, C.C. Judicial Performance and the Rule of Law in the Mexican States. Lat. Am. Politics Soc. 2006, 48, 33–61. [Google Scholar] [CrossRef]
- Dougherty, G.W.; Lindquist, S.A.; Bradbury, M.D. Evaluating Performance in State Judicial Institutions: Trust and Confidence in the Georgia Judiciary. State Local Gov. Rev. 2006, 38, 176–190. [Google Scholar] [CrossRef]
- Buscaglia, E.; Dakolias, M. Comparative International Study of Court Performance Indicators: A Descriptive and Analytical Account (No. 20177, p. 1); The World Bank: Washington, DC, USA, 1999. [Google Scholar]
- Staats, J.L.; Bowler, S.; Hiskey, J.T. Measuring Judicial Performance in Latin America. Lat. Am. Politics Soc. 2005, 47, 77–106. [Google Scholar] [CrossRef]
- Manzi, R.M.; Sousa, M.M. A relação entre demanda e desempenho dos magistrados: Investigação de um modelo funcional em forma de U invertido. Rev. De Adm. Pública 2021, 55, 1215–1231. [Google Scholar] [CrossRef]
- Abramo, C.W. Tempos de espera no Supremo Tribunal Federal. Rev. Direito GV 2010, 6, 423–442. [Google Scholar] [CrossRef]
- Ribeiro, M.C.P.; Neto, R.R. Uma análise da eficiência do poder judiciário com base no pensamento de Douglas North. Rev. Quaestio Iuris 2016, 9, 2025–2040. [Google Scholar] [CrossRef]
- Dimitrova-Grajzl, V.; Grajzl, P.; Slavov, A.; Zajc, K. Courts in a transition economy: Case disposition and the quantity–quality tradeoff in Bulgaria. Econ. Syst. 2016, 40, 18–38. [Google Scholar] [CrossRef]
- CNJ. Justiça em Números: Ano-base 2019. Brasília. 2020. Available online: https://www.cnj.jus.br/pesquisas-judiciarias/justica-em-numeros/ (accessed on 10 October 2021).
- Gomes, A.D.O.; Guimarães, T.D.A. Desempenho no Judiciário: Conceituação, estado da arte e agenda de pesquisa. Rev. De Adm. Pública 2013, 47, 379–401. [Google Scholar] [CrossRef]
- Falavigna, G.; Ippoliti, R. Model definitions to identify appropriate benchmarks in judiciary. J. Appl. Econ. 2022, 25, 338–359. [Google Scholar] [CrossRef]
- Alberti, A.; Bertucci, G. Innovations in Governance and Public Administration: Replicating What Works; United Nations: New York, NY, USA, 2006; pp. 1–190. [Google Scholar]
- Demircioglu, M.A.; Audretsch, D.B. Conditions for innovation in public sector organizations. Res. Policy 2017, 46, 1681–1691. [Google Scholar] [CrossRef]
- Richard, P.J.; Devinney, T.M.; Yip, G.S.; Johnson, G. Measuring organizational performance: Towards methodological best practice. J. Manag. 2009, 35, 718–804. [Google Scholar] [CrossRef]
- Beenstock, M.; Haitovsky, Y. Does the appointment of judges increase the output of the judiciary? Int. Rev. Law Econ. 2004, 24, 351–369. [Google Scholar] [CrossRef]
- Louro, A.C.; Zanquetto-Filho, H.; Santos, W.R.; Brandão, M.M. Tools, methods, and some caveats to analyze the Brazilian Judiciary Performance data. Adm. Pública E Gestão Soc. 2021, 13. [Google Scholar] [CrossRef]
- Yeung, L. Measuring Efficiency of Brazilian Courts: One Decade Later (SSRN Scholarly Paper ID 3200588). Soc. Sci. Res. Netw. 2018. [Google Scholar] [CrossRef]
- Sátiro, R.M. Determinantes Emergentes da Produtividade em Tribunais de Justiça Estaduais. Ph.D. Thesis, Universidade Federal de Goiás (UFG), Goiânia, Brazil, 2019. [Google Scholar]
- Sátiro, R.M.; Sousa, M.D.M. Determinantes quantitativos do desempenho judicial: Fatores associados à produtividade dos tribunais de justiça. Rev. Direito GV 2021, 17. [Google Scholar] [CrossRef]
- Mitsopoulos, M.; Pelagidis, T. Does staffing affect the time to dispose cases in Greek courts? Int. Rev. Law Econ. 2007, 27, 219–244. [Google Scholar] [CrossRef]
- Dimitrova-Grajzl, V.; Grajzl, P.; Sustersic, J.; Zajc, K. Court output, judicial staffing, and the demand for court services: Evidence from Slovenian courts of first instance. Int. Rev. Law Econ. 2012, 32, 19–29. [Google Scholar] [CrossRef]
- Fernandes, F.C.; Mazzioni, S. A Correlação entre a Remuneração dos Executivos e o Desempenho de Empresas Brasileiras do Setor Financeiro. Contab. Vista Rev. 2015, 26, 41–64. [Google Scholar]
- Kelly, P.G.; Celso Vila Nova, S.J. Atenção prioritária ao 1º grau de jurisdição medindo a eficiência do Poder Judiciário no Distrito Federal. Rev. Razão Contábil Finanças 2020, 11, 10. [Google Scholar]
- Pinheiro, J.S.; Chaves, F.B. Judicialização da Saúde: A Contribuição das Medidas Administrativas Recomendadas Pelo CNJ Aplicadas pelo Poder Judiciário do Tocantins. Rev. Integr. Univ. 2019, 13, 60–73. [Google Scholar]
- Rosales-López, V. Economics of court performance: An empirical analysis. Eur. J. Law Econ. 2008, 25, 231–251. [Google Scholar] [CrossRef]
- Guimaraes, T.A.; Gomes, A.O.; Guarido Filho, E.R. Administration of justice: An emerging research field. RAUSP Manag. J. 2018, 53, 476–482. [Google Scholar] [CrossRef]
- Bertoncini, I.; Monteiro, A.D.O.; Fadul, É. Gestão Estratégica e Reforma do Poder Judiciário: O Caso do Tribunal Regional Eleitoral da Bahia. In Proceedings of the XXXVIII Encontro da ANPAD—EnANPAD, Rio de Janeiro, Brazil, 13–14 September 2014. [Google Scholar]
- Vieira, J.L.; Pinheiro, I.A. Contribuições do Conselho Nacional de Justiça para a Gestão do Judiciário. Encontro ANPAD 2008, 32, 2008. [Google Scholar]
- Ribeiro, L. A Emenda Constitucional 45 e a questão do acesso à justiça. Rev. Direito GV 2008, 4, 465–491. [Google Scholar] [CrossRef]
- Brasil, Resolução CNJ nº 331/2020. Available online: https://atos.cnj.jus.br/atos/detalhar/3428 (accessed on 18 July 2021).
- Yeung, L.L.T.; Azevedo, P.F. Além dos “achismos” e das evidências anedóticas: Medindo a eficiência dos tribunais brasileiros. Econ. Apl. 2012, 16, 643–663. [Google Scholar] [CrossRef]
- Corrar, L.; Paulo, E.; Dias Filho, J.M.; Rodrigues, A. Análise Multivariada Para os Cursos de Administração, Ciências Contábeis e Economia; Atlas: São Paulo, Brazil, 2009; pp. 432–458. [Google Scholar]
- Fávero, L.P.; Belfiore, P. Manual de Análise de Dados: Estatística e Modelagem Multivariada com Excel®, SPSS® e Stata® (Vol. 1); Elsevier Brasil: Rio de Janeiro, Brazil, 2017; pp. 309–3075. [Google Scholar]
- Hu, H.; Liu, J.; Zhang, X.; Fang, M. An Effective and Adaptable K-means Algorithm for Big Data Cluster Analysis. Pattern Recognit. 2023, 139, 109404. [Google Scholar] [CrossRef]
- Simard, R.; L’Ecuyer, P. Computing the Two-Sided Kolmogorov-Smirnov Distribution. J. Stat. Softw. 2011, 39. [Google Scholar] [CrossRef]
- Khan, R.A.; Ahmad, F. Power Comparison of Various Normality Tests. Pak. J. Stat. Oper. Res. 2017, 11. [Google Scholar] [CrossRef]
- Costa, G.D.O. Curso de Estatística Inferencial e Probabilidades: Teoria e Prática; Atlas: São Paulo, Brazil, 2012; pp. 71–87. [Google Scholar]
- Fralick, D.; Zheng, J.Z.; Wang, B.; Tu, X.M.; Feng, C. The Differences and Similarities Between Two-Sample T-Test and Paired T-Test. Shanghai Arch. Psychiatry 2017, 29, 184–188. [Google Scholar] [CrossRef]
- Summa, R.F.; Macrini, L. Os determinantes da inflação brasileira recente: Estimações utilizando redes neurais. Nova Econ. 2014, 24, 279–296. [Google Scholar] [CrossRef]
- Haykin, S. Neural networks: Principles and practice. Bookman 2001, 11, 900. [Google Scholar]
- Guimarães, L.M.S.; Meireles, M.R.G.; de Almeida, P.E.M. Avaliação das etapas de pré-processamento e de treinamento em algoritmos de classificação de textos no contexto da recuperação da informação. Perspect. Em Ciência Da Informação 2019, 24, 169–190. [Google Scholar] [CrossRef]
- Cunha, D.N.; Almeida JA de Carvalho, T.H.D.; Prestes, J. Reflexões sobre o viés de publicação: Um guia para praticantes de estatística para a análise de dados e uso inapropriado do coeficiente de correlação em ciências da saúde. Rev. Bras. Ciência E Mov. 2020, 4, 194–201. [Google Scholar]
- Gomes, A.O.; Alves, S.T.; Silva, J.T. Effects of investment in information and communication technologies on productivity of courts in Brazil. Gov. Inf. Q. 2018, 35, 480–490. [Google Scholar] [CrossRef]
- Renosto, A.; Biz, P.; Hennington, É.A.; Pattussi, M.P. Confiabilidade teste-reteste do Índice de Capacidade para o Trabalho em trabalhadores metalúrgicos do Sul do Brasil. Rev. Bras. De Epidemiol. 2009, 12, 217–225. [Google Scholar] [CrossRef]
- Leotti, V.B.; Coster, R.; Riboldi, J. Normalidade de variáveis: Métodos de verificação e comparação de alguns testes não-paramétricos por simulação. Rev. HCPA. Porto Alegre. 2012, 32, 227–234. [Google Scholar]
- Filho, D.B.F.F.B.F.; Júnior, J.A.S. Desvendando os Mistérios do Coeficiente de Correlação de Pearson. Rev. Política Hoje. 2009, 18, 32. [Google Scholar] [CrossRef]
- Júnior, J.B.A.C.; Souza, C.C. Aplicação de redes neurais artificiais na previsão do produto interno bruto do Mato Grosso do Sul em função da produção de cana-de-açúcar, açúcar e etanol. Rev. Ibero-Am. De Ciências Ambient. 2019, 10, 218–230. [Google Scholar]
- Silva, D.C.G. Predição de Estresse em Ovelhas Prenhas e Lactantes com o Uso de Redes Neurais Artificiais. Ens. E Ciência C Biológicas Agrárias E Da Saúde 2021, 25, 160–165. [Google Scholar] [CrossRef]
- Sadek, M.T.A. Acesso à justiça: Um direito e seus obstáculos. Rev. USP 2014, 101, 55–66. [Google Scholar] [CrossRef]
- Larry Mays, G.; Taggart, W.A. Court delay: Policy implications for court managers. Crim. Justice Policy Rev. 1986, 1, 198–210. [Google Scholar] [CrossRef]
- Cross, F.B.; Donelson, D.C. Creating Quality Courts. J. Empir. Leg. Stud. 2010, 7, 490–510. [Google Scholar] [CrossRef]
- Procopiuck, M. Information technology and time of judgment in specialized courts: What is the impact of changing from physical to electronic processing? Gov. Inf. Q. 2018, 35, 491–501. [Google Scholar] [CrossRef]


| Performance Dimension | Main Category of Interest | Main Variables Used |
|---|---|---|
| Efficiency | Productivity | Number of completed processes Number of judgments executed |
| Celerity | Duration of processes | Processing time for court proceedings Processing time for administrative procedures |
| Effectiveness | Trust | Number of human rights violations Number of corruption cases |
| Quality | Merits of decisions | Number of published decisions Number of reformed decisions |
| Independence | Autonomy | Number of decisions against the government Number of financial resources allocated |
| Access | Coverage | Number of judges per capita Number of people served |
| Minimum | Maximum | Average | Standard Deviation | |
|---|---|---|---|---|
| Total spending (BRL) | 4,859,285,529.5 | 247,818,421,938.8 | 33,495,395,051.0 | 48,583,092,528.9 |
| Published judgments | 61,310.00 | 14,564,073.00 | 1,410,647.37 | 2,830,971.00 |
| Filed lawsuits | 30,235.00 | 2,735,712.00 | 479,817.89 | 642,841.57 |
| Instruction hearings | 126 | 15,344.00 | 3774.96 | 3622.97 |
| Preliminary hearings | 15 | 22,599.00 | 1942.63 | 4762.09 |
| Decisions | - (1) | 146,672.00 | 25,248.93 | 31,879.73 |
| Orders | 3620.00 | 196,032.00 | 40,975.74 | 58,250.57 |
| Sentences | 20,299.00 | 2,680,256.00 | 376,757.26 | 564,348.61 |
| Second degree commissioned positions | 50 | 2273.00 | 383.33 | 467 |
| Intern expenses | 139,832.30 | 67,538,124.81 | 17,979,692.62 | 21,444,026.16 |
| Total personnel asset expenses (BRL) | 199,044,748.40 | 7,738,912,899.00 | 1,308,271,480.97 | 1,504,857,626.50 |
| First degree personal asset expenses (BRL) | 177,374,391.29 | 6,627,847,870.00 | 1,128,791,512.09 | 1,295,486,987.66 |
| Second degree personal asset expenses (BRL) | 15,923,579.87 | 1,111,065,029.00 | 79,479,968.89 | 216,244,170.30 |
| Total workforce (ftt) | 1373 | 67,799 | 10,916.15 | 13,362.53 |
| Magistrate productivity index (ipm) | 557.8 | 3723.59 | 1456.19 | 613.73 |
| Server productivity index (ips) | 36.26 | 225.9 | 98.05 | 41.3 |
| Clusters | States |
|---|---|
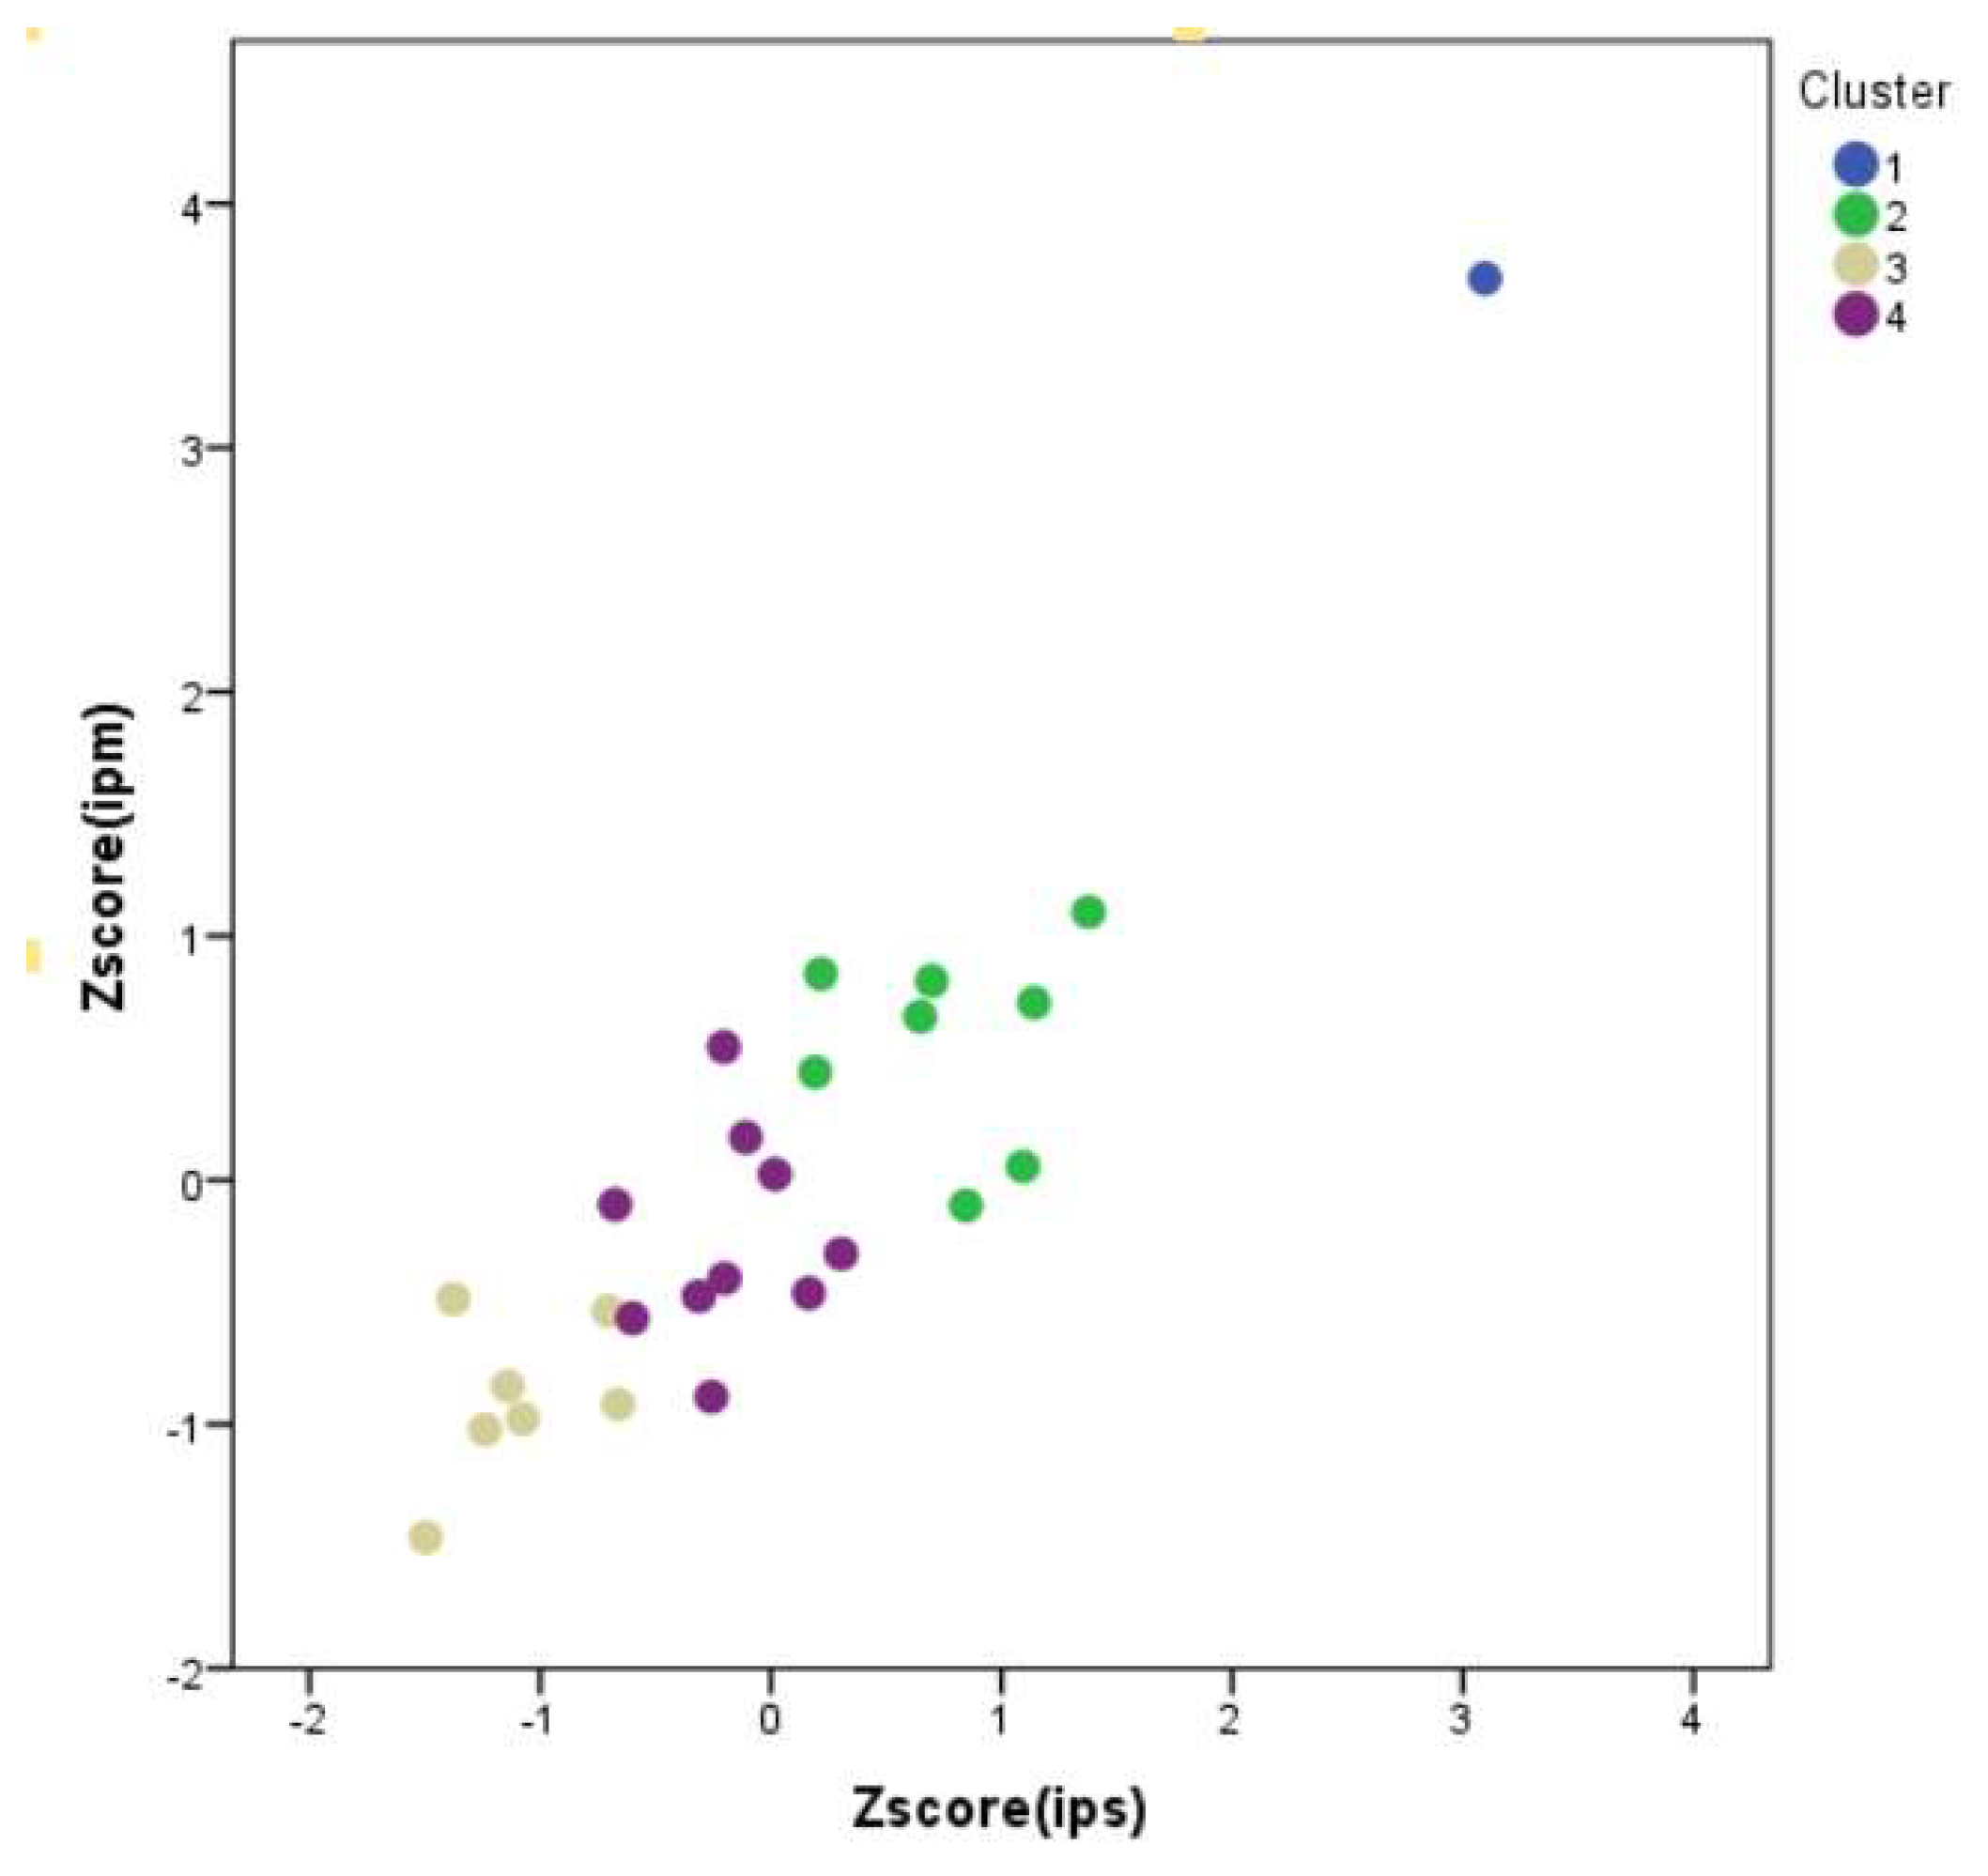
| Cluster 1 | RJ |
| Cluster 2 | RS, BA, PR, PE, SC, GO, MT, and AL |
| Cluster 3 | DF, PA, PI, TO, AC, AP, and RR |
| Cluster 4 | MG, CE, AM, MA, ES, PB, SE, MS, RN, and RO |
| Kolmogorov–Smirnov | Shapiro–Wilk | ||||||
|---|---|---|---|---|---|---|---|
| Statistic | df | Sig. | Statistic | df | Sig. | ||
| Cluster 2 | Zscore(ipm) | 0.222 | 8 | 0.200 * | 0.923 | 8 | 0.455 |
| Zscore(ips) | 0.155 | 8 | 0.200 * | 0.941 | 8 | 0.617 | |
| Cluster 3 | Zscore(ipm) | 0.204 | 7 | 0.200 * | 0.931 | 7 | 0.561 |
| Zscore(ips) | 0.186 | 7 | 0.200 * | 0.923 | 7 | 0.496 | |
| Cluster 4 | Zscore(ipm) | 0.154 | 10 | 0.200 * | 0.97 | 10 | 0.886 |
| Zscore(ips) | 0.142 | 10 | 0.200 * | 0.966 | 10 | 0.856 | |
| Paired Differences | t | df | Sig. | |||||
|---|---|---|---|---|---|---|---|---|
| Average | Standard Deviation | Mean Standard Error | 95% Confidence Interval | |||||
| Lower | Upper | |||||||
| Cluster 2 vs. Cluster 3 | −3.34097 | 0.64493 | 0.24376 | −3.93743 | −2.74451 | −13,706 | 6 | 0.00001 |
| Cluster 4 vs. Cluster 2 | 1.31586 | 0.51363 | 0.19414 | 0.84082 | 1.79089 | 6778 | 6 | 0.00050 |
| Cluster 3 vs. Cluster 4 | 1.92854 | 0.89811 | 0.31753 | 1.17770 | 2.67937 | 6.074 | 7 | 0.00050 |
| Group 2 | Group 3 | Group 4 | ||||||||||
|---|---|---|---|---|---|---|---|---|---|---|---|---|
| ftt | dpea | Total Productivity | Total Expenditure | ftt | dpea | Total Productivity | Total Expenditure | ftt | dpea | Total Productivity | Total Expenditure | |
| ftt | 1 | 1 | 1 | |||||||||
| dpea | 0.731 * | 1 | 0.974 ** | 1 | 0.994 ** | 1 | ||||||
| Total productivity | −0.049 | 0.084 | 1 | 0.153 | 0.102 | 1 | 0.190 | 0.221 | 1 | |||
| Total expenditure | 0.804 * | 0.748 * | −0.126 | 1 | 0.971 ** | 0.997 ** | 0.068 | 1 | 0.988 ** | 0.992 ** | 0.253 | 1 |
| Group 2 (%) | Group 3 (%) | Group 4 (%) | ||
|---|---|---|---|---|
| Sample | Training | 87.5 | 71.4 | 60.0 |
| Tests | 12.5 | 28.6 | 40.0 |
| Group 2 | Group 3 | Group 4 | ||
|---|---|---|---|---|
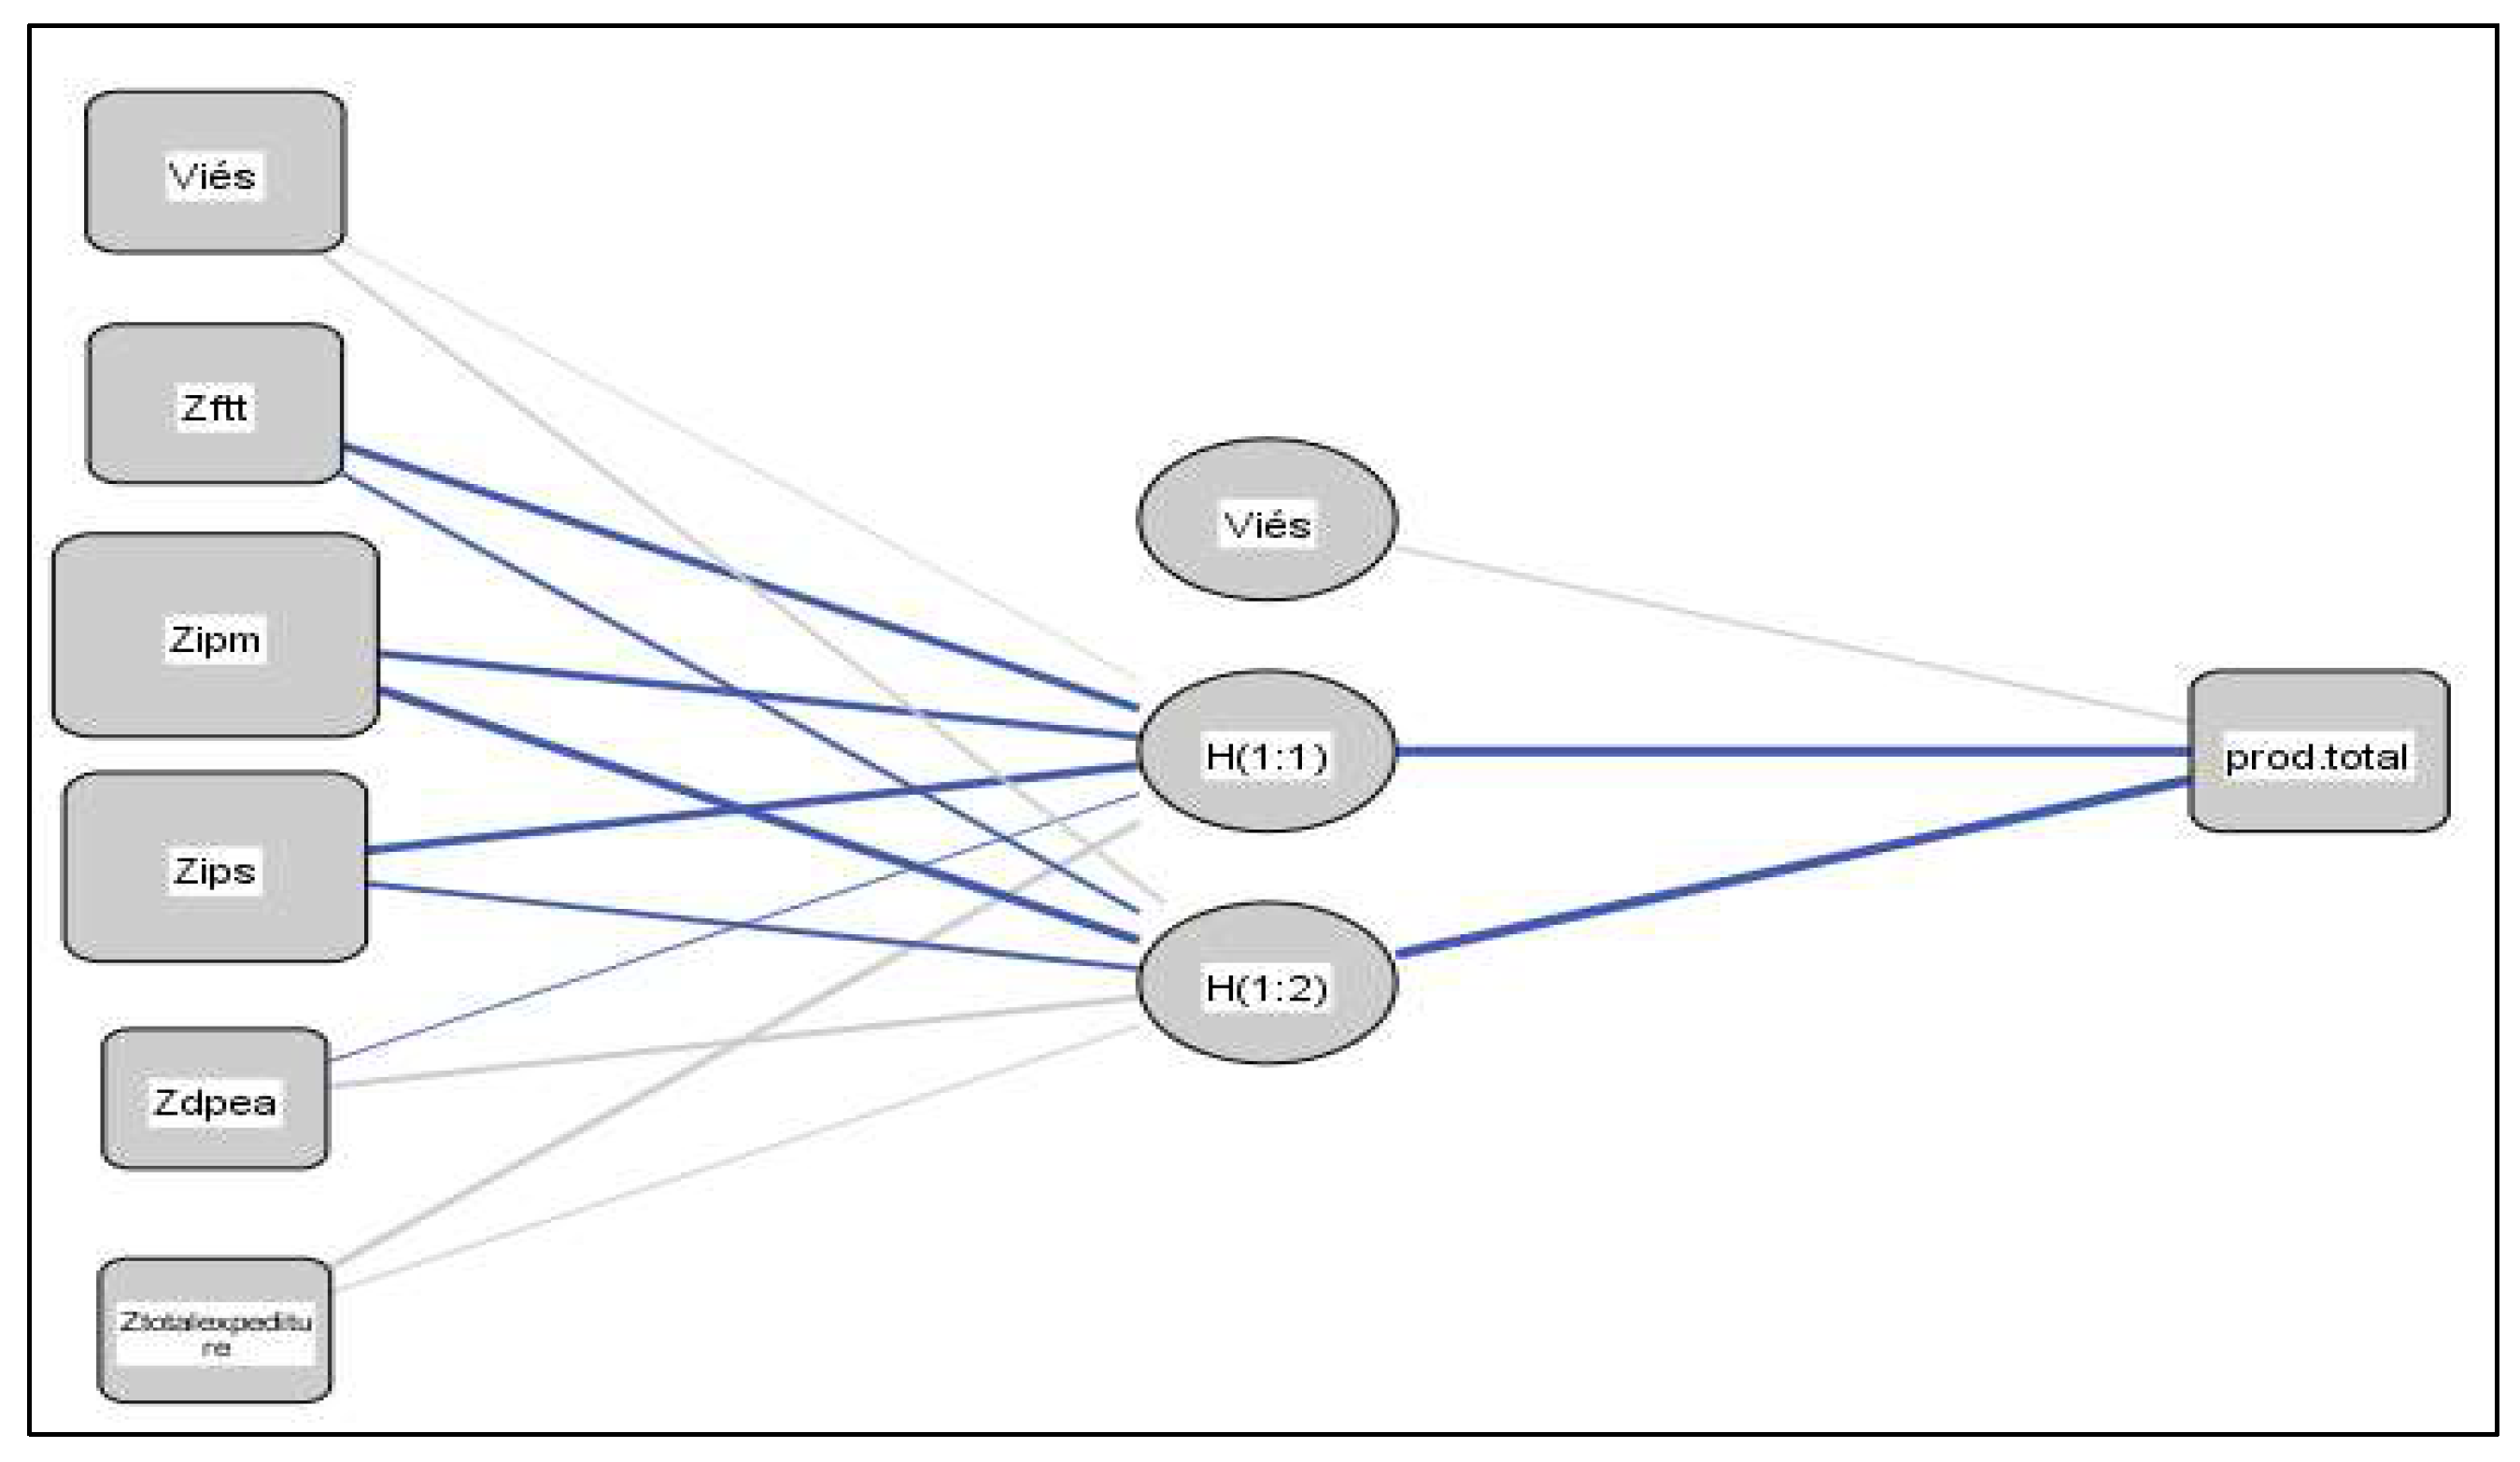
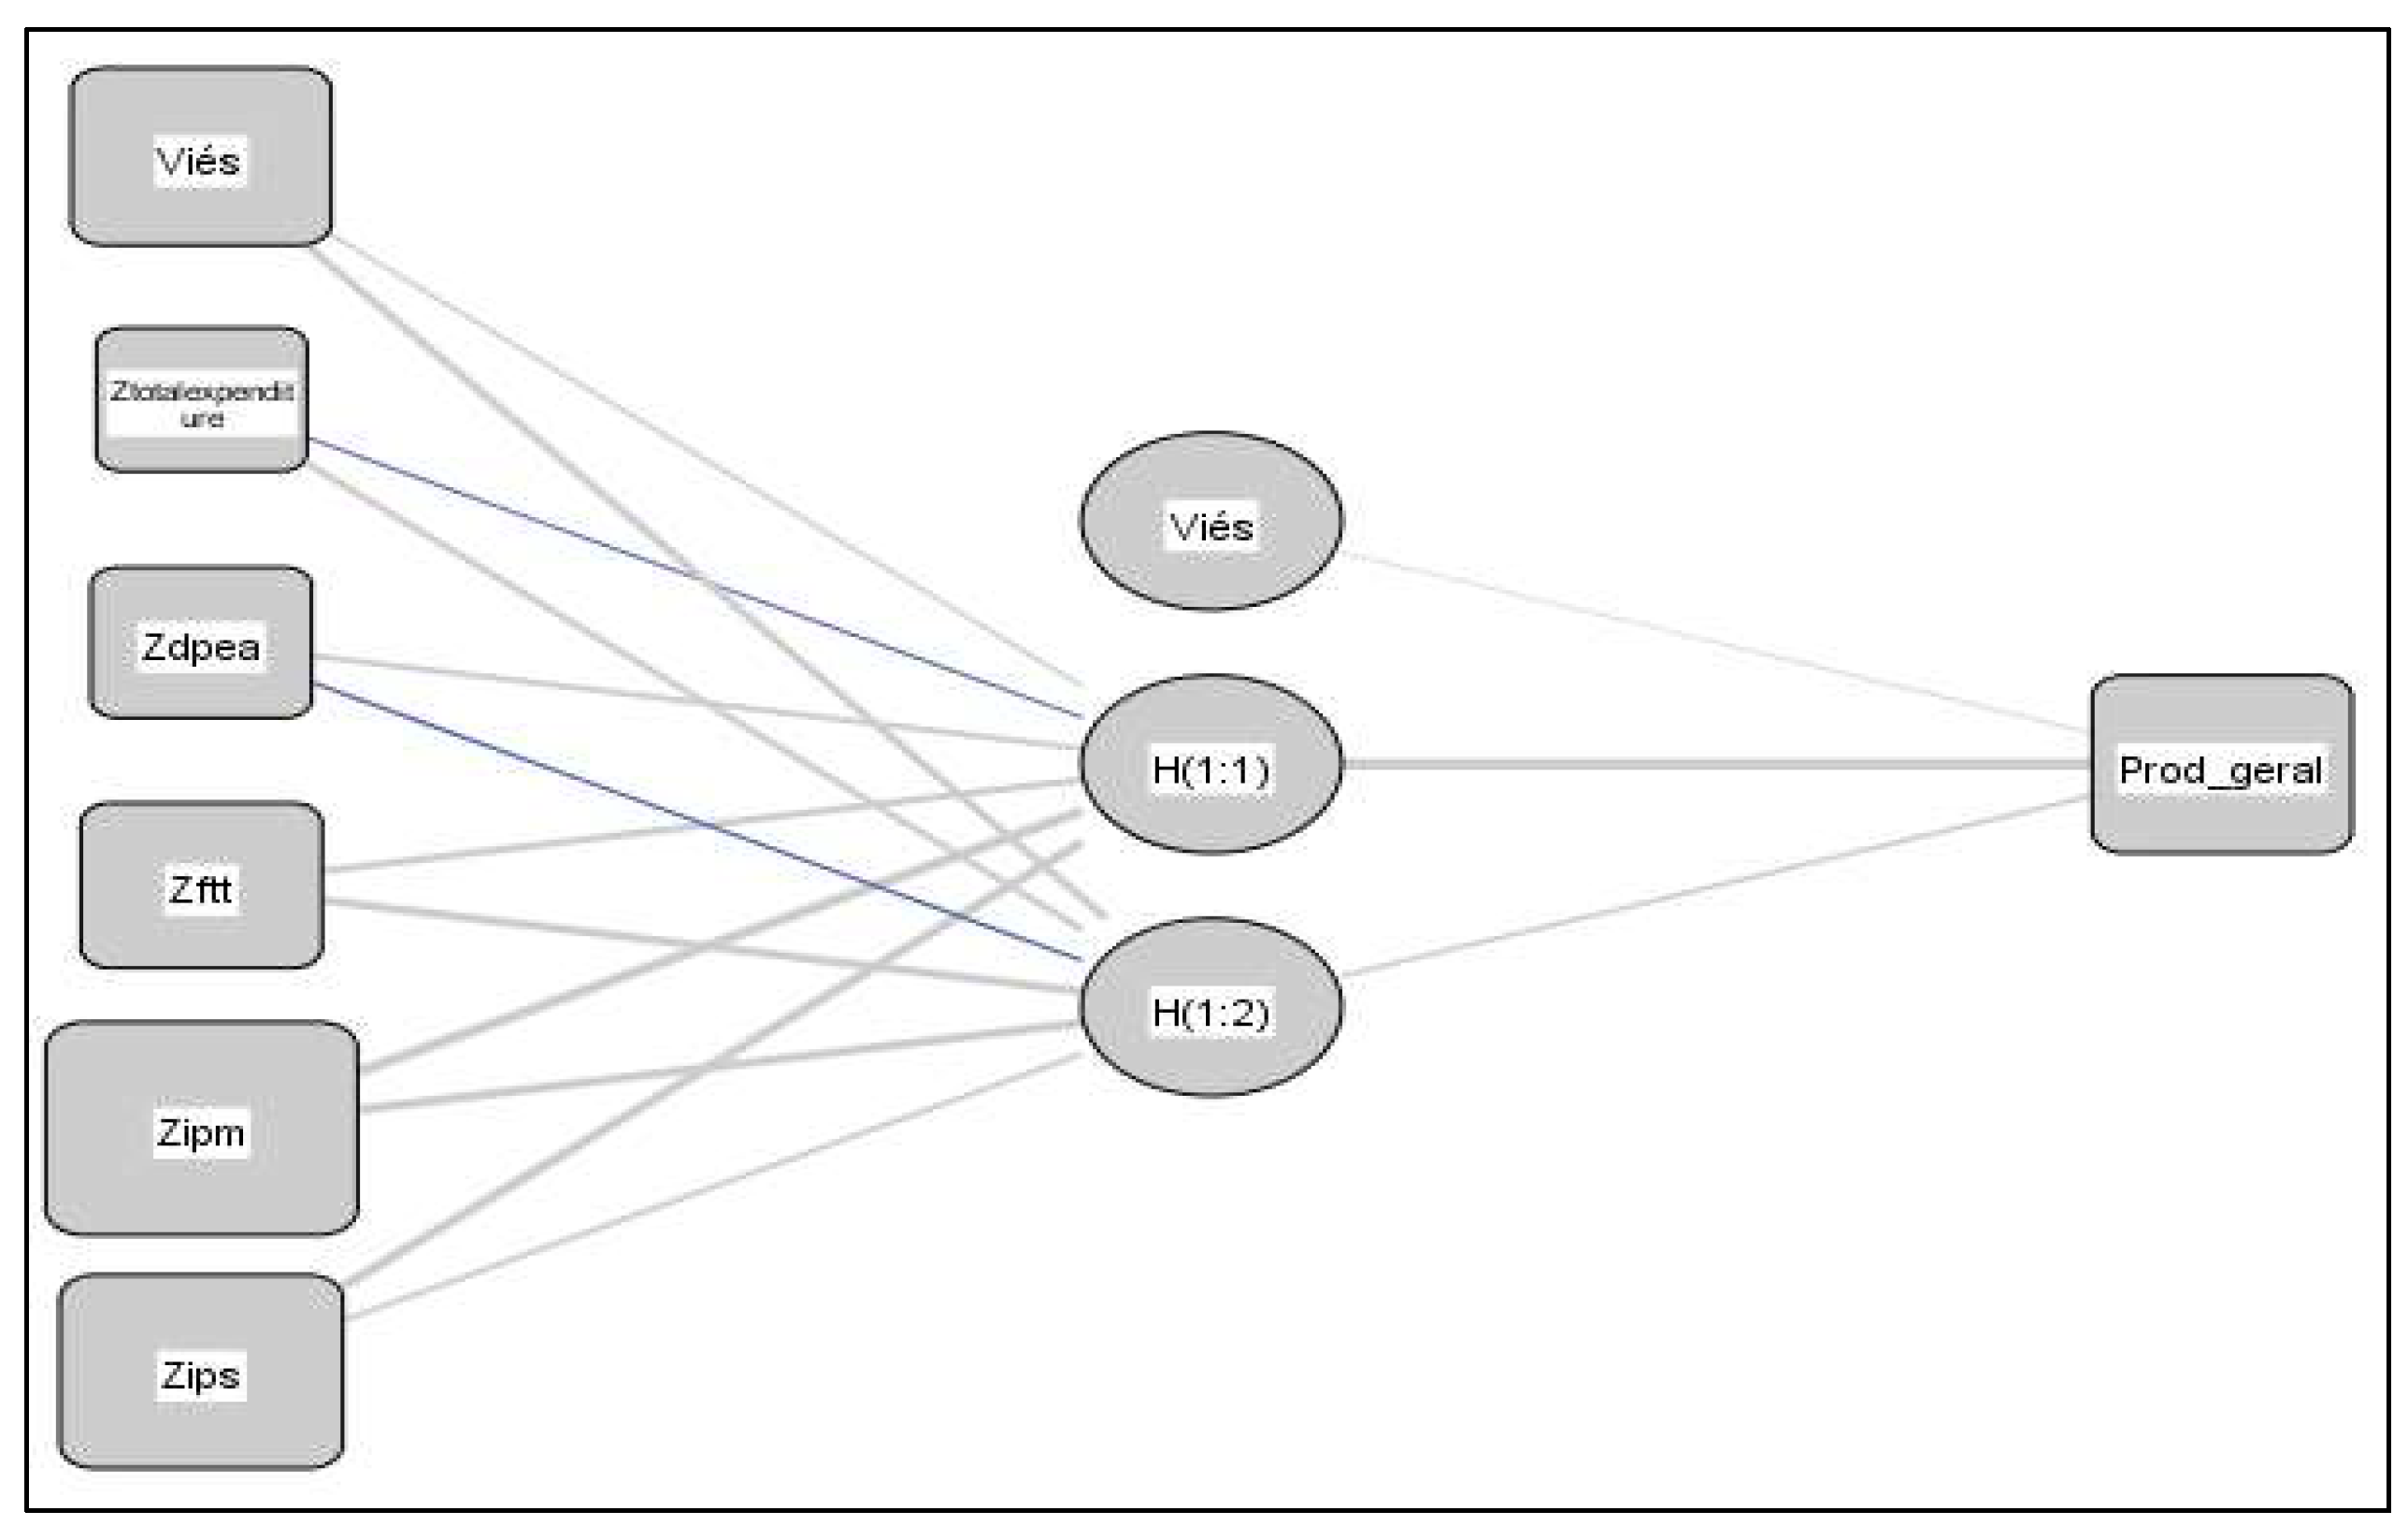
| Input layer | Units (excluding bias) | 5 | 5 | 5 |
| Rescheduling of variables | Normalized | Normalized | Normalized | |
| Hidden layers | Hidden layers | 1 | 1 | 1 |
| Hidden layer units | 3 | 2 | 3 | |
| Activation function | Hyperbolic Tangent | Hyperbolic Tangent | Hyperbolic Tangent | |
| Output layer | Rescheduling of variables | Standardized | Standardized | Standardized |
| Activation function | Identity | Identity | Identity | |
| Group 2 | Group 3 | Group 4 | ||
|---|---|---|---|---|
| Training | Sum of squared errors | 0.0014 | 0.0840 | 0.0940 |
| Relative error | 0% | 4% | 4% | |
| Tests | Sum of squared errors | 0.5113 | 0.0010 | 0.2060 |
| Relative error | 10% | 0% | 4% | |
| Predictor | Group 2 | Group 3 | Group 4 | |||||||
|---|---|---|---|---|---|---|---|---|---|---|
| Hidden Layer 1 | Output Layer | Hidden Layer 1 | Output Layer | Hidden Layer 1 | Output Layer | |||||
| H(1:1) | H(1:2) | H(1:3) | Total | H(1:1) | H(1:2) | Total | H(1:1) | Total | ||
| Input layer | (Bias) | 0.825 | 0.224 | −0.231 | 0.675 | 0.411 | −0.797 | |||
| Ztotalexpense | 0.255 | 0.188 | −0.042 | 0.198 | 0.214 | 0.813 | ||||
| Zdpea | −0.469 | −0.159 | 0.023 | 0.162 | −0.300 | −0.137 | ||||
| Zftt | 0.266 | 0.029 | −0.503 | −0.263 | −0.162 | 0.257 | ||||
| Zipm | −1.012 | 0.858 | 0.294 | −0.903 | 0.476 | 0.978 | ||||
| Zips | −0.716 | 0.093 | 0.542 | −1.012 | 0.106 | 1368 | ||||
| Hidden layer 1 | (Bias) | −0.378 | −0.697 | −0.961 | ||||||
| H(1:1) | −1.818 | −1.693 | 2.276 | |||||||
| H(1:2) | 0.419 | 0.393 | ||||||||
| H(1:3) | 0.214 | |||||||||
Disclaimer/Publisher’s Note: The statements, opinions and data contained in all publications are solely those of the individual author(s) and contributor(s) and not of MDPI and/or the editor(s). MDPI and/or the editor(s) disclaim responsibility for any injury to people or property resulting from any ideas, methods, instructions or products referred to in the content. |
© 2023 by the authors. Licensee MDPI, Basel, Switzerland. This article is an open access article distributed under the terms and conditions of the Creative Commons Attribution (CC BY) license (https://creativecommons.org/licenses/by/4.0/).
Share and Cite
Vasconcelos, F.F.; Sátiro, R.M.; Fávero, L.P.L.; Bortoloto, G.T.; Corrêa, H.L. Analysis of Judiciary Expenditure and Productivity Using Machine Learning Techniques. Mathematics 2023, 11, 3195. https://doi.org/10.3390/math11143195
Vasconcelos FF, Sátiro RM, Fávero LPL, Bortoloto GT, Corrêa HL. Analysis of Judiciary Expenditure and Productivity Using Machine Learning Techniques. Mathematics. 2023; 11(14):3195. https://doi.org/10.3390/math11143195
Chicago/Turabian StyleVasconcelos, Fernando Freire, Renato Máximo Sátiro, Luiz Paulo Lopes Fávero, Gabriela Troyano Bortoloto, and Hamilton Luiz Corrêa. 2023. "Analysis of Judiciary Expenditure and Productivity Using Machine Learning Techniques" Mathematics 11, no. 14: 3195. https://doi.org/10.3390/math11143195
APA StyleVasconcelos, F. F., Sátiro, R. M., Fávero, L. P. L., Bortoloto, G. T., & Corrêa, H. L. (2023). Analysis of Judiciary Expenditure and Productivity Using Machine Learning Techniques. Mathematics, 11(14), 3195. https://doi.org/10.3390/math11143195


