You are currently viewing a new version of our website. To view the old version click .
Mathematics
  • Article
  • Open Access

20 July 2023

High-Performance Time Series Anomaly Discovery on Graphics Processors

and
Department of System Programming, South Ural State University, 76, Lenin Prospekt, 454080 Chelyabinsk, Russia
*
Authors to whom correspondence should be addressed.
These authors contributed equally to this work.
This article belongs to the Special Issue Parallel Computing and Applications

Abstract

Currently, discovering subsequence anomalies in time series remains one of the most topical research problems. A subsequence anomaly refers to successive points in time that are collectively abnormal, although each point is not necessarily an outlier. Among numerous approaches to discovering subsequence anomalies, the discord concept is considered one of the best. A time series discord is intuitively defined as a subsequence of a given length that is maximally far away from its non-overlapping nearest neighbor. Recently introduced, the MERLIN algorithm discovers time series discords of every possible length in a specified range, thereby eliminating the need to set even that sole parameter to discover discords in a time series. However, MERLIN is serial, and its parallelization could increase the performance of discord discovery. In this article, we introduce a novel parallelization scheme for GPUs called PALMAD, parallel arbitrary length MERLIN-based anomaly discovery. As opposed to its serial predecessor, PALMAD employs recurrent formulas we have derived to avoid redundant calculations, and advanced data structures for the efficient implementation of parallel processing. Experimental evaluation over real-world and synthetic time series shows that our algorithm outperforms parallel analogs. We also apply PALMAD to discover anomalies in a real-world time series, employing our proposed discord heatmap technique to illustrate the results.

1. Introduction

Over the past decades, time series data have become ubiquitous in diverse spheres of human activity: industry, healthcare, science, social, and so on. Currently, discovering anomalies (or outliers as a synonym) in time series remains one of the most topical research problems. In a time series, point and subsequence anomalies can serve as the aims to be detected [1]. The former defines a datum that deviates in a specific time instant when compared either to the other values in the time series or to its neighboring points. The latter refers to successive points in time whose collective behavior is unusual, although each observation individually is not necessarily a point anomaly. Subsequence anomaly detection is more challenging due to the need to take into account the subsequence length among other aspects [1].
Among a wide spectrum of analytical and neural-network-based approaches to time series subsequence anomaly detection [1,2,3], the discord concept [4] is considered one of the best [5,6]. A time series discord is intuitively defined as a subsequence that is maximally far away from its non-overlapping nearest neighbor. Discords look attractive to an end-user since they require only one parameter to be specified, the subsequence length. However, the application of discords is reduced by sensitivity to this single user choice. A straightforward solution to this problem, namely, discovering discords of all the possible lengths and then selecting the best discords with respect to some measure, looks computationally prohibitive.
Nevertheless, the recently introduced MERLIN algorithm [7] can efficiently and exactly discover discords of every possible length in a specified range, being ahead of competitors in terms of accuracy and performance. Thus, MERLIN removes the need for an end-user to set even the above-mentioned sole parameter to discover discords in a time series. MERLIN employs repeated calls of the DRAG algorithm [8] that discovers discords of a given length with a distance of at least r to their nearest neighbors, and adaptive selection of the parameter r. However, multiple calls of the above sub-algorithm result in calculations that are partially repeated, and being executed at once would increase the performance of MERLIN. Furthermore, the MERLIN algorithm is serial and looks attractive for parallelization to increase the performance of discord discovery.
In this study, we address the problem of parallelization of the MERLIN algorithm for the discovery of arbitrary length discords on a GPU, continuing our research on accelerating various time series mining tasks with parallel architectures and in-database time series analysis [9,10,11,12,13,14,15,16]. The article’s contribution can be summarized as follows:
  • We perform a thorough review of works related to discord-based approaches to discovering time series anomalies and their parallelization for diverse hardware platforms.
  • Based on MERLIN [7], we introduce the parallel algorithm PALMAD (parallel arbitrary length MERLIN-based anomaly discovery) for the discovery of arbitrary length discords on a graphics processor. As per the review above, PALMAD is the sole parallel algorithm capable of discovering all discords with lengths within a specified range, rather than discords of a specific length. In our algorithm, we employ our derived recurrent formulas on mean values and standard deviations of subsequences to avoid redundant calculations and utilize array-based data structures to provide efficient parallel processing.
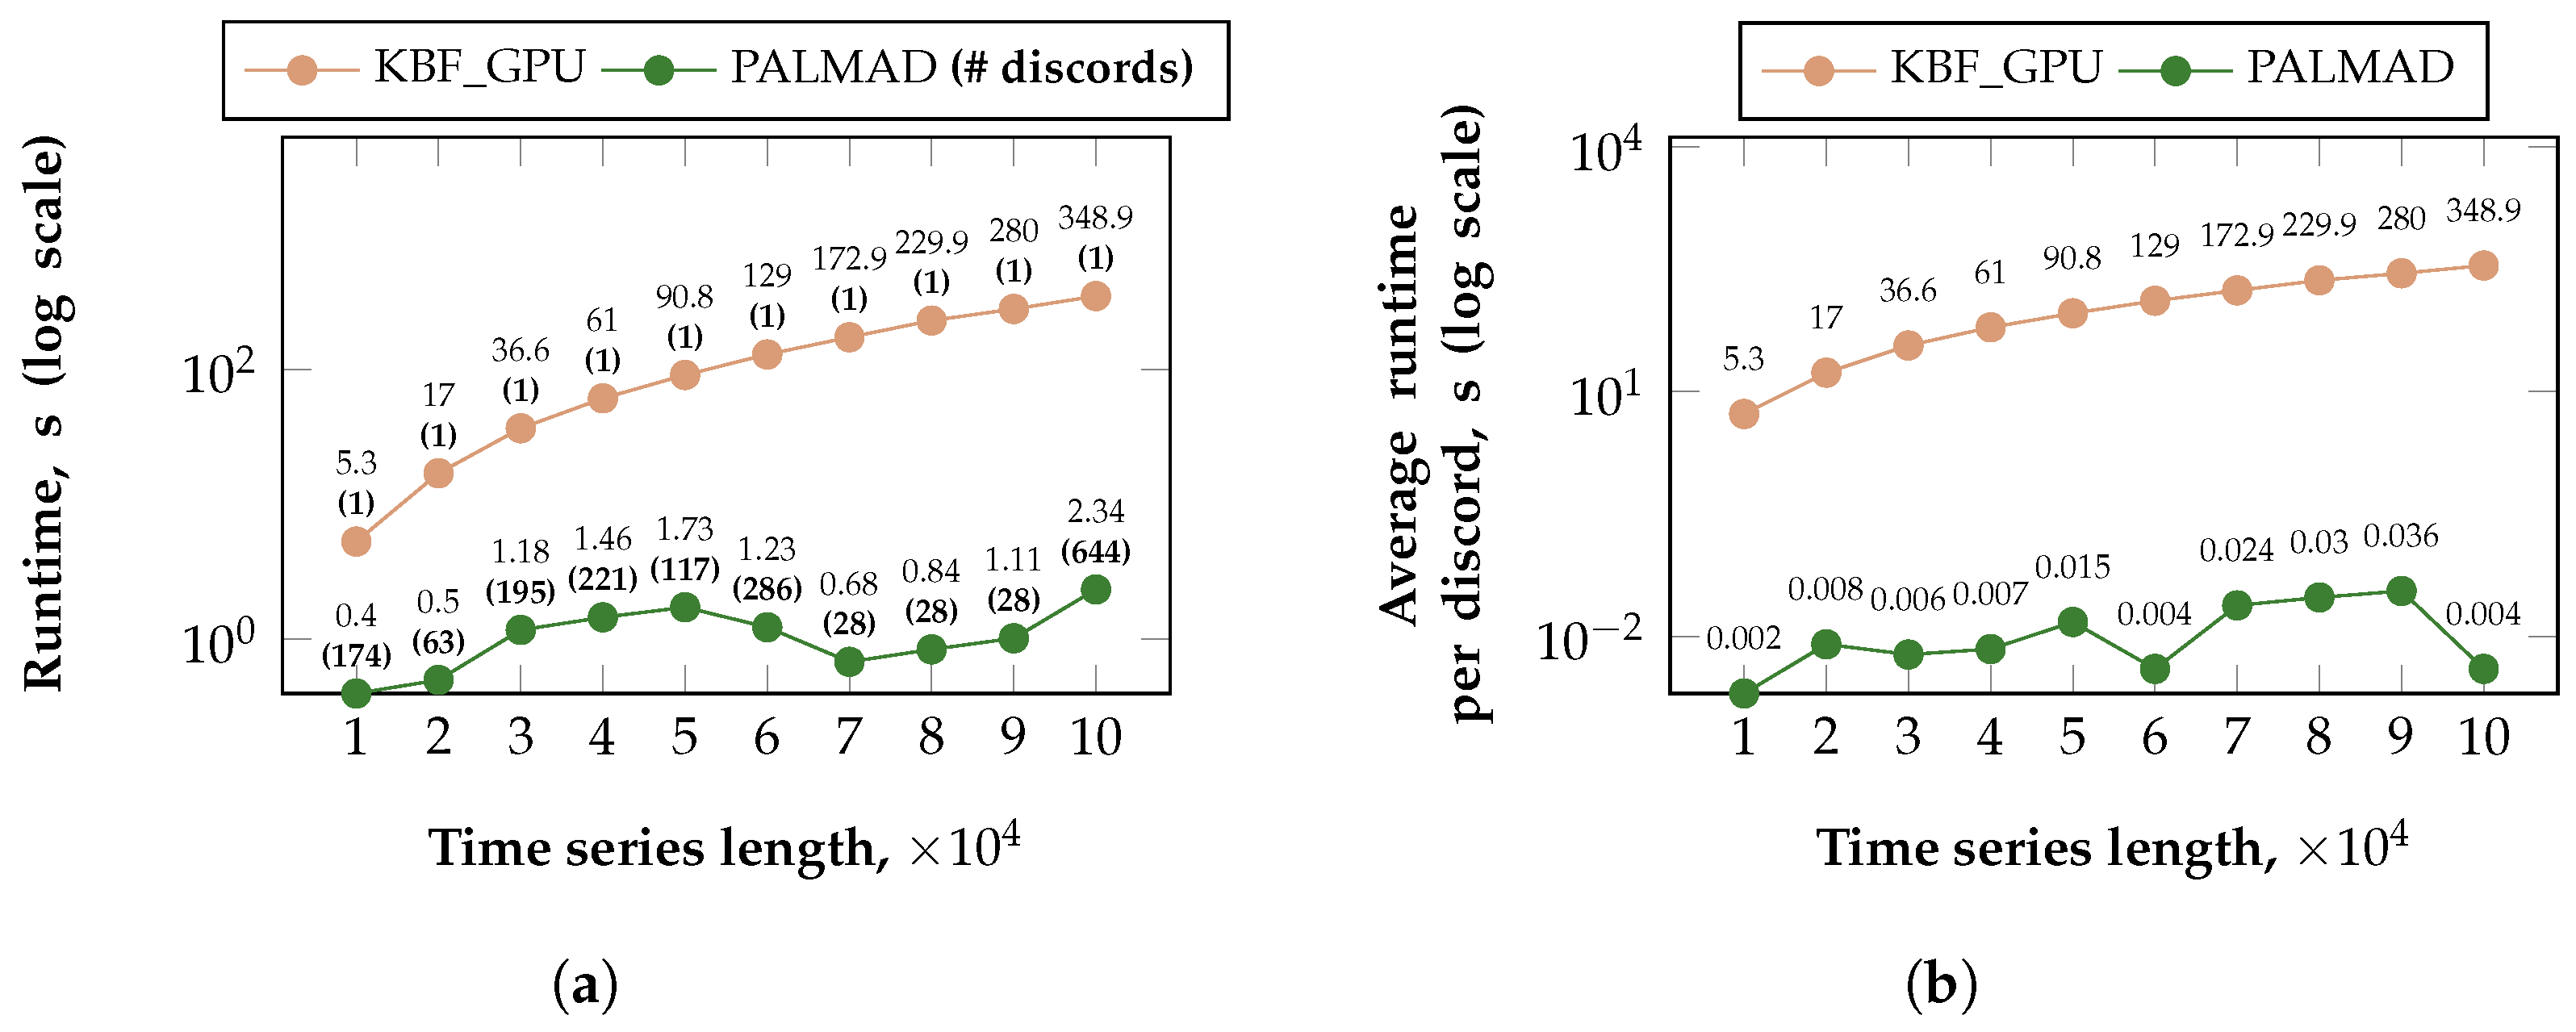
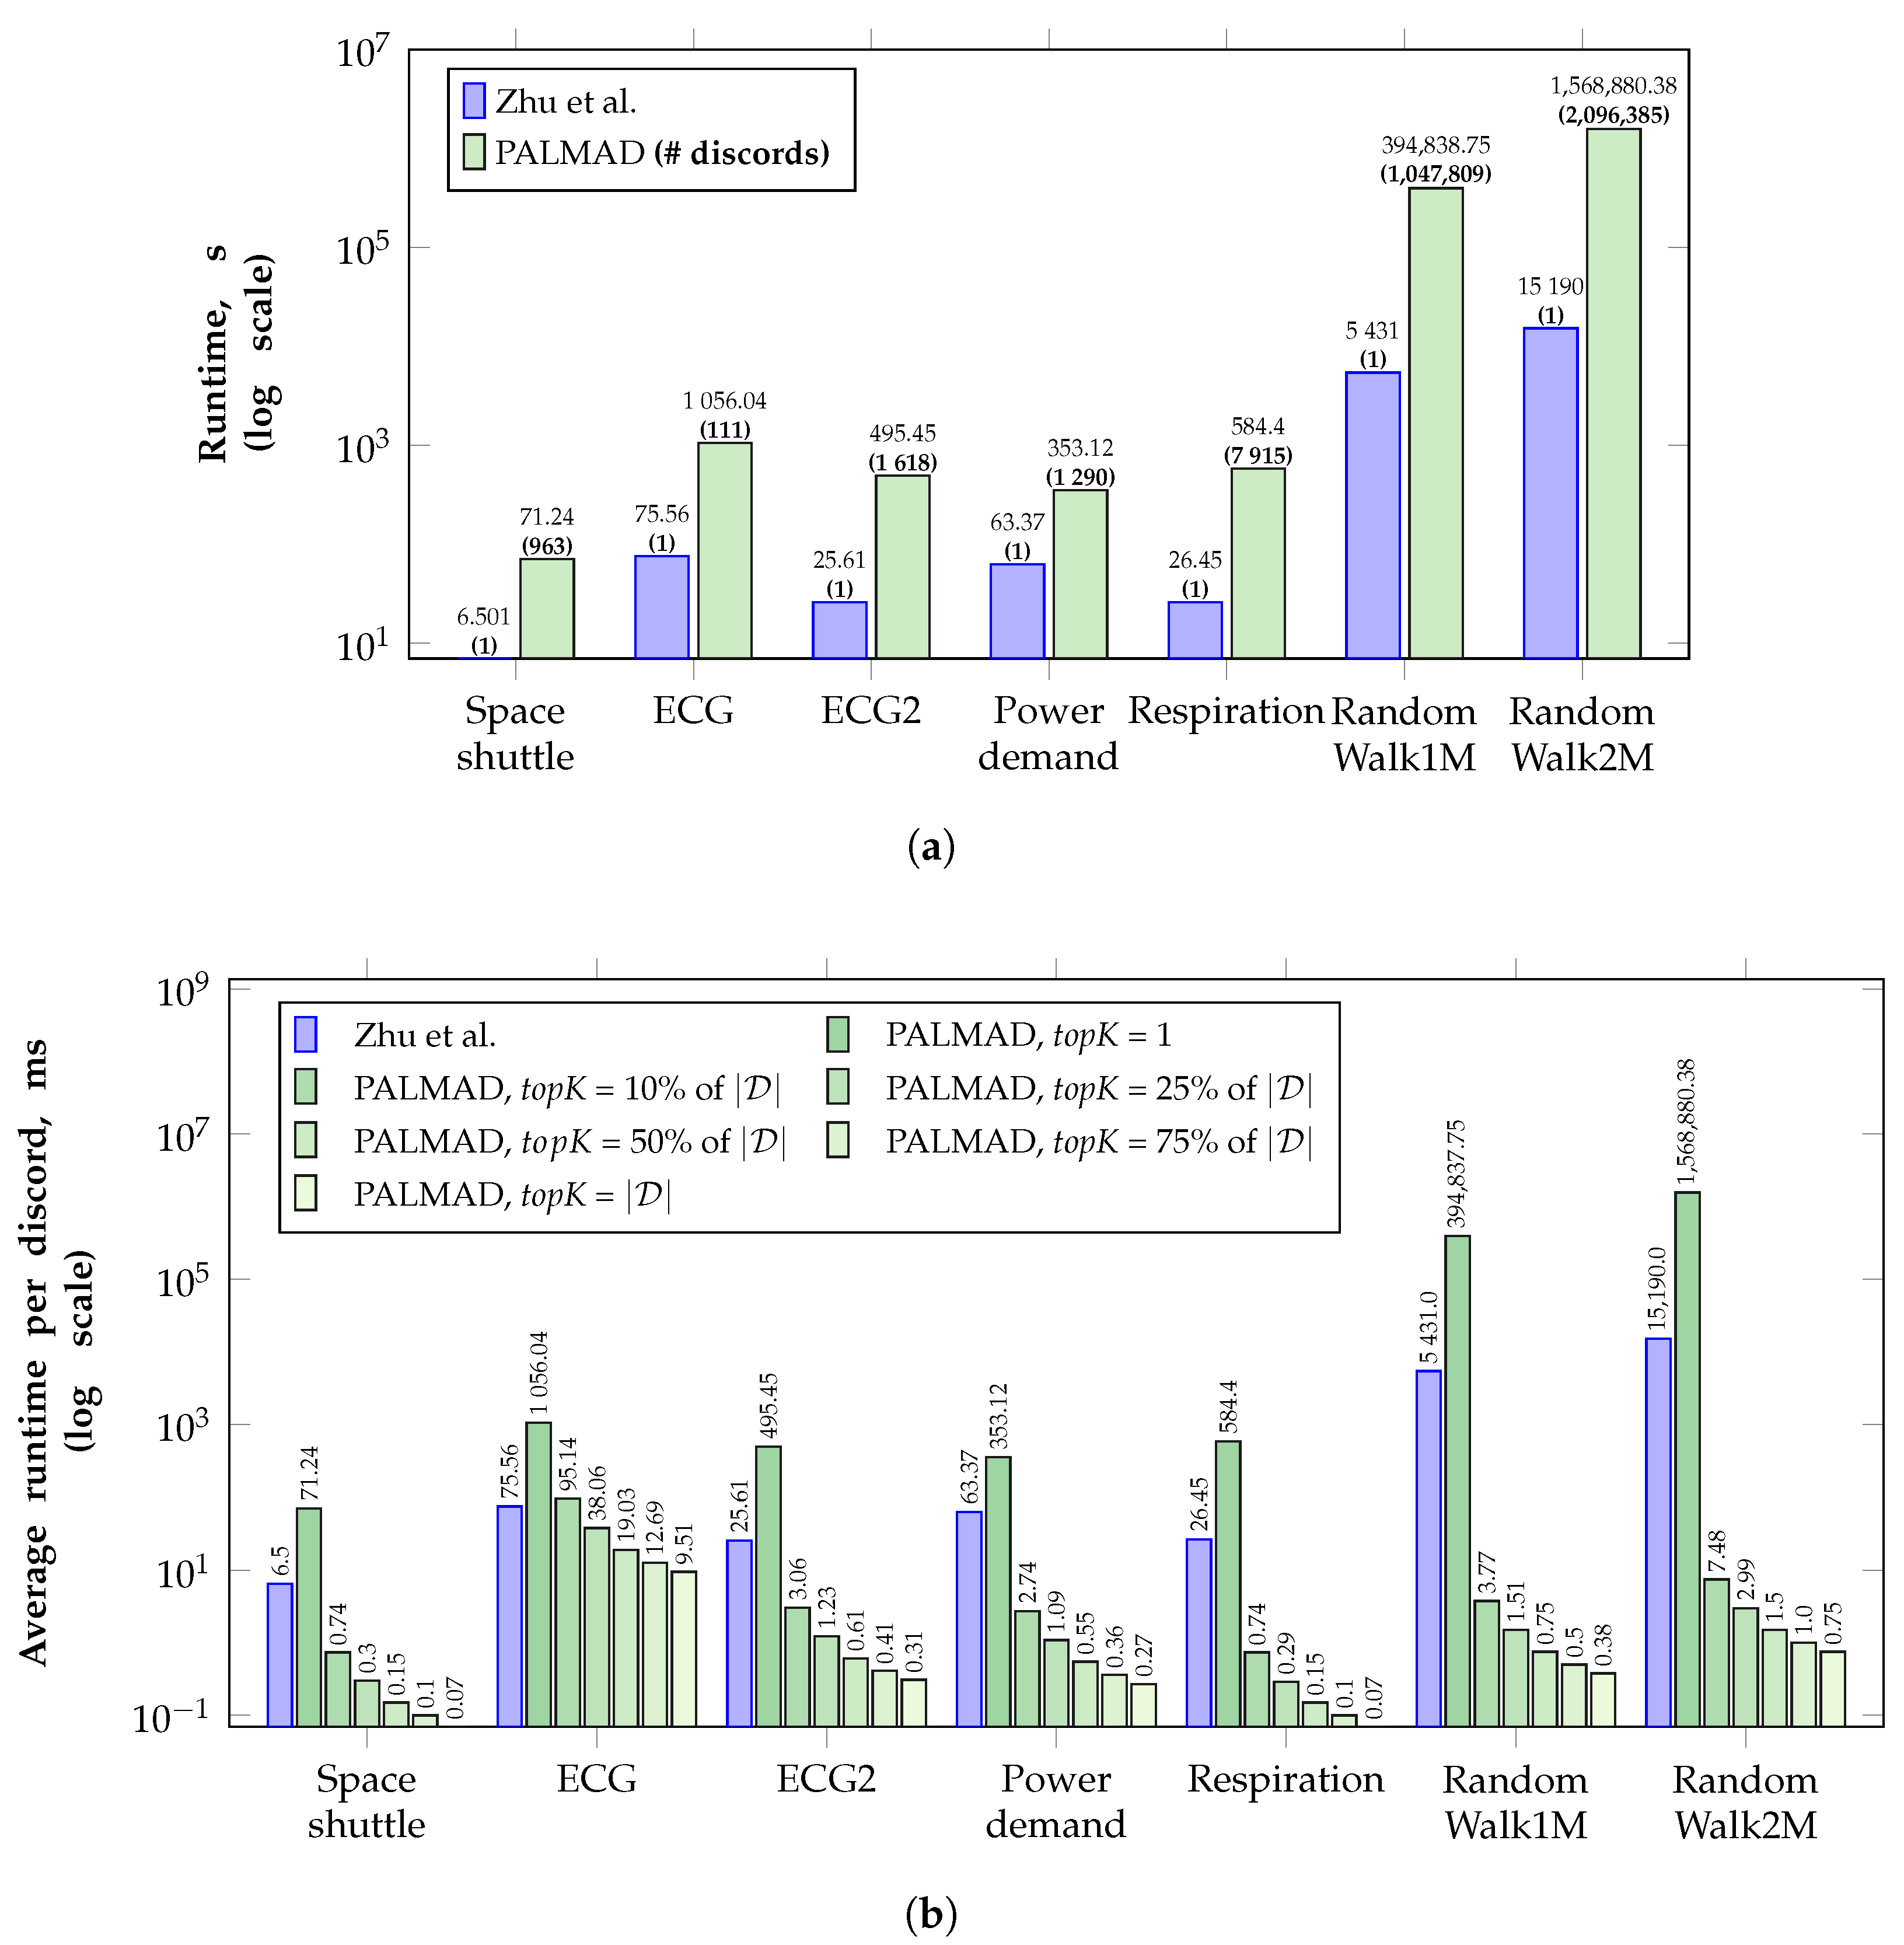
  • We carry out extensive experiments to evaluate our algorithm over five real-world and two synthetic time series against two state-of-the-art parallel analogs that discover discords of a specific length. To provide a fair comparison, we limit the range of discord lengths by one discord and measure the average running time to discover one discord. In the experiments, PALMAD significantly outran its closest rival in terms of the average running time to discover one discord: by at least two times and three orders of magnitude in the case of the real and synthetic time series, respectively.
  • We apply PALMAD to anomaly discovery in a real-world time series from a smart heating control system, employing our proposed discord heatmap technique to illustrate the results. In addition, we establish a repository [17] that contains the algorithm’s source code, data, etc., to facilitate the reproducibility of our study.
The remainder of the article is organized as follows. In Section 2, we discuss related works. Section 3 contains notation and formal definitions, along with a short description of the original serial algorithm. Section 4 introduces the proposed parallel algorithm to discover time series discords on a GPU. In Section 5, we give the results and discussion of the experimental evaluation of our algorithm. Section 6 describes a case study on discord discovery in a real-world time series. Finally, in Section 7, we summarize the results obtained and suggest directions for further research.

3. Preliminaries

Prior to detailing the proposed parallel algorithm for discord discovery in Section 3.1 and Section 3.2, we introduce basic notation and formal definitions according to [7,8] and give an overview of the original serial algorithms MERLIN and DRAG, on which our development is based.

3.1. Notation and Definitions

A time series is a chronologically ordered sequence of real-valued numbers:
T = { t i } i = 1 n , t i R .
The length of a time series, n, is denoted by | T | . Hereinafter, we assume that the time series T fit into the main memory.
A subsequence  T i , m of a time series T is its subset of m successive elements that starts at the i-th position:
T i , m = { t k } k = i i + m 1 , 1 i n m + 1 , 3 m n .
We denote the set of all m-length subsequences in T by S T m . Let N denote the number of subsequences in S T m , i.e., N = | S T m | = n m + 1 .
A distance function for any two m-length subsequences is a non-negative and symmetric function Dist: R m × R m R .
Given a time series T and its two subsequences T i , m and T j , m , we say that they are non-self match to each other at distance Dist ( T i , m , T j , m ) if | i j | m . Let us denote a non-self match of a subsequence C S T m by M C .
Given a time series T, its subsequence D S T m is said to be the discord if D has the largest distance to its nearest non-self match. Formally speaking, the discord D meets the following:
C S T m min Dist ( D , M D ) > min Dist ( C , M C ) .
The definition above can be generalized from top-1 to top-k discord as follows: D S T m is said to be the k-th discord if the distance to its k-th nearest non-self match is the largest.
Given the positive real number r, the discord at a distance of at least r from its nearest non-self match is called the range discord. That is, the range discord D with respect to the parameter r meets the following: min Dist ( D , M D ) r .
The MERLIN [7] and DRAG [8] algorithms deal with subsequences of the time series that have been previously z-normalized to have a mean of zero and a standard deviation of one. Here, the z-normalization of a subsequence X = { x } i = 1 m S T m is defined as a subsequence X ^ = { x ^ } i = 1 m , where
x ^ i = x i μ X σ X , μ X = 1 m i = 1 m x i , σ X 2 = 1 m i = 1 m x i 2 μ 2 .
Both the MERLIN and DRAG algorithms employ the Euclidean metric as the Dist ( · , · ) function to measure the distance between subsequences. It is defined as follows. Let us have X , Y S T m , then, the Euclidean distance between the subsequences is calculated as below:
ED ( X , Y ) = i = 1 m ( x i y i ) 2 .
In our study, motivated by the highest possible performance of discord discovery, we employ the square of the Euclidean metric as a distance function. For the sake of simplicity, we denote by EDnorm the Euclidean distance between two z-normalized subsequences: ED norm ( X , Y ) = ED ( X ^ , Y ^ ) . To compute ED norm 2 , we further employ the following technique proposed in [31] that allows for faster calculation than in Equation (5):
ED norm 2 ( X , Y ) = 2 m 1 X · Y m · μ X · μ Y m · σ X · σ Y ,
where X · Y denotes the scalar product of vectors X , Y R m .

3.2. MERLIN and DRAG Algorithms

Algorithm 1 depicts a pseudocode of MERLIN [7] (up to discovering the top-k discords of each length, instead of all discords in the specified length range). Hereinafter, let us have an n-length time series T, and we are to find a set D of its discords that have a length in the range from minL to maxL (where minL maxL n ), so that D = m = minL maxL D m , where D m denotes a subset of m-length discords. The distance to the d D discord’s nearest neighbor is denoted by d . nnDist .
Algorithm 1 MERLIN (in T, minL , maxL , topK ; out D )
1:
D ; r 2 minL ; nnDist minL
2:
while  nnDist minL < 0  and  | D minL | < topK   do
3:
       D m i n L D R A G ( T , m i n L , r ) ; D D D m i n L ; nnDist minL min d D minL d . nnDist
4:
       r 0.5 · r
5:
for  i minL + 1  to  minL + 4  do
6:
     nnDist i
7:
    while  nnDist i < 0  and  | D i | < topK  do
8:
          r 0.99 · n n D i s t i 1
9:
         D i D R A G ( T , i , r ) ; D D D i ; nnDist i min d D i d . nnDist
10:
         r 0.99 · r
11:
for  i minL + 5  to  maxL  do 
12:
      μ Mean ( { nnDist k } k = i 1 i 5 ) ; σ Std ( { nnDist k } k = i 1 i 5 ) ; r μ 2 σ
13:
      D i D R A G ( T , i , r ) ; D D D i ; nnDist i min d D i d . nnDist
14:
    while  n n D i s t i < 0  and  | D i | < topK  do
15:
         D i D R A G ( T , i , r ) ; D D D i ; nnDist i min d D i d . nnDist
16:
         r r σ
17:
return  D
The algorithm prescribes the following procedure to select the parameter r. Discords are discovered sequentially, starting from the minimum length of the specified discord range to the maximum one. At each step, MERLIN calculates the arithmetic mean μ and the standard deviation σ of the last five distances from the discords found to their nearest neighbors and then calls the DRAG algorithm, passing it the parameter r = μ 2 σ . If DRAG has not found a discord, then σ is subtracted from r until DRAG stops successfully (i.e., a discord will be found). For the first five discord lengths, the parameter r is set as follows. For discords of minimum length minL , the parameter is set as r = 2 minL since it is the maximum possible distance between any pair of minL -length subsequences, and then r is reduced by half until DRAG, with such a parameter, results in success. To obtain the next four discord lengths, the algorithm takes the distance from the discord to its nearest neighbor obtained in the previous step, minus a small value equal to 1%. The subtraction of an additional 1% proceeds until the discord discovery with such a parameter results in success. For a detailed explanation of the above-described procedure, we refer the reader to the original work [7].
The DRAG algorithm [8] (see Algorithm 2) performs in two phases, namely, the candidate selection and discord refinement, where it collects potential range discords and discards false positives, respectively. In the first phase, DRAG scans through the time series T, and for each subsequence s S T m it validates the possibility for each candidate c already in the candidate set C to be a discord. If a candidate c fails the validation, then it is removed from this set. In the end, the new s is either added to the candidate set, if it is likely to be a discord, or it is pruned. In the second phase, the algorithm initially sets the distances of all candidates to their nearest neighbors to positive infinity. Then, DRAG scans through the time series T, calculating the distance between each subsequence s S T m and each candidate c. When calculating ED ( s , c ) , the EarlyAbandonED procedure stops the summation of k = 1 m ( s k c k ) 2 if it reaches k = , such that 1 m for which k = 1 ( s k c k ) 2 c . n n D i s t 2 . If the distance is less than r, then the candidate is a false positive and permanently removed from C . If the above-mentioned distance is less than the current value of c . n n D i s t (and still greater than r, otherwise it would have been removed), then the current distance to the nearest neighbor is updated. The correctness of the above-described procedure is proved in the original work [8].
Algorithm 2 DRAG (in T, m, r; out D )
Phase 1. Select candidates
1:
C { T 1 , m }
2:
for all  s S T m T 1 , m  do
3:
       isCand  TRUE
4:
      for all  c C and c M s  do
5:
            if  ED ( s , c ) < r  then
6:
                   C C c
7:
                   isCand  FALSE
8:
      if  isCand  then
9:
           C C s
10:
return  C
Phase 2. Refine discords
1:
D ; c C c . nnDist +
2:
for all s S T m do
3:
      for all  c C and c M s where s c  do
4:
             d i s t Early   Abandon   ED ( s , c )
5:
            if  d i s t < r  then
6:
                  C C c
7:
            else
8:
                  D D c
9:
                  c . nnDist min ( c . nnDist , dist )
10:
return  D

4. Arbitrary Length Discord Discovery with GPU

Currently, a GPU (graphics processing unit) [54] is one of the most popular many-core hardware platforms. GPUs fit well for SIMD (single instructions multiple data) computations since they are composed of symmetric streaming multiprocessors, each of which, in turn, consists of symmetric CUDA (compute unified device architecture) cores. The CUDA API (application programming interface) makes it possible to assign multiple threads to execute the same set of instructions over multiple data. In CUDA, all threads form a grid consisting of blocks. In a block, threads are divided into warps, logical groups of 32 threads. The block’s threads run in parallel and communicate with each other through shared memory. A CUDA function is called a kernel. When running a kernel on a GPU, an application programmer specifies both the number of blocks in the grid and the number of threads in each block.
Below, in Section 4.1 and Section 4.2, respectively, we introduce the general architecture and data structures of PALMAD, the parallel algorithm to discover discords of every possible length in a specified range on a GPU that is based on the original serial MERLIN algorithm [7]. PALMAD employs PD3 (parallel DRAG-based discord discovery) [55], our parallel version of the original serial DRAG algorithm [8]. Similarly to the original serial algorithm, PD3 performs in two phases, where each phase is parallelized separately from the other. In Section 4.3 and Section 4.4, we discuss the parallelization of the candidate selection and discord refinement phases, respectively.

4.1. General Architecture

In Figure 1, we depict the general architecture of PALMAD. Basically, our parallel algorithm follows the computational scheme of its serial predecessor (cf. Algorithm 1). PALMAD employs repeated calls of PD3, our designed parallel version of the serial DRAG algorithm (see Algorithm 2 and lines 3, 9, 13, and 15 in Algorithm 1) for a graphics processor. As opposed to the original algorithm, PALMAD avoids redundant calculations in iterative calls of DRAG when the subsequence length is one more than at the previous step. Indeed, to calculate the distance between any two candidate subsequences, we need to partially repeat the same calculations regarding subsequences that are one less length self-matches to the candidates above. More formally, for any i , j ( 1 < i , j n m and 3 m n ), when calculating ED norm 2 ( T i , m , T j , m ) through Equation (6) from scratch, we partially repeat calculations of both the mean values and standard deviations of subsequences T i , m 1 and T j , m 1 through Equation (4).
Figure 1. General architecture of PALMAD.
To avoid the overhead above, we employ the vectors μ ¯ , σ ¯ R n m i n L + 1 , namely, the mean values and standard deviations of all the given time series subsequences of the given length, respectively. In these vectors, the first n m + 1 elements are processed, where m is the given subsequence length ( minL m maxL ), and the rest are left unattended.
For the minL -length subsequences, these vectors are calculated according to Equation (4) once before the very first call of PD3 (see line 3 in Algorithm 1), whereas for the rest of the values of m, the vectors μ ¯ and σ ¯ are updated before each further call of PD3 (see lines 9, 13, and 15 in Algorithm 1) according to the following recurrent formulas:
μ T i , m + 1 = 1 m + 1 m μ T i , m + t i + m ,
σ T i , m + 1 2 = m m + 1 σ T i , m 2 + 1 m + 1 μ T i , m t i + m 2 .
In order not to overload the article’s text with details, we present the lemma with the proof of Equations (7) and (8) in the Appendix A.
The initial calculation and update of the vectors μ ¯ and σ ¯ are implemented as CUDA kernels. We form a grid of N threads, where the number of threads in each block is the algorithm’s parameter that is set as a multiple of the GPU warp size. Each thread calculates elements of the vectors μ ¯ and σ ¯ according to Equations (7) and (8).

4.2. Data Layout

In Figure 2, we depict the algorithm’s data structures we designed. The above-mentioned vectors μ ¯ , σ ¯ R n m i n L + 1 for each subsequence store its mean value and standard deviation, μ ¯ ( i ) = μ T i , m and σ ¯ ( i ) = σ T i , m , respectively.
Figure 2. Data structures of the algorithm: μ ¯ and σ ¯ are the vectors of the mean value and standard deviation; Cand and Neighbors are the bitmaps, where an element is one if a correspondent subsequence is a candidate to discord and zero otherwise; nnDist is the vector of distances, where an element is a distance from a correspondent subsequence to its nearest neighbor if the subsequence is a candidate discord and + otherwise. Data related to the threshold r, subsequences, and their nearest neighbors are shown in red, blue, and green, respectively.
Next, based on Formulas (7) and (8), for each subsequence, we calculate the distance to its non-overlapping nearest neighbor. The real-valued vector nnDist R N , for a subsequence of the input time series, contains the distance to its nearest neighbor: nnDist ( i ) = min ED norm 2 ( T i , m , M T i , m ) .
Two Boolean-valued vectors Cand , Neighbor B N are the bitmaps for the subsequences and their nearest neighbors, respectively: Cand ( i ) = TRUE (or Neighbor ( i ) = TRUE , respectively) if the subsequence T i , m (or its nearest neighbor, respectively) is a discord, and FALSE otherwise. These bitmaps are initialized with TRUE values. Further, we employ element-wise conjunction of the bitmaps above to discard more candidates during processing, relying on the obvious fact that a subsequence that is not a discord cannot have a nearest neighbor that is a discord.
To implement the candidate selection and discord refinement phases, we exploit the data parallelism concept and segment the data as depicted in Figure 3. The time series is divided into equal-length segments, where each segment is processed separately by a block of GPU threads. Performing the phase, the thread block scans the subsequences in a chunk-wise manner. The number of elements in a chunk is equal to the segment length, and the first chunk begins with the m-th element in the segment. Such a technique avoids redundant checks if candidates and subsequences in chunks overlap.
Figure 3. Data segmentation in the algorithm: T ( i ) and Chunk ( i ) are a segment and a portion of the time series, respectively, processed by a block of GPU threads; pad is the number of + elements inserted to provide the load balance. Data related to the m-length overlapping for avoiding redundant checks, subsequences, and their nearest neighbors are shown in red, blue, and green, respectively.
The segment length is the algorithm’s parameter to be set as a multiple of the GPU warp size. To balance the load of threads in the block, we require that the number of m-length subsequences in the time series be a multiple of the number of subsequences of the specified length in the segment. If this is not the case, we pad the time series to the right with dummy positive infinity-valued elements. Let us denote the segment length and the number of m-length subsequences in the segment by seglen and segN , respectively, and then segN = seglen m + 1 . Let us denote the number of dummy elements in the rightmost segment by pad , and then it is defined as follows:
p a d = m 1 , N mod   segN = 0 N segN · segN + 2 ( m 1 ) n , otherwise .

4.3. Parallelization of Candidate Selection

Algorithm 3 depicts a pseudocode of our parallelization of the candidate selection phase. The respective CUDA kernel forms a grid consisting of N segN blocks of segN threads in each block. A thread block considers the segment subsequences as local candidates for discords and performs chunk-wise processing of the subsequences that are located to the right of the segment and do not overlap with the candidates. The processing of the subsequences is as follows. If the distance from the candidate to the subsequence is less than the parameter r, then the candidate and the subsequence are excluded from further processing as they are obviously not discords (the corresponding flags in the bitmaps are set to FALSE). If all the local candidates are discarded, the block terminates all its threads ahead of schedule.
In Figure 4, we show in detail how the block’s threads work. The thread block loads its segment into the shared memory once before starting calculations, and at each scanning step, it also loads there the current chunk located to the right of the segment. This technique allows for increasing the algorithm’s performance by reducing the number of reads of the time series elements from the global memory. Next, the block threads calculate scalar products, storing the results in shared memory: firstly, products between the first subsequence of the segment and all the subsequences of the current chunk, and then those between the first subsequence of the current chunk and all the subsequences of the segment (the vectors QTrow , QTcol R segN in lines 4–7 and 8 in Algorithm 3, respectively).
Figure 4. Computational kernel for the candidate selection phase.
Further, based on the obtained vector QTcol and the pre-calculated vectors μ ¯ , σ ¯ , we calculate the distances between the first subsequence of the chunk and all the subsequences of the segment through Equation (6) (see line 9 in Algorithm 3). Employing the calculated distances, we discard unpromising candidates located in the segment and the current chunk (see lines 10–11 in Algorithm 3). If all the candidates in the segment are discarded, then the block stops (see lines 14–15 in Algorithm 3).
Algorithm 3 PD3select (in T, m, r; out C )
1:
Cand TRUE ¯ ; Neighbor TRUE ¯
2:
for all  T ( i ) T do                  ▹PARALLEL (block)
3:
      for all  Chunk ( j ) T ( i ) where i j do        ▹PARALLEL (thread)
4:
          if  i = j  then
5:
              QTrow CALCDOTPRODUCTS ( T 1 , m ( i ) , Chunk ( j ) )
6:
             continue
7:
           QTrow UPDATEDOTPRODUCTS ( QTrow , T 1 , m ( i ) , Chunk ( j ) )
8:
           QTcol CALCDOTPRODUCTS ( Chunk 1 , m ( j ) , T ( i ) )
9:
           dist CALCDIST ( Chunk 1 , m ( j ) , T ( i ) , QTcol , μ ¯ , σ ¯ )
10:
        if  dist < r  then
11:
            Cand ( i · segN + t i d ) FALSE ; Neighbor ( j · segN + 1 ) FALSE
12:
        else
13:
            nnDist ( j · segN + 1 ) min dist , nnDist ( j · segN + 1 )
14:
        if not  k = i · segN ( i + 1 ) · segN Cand ( k )  then
15:
           break
16:
        for all  Chunk k , m ( j ) S Chunk ( j ) m Chunk 1 , m ( j ) do    ▹ PARALLEL (thread)
17:
            QTcol UPDATEDOTPRODUCTS ( QTcol , QTrow , Chunk k , m ( j ) , T ( i ) )
18:
            dist CALCDIST ( Chunk k , m ( j ) , T ( i ) , QTcol , μ ¯ , σ ¯ )
19:
           if  dist < r  then
20:
                Cand ( i · segN + t i d ) FALSE ; Neighbor ( j · segN + k ) FALSE
21:
           else
22:
                nnDist ( j · segN + 1 ) min dist , nnDist ( j · segN + 1 )
23:
        if not  k = i · segN ( i + 1 ) · segN Cand ( k )  then
24:
           break
25:
C { T i , m S T m ; nnDist ( i ) } 1 i n m + 1 , Cand ( i ) = TRUE
26:
return  C
After that, the block threads perform similar actions over the remaining subsequences of the current chunk; however, they calculate scalar products more efficiently (see lines 16–24 in Algorithm 3). We calculate the scalar products between the current subsequence of the chunk and all the subsequences of the segment (i.e., the vector QTcol ) based on the previously calculated vector QTrow and the vector QTcol obtained at the previous iteration (see line 16 in Algorithm 3). To calculate the scalar product of the k-th ( 1 < k segN ) subsequence in the Chunk ( j ) and a subsequence in the segment T ( i ) , we employ the following formula:
Q T c o l ( t i d ) = QTcol ( tid 1 ) + T tid , m ( i ) · Chunk k , m ( j ) ( m ) T tid 1 , m ( i ) ( 1 ) · Chunk k 1 , m ( j ) ( 1 ) , 1 < tid segN QTrow ( k ) , tid = 1 ,
where t i d  denotes the thread’s number in the block. Since in Equation (10), the first term is obtained from the previous iteration, we achieve the O ( 1 ) complexity of the scalar product calculation instead of O ( m ) as in the straightforward case.

4.4. Parallelization of Discord Refinement

Parallelization of the discord refinement phase (see Algorithm 4) is implemented through two CUDA kernels called one after the other. The first one trivially refines discords obtained in the previous phase through the element-wise conjunction of the C a n d and N e i g h b o r bitmap vectors, writing the result to the former. This operation allows for pruning the nearest neighbors of the subsequences discarded at the selection phase.
Algorithm 4 PD3refine (in T, m, r; out D )
1:
for all  T i , m S T m  do                 ▹PARALLEL (thread)
2:
     Cand ( i ) Cand ( i ) Neighbor ( i )
3:
for all  T ( i ) T  where k = i · segN ( i + 1 ) · segN Cand ( k ) = TRUE  do    ▹PARALLEL (block)
4:
    for all  C h u n k ( j ) T ( i )  where  i j  do        ▹ PARALLEL (thread)
5:
        if  i = j  then
6:
            QTrow CALCDOTPRODUCTS ( T 1 , m ( i ) , Chunk ( j ) )
7:
           continue
8:
         QTrow UPDATEDOTPRODUCTS ( QTrow , T 1 , m ( i ) , Chunk ( j ) )
9:
         QTcol CALCDOTPRODUCTS ( Chunk 1 , m ( j ) , T ( i ) )
10:
         d i s t CALCDIST ( Chunk 1 , m ( j ) , T ( i ) , QTcol , μ ¯ , σ ¯ )
11:
        if  dist < r  then
12:
            Cand ( i · segN + tid ) FALSE
13:
        else
14:
            nnDist ( j · segN + tid ) min dist , nnDist ( j · segN + tid )
15:
        if not  k = i · segN ( i + 1 ) · segN Cand ( k )  then
16:
           break
17:
        for all  Chunk k , m ( j ) S Chunk ( j ) m Chunk 1 , m ( j )  do               ▹ PARALLEL (thread)
18:
            QTcol UPDATEDOTPRODUCTS ( QTcol , Q T r o w , C h u n k k , m ( j ) , T ( i ) )
19:
            dist CALCDIST ( Chunk k , m ( j ) , T ( i ) , QTcol , μ ¯ , σ ¯ )
20:
           if  d i s t < r  then
21:
                Cand ( i · segN + tid ) FALSE
22:
           else
23:
                nnDist ( j · s e g N + t i d ) min dist , nnDist ( j · segN + tid )
24:
        if not  k = i · segN ( i + 1 ) · segN Cand ( k )  then
25:
           break
26:
D { T i , m S T m ; nnDist ( i ) } 1 i n m + 1 , Cand ( i ) = TRUE
27:
return  D
The second kernel performs non-trivial refinement, and it is parallelized similar to the selection phase, involving only those segments of the time series whose set of local candidates is not empty (see line 3 in Algorithm 4). The algorithm scans and processes the subsequences that do not overlap with the candidates and are located to the left of the segment (see line 4 in Algorithm 4). If the distance from the candidate to the subsequence is less than the parameter r, then the candidate is discarded as an obvious false positive.

5. Experimental Evaluation

To evaluate the proposed algorithm, we carried out experiments to study the performance of PALMAD over various real-world and synthetic time series in comparison with analogs and investigate the algorithm’s scalability. We designed the experiments to be easily reproducible with our repository [17], which contains the algorithm’s source code and all the datasets used in this work. Below, Section 5.1 describes the hardware and time series employed in the experiments, and Section 5.2 presents the experimental results and discussion.

5.1. The Experimental Setup

In our study, we employed the time series listed in Table 3, which have also been used in the experimental evaluation of HOTSAX [56], KBF_GPU [44], and Zhu et al.’s [45] algorithm. The space shuttle data [57] are solenoid current measurements on a Marotta MPV-41 series valve as the valve is cycled on and off under various test conditions in a laboratory where the valves are used to control fuel flow on the NASA spacecraft. The ECG and ECG2 [58], and Koski-ECG [59] time series are electrocardiograms of adult patients. The respiration time series [56] shows a patient’s breathing (measured by thorax extension) as they wake up. The power demand time series reflects the energy consumption of a research center in the Netherlands for 1997 [60]. RandomWalk1M and RandomWalk2M are our generated time series through the random walk model [36]. The detailed statistical characteristics of the time series above can be found in our repository [17].
Table 3. Time series employed in the experiments.
Table 4 summarizes the hardware platforms of our experiments, where GPU-SUSU and GPU-MSU denote graphics processors installed in the HPC centers of the South Ural State University [61] and Moscow State University [62], respectively.
Table 4. Hardware platform of the experiments.

5.2. Results and Discussion

5.2.1. Comparison with Analogs

In the experiments, we compared PALMAD with two algorithms, namely, KBF_GPU [44] and Zhu et al.’s [45], since our thorough review of related work (see Section 2) did not reveal other GPU-oriented parallel competitors. Since the authors of the above rivals do not provide their source codes, for a fair comparison, in the experiments, we utilize time series and hardware identical to those employed in [44,45], respectively, and compare our results with those reported in the original papers by the authors. The time series Koski-ECG (see Table 3) was employed to compare PALMAD with KBF_GPU on the GPU-SUSU system (see Table 4), and the rest of the time series were involved in comparison with Zhu et al.’s algorithm on GPU-MSU. We omit the MERLIN performance results since, as expected, the original serial algorithm is significantly inferior to its parallel descendant, although in the experiments, we confirmed that PALMAD produces exactly the same results as MERLIN. For each experiment, we ran PALMAD 10 times and took the average value as the final running time.
Since the rival algorithms discover only the top-1 discord, whereas our algorithm finds all the discords of each length in a specified length range, to provide a fair comparison, in the experiments, we employ the following settings for PALMAD. First, we set minL = maxL for the range above. Second, we measure both the running time of PALMAD and the number of discords found to further show the average time spent by our algorithm to discover one discord.
In Figure 5, we compare the performance of PALMAD and KBF_GPU. It can be seen that our algorithm significantly outruns the rival in terms of both the overall running time and the average running time to discover one discord. Obviously, the reason is that KBF_GPU implements a brute-force approach, whereas PALMAD avoids redundant calculations and exploits advanced data structures.
Figure 5. Performance of PALMAD in comparison with KBF_GPU. (a) Overall running time. (b) Average running time per one discord.
Figure 6 depicts the experimental results on the PALMAD performance compared with Zhu et al.’s algorithm. It can be seen that Zhu et al.’s algorithm significantly outruns PALMAD: being up to 20 times and up to two orders of magnitude faster over the real and synthetic time series, respectively. However, at the same time, PALMAD discovers substantially more discords: at least two and seven orders of magnitude greater over the real and synthetic time series, respectively. Thus, comparing the average running time to discover one discord, it can be seen that PALMAD significantly outruns the rival starting at least from the moment when we set t o p K , the number of discords to be discovered, as a quarter of the actual number of discords found: by at least two times and three orders of magnitude over the real and synthetic time series, respectively.
Figure 6. Performance of PALMAD in comparison with Zhu et al.’s algorithm [45]. (a) Overall running time. (b) Average running time per one discord.

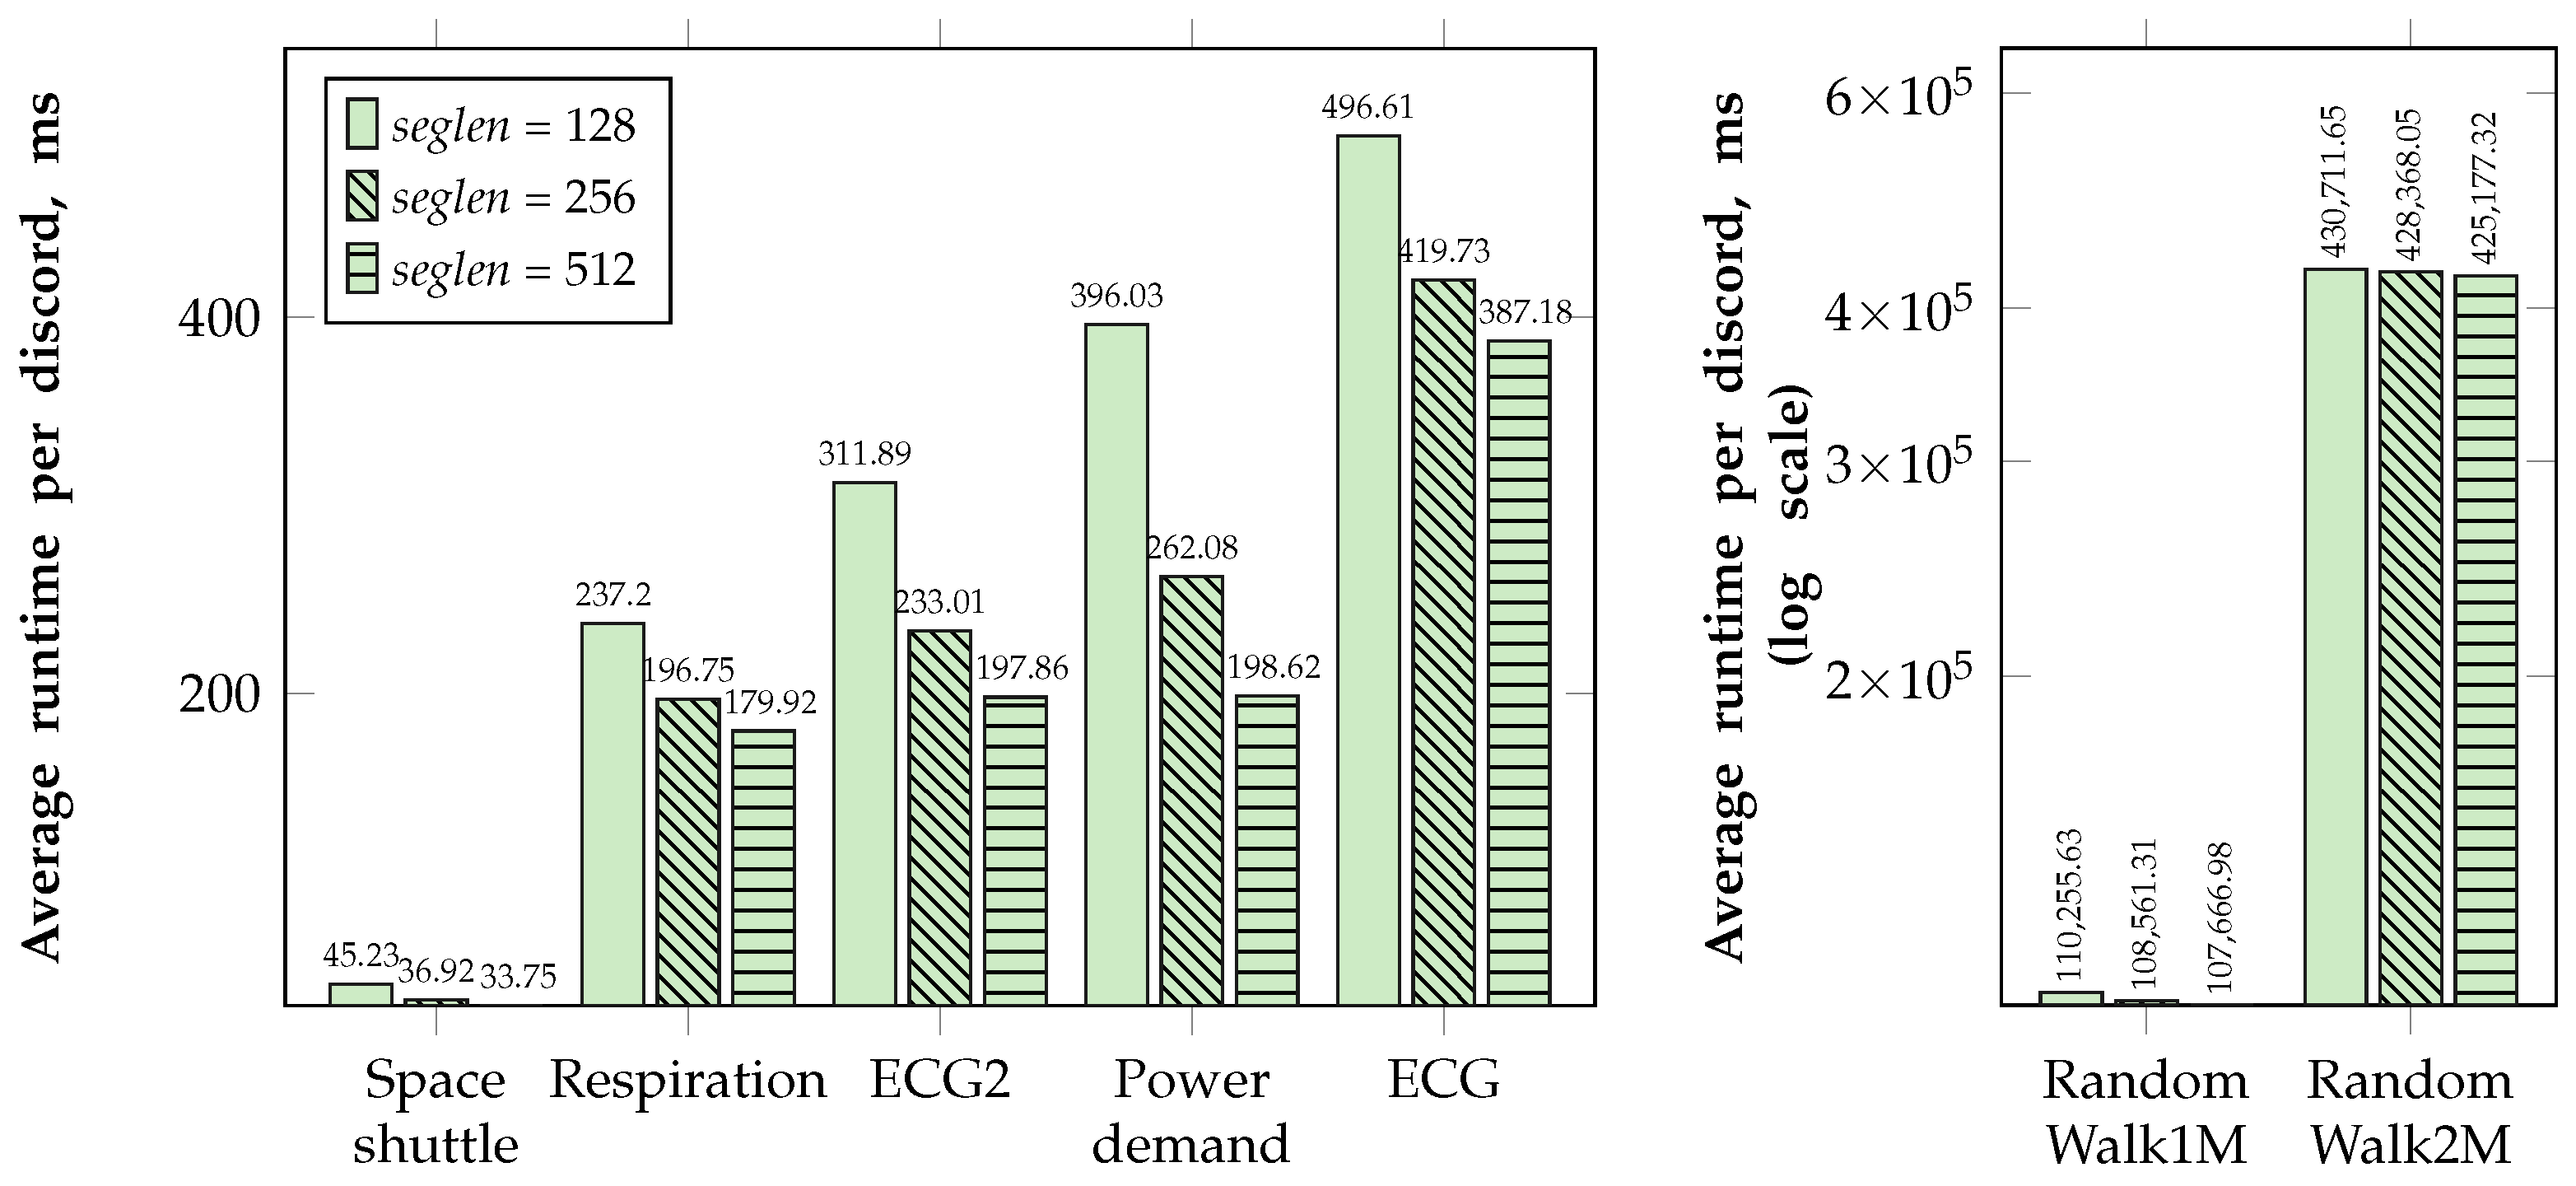
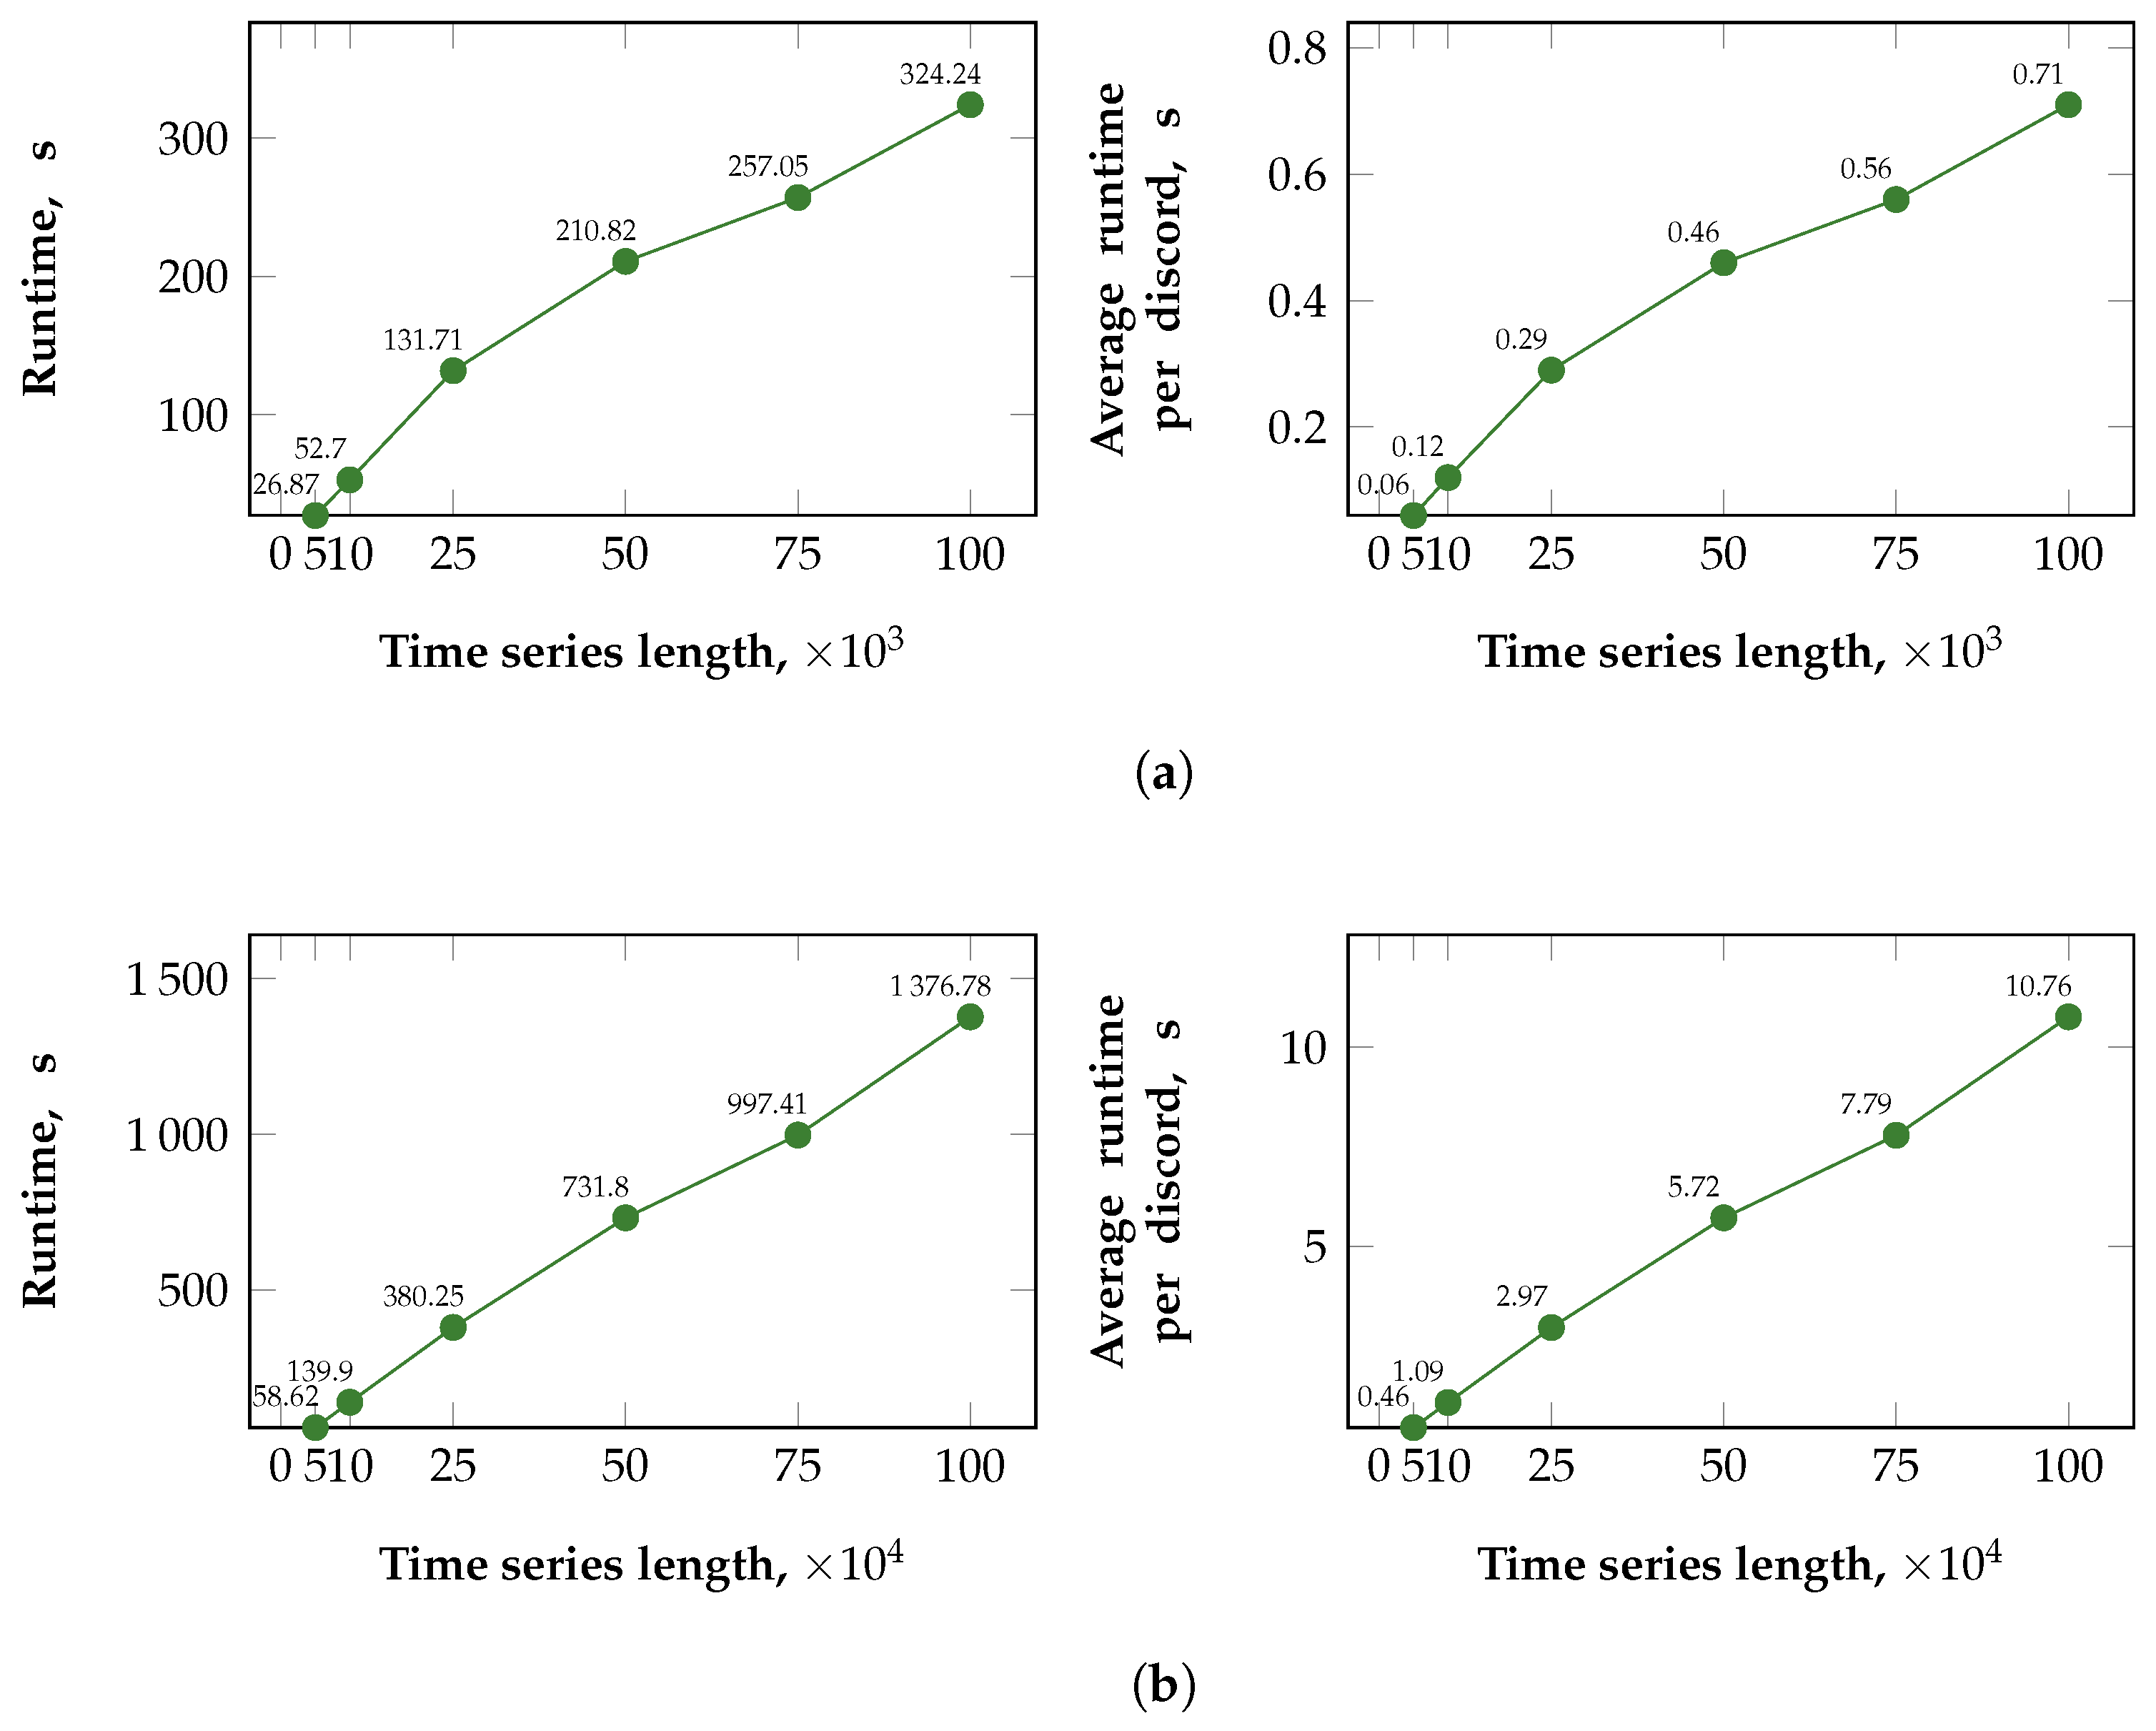
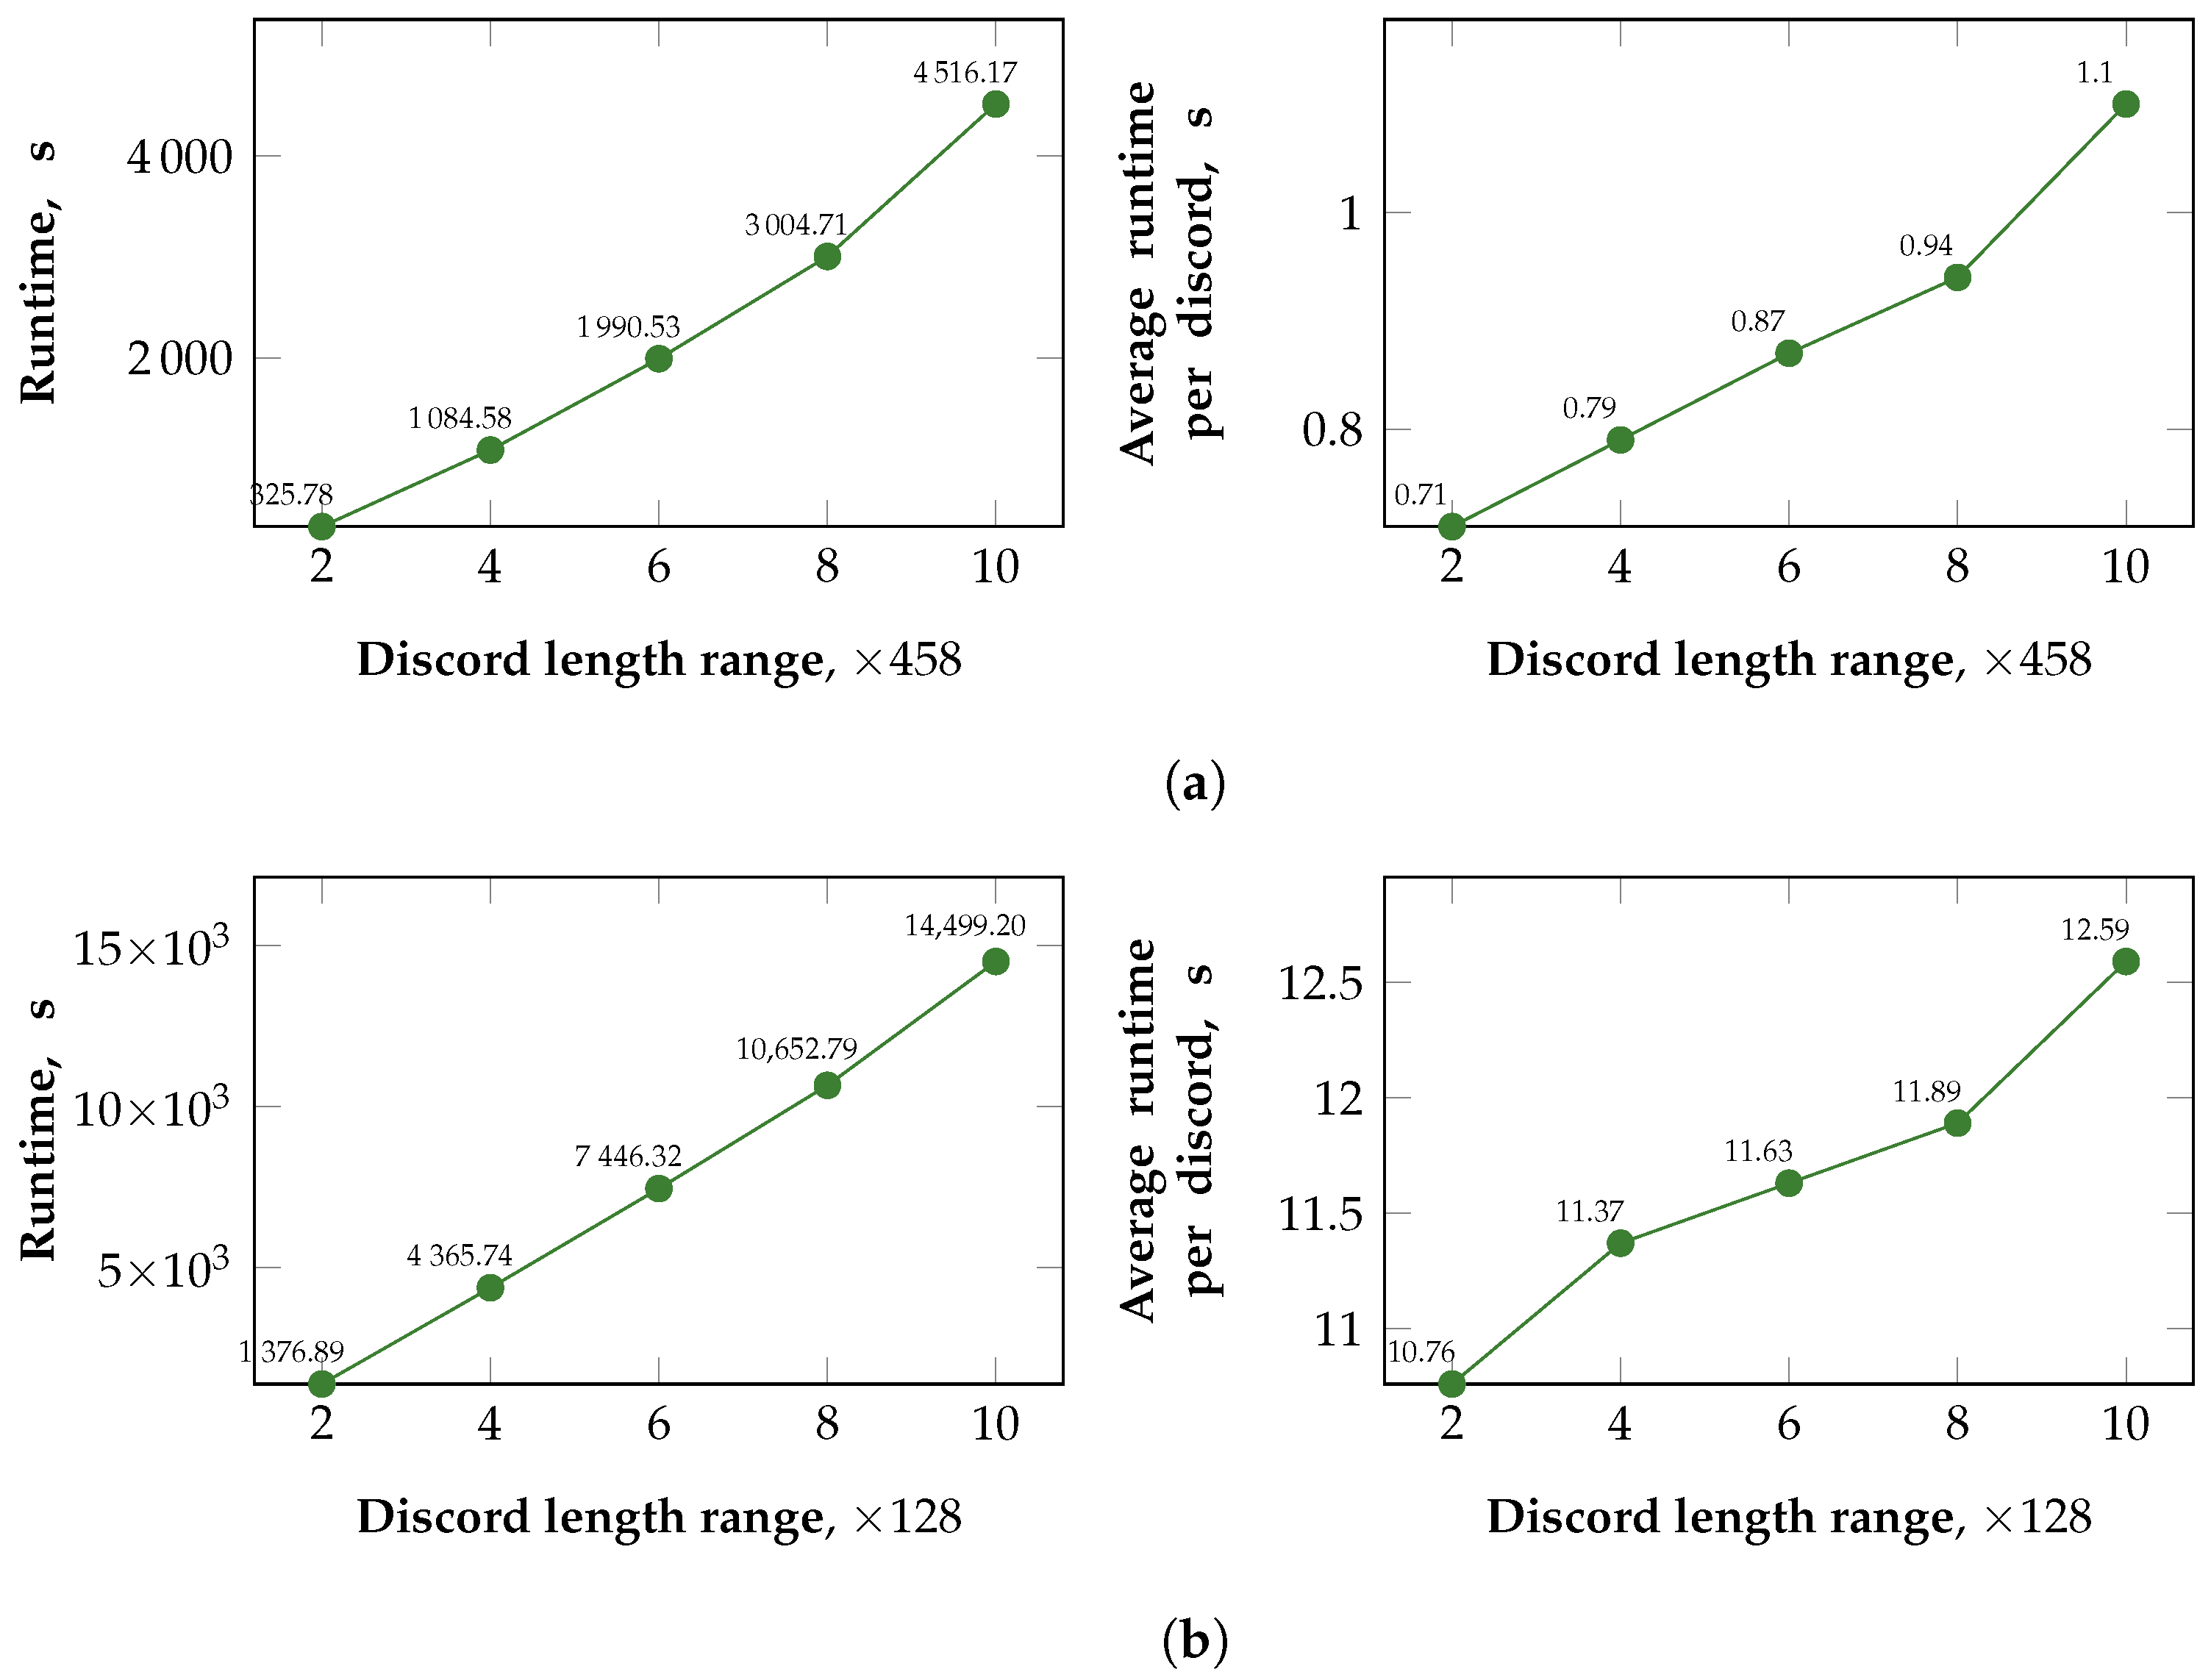
5.2.2. Scalability of PALMAD
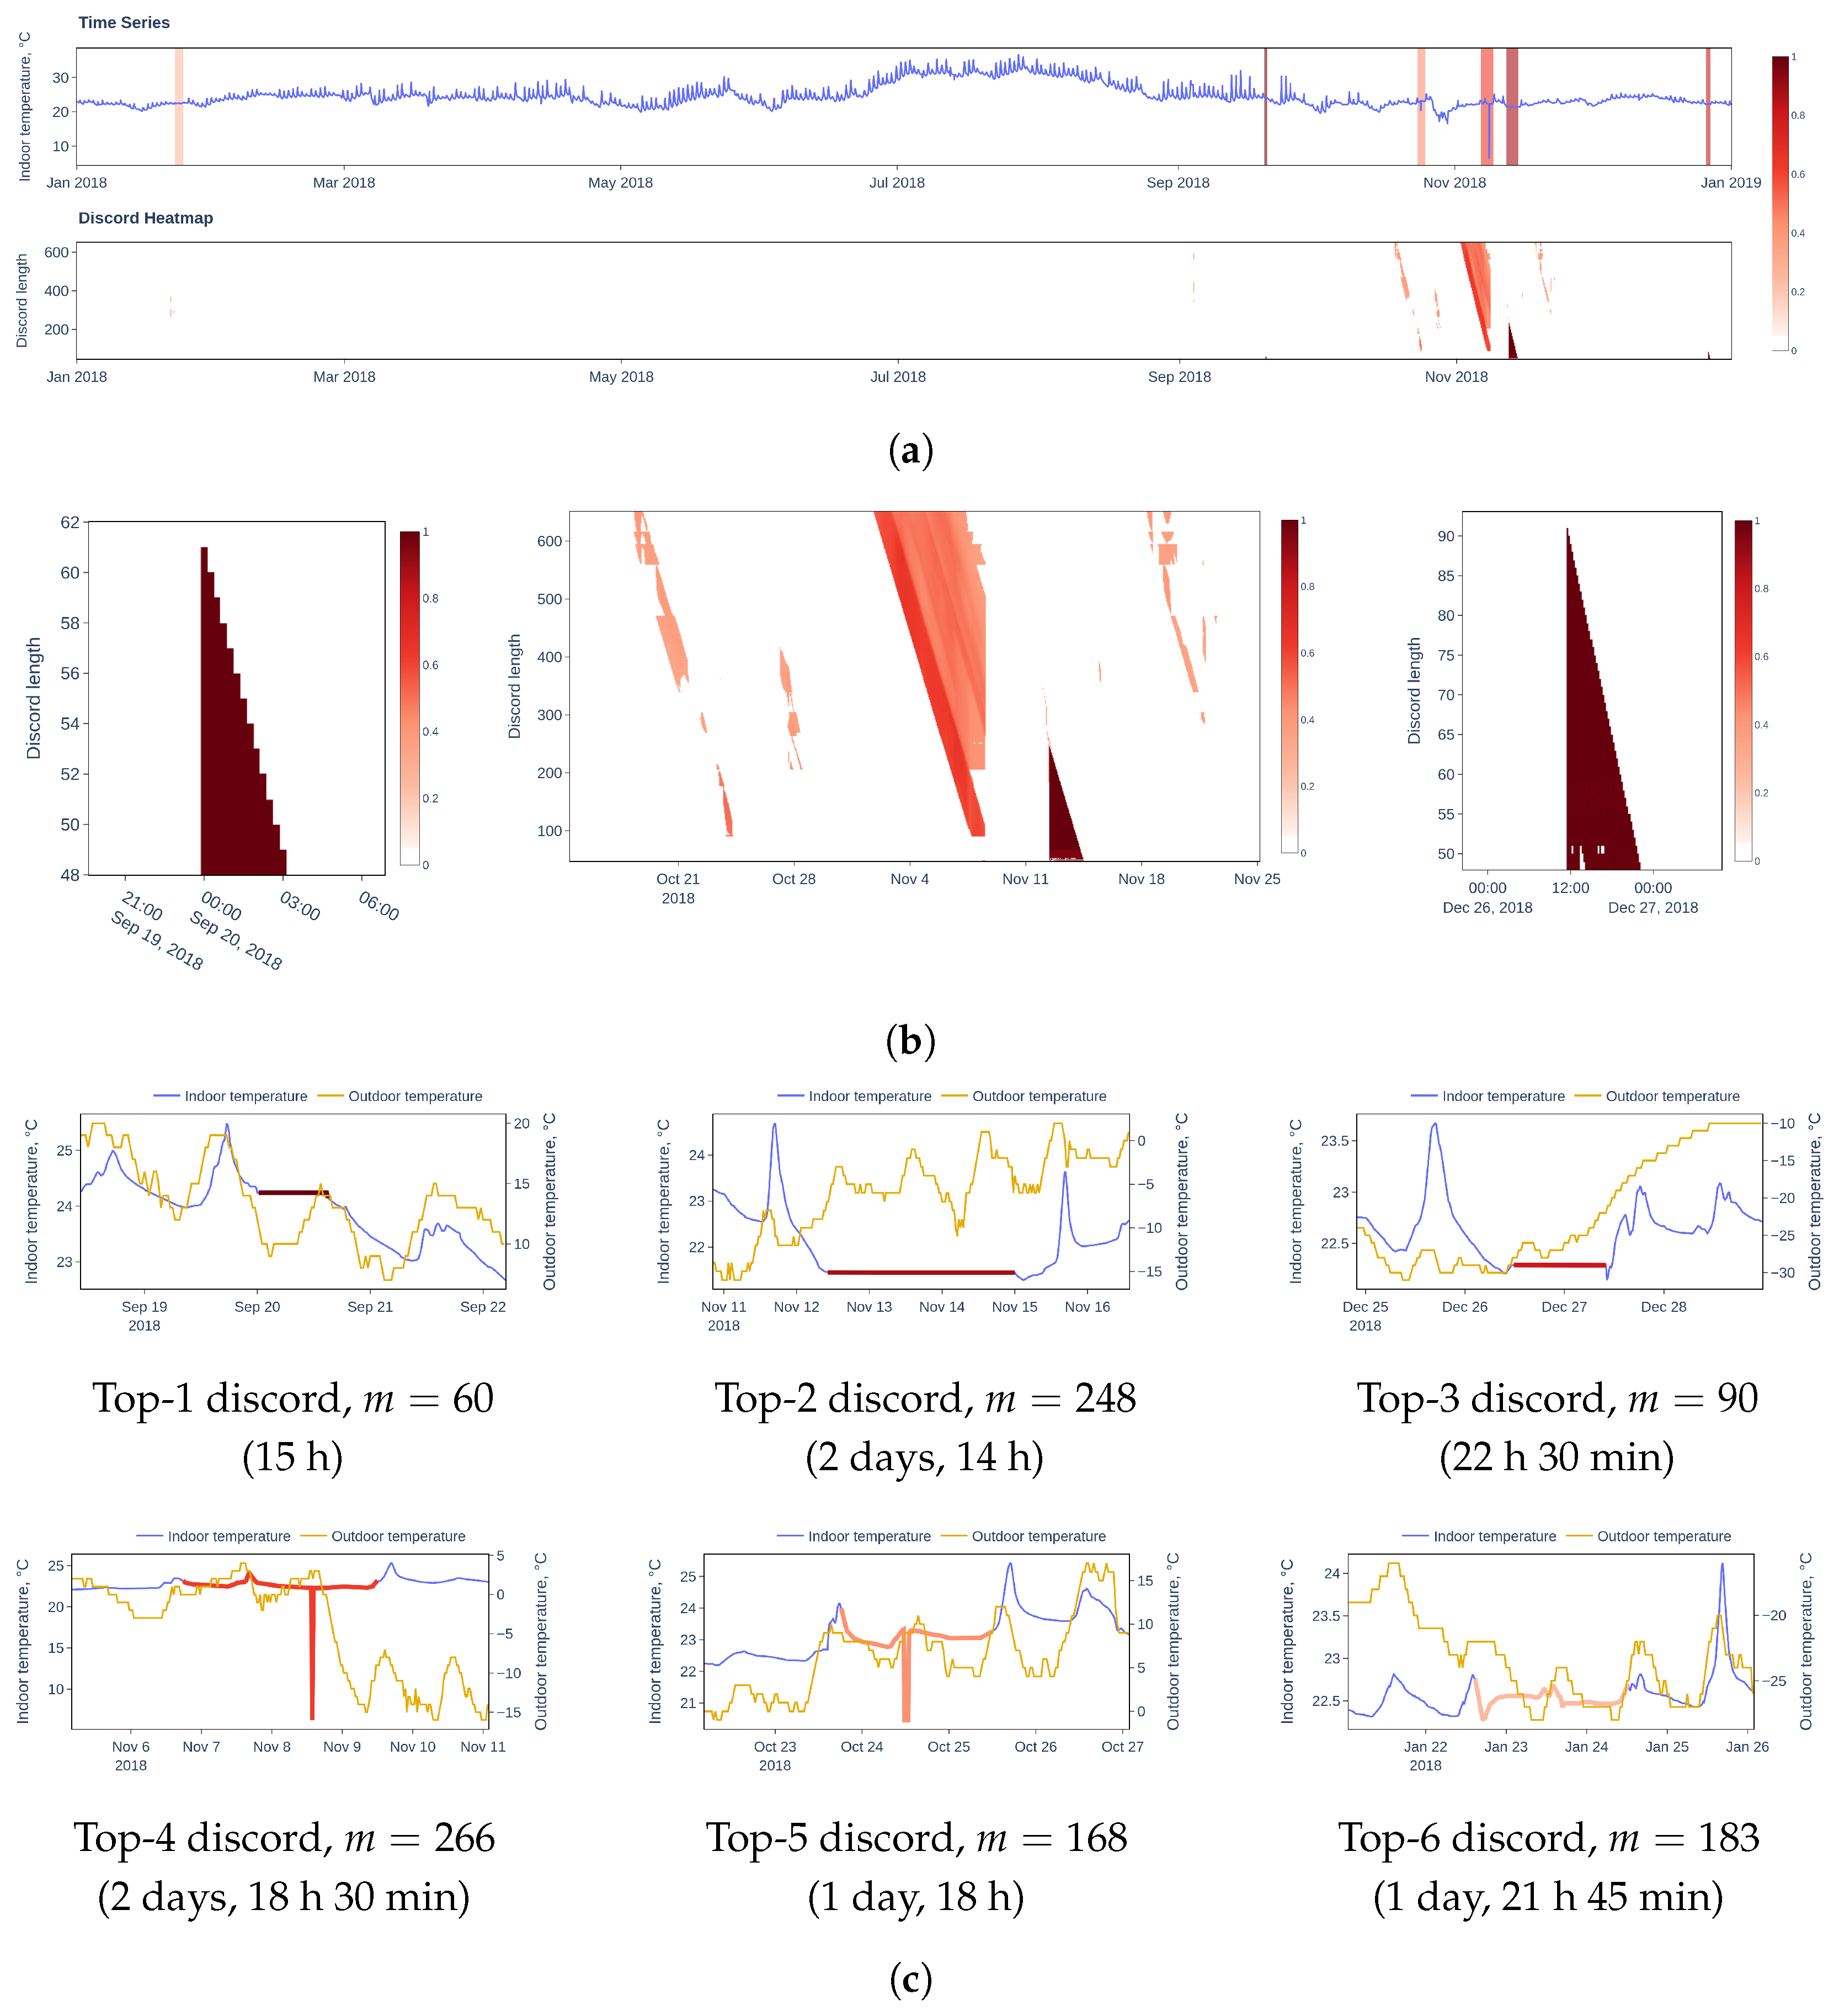
In addition to comparing our algorithm to analogs, we also study the scalability of PALMAD. First, we investigate the impact of the segment length (the parameter s e g l e n ; see Section 4.3) on the PALMAD performance. Second, we assess our algorithm’s performance depending on two input parameters that directly affect the amount of calculations, namely, the time series length and discord range length.
In Figure 7, we show experimental results regarding the impact of the segment length on the PALMAD performance. It can be seen that the algorithm’s running time is proportional to the segment length for both the real-world and synthetic time series, and a greater value of the segment length provides higher performance. This can be explained by the fact that when the segment length increases, the overhead of reading and writing segments in the GPU shared memory decreases. Moreover, this was the reason that we took s e g l e n = 512 in the above-described experiments.
Figure 7. Scalability of the PALMAD algorithm with respect to the segment length.
In Figure 8 and Figure 9, we depict the performance of our algorithm depending on the time series length and on the discord length range, respectively, for the cases of the real-world and synthetic data. It can be observed that the algorithm’s running time is proportional to the above-mentioned parameters for both the real-world and synthetic time series.
Figure 8. Scalability of the PALMAD algorithm with respect to the time series length. (a) Real dataset (Koski-ECG, discord range is 458–916). (b) Synthetic dataset (RandomWalk1M, discord range is 128–256).
Figure 9. Scalability of the PALMAD algorithm with respect to the discord length range. (a) Real dataset (Koski-ECG). (b) Synthetic dataset (RandomWalk1M).

6. Case Study

In this section, we apply PALMAD to discover subsequence anomalies in real-world time series from a smart heating control system. The PolyTER system [63] allows for intelligent monitoring and control of the operating conditions of utility systems through the analysis of the data from various IoT sensors installed in university campus buildings. We took a time series from a temperature sensor installed in a lecture hall and discovered the anomalies in a specified range. The sensor’s frequency is four times per hour, the time series corresponds to annual measurements (i.e., time series length n = 35,040), and we search for anomalies that range from 12 h to 7 days (i.e., minL = 48 and maxL = 672 , respectively).
To visualize the results obtained, we employ the discord heatmap technique [64], that illustrates the anomaly score through the intensity of a color, and is somewhat like the motif heatmap [65]. Formally speaking, we plot a one-color heatmap as a matrix of size ( maxL minL + 1 ) × ( n minL ) , where the intensity of a pixel ( m , i ) shows the anomaly score of the discord T i , m D m and the pixel’s intensity is calculated as a normalization of the discord’s distance to its nearest neighbor:
heatmap ( m , i ) = T i , m . nnDist 2 m ,
where we employ the normalizing divisor 2 m according to Equation (6).
Despite the fact that we have proposed a visual tool to explore and discover multiple length discords, there is an open question for a practitioner: how can we rank discords of different lengths and extract the most interesting ones. There are discord attributes that it can be suggested could be taken into account, e.g., its length and index, the distance to its nearest neighbor, the number of its self-matches, etc. However, in this study, we employ a straightforward approach that considers a discord’s interest as a normalized distance to its nearest neighbor, comparing such distances among discords having the same index. Thus, the most interesting discord among the ones of different lengths is selected as below:
arg max 1 i N max minL m maxL heatmap ( m , i ) .
Clearly, through Equation (12), we can select the top-k interesting discords. In our repository [17], the reader can find plots of discord heatmaps and top discords for all the real-world time series listed in Table 3 and those from other subject domains.
Figure 10 summarizes the results of the case study, showing the time series and its discord heatmap, zooming of the heatmap intervals with the most interesting discords, and the top-6 discords according to Equation (12) (see Figure 10a, Figure 10b, and Figure 10c, respectively).
Figure 10. Case of PolyTER. (a) Time series and its discord heatmap. (b) Zooming on the most interesting intervals of the discord heatmap. (c) Top-6 discords of different lengths.
In addition, in top discord plots, we indicate both indoor and outdoor temperatures, where the latter is obtained from the open weather archive [66]. Highly likely, each of the top three discords illustrates a long-term malfunction in a temperature sensor that outputs the same measurements during the given time period. Next, the top-4 and top-5 discords show a short-term failure of the sensor. Finally, the top-6 discord may indicate the fact that the system (or its operator) chose an inefficient heating mode for the lecture hall in the given time period.

7. Conclusions

In this article, we addressed the problem of accelerating time series subsequence anomaly discovery on a graphics processor. Such an anomaly refers to successive points in time whose collective behavior is abnormal, although each observation individually does not necessarily deviate. Currently, discovering subsequence anomalies in time series remains one of the most topical research problems.
Among numerous approaches to discovering subsequence anomalies, the discord concept [4] is considered one of the best. A time series discord is intuitively defined as a subsequence that is maximally far away from its nearest neighbor. However, the application of discords is reduced by sensitivity to a user’s choice of the subsequence length. A brute-force discovery of discords of all the possible lengths and then selecting the best discords with respect to some measure is clearly computationally prohibitive. Recently introduced, the MERLIN algorithm [7] discovers time series discords of every possible length in a specified range, being ahead of competitors in terms of accuracy and performance. MERLIN employs repeated calls of the DRAG algorithm [8], that discovers discords of a given length with a distance of at least r to their nearest neighbors and adaptive selection of the parameter r. However, to the best of our knowledge, no research has addressed accelerating MERLIN with any parallel hardware architecture.
In this article, based on Keogh et al.’s works [7,8] we propose a novel parallelization scheme PALMAD (parallel arbitrary length MERLIN-based anomaly discovery) for a graphics processor. While basically following the original serial algorithm, PALMAD, however, employs our derived recurrent formulas to calculate the mean values and standard deviations of subsequences of the time series. Since those data are further involved in calculations of the normalized Euclidean distances between subsequences, eventually, we significantly reduce the amount of calculations. Furthermore, PALMAD repeatedly calls PD3 (parallel DRAG-based discord discovery) [55], our developed parallel version of the original DRAG algorithm. Similar to its predecessor, PD3 performs in two phases. To implement the candidate selection phase, we exploit the data parallelism by dividing the time series into equal-length segments, where each segment is processed separately by a block of GPU threads. The thread block considers the segment subsequences as local candidates for discords and processes the subsequences that are located to the right of the segment and do not overlap with the candidates. Next, the thread block scans the subsequences in chunks, the number of elements of which is equal to the segment length, and the first chunk begins with the m-th element in the segment, where m is the discord length. Such a technique allows us to avoid redundant checks if candidates and subsequences in chunks overlap. In PD3, the candidate refinement phase is parallelized in the same way as the selection phase. Refinement involves only those segments of the time series whose set of local candidates is not empty. The algorithm scans and processes the subsequences that do not overlap with the candidates and are located to the left of the segment.
We carried out an extensive experimental evaluation of PALMAD over real-world and synthetic time series. In the experiments, we compared our development with two algorithms, namely, KBF_GPU [44] and Zhu et al.’s [45], since our thorough review of related work did not reveal other GPU-oriented parallel competitors. Both rivals aim at discovering the top-1 discord, where the former is a parallelization of the brute-force approach while the latter employs computational patterns to reduce the amount of calculations. As expected, in the experiments, our algorithm significantly outran KBF_GPU. Next, being adapted to discover the most important discord of a specified length, Zhu et al.’s algorithm significantly outruns PALMAD, which discovers discords of every possible length in a specified range: being up to 20 times and up to two orders of magnitude faster over the real and synthetic time series, respectively. However, PALMAD discovers substantially more discords: at least two and seven orders of magnitude greater over the real and synthetic time series, respectively. Thus, PALMAD significantly outruns the rivals in terms of the average running time to discover one discord. Finally, in the experiments, we also investigated the scalability of PALMAD and found that the algorithm’s running time is proportional to each of the following parameters for both real-world and synthetic time series: segment length, time series length, and discord range length.
We also apply PALMAD to discover anomalies in a real-world time series from a smart heating control system employing our proposed discord heatmap technique to illustrate the results.
Our further studies might elaborate on the following topics: (a) generalizing PALMAD to handle multi-variate time series, (b) discord discovery in large time series that cannot be entirely placed in RAM with a high-performance cluster with GPU-based nodes, and (c) application of PALMAD in deep-learning-based online time series anomaly detection.

Author Contributions

Software, Y.K.; writing—original draft, M.Z. All authors have read and agreed to the published version of the manuscript.

Funding

This work was financially supported by the Russian Science Foundation (grant no. 23-21-00465).

Acknowledgments

The research was carried out using the equipment of the shared research facilities of HPC computing resources at Lomonosov Moscow State University and the supercomputer resources of the South Ural State University.

Conflicts of Interest

The authors declare no conflict of interest.

Appendix A

Lemma A1.
Let us have the time series T, | T | = n , and two of its m-length subsequences, T i , m and T i , m + 1 , where 1 i n m and 3 m n . Then, the following holds:
μ T i , m + 1 = 1 m + 1 m μ T i , m + t i + m ,
σ T i , m + 1 2 = m m + 1 σ T i , m 2 + 1 m + 1 μ T i , m t i + m 2 .
Proof. 
First, let us prove the equation regarding the mean value. According to the definition
μ T i , m = 1 m k = 0 m t i + k .
Then,
k = 0 m t i + k = m μ T i , m .
Next, let us consider μ T i , m + 1 :
μ T i , m + 1 = 1 m + 1 k = 0 m t i + k = 1 m + 1 ( m μ T i , m + t i + m ) ,
so, the first equation is proved. Further, let us prove the equation regarding the standard deviation. According to the definition
σ T i , m 2 = 1 m k = 0 m 1 t i + k 2 μ T i , m 2 .
Then,
k = 0 m 1 t i + k 2 = m ( σ T i , m 2 + μ T i , m 2 ) .
Next, let us consider σ T i , m + 1 2 :
σ T i , m + 1 2 = 1 m + 1 k = 0 m t i + k 2 μ T i , m + 1 2 = 1 m + 1 m ( σ T i , m 2 + μ T i , m 2 ) + t i + m 2 μ T i , m 2 .
Employing the above-proved proposition regarding the mean value, we obtain
σ T i , m + 1 2 = 1 m + 1 m ( σ T i , m 2 + μ T i , m 2 ) + t i + m 2 1 m + 1 ( m μ T i , m + t i + m ) 2 .
By performing the operations in parentheses and further collecting terms, we obtain
σ T i , m + 1 2 = 1 m + 1 m ( σ T i , m 2 + μ T i , m 2 ) + t i + m 2 1 m + 1 ( m μ T i , m + t i + m ) 2 =
= 1 m + 1 m σ T i , m 2 + 1 m + 1 m ( m + 1 ) μ T i , m 2 m 2 μ T i , m + ( m + 1 ) t i + m 2 t i + m 2 2 m μ T i , m t i + m =
= 1 m + 1 m σ T i , m 2 + m m + 1 μ T i , m 2 2 μ T i , m t i + m + t i + m 2 =
= m m + 1 σ T i , m 2 + 1 m + 1 μ T i , m t i + m 2 .
This concludes our proof. □

References

  1. Blázquez-García, A.; Conde, A.; Mori, U.; Lozano, J.A. A Review on Outlier/Anomaly Detection in Time Series Data. ACM Comput. Surv. 2021, 54, 56. [Google Scholar] [CrossRef]
  2. Choi, K.; Yi, J.; Park, C.; Yoon, S. Deep Learning for Anomaly Detection in Time-Series Data: Review, Analysis, and Guidelines. IEEE Access 2021, 9, 120043–120065. [Google Scholar] [CrossRef]
  3. Schmidl, S.; Wenig, P.; Papenbrock, T. Anomaly Detection in Time Series: A Comprehensive Evaluation. Proc. VLDB Endow. 2022, 15, 1779–1797. [Google Scholar] [CrossRef]
  4. Lin, J.; Keogh, E.J.; Fu, A.W.; Herle, H.V. Approximations to magic: Finding unusual medical time series. In Proceedings of the 18th IEEE Symposium on Computer-Based Medical Systems (CBMS 2005), Dublin, Ireland, 23–24 June 2005; IEEE Computer Society: Washington, DC, USA, 2005; pp. 329–334. [Google Scholar] [CrossRef]
  5. Chandola, V.; Banerjee, A.; Kumar, V. Anomaly detection: A survey. ACM Comput. Surv. 2009, 41, 15. [Google Scholar] [CrossRef]
  6. Chandola, V.; Cheboli, D.; Kumar, V. Detecting Anomalies in a Time Series Database. Retrieved from the University of Minnesota Digital Conservancy. 2009. Available online: https://hdl.handle.net/11299/215791 (accessed on 12 April 2022).
  7. Nakamura, T.; Imamura, M.; Mercer, R.; Keogh, E.J. MERLIN: Parameter-free discovery of arbitrary length anomalies in massive time series archives. In Proceedings of the 20th IEEE International Conference on Data Mining (ICDM 2020), Sorrento, Italy, 17–20 November 2020; pp. 1190–1195. [Google Scholar] [CrossRef]
  8. Yankov, D.; Keogh, E.J.; Rebbapragada, U. Disk aware discord discovery: Finding unusual time series in terabyte sized datasets. In Proceedings of the 7th IEEE International Conference on Data Mining (ICDM 2007), Omaha, NE, USA, 28–31 October 2007; IEEE Computer Society: Washington, DC, USA, 2007; pp. 381–390. [Google Scholar] [CrossRef]
  9. Kraeva, Y.; Zymbler, M.L. Scalable algorithm for subsequence similarity search in very large time series data on cluster of Phi KNL. In Communications in Computer and Information Science, Proceedings of the Data Analytics and Management in Data Intensive Domains—20th International Conference (DAMDID/RCDL 2018), Moscow, Russia, 9–12 October 2018; Manolopoulos, Y., Stupnikov, S.A., Eds.; Revised Selected Papers; Springer: Berlin/Heidelberg, Germany, 2018; Volume 1003, pp. 149–164. [Google Scholar] [CrossRef]
  10. Zymbler, M. A parallel discord discovery algorithm for time series on many-core accelerators. Numer. Methods Program. 2019, 20, 211–223. (In Russian) [Google Scholar] [CrossRef]
  11. Zymbler, M.; Kraeva, Y. Discovery of time series motifs on Intel many-core systems. Lobachevskii J. Math. 2019, 40, 2124–2132. [Google Scholar] [CrossRef]
  12. Zymbler, M.; Grents, A.; Kraeva, Y.; Kumar, S. A parallel approach to discords discovery in massive time series data. Comput. Mater. Contin. 2021, 66, 1867–1878. [Google Scholar] [CrossRef]
  13. Zymbler, M.; Polyakov, A.; Kipnis, M. Time series discord discovery on Intel many-core systems. In Communications in Computer and Information Science, Proceedings of the 13th International Conference (PCT 2019), Kaliningrad, Russia, 2–4 April 2019; Sokolinsky, L., Zymbler, M., Eds.; Revised Selected Papers; Springer: Cham, Switzerland, 2019; Volume 1063, pp. 168–182. [Google Scholar] [CrossRef]
  14. Zymbler, M.; Kraeva, Y. Parallel algorithm for time series motif discovery on graphics processor. Comput. Math. Softw. Eng. 2020, 9, 17–34. (In Russian) [Google Scholar] [CrossRef]
  15. Zymbler, M.; Ivanova, E. Matrix profile-based approach to industrial sensor data analysis inside RDBMS. Mathematics 2021, 9, 2146. [Google Scholar] [CrossRef]
  16. Zymbler, M.; Goglachev, A. Fast summarization of long time series with graphics processor. Mathematics 2022, 10, 1781. [Google Scholar] [CrossRef]
  17. Kraeva, Y.; Zymbler, M. PALMAD: Parallel MERLIN-Based Anomaly Discovery Algorithm for GPU. 2022. Available online: https://github.com/kraevaya/PALMAD (accessed on 1 December 2022).
  18. Lin, J.; Keogh, E.J.; Lonardi, S.; Chiu, B.Y. A symbolic representation of time series, with implications for streaming algorithms. In Proceedings of the 8th ACM SIGMOD Workshop on Research Issues in Data Mining and Knowledge Discovery (DMKD 2003), San Diego, CA, USA, 13 June 2003; ACM: New York, NY, USA, 2003; pp. 2–11. [Google Scholar] [CrossRef]
  19. Fredkin, E. Trie memory. Commun. ACM 1960, 3, 490–499. [Google Scholar] [CrossRef]
  20. Shieh, J.; Keogh, E.J. iSAX: Indexing and mining terabyte sized time series. In Proceedings of the 14th ACM SIGKDD International Conference on Knowledge Discovery and Data Mining, Las Vegas, NV, USA, 24–27 August 2008; ACM: New York, NY, USA, 2008; pp. 623–631. [Google Scholar] [CrossRef]
  21. Buu, H.T.Q.; Anh, D.T. Time series discord discovery based on iSAX symbolic representation. In Proceedings of the 3rd International Conference on Knowledge and Systems Engineering (KSE 2011), Hanoi, Vietnam, 14–17 October 2011; IEEE Computer Society: Washington, DC, USA, 2011; pp. 11–18. [Google Scholar] [CrossRef]
  22. Bu, Y.; Leung, O.T.; Fu, A.W.; Keogh, E.J.; Pei, J.; Meshkin, S. WAT: Finding top-k discords in time series database. In Proceedings of the 7th SIAM International Conference on Data Mining, Minneapolis, MN, USA, 26–28 April 2007; pp. 449–454. [Google Scholar] [CrossRef]
  23. Fu, A.W.; Leung, O.T.; Keogh, E.J.; Lin, J. Finding time series discords based on Haar transform. In Proceedings of the 2nd International Conference on Advanced Data Mining and Applications (ADMA 2006), Xi’an, China, 14–16 August 2006; Springer: Berlin/Heidelberg, Germany, 2006; Volume 4093, pp. 31–41. [Google Scholar] [CrossRef]
  24. Thuy, H.T.T.; Anh, D.T.; Chau, T.N.V. An effective and efficient hash-based algorithm for time series discord discovery. In Proceedings of the 2016 3rd National Foundation for Science and Technology Development Conference on Information and Computer Science (NICS), Danang, Vietnam, 14–16 September 2016; pp. 85–90. [Google Scholar] [CrossRef]
  25. Chau, P.M.; Duc, B.M.; Anh, D.T. Discord detection in streaming time series with the support of R-tree. In Proceedings of the 2018 International Conference on Advanced Computing and Applications (ACOMP), Ho Chi Minh City, Vietnam, 27–29 November 2018; pp. 96–103. [Google Scholar] [CrossRef]
  26. Li, G.; Bräysy, O.; Jiang, L.; Wu, Z.; Wang, Y. Finding time series discord based on bit representation clustering. Knowl.-Based Syst. 2013, 54, 243–254. [Google Scholar] [CrossRef]
  27. Avogadro, P.; Dominoni, M.A. A fast algorithm for complex discord searches in time series: HOT SAX Time. Appl. Intell. 2022, 52, 10060–10081. [Google Scholar] [CrossRef]
  28. Senin, P.; Lin, J.; Wang, X.; Oates, T.; Gandhi, S.; Boedihardjo, A.P.; Chen, C.; Frankenstein, S. Time series anomaly discovery with grammar-based compression. In Proceedings of the 18th International Conference on Extending Database Technology (EDBT 2015), Brussels, Belgium, 23–27 March 2015; OpenProceedings.org: Konstanz, Germany, 2015; pp. 481–492. [Google Scholar] [CrossRef]
  29. Keogh, E.J.; Chakrabarti, K.; Pazzani, M.J.; Mehrotra, S. Dimensionality reduction for fast similarity search in large time series databases. Knowl. Inf. Syst. 2001, 3, 263–286. [Google Scholar] [CrossRef]
  30. Son, N.T. An improvement of disk aware discord discovery algorithm for discovering time series discord. In Proceedings of the 2020 5th International Conference on Green Technology and Sustainable Development (GTSD), Ho Chi Minh City, Vietnam, 27–28 November 2020; pp. 19–23. [Google Scholar] [CrossRef]
  31. Mueen, A.; Nath, S.; Liu, J. Fast approximate correlation for massive time-series data. In Proceedings of the ACM SIGMOD International Conference on Management of Data (SIGMOD 2010), Indianapolis, IN, USA, 6–10 June 2010; ACM: New York, NY, USA, 2010; pp. 171–182. [Google Scholar] [CrossRef]
  32. Yeh, C.M.; Zhu, Y.; Ulanova, L.; Begum, N.; Ding, Y.; Dau, H.A.; Zimmerman, Z.; Silva, D.F.; Mueen, A.; Keogh, E.J. Time series joins, motifs, discords and shapelets: A unifying view that exploits the matrix profile. Data Min. Knowl. Discov. 2018, 32, 83–123. [Google Scholar] [CrossRef]
  33. Nakamura, T.; Mercer, R.; Imamura, M.; Keogh, E.J. MERLIN++: Parameter-free discovery of time series anomalies. Data Min. Knowl. Discov. 2023, 37, 670–709. [Google Scholar] [CrossRef]
  34. Orchard, M.T. A fast nearest-neighbor search algorithm. In Proceedings of the 1991 International Conference on Acoustics, Speech, and Signal Processing (ICASSP ‘91), Toronto, ON, Canada, 14–17 May 1991; IEEE Computer Society: Washington, DC, USA, 1991; pp. 2297–2300. [Google Scholar] [CrossRef]
  35. Wang, J.T.; Wang, X.; Lin, K.D.; Shasha, D.E.; Shapiro, B.A.; Zhang, K. Evaluating a Class of Distance-Mapping Algorithms for Data Mining and Clustering. In Proceedings of the 5th ACM SIGKDD International Conference on Knowledge Discovery and Data Mining, San Diego, CA, USA, 15–18 August 1999; ACM: New York, NY, USA, 1999; pp. 307–311. [Google Scholar] [CrossRef]
  36. Pearson, K. The problem of the random walk. Nature 1905, 72, 294. [Google Scholar] [CrossRef]
  37. de Supinski, B.R.; Scogland, T.R.W.; Duran, A.; Klemm, M.; Bellido, S.M.; Olivier, S.L.; Terboven, C.; Mattson, T.G. The Ongoing Evolution of OpenMP. Proc. IEEE 2018, 106, 2004–2019. [Google Scholar] [CrossRef]
  38. Reyes, R.; López-Rodríguez, I.; Fumero, J.J.; de Sande, F. A preliminary evaluation of OpenACC implementations. J. Supercomput. 2013, 65, 1063–1075. [Google Scholar] [CrossRef]
  39. Yankov, D.; Keogh, E.J.; Rebbapragada, U. Disk aware discord discovery: Finding unusual time series in terabyte sized datasets. Knowl. Inf. Syst. 2008, 17, 241–262. [Google Scholar] [CrossRef]
  40. Wu, Y.; Zhu, Y.; Huang, T.; Li, X.; Liu, X.; Liu, M. Distributed discord discovery: Spark based anomaly detection in time series. In Proceedings of the 2015 IEEE 17th International Conference on High Performance Computing and Communications, 2015 IEEE 7th International Symposium on Cyberspace Safety and Security, and 2015 IEEE 12th International Conference on Embedded Software and Systems, New York, NY, USA, 24–26 August 2015; pp. 154–159. [Google Scholar] [CrossRef]
  41. Huang, T.; Zhu, Y.; Mao, Y.; Li, X.; Liu, M.; Wu, Y.; Ha, Y.; Dobbie, G. Parallel discord discovery. In Proceedings of the Advances in Knowledge Discovery and Data Mining—20th Pacific-Asia Conference (PAKDD 2016), Auckland, New Zealand, 19–22 April 2016; Springer: Berlin/Heidelberg, Germany, 2016; Volume 9652, pp. 233–244. [Google Scholar] [CrossRef]
  42. Zimmerman, Z.; Kamgar, K.; Senobari, N.S.; Crites, B.; Funning, G.J.; Brisk, P.; Keogh, E.J. Matrix profile XIV: Scaling time series motif discovery with GPUs to break a quintillion pairwise comparisons a day and beyond. In Proceedings of the ACM Symposium on Cloud Computing (SoCC 2019), Santa Cruz, CA, USA, 20–23 November 2019; ACM: New York, NY, USA, 2019; pp. 74–86. [Google Scholar] [CrossRef]
  43. Pfeilschifter, G. Time Series Analysis with Matrix Profile on HPC Systems. Master’s Thesis, Department of Informatics, Technical University of Munich, Munich, Germany, 2019. [Google Scholar]
  44. Thuy, T.T.H.; Anh, T.D.; Chau, T.N.V. A new discord definition and an efficient time series discord detection method using GPUs. In Proceedings of the 2021 3rd International Conference on Software Engineering and Development (ICSED 2021), Xiamen, China, 19–21 November 2021; pp. 63–70. [Google Scholar] [CrossRef]
  45. Zhu, B.; Jiang, Y.; Gu, M.; Deng, Y. A GPU acceleration framework for motif and discord based pattern mining. IEEE Trans. Parallel Distrib. Syst. 2021, 32, 1987–2004. [Google Scholar] [CrossRef]
  46. Dean, J.; Ghemawat, S. MapReduce: Simplified data processing on large clusters. In Proceedings of the 6th Symposium on Operating System Design and Implementation (OSDI 2004), San Francisco, CA, USA, 6–8 December 2004; USENIX Association: Berkeley, CA, USA, 2004; pp. 137–150. [Google Scholar]
  47. Snir, M. Technical perspective: The future of MPI. Commun. ACM 2018, 61, 105. [Google Scholar] [CrossRef]
  48. Imani, S.; Keogh, E.J. Matrix profile XIX: Time series semantic motifs: A new primitive for finding higher-level structure in time series. In Proceedings of the 2019 IEEE International Conference on Data Mining (ICDM 2019), Beijing, China, 8–11 November 2019; pp. 329–338. [Google Scholar] [CrossRef]
  49. Imani, S.; Madrid, F.; Ding, W.; Crouter, S.E.; Keogh, E.J. Introducing time series snippets: A new primitive for summarizing long time series. Data Min. Knowl. Discov. 2020, 34, 1713–1743. [Google Scholar] [CrossRef]
  50. Zhu, Y.; Imamura, M.; Nikovski, D.; Keogh, E.J. Introducing time series chains: A new primitive for time series data mining. Knowl. Inf. Syst. 2019, 60, 1135–1161. [Google Scholar] [CrossRef]
  51. Zhu, Y.; Yeh, C.M.; Zimmerman, Z.; Kamgar, K.; Keogh, E.J. Matrix profile XI: SCRIMP++: Time series motif discovery at interactive speeds. In Proceedings of the IEEE International Conference on Data Mining (ICDM 2018), Singapore, 17–20 November 2018; IEEE Computer Society: Washington, DC, USA, 2018; pp. 837–846. [Google Scholar] [CrossRef]
  52. Wei, L.; Keogh, E.; Xi, X. SAXually Explicit Images: Finding Unusual Shapes. In Proceedings of the 6th International Conference on Data Mining (ICDM’06), Hong Kong, China, 18–22 December 2006; pp. 711–720. [Google Scholar] [CrossRef]
  53. Huang, T.; Zhu, Y.; Wu, Y.; Shi, W. J-distance discord: An improved time series discord definition and discovery method. In Proceedings of the 2015 IEEE International Conference on Data Mining Workshop (ICDMW), Atlantic City, NJ, USA, 14–17 November 2015; pp. 303–310. [Google Scholar] [CrossRef]
  54. Kirk, D.B. NVIDIA CUDA software and GPU parallel computing architecture. In Proceedings of the 6th International Symposium on Memory Management (ISMM 2007), Montreal, QC, Canada, 21–22 October 2007; ACM: New York, NY, USA, 2007; pp. 103–104. [Google Scholar] [CrossRef]
  55. Kraeva, Y.; Zymbler, M. A parallel discord discovery algorithm for a graphics processor. Pattern Recognit. Image Anal. 2023, 33, 101–112. [Google Scholar] [CrossRef]
  56. Keogh, E.J.; Lin, J.; Fu, A.W. HOT SAX: Efficiently finding the most unusual time series subsequence. In Proceedings of the 5th IEEE International Conference on Data Mining (ICDM 2005), Houston, TX, USA, 27–30 November 2005; IEEE Computer Society: Washington, DC, USA, 2005; pp. 226–233. [Google Scholar] [CrossRef]
  57. Ferrell, B.; Santuro, S. NASA Shuttle Valve Data. 2005. Available online: https://www.cs.fit.edu/~pkc/nasa/data/ (accessed on 19 March 2022).
  58. Goldberger, A.L.; Amaral, L.A.N.; Glass, L.; Hausdorff, J.M.; Ivanov, P.C.; Mark, R.G.; Mietus, J.E.; Moody, G.B.; Peng, C.K.; Stanley, H.E. PhysioBank, PhysioToolkit, and PhysioNet components of a new research resource for complex physiologic signals. Circulation 2000, 101, 215–220. [Google Scholar] [CrossRef]
  59. Koski, A. Primitive coding of structural ECG features. Pattern Recognit. Lett. 1996, 17, 1215–1222. [Google Scholar] [CrossRef]
  60. van Wijk, J.J.; van Selow, E.R. Cluster and calendar based visualization of time series data. In Proceedings of the IEEE Symposium on Information Visualization 1999 (INFOVIS’99), San Francisco, CA, USA, 24–29 October 1999; IEEE Computer Society: Washington, DC, USA, 1999; pp. 4–9. [Google Scholar] [CrossRef]
  61. Dolganina, N.; Ivanova, E.; Bilenko, R.; Rekachinsky, A. HPC resources of South Ural State University. In Communications in Computer and Information Science, Proceedings of the 16th International Conference on Parallel Computational Technologies (PCT 2022), Dubna, Russia, 29–31 March 2022; Sokolinsky, L., Zymbler, M., Eds.; Springer: Berlin/Heidelberg, Germany, 2022; Volume 1618, pp. 43–55. [Google Scholar] [CrossRef]
  62. Voevodin, V.V.; Antonov, A.S.; Nikitenko, D.A.; Shvets, P.A.; Sobolev, S.I.; Sidorov, I.Y.; Stefanov, K.S.; Voevodin, V.V.; Zhumatiy, S.A. Supercomputer Lomonosov-2: Large scale, deep monitoring and fine analytics for the user community. Supercomput. Front. Innov. 2019, 6, 4–11. [Google Scholar] [CrossRef]
  63. Zymbler, M.; Kraeva, Y.; Latypova, E.; Kumar, S.; Shnayder, D.; Basalaev, A. Cleaning Sensor Data in Smart Heating Control System. In Proceedings of the 2020 Global Smart Industry Conference (GloSIC 2020), Chelyabinsk, Russia, 17–19 November 2020; pp. 375–381. [Google Scholar] [CrossRef]
  64. Kraeva, Y. Anomaly detection in sensor data using parallel computing. Comput. Math. Softw. Eng. 2023, 9, 47–61. (In Russian) [Google Scholar] [CrossRef]
  65. Madrid, F.; Imani, S.; Mercer, R.; Zimmerman, Z.; Senobari, N.S.; Keogh, E.J. Matrix Profile XX: Finding and Visualizing Time Series Motifs of All Lengths using the Matrix Profile. In Proceedings of the 2019 IEEE International Conference on Big Knowledge (ICBK 2019), Beijing, China, 10–11 November 2019; pp. 175–182. [Google Scholar]
  66. Weather for 243 Countries of the World: Chelyabinsk. 2022. Available online: https://rp5.ru/Weather_in_Chelyabinsk/ (accessed on 17 November 2022).
Disclaimer/Publisher’s Note: The statements, opinions and data contained in all publications are solely those of the individual author(s) and contributor(s) and not of MDPI and/or the editor(s). MDPI and/or the editor(s) disclaim responsibility for any injury to people or property resulting from any ideas, methods, instructions or products referred to in the content.

Article Metrics

Citations

Article Access Statistics

Multiple requests from the same IP address are counted as one view.