Modeling the Dynamics of Negative Mutations for a Mouse Population and the Inverse Problem of Determining Phenotypic Differences in the First Generation
Abstract
1. Introduction
2. Materials and Methods
- 1.
- Setting and as the initial approximate value.
- 2.
- Obtaining the solution to the direct problem:
- 3.
- Obtaining the solution to the adjoint problem:Here, is the Dirac delta function.
- 4.
- Obtaining the gradient of the functional (5):
- 5.
- Expressing an approximate solution at the next iteration step:where is a descent parameter.
- 6.
- Checking the condition for stopping the iterative process. If it holds, then we set as the solution to the inverse problem. Otherwise, we set and go to step 2.
- (a)
- In the case of data measured in an experiment with errors, , , the stopping criterion isHere, are error estimates for the input data , , observed experimentally:
- (b)
- In the case of exact input data, the iterative process stops when is less than the error estimate of the finite difference approximation.
3. Results
3.1. A Model Example with a Set of Curves That Well Cover the Region of the Unknown Function Definition
- Introducing the following uniform grids:
- Obtaining the values of the function for for each by using the inverse interpolation method:Thus, we obtain the grid values of the functions , , .
3.2. A Model Example with a Set of Curves That Fractionally Cover the Region of the Unknown Function Definition
3.3. Example of the Real Experimental Data Processing
4. Discussion
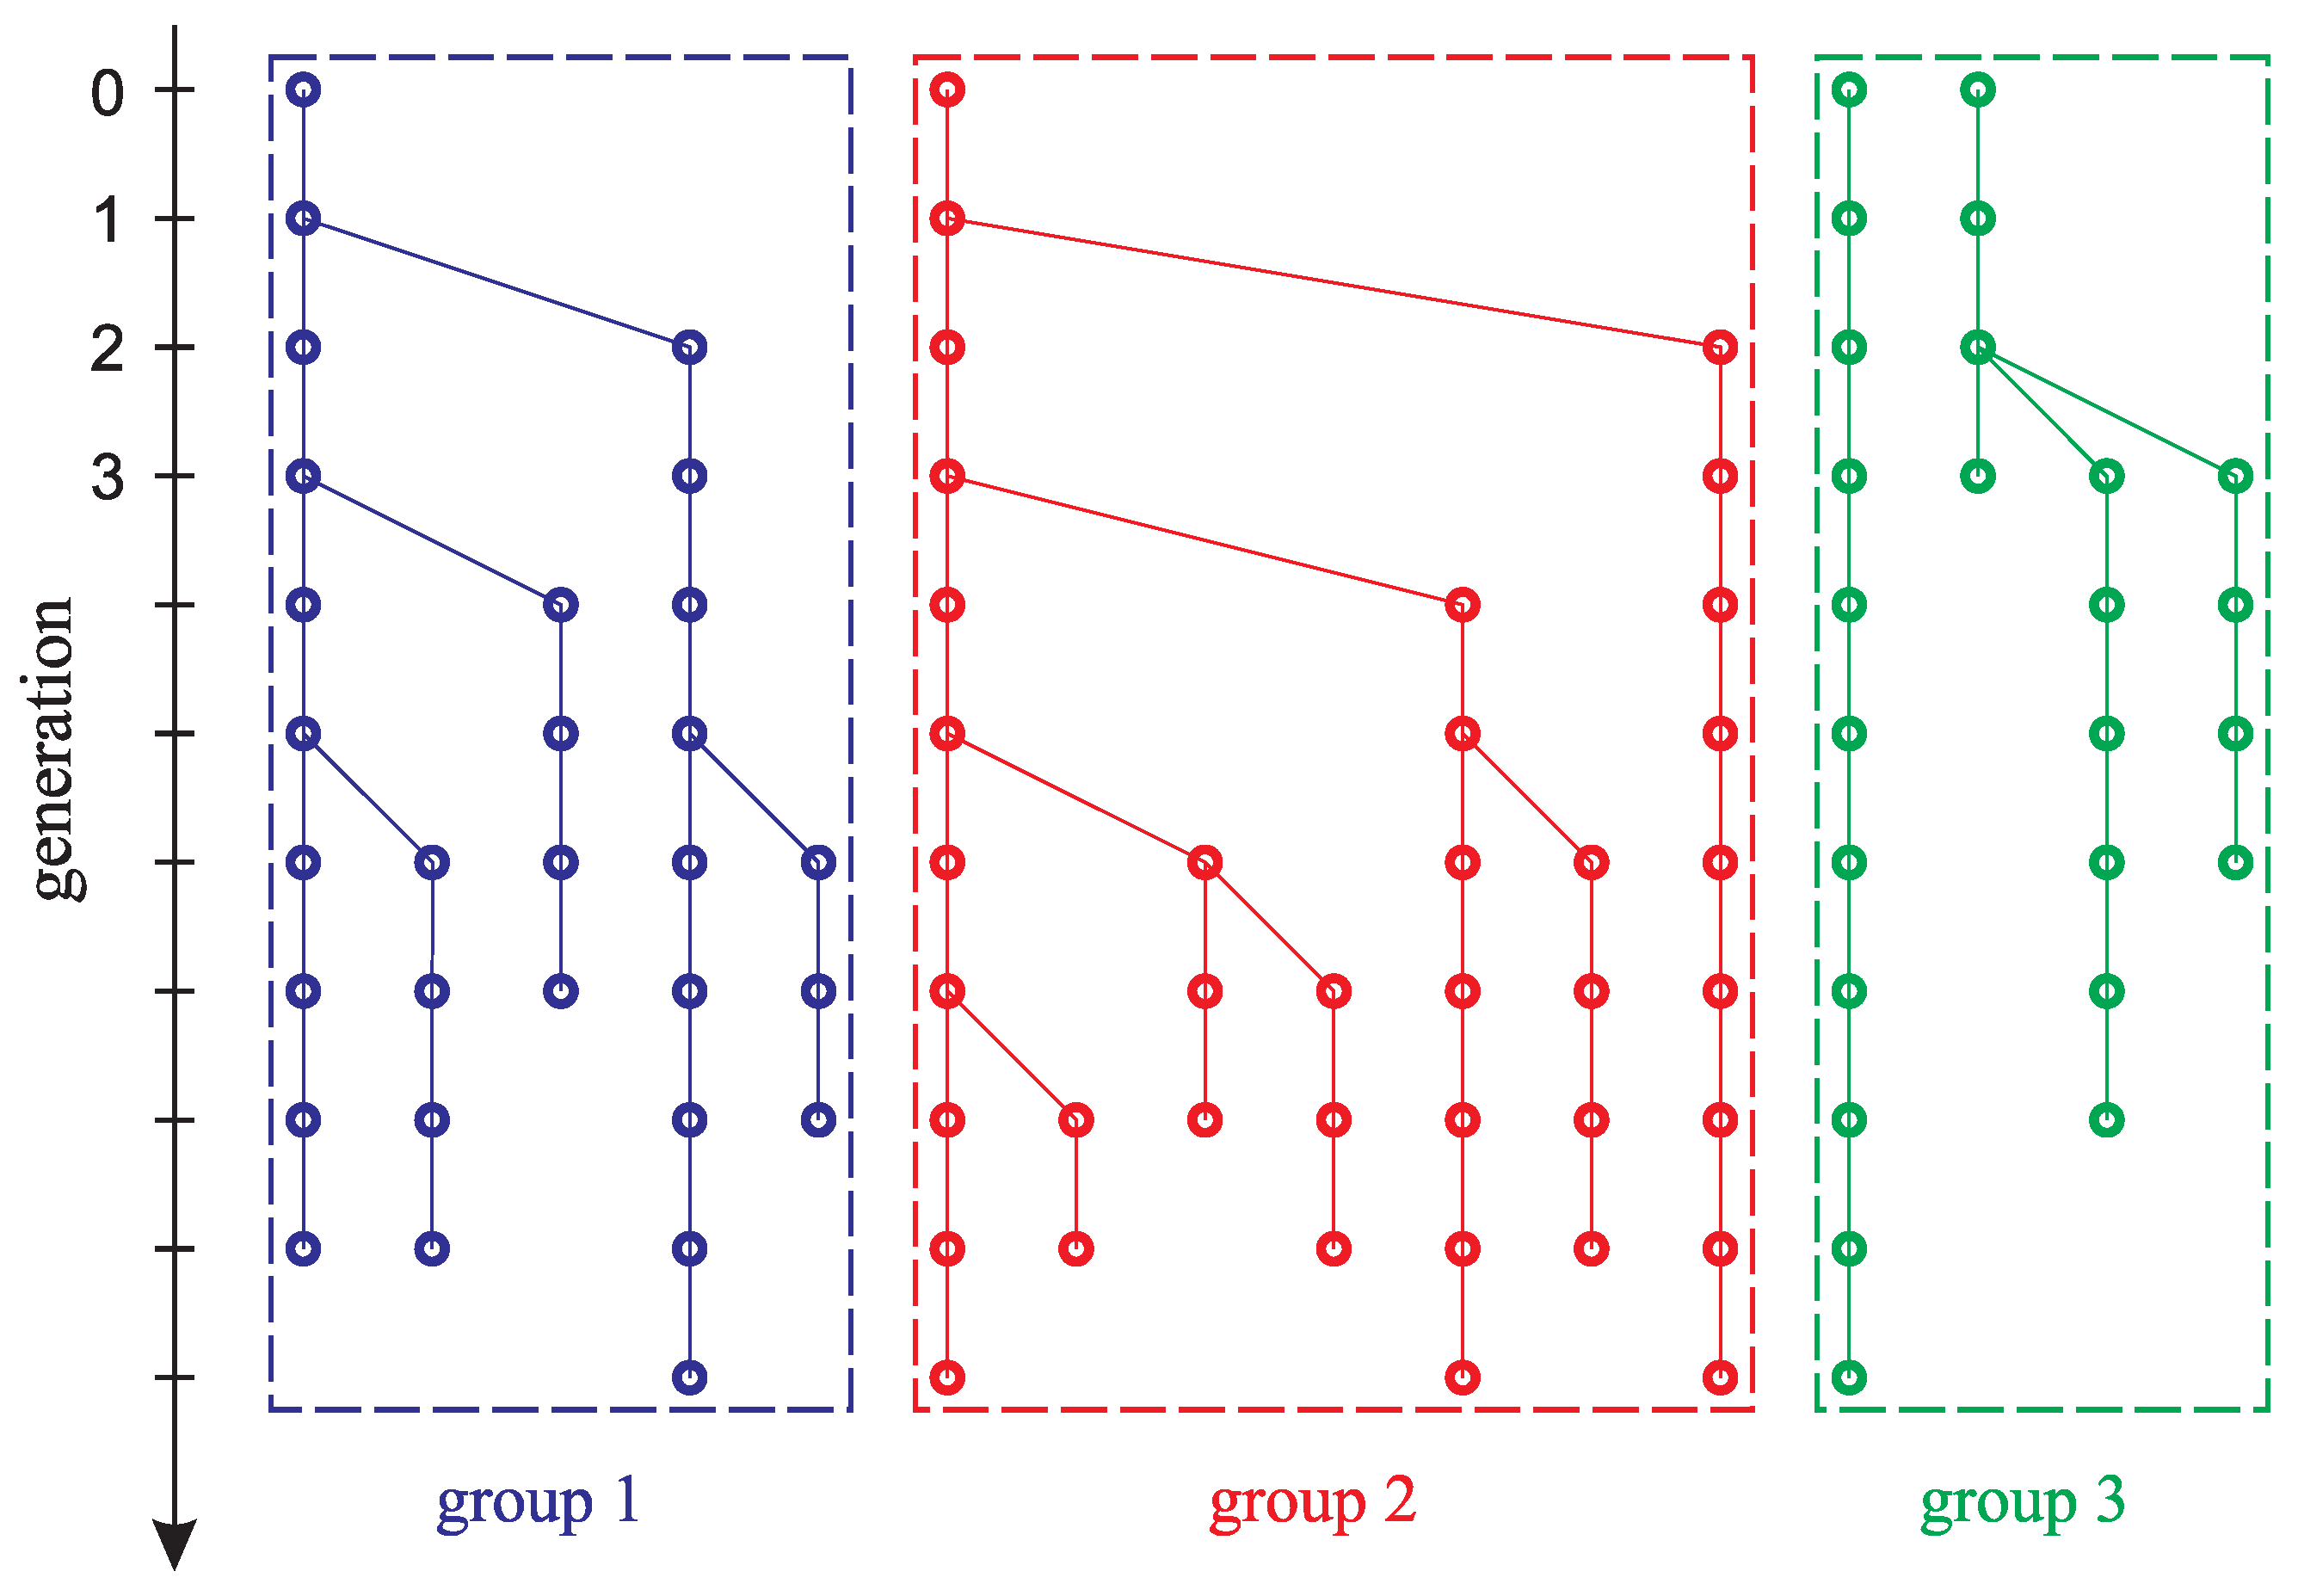
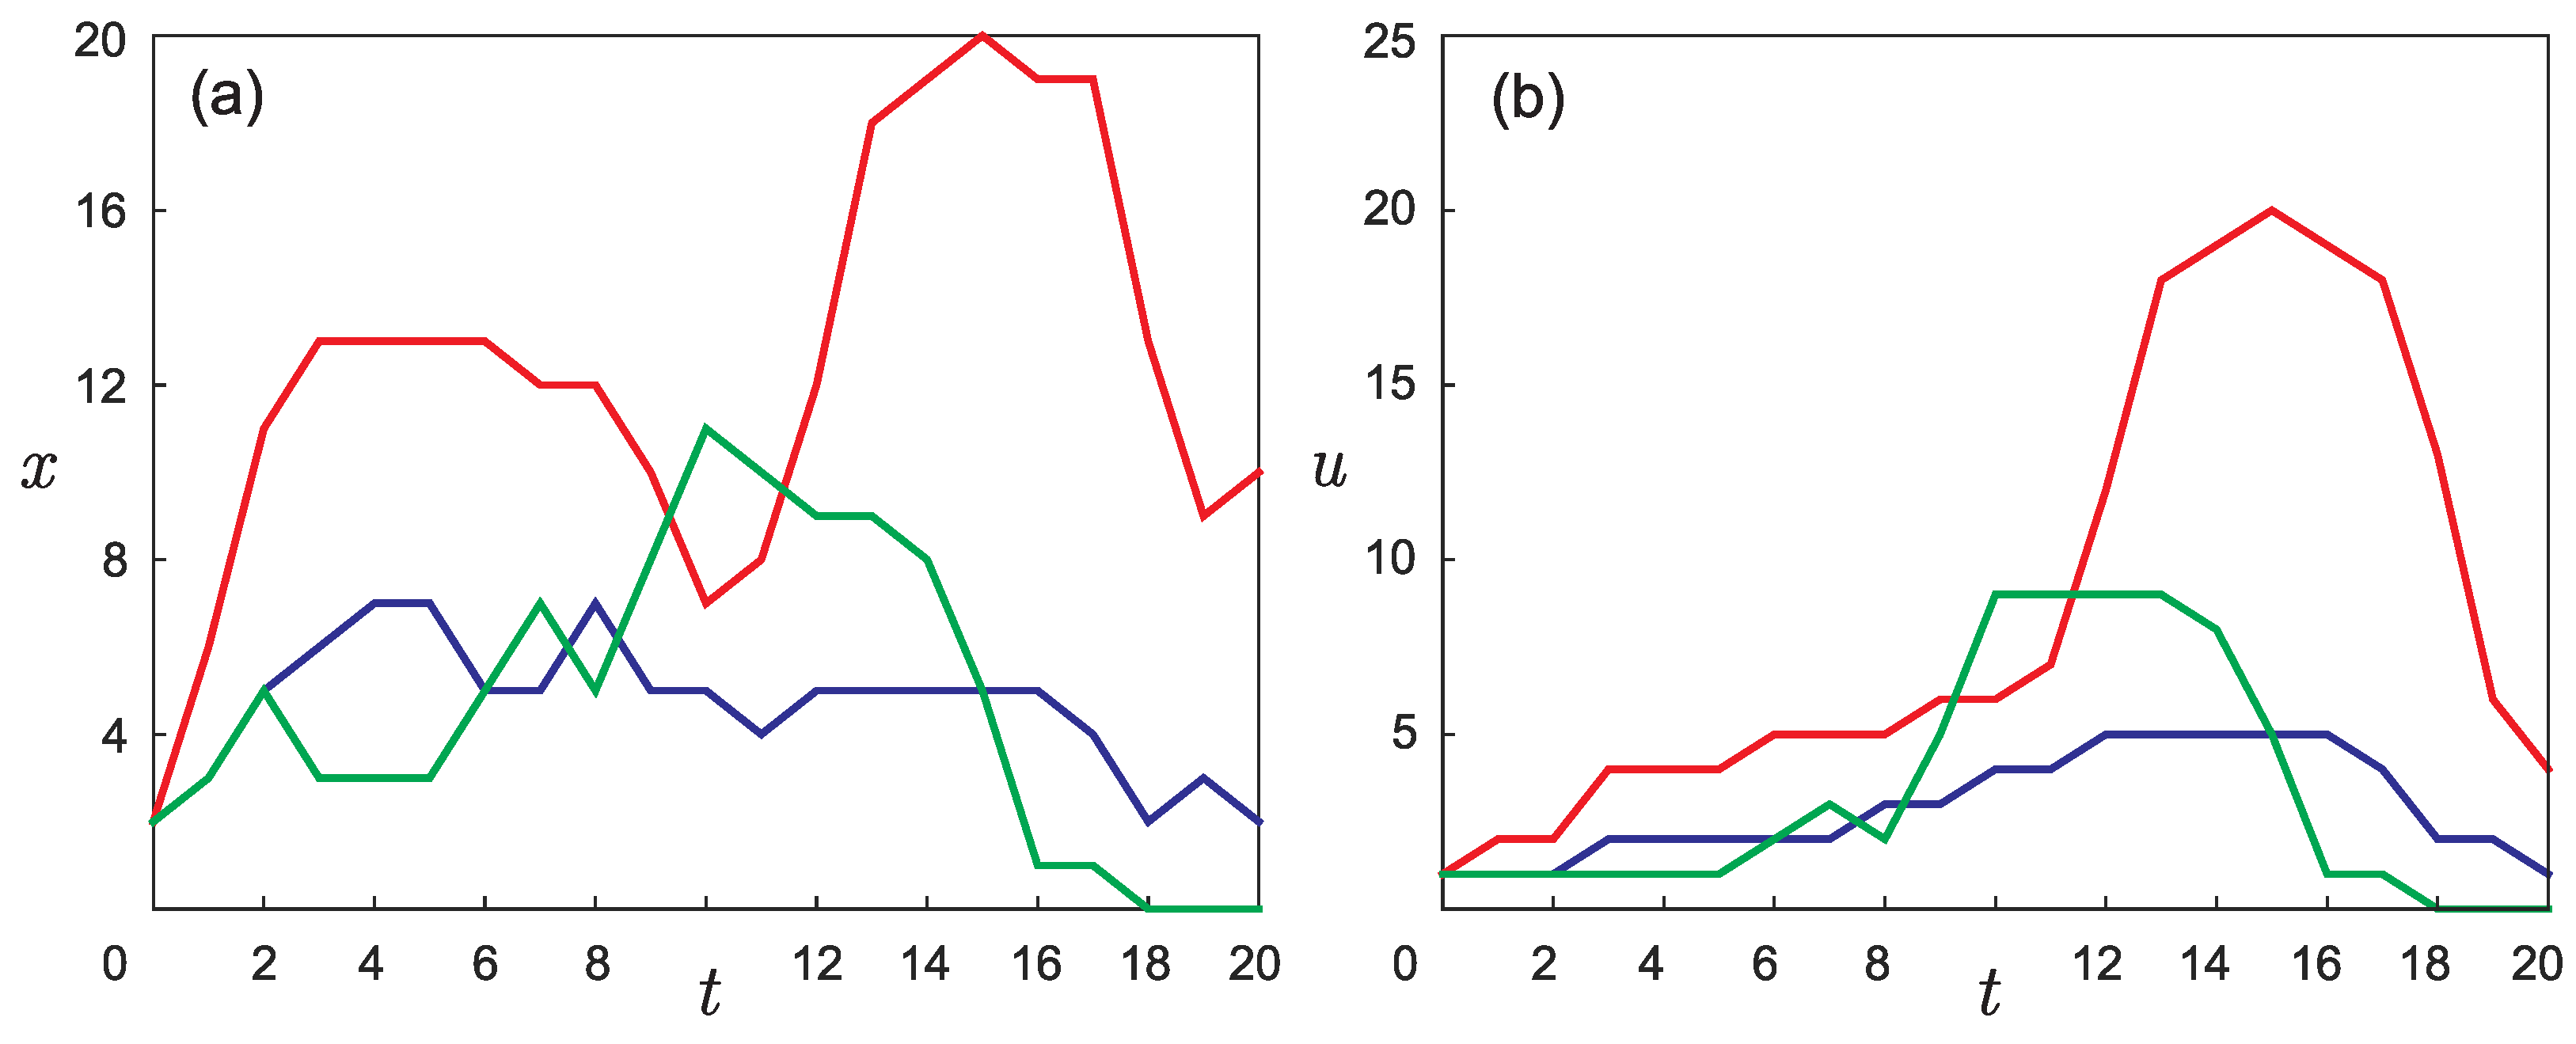
- Each group of laboratory mice in the experiment described in [22] was kept in isolation and could be considered as an individual population. However, the experiment actually involved three pairs of parental mice, which can be considered one group of six mice at the initial time. The original goal of the work was to confirm the assumption that in each group of mice, the number of phenotypic differences in the first generation was different. If the initial pairs of laboratory mice in the experiment were identical, then the three different phenotypic curves shown in Figure 3b would not appear.
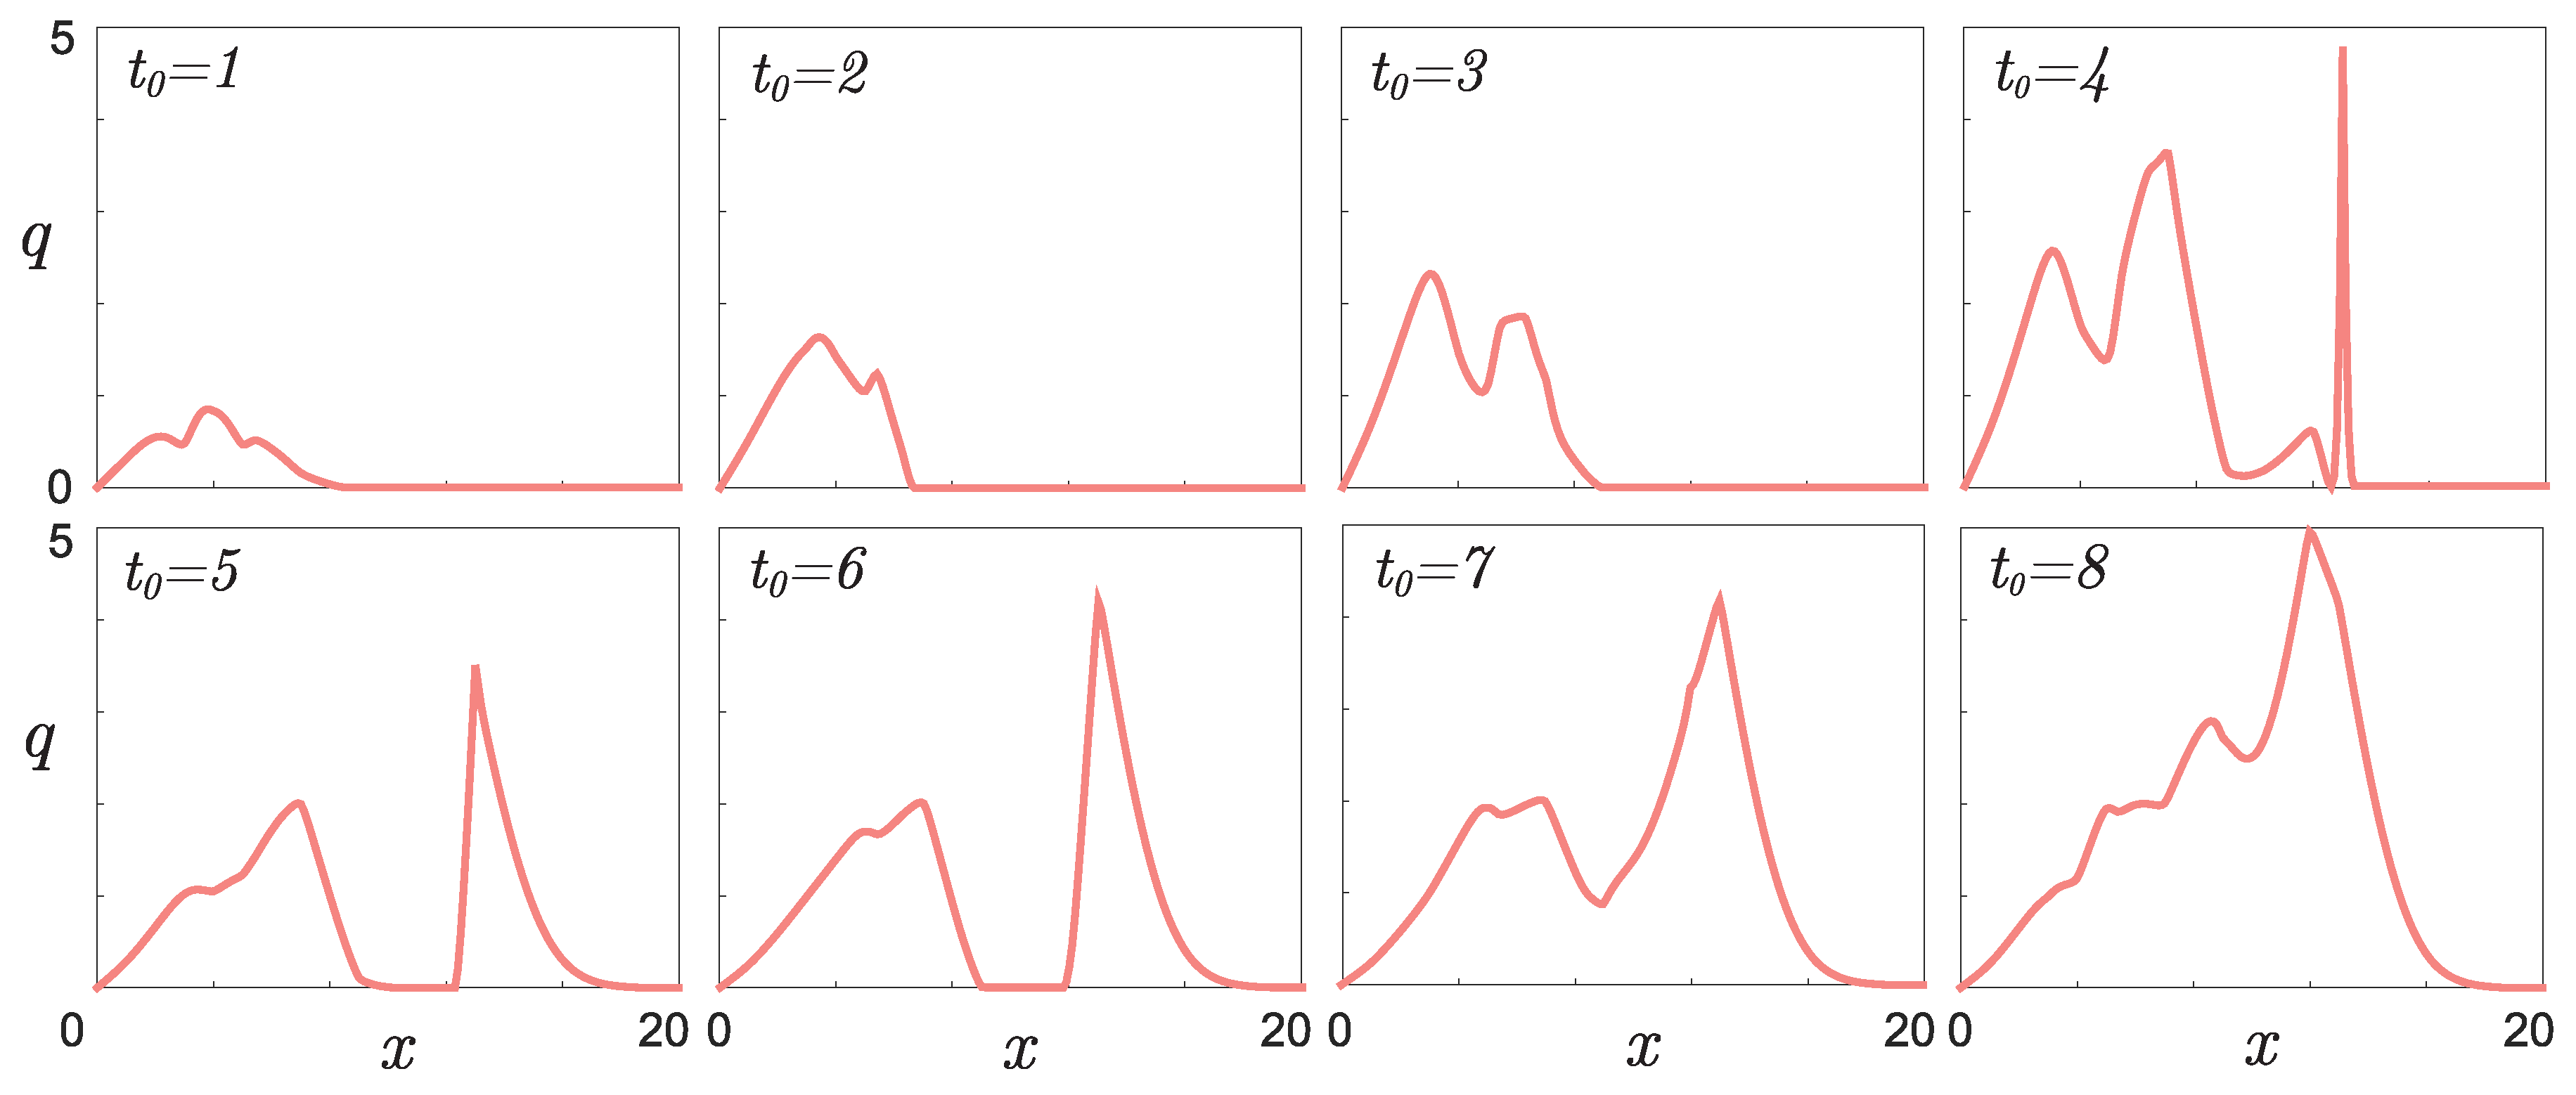
- Figure 6 shows the result of the function retrieving that defines the initial phenotypic differences in the mouse population described in [22] for different values of parameter , which indicates the time for mutation accumulation to a number sufficient for the appearance of visible differences in individuals.From the form of the retrieved initial function, it follows that among the six initial mice, given , there is at least one individual phenotypically different from the others. For example, the green line in Figure 3b may correspond to a pair of “identical” parental mice that gave rise to a population in which visible differences appeared only in the fifth generation. However, if you take a couple of different mice, then a new mutant line will appear already in the second generation (red line). Apparently, the most realistic values are or , since with such a delay time, regardless of the number of individuals at the initial time, there are no more than two different phenotypic groups in the initial set of mice, as a result of which all initial individuals could be considered identical in the experiment.
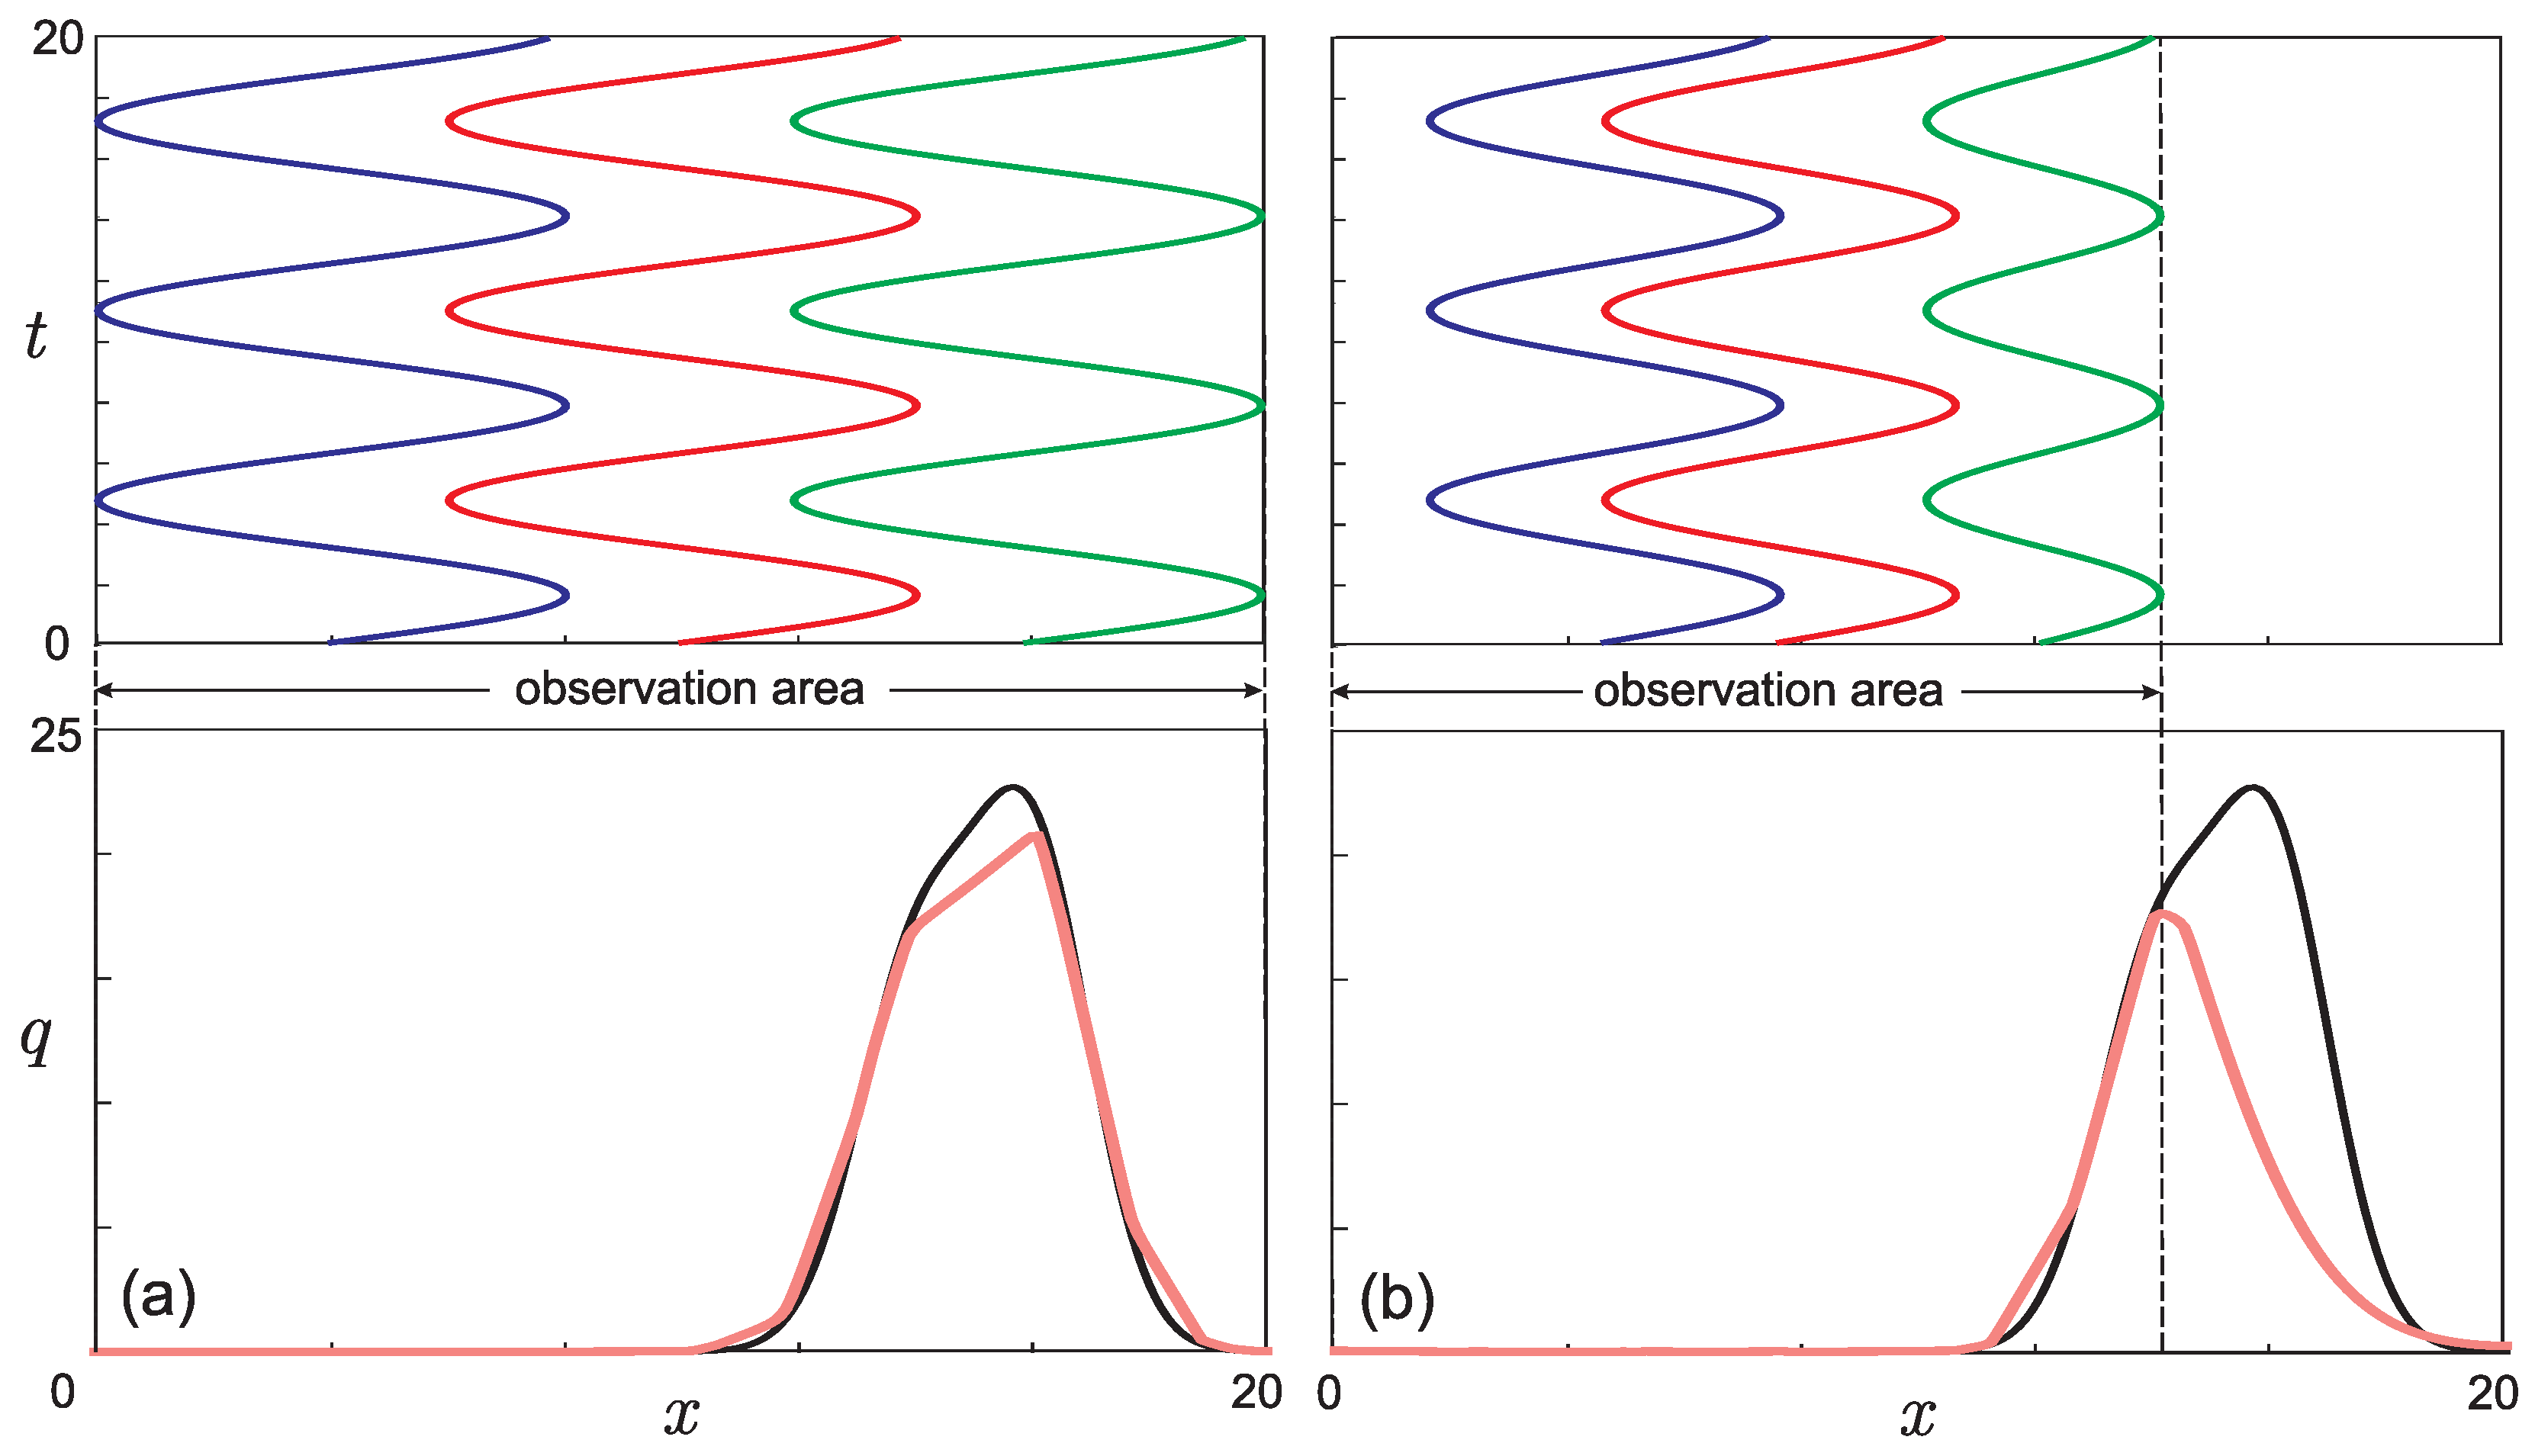
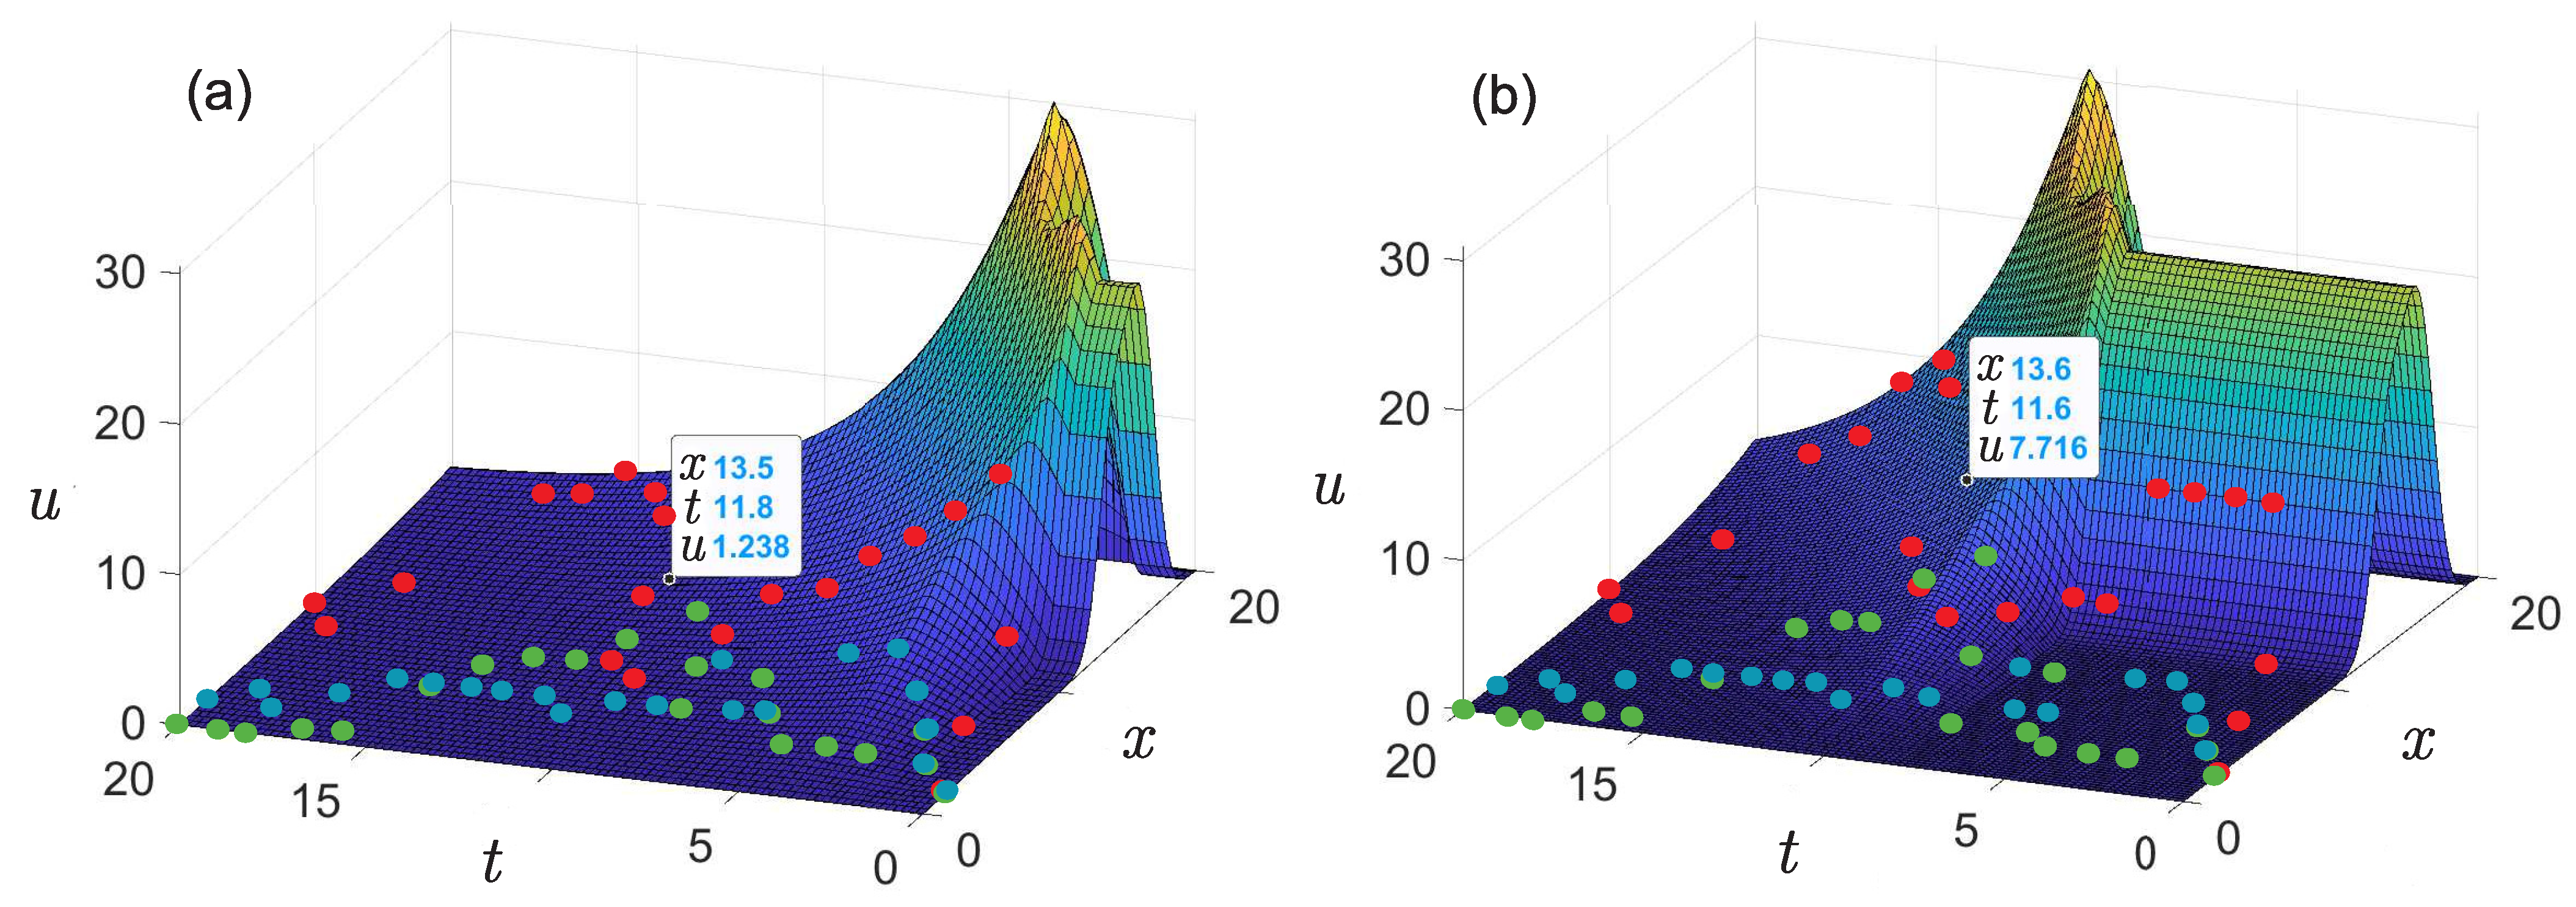
- The presence of a dip in the graphs of the retrieved initial data can be explained by the lack of points on the experimental graphs. Indirectly, this assumption is confirmed by the result of solving the model example presented in Figure 5: with a lack of input data, the initial curve is restored worse.The absence of a dip in the retrieved curve at is due to the fact that the function describing the solution of the direct problem with such a time delay lies in that region of the phase space (see Figure 3a) for which there is sufficient data. This assumption can also be illustrated on three-dimensional graphs of the solution to the direct problem (Figure 7). The blue, red, and green points marked on the graphs correspond to the known coordinates of the nodes on the phase curves , , indicated, respectively, in Table 1, Table 2 and Table 3. The graph in Figure 7a corresponds to . It can be seen that at most points where the experimental data are given, the value of the function is almost equal to zero. Therefore, the initial function is poorly restored from these data (see Figure 6 for ). The graph in Figure 7b corresponds to . Practically all nodal points fall into the range of nonzero values of the function . The initial function is restored without “dips” (see Figure 6 for ). However, this result cannot be considered physically substantiated since it yields to the conclusion that initially there were too many phenotypically different mice in the population, which contradicts the large delay in mutation accumulation.
- The way to improve the retrieval quality is to increase the number of experimental curves in the coverage area.
5. Conclusions
Author Contributions
Funding
Data Availability Statement
Acknowledgments
Conflicts of Interest
Appendix A. Obtaining Additional Information for Solving the Inverse Problem from Experimental Data (Tables in Appendix Section Were Obtained with the Participation of Anastasia Garayeva)
| I | II | III | IV | V |
|---|---|---|---|---|
| Generation | Mice Survival | Offspring per Mating | ||
| 0–2 | 0.67 | 2.64 | 1.77 | 0.87 |
| 3–6 | 0.51 | 1.31 | 0.6681 | 0.6419 |
| 7–12 | 0.49 | 0.96 | 0.4704 | 0.4896 |
| I | II | III | IV | V | VI | VII | VIII | IX | X |
|---|---|---|---|---|---|---|---|---|---|
| n | N | ||||||||
| 0 | 6 | 1 | 1 | 1 | 3 | 2 | 2 | 2 | 2 |
| 1 | 11 | 1 | 2 | 1 | 4 | 2.85 | 3 | 6 | 3 |
| 2 | 22 | 1 | 2 | 1 | 4 | 5.4 | 5 | 11 | 5 |
| 3 | 22 | 2 | 4 | 1 | 7 | 3.17 | 6 | 13 | 3 |
| 4 | 23 | 2 | 4 | 1 | 7 | 3.25 | 7 | 13 | 3 |
| 5 | 23 | 2 | 4 | 1 | 7 | 3.34 | 7 | 13 | 3 |
| 6 | 24 | 2 | 5 | 2 | 9 | 2.66 | 5 | 13 | 5 |
| 7 | 24 | 2 | 5 | 3 | 10 | 2.35 | 5 | 12 | 7 |
| 8 | 23 | 3 | 5 | 2 | 10 | 2.3 | 7 | 12 | 5 |
| 9 | 23 | 3 | 6 | 5 | 14 | 1.61 | 5 | 10 | 8 |
| 10 | 22 | 4 | 6 | 9 | 19 | 1.17 | 5 | 7 | 11 |
| 11 | 22 | 4 | 7 | 9 | 20 | 1.09 | 4 | 8 | 10 |
| 12 | 21 | 5 | 12 | 9 | 26 | 0.82 | 4 | 10 | 7 |
| 13 | 21 | 5 | 18 | 9 | 32 | 0.65 | 3 | 12 | 5 |
| 14 | 21 | 5 | 19 | 8 | 32 | 0.64 | 3 | 12 | 5 |
| 15 | 20 | 5 | 20 | 5 | 30 | 0.67 | 3 | 13 | 3 |
| 16 | 20 | 5 | 19 | 1 | 25 | 0.79 | 4 | 15 | 1 |
| 17 | 19 | 4 | 19 | 1 | 23 | 0.84 | 3 | 15 | 1 |
| 18 | 19 | 2 | 13 | 0 | 15 | 0.84 | 2 | 11 | 0 |
| 19 | 19 | 2 | 6 | 0 | 8 | 1.55 | 3 | 9 | 0 |
| 20 | 18 | 1 | 4 | 0 | 5 | 2.43 | 2 | 10 | 0 |
References
- Peisajovich, S.; Garbarino, J.; Wei, P.; Lim, W. Rapid Diversification of Cell Signaling Phenotypes by Modular Domain Recombination. Science 2010, 328, 368–372. [Google Scholar] [CrossRef] [PubMed]
- Showalter, A.; Tsai, M. A reexamination of the nucleotide incorporation fidelity of DNA polymerases. Biochemistry 2002, 41, 10571–10576. [Google Scholar] [CrossRef]
- Echols, H.; Goodman, M.F. Fidelity mechanisms in DNA replication. Annu. Rev. Biochem. 1991, 60, 477–511. [Google Scholar] [CrossRef] [PubMed]
- Kunkel, T. Evolving Views of DNA Replication (In)Fidelity. Cold Spring Harb. Symp. Quant. Biol. 2009, 74, 91–101. [Google Scholar] [CrossRef]
- Kunkel, T.; Burgers, P. Dividing the workload at a eukaryotic replication fork. Trends Cell Biol. 2008, 18, 521–527. [Google Scholar] [CrossRef] [PubMed]
- McCulloch, S.; Kunkel, T. The fidelity of DNA synthesis by eukaryotic replicative and translesion synthesis polymerases. Cell Res. 2008, 18, 148–161. [Google Scholar] [CrossRef]
- Charles, J.S. Quantifying the contributions of base selectivity, proofreading and mismatch repair to nuclear DNA replication in Saccharomyces cerevisiae. DNA Repair 2015, 31, 41–51. [Google Scholar] [CrossRef]
- Alberts, B. Molecular Biology of the Cell; Garland Science, Taylor and Francis Group: New York, NY, USA, 2015. [Google Scholar]
- Burgers, P. Polymerase Dynamics at the Eukaryotic DNA Replication Fork. J. Biol. Chem. 2009, 284, 4041–4045. [Google Scholar] [CrossRef]
- Prindle, M.; Loeb, L. DNA Polymerase Delta in Dna Replication and Genome Maintenance. Environ. Mol. Mutagen. 2012, 53, 666–682. [Google Scholar] [CrossRef]
- Johnson, R.; Klassen, R.; Prakash, L.; Prakash, S. A Major Role of DNA Polymerase δ in Replication of Both the Leading and Lagging DNA Strands. Mol. Cell 2015, 59, 163–175. [Google Scholar] [CrossRef]
- Lujan, S.; Williams, J.; Kunkela, T. DNA polymerases divide the labor of genome replication. Trends Cell Biol. 2016, 26, 640–654. [Google Scholar] [CrossRef] [PubMed]
- Ma, X.; Dong, L.; Liu, X.; Ou, K.; Yang, L. POLE/POLD1 mutation and tumor immunotherapy. J. Exp. Clin. Cancer Res. 2022, 41, 216. [Google Scholar] [CrossRef] [PubMed]
- Gola, M.; Stefaniak, P.; Godlewski, J.; Jereczek-Fossa, B.; Starzyńska, A. Prospects of POLD1 in Human Cancers: A Review. Cancers 2023, 15, 1905. [Google Scholar] [CrossRef] [PubMed]
- Godlewski, J.; Stefaniak, P.; Kiezun, J.; Krazinski, B. DNA Polymerase Delta 1 Catalytic Subunit (POLD1) as a Prognostic Factor in Clear Cell Renal Cell Carcinoma Patients. In Vivo 2022, 36, 1188–1194. [Google Scholar] [CrossRef] [PubMed]
- Brunet, E.; Rouzine, I.; Wilke, C. The stochastic edge in adaptive evolution. Genetics 2008, 179, 603–620. [Google Scholar] [CrossRef] [PubMed]
- Hallatschek, O.; Geyrhofer, L. Collective fluctuations in the dynamics of adaptation and other traveling waves. Genetics 2016, 202, 1201–1227. [Google Scholar] [CrossRef]
- Travis, J.; Travis, E. Mutator dynamics in fluctuating environments. Proc. Biol. Sci. 2002, 269, 591–597. [Google Scholar] [CrossRef]
- Good, B.; Desai, M. Evolution of Mutation Rates in Rapidly Adapting Asexual Populations. Genetics 2016, 204, 1249–1266. [Google Scholar] [CrossRef]
- Desai, M.; Fisher, D. The balance between mutators and nonmutators in asexual populations. Genetics 2011, 188, 997–1014. [Google Scholar] [CrossRef]
- Garaeva, A.; Sidorova, A.; Levashova, N.; Tverdislov, V. Self-Organized Criticality in the Autowave Model of Speciation. Mosc. Univ. Phys. Bull. 2020, 75, 398–408. [Google Scholar] [CrossRef]
- Uchimura, A.; Higuchi, M.; Minakuchi, Y.; Ohno, M.; Toyoda, A.; Fujiyama, A.; Miura, I.; Wakana, S.; Nishino, J.; Yag, T. Germline mutation rates and the long-term phenotypic effects of mutation accumulation in wild-type laboratory mice and mutator mice. Genome Res. 2015, 25, 1125–1134. [Google Scholar] [CrossRef]
- Lynch, M.; Ackerman, M.; Gout, J.; Long, H.; Sung, W.; Thomas, W.; Foster, P. Genetic drift, selection and the evolution of the mutation rate. Nat. Rev. Genet. 2016, 17, 704–714. [Google Scholar] [CrossRef] [PubMed]
- Butuzov, V.; Nefedov, N.; Schneider, K. Singularly perturbed boundary value problems for systems of Tikhonov’s type in case of exchange of stabilities. J. Differ. Equ. 1999, 159, 427–446. [Google Scholar] [CrossRef]
- Butuzov, V.; Nefedov, N.; Schneider, K. On a singularly perturbed system of parabolic equations in the case of intersecting roots of the degenerate equation. Comput. Math. Math. Phys. 2002, 42, 176–187. [Google Scholar]
- Tikhonov, A.N.; Goncharsky, A.V.; Stepanov, V.V.; Yagola, A.G. Numerical Methods for the Solution of Ill-Posed Problems; Kluwer Academic Publishers: Dordrecht, The Netherlands, 1995. [Google Scholar]
- Haskell, B.C. The method of steepest descent for non-linear minimization problems. Q. Appl. Math. 1944, 2, 258–261. [Google Scholar] [CrossRef]
- Kabanikhin, S.; Shishlenin, M. Quasi-solution in inverse coefficient problems. J. Inverse Ill-Posed Probl. 2008, 16, 705–713. [Google Scholar] [CrossRef]
- Vasin, V.; Eremin, I. Operators and Iterative Processes of Fejér Type: Theory and Applications; Walter de Gruyter: Berlin, Germany, 2009. [Google Scholar]
- Klyuchinskiy, D.; Novikov, N.; Shishlenin, M. CPU-time and RAM memory optimization for solving dynamic inverse problems using gradient-based approach. J. Comput. Phys. 2021, 439, 110374. [Google Scholar] [CrossRef]
- Hairer, E.; Wanner, G. Solving Ordinary Differential Equations II. Stiff and Differential-Algebraic Problems; Springer: Berlin/Heidelberg, Germany, 1996. [Google Scholar]
- Rosenbrock, H. Some general implicit processes for the numerical solution of differential equations. Comput. J. 1963, 5, 329–330. [Google Scholar] [CrossRef]
- Wen, X. High order numerical methods to a type of delta function integrals. J. Comput. Phys. 2007, 226, 1952–1967. [Google Scholar] [CrossRef]
- Lukyanenko, D.; Borzunov, A.; Shishlenin, M. Solving coefficient inverse problems for nonlinear singularly perturbed equations of the reaction-diffusion-advection type with data on the position of a reaction front. Commun. Nonlinear Sci. Numer. Simul. 2021, 99, 105824. [Google Scholar] [CrossRef]
- Lukyanenko, D.; Yeleskina, T.; Prigorniy, I.; Isaev, T.; Borzunov, A.; Shishlenin, M. Inverse problem of recovering the initial condition for a nonlinear equation of the reaction-diffusion-advection type by data given on the position of a reaction front with a time delay. Mathematics 2021, 9, 342. [Google Scholar] [CrossRef]
- Levashova, N.; Gorbachev, A.; Argun, R.; Lukyanenko, D. The problem of the non-uniqueness of the solution to the inverse problem of recovering the symmetric states of a bistable medium with data on the position of an autowave front. Symmetry 2021, 13, 680. [Google Scholar] [CrossRef]
- Argun, R.; Gorbachev, A.; Lukyanenko, D.; Shishlenin, M. On some features of the numerical solving of coefficient inverse problems for an equation of the reaction-diffusion-advection-type with data on the position of a reaction front. Mathematics 2021, 9, 2894. [Google Scholar] [CrossRef]
- Argun, R.; Gorbachev, A.; Levashova, N.; Lukyanenko, D. Inverse problem for an equation of the reaction-diffusion-advection type with data on the position of a reaction front: Features of the solution in the case of a nonlinear integral equation in a reduced statement. Mathematics 2021, 9, 2342. [Google Scholar] [CrossRef]
- Isakov, V.; Kabanikhin, S.; Shananin, A.; Shishlenin, M.; Zhang, S. Algorithm for determining the volatility function in the Black-Scholes model. Comput. Math. Math. Phys. 2019, 59, 1753–1758. [Google Scholar] [CrossRef]

| 0 | 1 | 2 | 3 | 4 | 5 | 6 | 7 | 8 | 9 | 10 | 11 | 12 | 13 | 14 | 15 | 16 | 17 | 18 | 19 | 20 | |
| 2 | 3 | 5 | 6 | 7 | 7 | 5 | 5 | 7 | 5 | 5 | 4 | 5 | 5 | 5 | 5 | 5 | 4 | 2 | 3 | 2 | |
| 1 | 1 | 1 | 2 | 2 | 2 | 2 | 2 | 3 | 3 | 4 | 4 | 5 | 5 | 5 | 5 | 5 | 4 | 2 | 2 | 1 |
| 0 | 1 | 2 | 3 | 4 | 5 | 6 | 7 | 8 | 9 | 10 | 11 | 12 | 13 | 14 | 15 | 16 | 17 | 18 | 19 | 20 | |
| 2 | 6 | 11 | 13 | 13 | 13 | 13 | 12 | 12 | 10 | 7 | 8 | 12 | 18 | 19 | 20 | 19 | 19 | 13 | 9 | 10 | |
| 1 | 2 | 2 | 4 | 4 | 4 | 5 | 5 | 5 | 6 | 6 | 7 | 12 | 18 | 19 | 20 | 19 | 19 | 13 | 6 | 4 |
| 0 | 1 | 2 | 3 | 4 | 5 | 6 | 7 | 8 | 9 | 10 | 11 | 12 | 13 | 14 | 15 | 16 | 17 | 18 | 19 | 20 | |
| 2 | 3 | 5 | 3 | 3 | 3 | 5 | 7 | 5 | 8 | 11 | 10 | 9 | 9 | 8 | 5 | 1 | 1 | 0 | 0 | 0 | |
| 1 | 1 | 1 | 1 | 1 | 1 | 2 | 3 | 2 | 5 | 9 | 9 | 9 | 9 | 8 | 5 | 1 | 1 | 0 | 0 | 0 |
Disclaimer/Publisher’s Note: The statements, opinions and data contained in all publications are solely those of the individual author(s) and contributor(s) and not of MDPI and/or the editor(s). MDPI and/or the editor(s) disclaim responsibility for any injury to people or property resulting from any ideas, methods, instructions or products referred to in the content. |
© 2023 by the authors. Licensee MDPI, Basel, Switzerland. This article is an open access article distributed under the terms and conditions of the Creative Commons Attribution (CC BY) license (https://creativecommons.org/licenses/by/4.0/).
Share and Cite
Argun, R.; Levashova, N.; Lukyanenko, D.; Sidorova, A.; Shishlenin, M. Modeling the Dynamics of Negative Mutations for a Mouse Population and the Inverse Problem of Determining Phenotypic Differences in the First Generation. Mathematics 2023, 11, 3180. https://doi.org/10.3390/math11143180
Argun R, Levashova N, Lukyanenko D, Sidorova A, Shishlenin M. Modeling the Dynamics of Negative Mutations for a Mouse Population and the Inverse Problem of Determining Phenotypic Differences in the First Generation. Mathematics. 2023; 11(14):3180. https://doi.org/10.3390/math11143180
Chicago/Turabian StyleArgun, Raul, Natalia Levashova, Dmitry Lukyanenko, Alla Sidorova, and Maxim Shishlenin. 2023. "Modeling the Dynamics of Negative Mutations for a Mouse Population and the Inverse Problem of Determining Phenotypic Differences in the First Generation" Mathematics 11, no. 14: 3180. https://doi.org/10.3390/math11143180
APA StyleArgun, R., Levashova, N., Lukyanenko, D., Sidorova, A., & Shishlenin, M. (2023). Modeling the Dynamics of Negative Mutations for a Mouse Population and the Inverse Problem of Determining Phenotypic Differences in the First Generation. Mathematics, 11(14), 3180. https://doi.org/10.3390/math11143180


