Article

How Do Citizens View Digital Government Services? Study on Digital Government Service Quality Based on Citizen Feedback

1
School of Economics and Management, Dalian University of Technology, Dalian 116081, China
2
School of Software Technology, Dalian University of Science and Technology, Dalian 116030, China
3
School of Computer Science and Technology, Dalian University of Technology, Dalian 116081, China
*
Author to whom correspondence should be addressed.
Mathematics 2023, 11(14), 3122; https://doi.org/10.3390/math11143122
Submission received: 31 May 2023 / Revised: 10 July 2023 / Accepted: 13 July 2023 / Published: 14 July 2023
(This article belongs to the Special Issue Artificial Intelligence and Data Science)

Abstract

:
Research on government service quality can help ensure the success of digital government services and has been the focus of numerous studies that proposed different frameworks and approaches. Most of the existing studies are based on traditional researcher-led methods, which struggle to capture the needs of citizens. In this paper, a citizen-feedback-based analysis framework was proposed to explore citizen demands and analyze the service quality of digital government. Citizen feedback data are a direct expression of citizens’ demands, so the citizen-feedback-based framework can help to obtain more targeted management insights and improve citizen satisfaction. Efficient machine learning methods used in the framework make data collection and processing more efficient, especially for large-scale internet data. With the crawled user feedback data from the Q&A e-government portal of Luzhou, Sichuan Province, China, we conducted experiments on the proposed framework to verify its feasibility. From citizens’ online feedback on Q&A services, we extracted five service quality factors: efficiency, quality, attitude, compliance, and execution of response. The analysis of five service quality factors provides some management insights, which can provide a guide for improvements in Q&A services.

1. Introduction

With the advances in information and communication technologies (ICTs), digital government service delivery is being prioritized by governments worldwide to embrace good government principles and achieve policy goals [1]. For example, all 193 UN member states use national portals to disseminate government information, and 47 percent of these states provide online transaction services such as the submission of income tax returns and payment of utility bills [2]. However, a significant proportion of citizens are not satisfied with their online interactions with public organizations in terms of functionality and interactivity [3,4,5], and significant challenges remain in designing effective digital government services to meet citizens’ needs and requirements [6]. Service quality analyses can help service providers and designers better understand citizens’ needs. Traditionally, government service quality analyses have primarily focused on surveys or interviews from relevant citizens, and thus required significant time and costs for the data-collection [7]. Moreover, the existing survey-based methods usually suffer from the drawback of a finite number of questionnaire items [8], which makes it difficult to flexibly grasp the changing needs of citizens. Therefore, it is necessary to explore a more efficient and flexible digital government service quality analysis framework.
Citizens’ (users’) feedback regarding digital government services can enhance the ability of citizens to express (dis)satisfaction with public processes and services. Many digital government service systems have feedback modules to allow for citizens to express their opinions on government services. For example, Figure 1 shows a snapshot of a Q&A e-government portal (https://wen.lzep.cn/node/reply.html, accessed on 30 May 2023) of Luzhou, Sichuan Province, China, where citizens can express their satisfaction with this service and provide feedback through reviews. Reviews and user satisfaction with the service are recorded by the information system in the form of feedback data, which is applied to research on service quality in many fields [9,10,11,12]. The feedback information is a direct expression of citizens’ demands. Fully mining citizens’ demands and analyzing the service quality of digital government based on this information can obtain more targeted management insights to help the government provide better services and improve citizen satisfaction. However, research on digital government service quality based on citizens’ online feedback is still relatively scarce. Consequently, it is of the utmost important to provide an efficient service quality analysis method based on citizens’ online feedback regarding digital government services.
Note that it is not trivial to efficiently mine the voice of citizens from online data due to the large volume and noisy nature of the feedback data. There is still a lack of studies on identifying digital government service quality factors from citizen reviews and deriving managerial insights from the relationship between these factors and citizen satisfaction. To this end, we need to address the following questions:
  • RQ1. What factors of service quality do citizens care about?
  • RQ2. How does the government perform regarding these factors from a citizen’s perspective?
  • RQ3. What is the relationship between these factors and citizens’ overall service satisfaction?
To systematically answer the above questions, we proposed a citizen feedback-based analysis framework for digital government service quality. To answer RQ1, we obtained digital government service quality factors based on citizen comment text using text-mining methods and a literature review. For RQ2, we designed evaluation factors regarding the sentiment and importance of service quality factors to analyze people’s opinions on government service, as expressed by reviews. To address RQ3, we conducted a dominance analysis and correspondence analysis of the service quality factors in reviews and the overall satisfaction of citizens with government services to explore the relationship between them. The proposed methodological framework has two salient features. First, its research data come from citizens’ direct feedback on government services, which can help to obtain citizens’ feelings about service quality and draw more specific and targeted conclusions. Second, data-mining techniques, such as sentiment analysis, text classification and topic discovery, are used for service quality factor identification and analysis, which are more efficient than traditional methods. This paper makes the following contributions.
  • This study theoretically contributes to the digital government service evaluation domain by developing a technical framework (new method) that utilizes machine learning methods to analyze digital government service quality based on online review data to address the lack of flexibility and pertinence of existing methods, which is an unprecedented attempt;
  • This study makes managerial contributions in helping digital government service providers and policymakers to enhance citizen satisfaction by providing an instrument to obtain a comprehensive analysis of digital government services from a citizens’ usage perspective.
The rest of the paper is structured as follows. Section 2 reviews the related literature. In Section 3, we present a citizen feedback-based analysis framework for digital government service quality. The detailed description and results of the experiments are given in Section 4. The final section concludes with contributions, limitations, and suggestions for further research directions.

2. Related Works

2.1. Citizen Satisfaction and Digital Government Service Quality

Satisfaction is the result of the difference between expected and perceived service [13], and it is usually high, as long as quality service is maintained [14]. High-quality public service not only leads to satisfaction, but also builds citizens’ confidence and trust [15]. In order to increase the levels of citizen satisfaction by offering high-quality digital government services, various attempts have been made by researchers to investigate service quality evaluations and the relationship between service quality and citizen satisfaction.
Service quality evaluation: To measure the quality of digital government services, several quality evaluation factors and models have been developed from multidimensional perspectives [16]. Papadomichelaki and Mentzas [17] conceptualized a digital government service quality model named e-GovQual to measure the digital government service quality from four dimensions: reliability, efficiency, citizen’s support and trust. Their model is validated and confirmed via questionnaire, and their research demonstrates that all four dimensions have important impacts on the service quality. Alanezi et al. [18] proposed a seven-dimensional proposal, which adds two dimensions to the SERVQUAL model of Parasuraman et al. [19]. Zaidi and Qteishat [20] developed the e-GSQA framework to determine the quality of services from the perspective of citizens. Hien [21] explored the digital government services model from two perspectives: the quality of service and the quality of information. Kurfali et al. [22] demonstrated that anticipated performance, convenience, social influence and internet trust are the decisive factors affecting the citizen’s use of electronic government services, based on 529 samples obtained from an investigation on citizens of Turkey. Janita and Miranda [23] indicated that four dimensions, information quality, privacy, technological efficiency and communication with employees, can be used to assess the electronic service quality by empirical research. Li and Shang [24] discovered that the quality, reliability, security level, accessibility, service capacity, information quality, response capacity and interaction with the system constitute the eight dimensions affecting e-government service quality based on the investigation data of 1650 Chinese residents. Most recently, some studies have focused on the service quality of emerging government service platforms, such as WeChat [25] and TikTok [26].
Relationship between service quality and citizen satisfaction: To achieve public satisfaction with a digital government service, it is critical to examine the citizens’ opinions on its service quality, and understand the relationship between service quality and public satisfaction. Verdegem and Verleye [27] formed a conceptual model based on ICT acceptance theory to investigate the goodness of fit between the perceptions of citizens towards e-government services and their actual satisfaction. Alawneh et al. [28] identified privacy safety, trust, accessibility and public service awareness, as well as public service quality, as the five factors affecting the satisfaction of Jordan’s public with e-government service and collected survey data to test the proposed hypotheses. The research of Stefanovic et al. [29] showed that all three quality dimensions, information quality, system quality and service quality, had a positive impact on willingness to use e-government services, and that only service quality had a significant effect on user satisfaction. Lanin and Hermanto [30] discovered that the delivery, timeliness of the service, availability of information, staff professionalism, staff attitude, and the external and internal roles of the manager affect public satisfaction. Wang and Teo [31] found that online service quality and information quality are important antecedents of public satisfaction. El-Gamal et al. [32] proposed the consistency and awareness dimensions as mediating and moderating factors for customer satisfaction. Their results reveal that awareness is not proven to moderate the relationship between e-service quality dimensions and user satisfaction, while consistency partially mediates the relationship. Gamaliel et al. [33] evaluated the differences in the influence of the five dimensions (tangibles, reliability, responsiveness, assurance, and empathy) of service quality on people’s satisfaction between districts. Lamsal and Gupta [15] revealed that compliance with the rules, responsiveness, prompt service delivery, receiving personalized services, and hassle-free service have a positive effect on public satisfaction, whereas paid/asked-for bribes and service attempts have a negative effect.
Taken together, although previous studies have provided serial explorations of service quality, most of them are based on traditional methods. Table 1 presents various research methods from the literature. In the existing research on digital government service quality, a series of evaluation methods was proposed through a literature review, questionnaire survey, and interview. However, although there is user participation in these research methods, the questionnaire items and the outline of the interview are determined by the researchers, so most of these studies are researcher-oriented. Citizens’ demands for digital government services change with the scene and the time at which services are used. However, traditional fixed item-based methods for digital government service evaluations often lack flexibility and do not pertain to the changeable and specific user demands. In addition, the distribution and quality of research samples are the key to drawing representative conclusions. It is not easy to obtain a large number of high-quality samples through traditional methods. Therefore, there is a need to rectify the shortcomings of these methods and propose a flexible and targeted method for digital government service evaluations.

2.2. Text Mining

With the development of information technology, increasingly rich text information is generated on the Internet. The analysis of these information-rich unstructured text data, based on text-mining techniques, can yield new insights [42]. Due to the convenient availability of massive user reviews on the network platform, text-mining technology (e.g., topic modeling, sentiment analysis and document classification) is widely used in e-commerce [42,43,44,45], medical [46,47], tourism [48,49,50], banking [51,52] and other fields. In this study, we attempt to use text-mining technology to obtain digital government service quality factors through citizens’ online reviews and conduct an in-depth analysis.
Topic model is a probability model that aims to capture the hidden structure of online reviews (topic distribution per document, word distribution per topic, etc.). Topic modeling can be achieved through different mathematical frameworks, of which Latent Dirichlet Allocation (LDA) is the most common approach. LDA assumes that each document consists of probabilistically distributed topics and each topic can be represented by probabilistically distributed words [53]. Bayesian inference is used to infer the hidden structures for given documents [54]. LDA is widely used in the analysis of online reviews in various fields, to identify job satisfaction factors from employee reviews [55], discover key dimensions of hotel service from customer reviews [49], find latent topics across the high-risk and low-risk disease category from patients’ opinions [46], capture key aspects of smart phones from customer reviews [45], and so on. However, LDA has not been widely used in the analysis of digital government service quality.
As the most common text-mining method for extracting subjective insights from documents [56], sentiment analysis aims to understand and classify feelings or emotions (positive, negative, or neutral) within textual data [57]. In recent years, dozens of sentiment analysis techniques have been proposed, and they are classified into two categories, i.e., sentiment analysis based on machine learning and the lexicon-based sentiment analysis [58]. Numerous studies have conducted a sentiment analysis on online reviews to find product and service weaknesses, aiming to help relevant organizations improve their service quality [28,43,48,50,51,59]. Inspired by them, in this study, we employed sentiment analysis to identify polarity in online reviews of digital government services. This analysis unveils sentiments regarding the government service, which can provide useful insights for government managers to improve their services.

3. Citizen-Feedback-Based Analysis Framework of Digital Government Service Quality

3.1. Motivation

The ultimate objective of digital government is to encourage the frequent and recurring use of digital government services by citizens (users) [60]. Satisfying users’ needs is the key to the success of digital government services. Since digital government’s inception as a service delivery method in the public sector, the gap between users’ (citizen) adoption and the efforts made by the service providers (government) to diffuse e-government services has been a concern for many governments [60]. Therefore, an exploration of the factors affecting user satisfaction and the development of a novel method to evaluate digital government service is necessary [61].
Traditional fixed items-based models for evaluating digital government service often lack flexibility and pertinence to the changeable specific demands of users. The inconvenience of obtaining large numbers of high-quality samples also makes it difficult to obtain representative conclusions. With the development of information technology, the traces of citizens’ use of digital government are recorded by computers, including feedback information on citizens’ use of services. The feedback information is a direct expression of citizens’ demands. Fully mining citizen demands and analyzing the digital government service quality based on this information can obtain more targeted management insights to help the government provide better services and improve citizen satisfaction. Therefore, we aim to propose a digital government service quality analysis framework based on citizen feedback. The content of the framework will be introduced in the following.

3.2. Framework Process

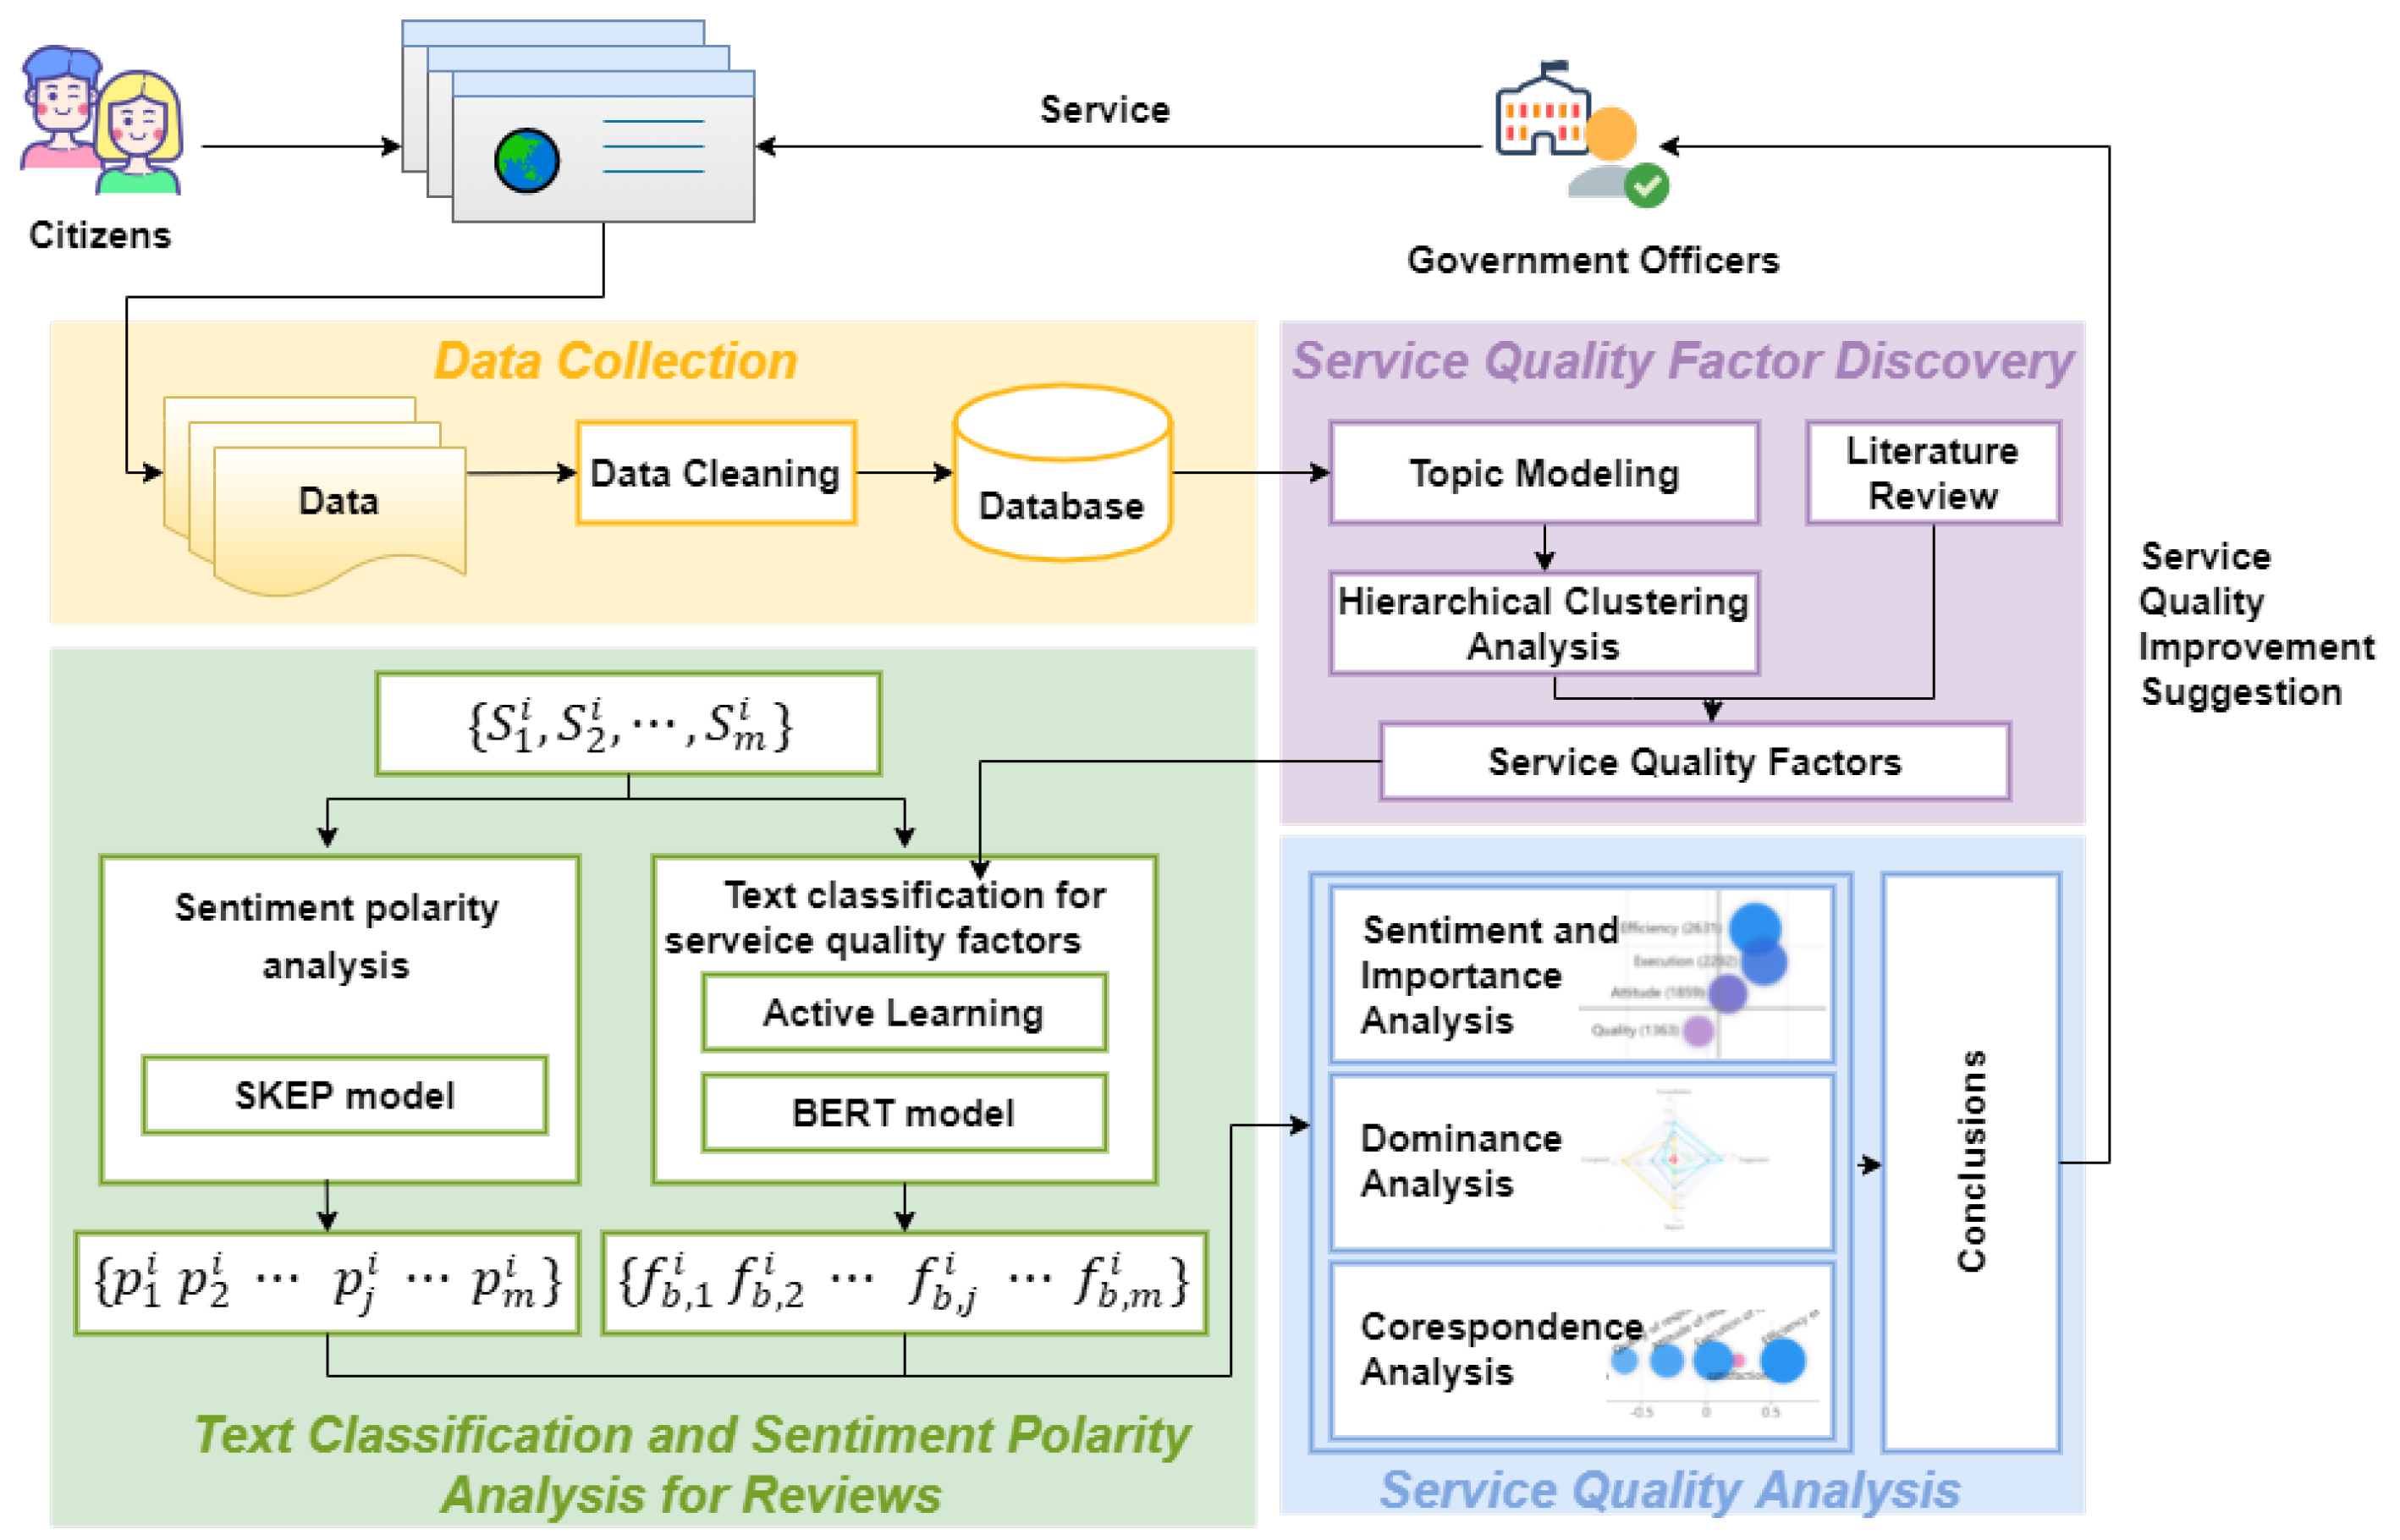
The key idea of the proposed framework is to identify government service quality factors from online citizen feedback and derive managerial insights from analyzing these factors. However, it is a complicated task due to the large volume and noise of the review data. As shown in Figure 2, the proposed framework is divided into four steps. The first step is the collection of data. Web crawlers and other tools can be used to obtain citizen feedback data from government service websites. The feedback data are stored in the database after data preprocessing (data cleaning, data standardization, etc.). The methods in this step are scenario-specific, so we will not go into detail. Then, service quality factors are mined from citizen feedback (review text) using text mining techniques and a literature review. After that, we conducted a text classification and sentiment polarity analysis for citizen reviews to prepare for subsequent analysis. Finally, the sentiment and important analysis, dominance analysis and correspondence analysis are used to obtain management insights for digital government success. In the following sections, we will focus on the details of steps 2–4.
The proposed framework uses machine learning methods to analyze citizen feedback data and obtain e-government service quality analysis results. The rapid development of information technology makes citizen feedback data large and easy to obtain, which solves the problem of the low efficiency of sample acquisition and insufficient sample size in traditional methods. The proposed framework uses text-mining algorithms to obtain service quality factors from citizen feedback texts, which can make up for traditional methods’ inflexible and poorly targeted problems with fixed items. As long as citizen feedback data are available, this framework can obtain service quality analysis results through computer calculation, which is efficient and does not require a large human cost. Based on users’ real feelings (feedback), the results are targeted, which can provide better guidance for improving government services.

3.3. Service Quality Factor Discovery Based on Topic Modelling

The goal of this step is to use the topic model to dig out the service quality factors regarding citizen concern from the reviews. Here, we use the above-mentioned LDA method for the topic model. LDA is one of the most popular unsupervised learning methods for performing content-based topic modeling to discover common topics that might occur across a collection of documents. Note that several meaningfully overlapping topics may be found with LDA, so we combined these overlapping topics through hierarchical cluster analysis [62]. Finally, the q topics related to service quality were selected by referring to the relevant literature and taken as the service quality factors Fac = { Fac 1 , Fac q } to be studied.

3.4. Text Classification and Sentiment Polarity Analysis for Reviews

Next, we tried to obtain management insights by analyzing the service quality factors obtained in the previous step. The first problem to be solved is how citizens’ reviews are relevant to service quality factors; that is, which citizens’ reviews are discussing certain service quality factors. In the proposed framework, we solved this problem through the text classification method. In addition, it is also worth considering how citizens’ views on service quality factors should be quantified to obtain a more rational analysis conclusion. We quantified the sentiment orientation of citizen reviews through sentiment polarity analysis. The following sections detail the text classification and sentiment polarity analysis methods used in this framework.
For a single review, citizens typically express multifaceted feedback about government services. For example, in a single review, citizens can simultaneously express dissatisfaction with efficiency and appreciation service attitude. Therefore, to analyze reviews and understand citizens’ views in a more fine-grained way, we break a review R i down into m sentences { S 1 i , S 2 i , , S m i } based on punctuation and perform text classification and sentiment polarity analysis for each sentence in the review.

3.4.1. Text Classification for Service Quality Factors

To identify the service quality factors that citizens mention in their reviews, we use a text classification algorithm to link reviews to the quality of service factors received. In the proposed framework, we use BERT for text classification. BERT [63] is a self-supervised representation learning approach for pre-training a deep transformer encoder [64]. BERT constructs a self-supervised object called masked language modeling (MLM) to pre-train the transformer encoder and relies only on large-size unlabeled data. With the help of a pre-trained transformer, downstream tasks are substantially improved by fine-tuning task-specific labeled data. BERT has strong learning abilities due to its complex structure, but this also means that BERT requires a large number of labeled samples to complete the corresponding training. To address the lack of training samples, we manually match the review text with factors by active learning [65], which helps to obtain as many performance gains as possible by labeling as few samples as possible [66]. Finally, we use the annotated training data to fine-tune the BERT pre-training model and obtain a text classification model. For a sentence S j i in the review R i and b-th service quality factor Fac b , we obtain its classification result f b , j i with the text classification model. If the sentence S j i is related to a service quality factor Fac b , f b , j i = 1 ; otherwise, f b , j i = 0 .
For service quality factor Fac b and a review R i with m sentences { S 1 i , S 2 i , , S m i } , the review R i is vectorized with respect to service quality factor Fac b as follows:
S F i , b = f b , 1 i f b , 2 i f b , j i f b , m i
where f b , j i is the classification result of sentence S j i in review R i with respect to service quality factor Fac b .

3.4.2. Sentiment Polarity Analysis

To determine the sentimental aspect of each sentence in a review, we performed sentiment polarity analysis for the sentences in a review using the SKEP model (https://github.com/baidu/Senta, accessed on 12 July 2023). The SKEP model is an open-source deep learning model pre-trained with a corpus that contains over 3.2 million documents and achieves the most advanced performance on several sentiment analysis benchmarks (especially the Chinese corpus) [67]. With the help of automatically mined knowledge, SKEP conducts sentiment masking and has three sentiment knowledge prediction objectives: to embed sentiment information at the word, polarity, and aspect level into pre-trained sentiment representation. Tian et al. [67] compared the SKEP approach with the strong pre-training baseline RoBERTa [68] and previous SOTA methods. The scores of previous SOTA come from Raffel et al. [69] and Xie et al. [70].The comparison results on two datasets, Standford Sentiment Treebank (SST-2) [71] and Amazon-2 [72], for sentence-level sentiment classification tasks, are shown in the Table 2. It is evident that SKEP performs well in terms of accuracy on both datasets. Since the Sentiment polarity analysis involved in this study is a sentence-level sentiment classification, we selected the SKEP model as our text classification model.
In this study, for a sentence S j i in the review R i , we obtained its sentiment polarity p j i with the SKEP model. The sentiment polarity p j i ranged from 0 to 1 (sentiment polarity from negative to positive), and the higher the value, the more positive the emotion.
For a review R i , with m sentences { S 1 i , S 2 i , , S m i } , the review R i is vectorized based the sentiment polarity, as follows:
S P i = p 1 i p 2 i p j i p m i
where p j i is the sentiment polarity of a sentence S j i in the review R i .
To more clearly illustrate the processing of text classification and a sentiment polarity analysis of reviews, an example is shown in Figure 3. A review R 1 is first split into three sentences according to punctuation. Then, the three sentences were subjected to text classification and sentiment polarity analysis, respectively. We assume that three service quality factors are obtained in the previous stage: efficiency, attitude and compliance. We can calculate the value of S F and S P based on the text classification and sentiment polarity analysis results.

3.5. Service Quality Analysis

The fourth step of the framework is to analyze the service quality and draw conclusions to assist in service quality success. We designed a sentiment and importance analysis method to capture citizens’ views on service quality factors from multiple dimensions. In addition, we use dominance analysis and correspondence analysis to explore the relationship between service quality and citizens’ overall satisfaction to obtain management insights regarding improvements in citizen satisfaction.

3.5.1. Sentiment and Importance Analysis for Service Quality Factor

We analyzed the sentiment and importance of digital government service quality factors to investigate how citizens think about the digital services provided by the government. To estimate the performance of each service quality factor, the average sentiment polarity of sentences related to a service quality factor was expressed as the sentiment of the service quality factor. The sentiment polarity p j i of each sentence S j i in the review R i is based on the proportion of the factor mentioned in the review; the sentiment of a government service quality factor Fac b is defined as follows:
S e n t i m e n t ( Fac b ) = i = 1 n j = 1 | R i | p j i f b , j i i = 1 n j = 1 | R i | f b , j i
where f b , j i represents the text classification results of sentence S j i in review R i regarding service quality factor Fac b , | R i | is the number of sentences in the review R i , and n is the number of the collected reviews. From Equation (3), we can find that S e n t i m e n t ( Fac b ) ranges from 0 to 1, and is more positive (received a high appraisal from citizens) as it moves closer to 1 and more negative (received a poor evaluation from citizens) when closer to 0.
The service quality factors that are frequently mentioned in the reviews are often a greater concern for citizens, which is why the government needs to pay attention. We assessed the importance of the quality of various service factors according to the frequency with which they were mentioned by citizens. The importance of a b-th service quality factor Fac b is calculated as follows:
I m p o r t a n c e ( Fac b ) = i = 1 n j = 1 | R i | f b , j i i = 1 n j = 1 | R i | k = 1 c f k , j i
where f b , j i indicates whether sentence S j i is related to the service quality factor Fac b , c is the number of service quality factors, | R i | is the number of sentences in review R i , n is the number of collected reviews. From Equation (4), we can see that I m p o r t a n c e ( Fac b ) is higher (receives more focus from citizens), as it is closer to 1.

3.5.2. Dominance Analysis for Service Quality Factors

Understanding the impact of service quality factors on the overall satisfaction of citizens (i.e., the relative importance of each factor for overall satisfaction) can help managers to improve citizen satisfaction in a more targeted manner with limited resources. As a common relative importance determination method, dominance analysis can determine the relative significance of independent variables using statistical models. A dominance analysis was proposed by Budescu in 1993 [73] to judge the relative importance of the independent variables that affect dependent variables in multiple regression analysis. The relative importance of a particular independent variable is measured by the average increment in R 2 when the variable is added to every possible regression model built without it. In this study, we performed dominance analysis to examine the impact of each service quality factor on overall citizen satisfaction. The dominance analysis results can help government officers to understand which service quality factors influence overall citizen satisfaction the most, helping them to take more effective measures to improve the overall satisfaction of citizens.
In the dominance analysis, the citizens’ overall satisfaction with the government service is characterized by the performance of factors obtained from reviews. That is to say, the sentiment of the service quality factor (calculated by Equation (3)) is the explanatory variable, and the overall satisfaction of citizens with the service is the explained variable. The computation of the relative importance of factors involves two steps: Firstly, we create all possible combinations for explanatory variables and find all the increments of R 2 that change every time the variable changes (satisfaction of citizens). Then, we calculate the average of the increment of R 2 for each variable and evaluate the marginal contribution of each explanatory variable. The relative importance of a particular variable is identified according to the magnitude of its marginal contribution; the greater the value, the greater the importance. The results of a dominance analysis can help managers focus on those factors that are more conducive to improving overall citizen satisfaction.

3.5.3. Correspondence Analysis for Service Quality Factors and Overall Satisfaction

Dominance analysis can only grasp the impact that these factors have on overall satisfaction, but cannot be used to understand the specific performance of each service quality factor in actual services, which can help managers focus on poorly performing factors rather than important but well-performing factors. In this study, a correspondence analysis for service quality factors and overall satisfaction was used to explore the specific performance of each service factor in actual services. The correspondence analysis can explore the relationships between two nominal variables in a correspondence table in a low-dimensional space, while simultaneously describing the relationships between the categories for each variable [74]. For each categorical variable, the distances between category points in a plot reflect the relationships between the categories, with similar categories plotted close to each other. The association strength between the service quality factor and the satisfaction category can be determined by the distances between them in the scatterplot. Correspondence analysis can help managers to more directly observe the relationship between citizen satisfaction and service quality factors, and obtain more specific management insights.

4. Experiments and Results

4.1. Data Collection

To verify the feasibility of the proposed framework and conduct a futher analysis, we experimented with data from the Q&A e-government portal of Luzhou (https://wen.lzep.cn/node/reply.html, accessed on 12 July 2023), Sichuan Province, China. The Q&A e-government portal of Luzhou is an online government–citizen interaction platform of Luzhou where government officials answer questions submitted by citizens and then citizens provide feedback on the quality of this service. We crawled 93,536 Q&A service data between May 2012 and July 2021. The collected data included the time of the question, the department responding to the question, the citizen review, and overall citizen satisfaction with the response. As shown in Figure 1, this provides a snapshot of a digital government Q&A service tracking from the e-government portal. As shown in Figure 4, it provides the number of questions and feedback according to year. It can be seen that the popularity of the Q&A portal was not high at the beginning of its establishment, and there was no public feedback on the service in the first two years. The total amount of Q&A and feedback have significantly increased over time. This indicates that citizens are gradually accepting the online Q&A with the portal and are increasingly willing to provide feedback on the digital government service. Then, we cleaned the crawled data and removed reviews that are too short, symbols, and meaningless data, obtaining 10,684 pieces of clean data for the following analysis.

4.2. Factor Discovery Results

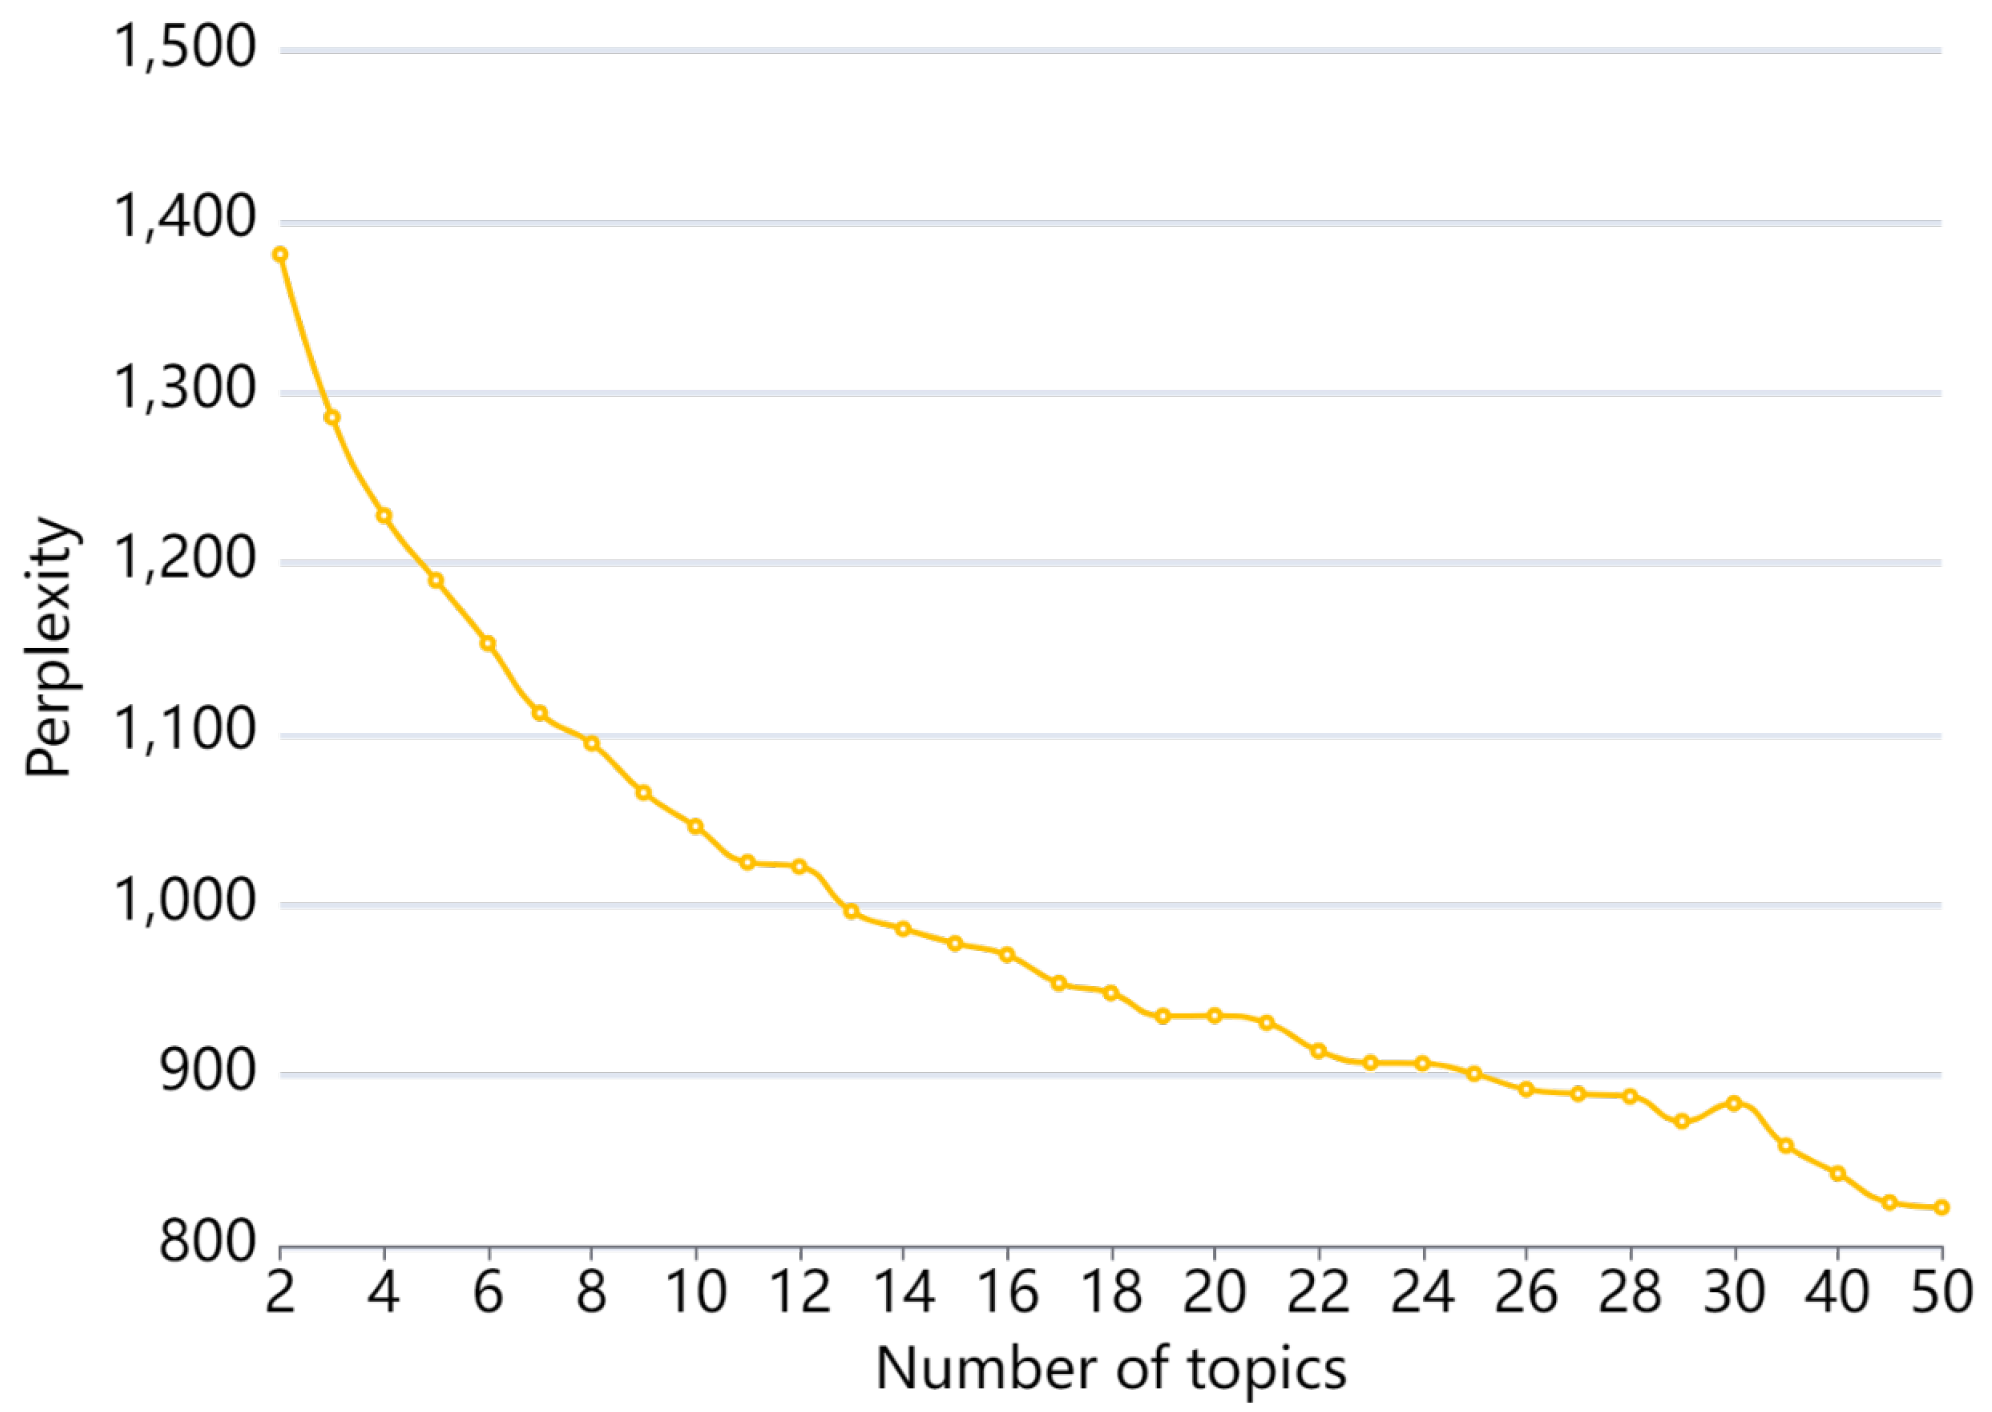
It is crucial to determine the number of topics when discovering service quality factors based on the LDA model. Blei expressed that the number of topics in the corpus is determined by its perplexity [54]. Figure 5 shows the perplexity score for different numbers of research topics. It can be seen that the perplexity value decreases as the number of topics increases. A lower perplexity score means lower uncertainty for the resulting topics, while it is difficult to interpret the meaning of a topic when the topic number is too large. We set the number of topics to 19 to establish a balance between perplexity and interpretability. Note that citizens often mention their question content when giving feedback, so the keywords in the topic are not all related to service quality. Therefore, we screened out keywords related to service quality for each topic based on the literature review and used a hierarchical clustering analysis with Ward’s method [62] to merge the overlapping topics and enhance the interpretability. Finally, we obtained five service quality factors that Q&A portal users paid attention to in reviews. Table 3 shows the service quality factors obtained from textual reviews. We can see that there are no factors regarding the quality of the system. The Q&A portal chosen for the experiment is readily accessible and operated in a mature mechanism. Users are already familiar with the use and interaction environment of the Q&A portal, so they rarely discuss the quality of the system.
Efficiency of response (Efficiency): This factor is used to evaluate the efficiency of an online Q&A service. That is, whether government officers answer questions in the amount of time that users can tolerate. Efficiency is an important service quality factor in many studies [17,18,30,39,75,76].
Quality of response (Quality): This factor is used to evaluate the quality of the response content of online Q&A service. That is, whether the replies of government officials have solved the questions. Lanin et al. [30] found that staff professionalism has a positive and significant effect on public satisfaction. In the Q&A service, staff professionalism is their ability to provide accurate responses to users’ questions, which is reflected in the quality of the responses.
Attitude of response (Attitude): This factor is used to evaluate the response attitude of online Q&A services; that is, whether citizens think government officials are conducting Q&A services with a nice attitude. Previous studies [30,77] have shown that the staff attitude significantly influenced satisfaction.
Compliance of response (Compliance): This factor is used to evaluate the compliance of the reply content. That is, whether the response is in line with the relevant regulations and policies of the country. Both theory and practice have proved that compliance is the public’s basic requirement of the government; lack of compliance will not only cause public dissatisfaction, it may even lead to a crisis of public confidence in the government [78].
Execution of the response (Execution): This factor is used to evaluate the execution of the online Q&A service. That is, whether the relevant departments have taken action to solve the citizens’ problems rather than merely providing verbal answers. Papadomichelaki et al. [39] showed that problem-solving affects the quality of the e-government service. In the Q&A service, this factor can be embodied in the execution of the response.
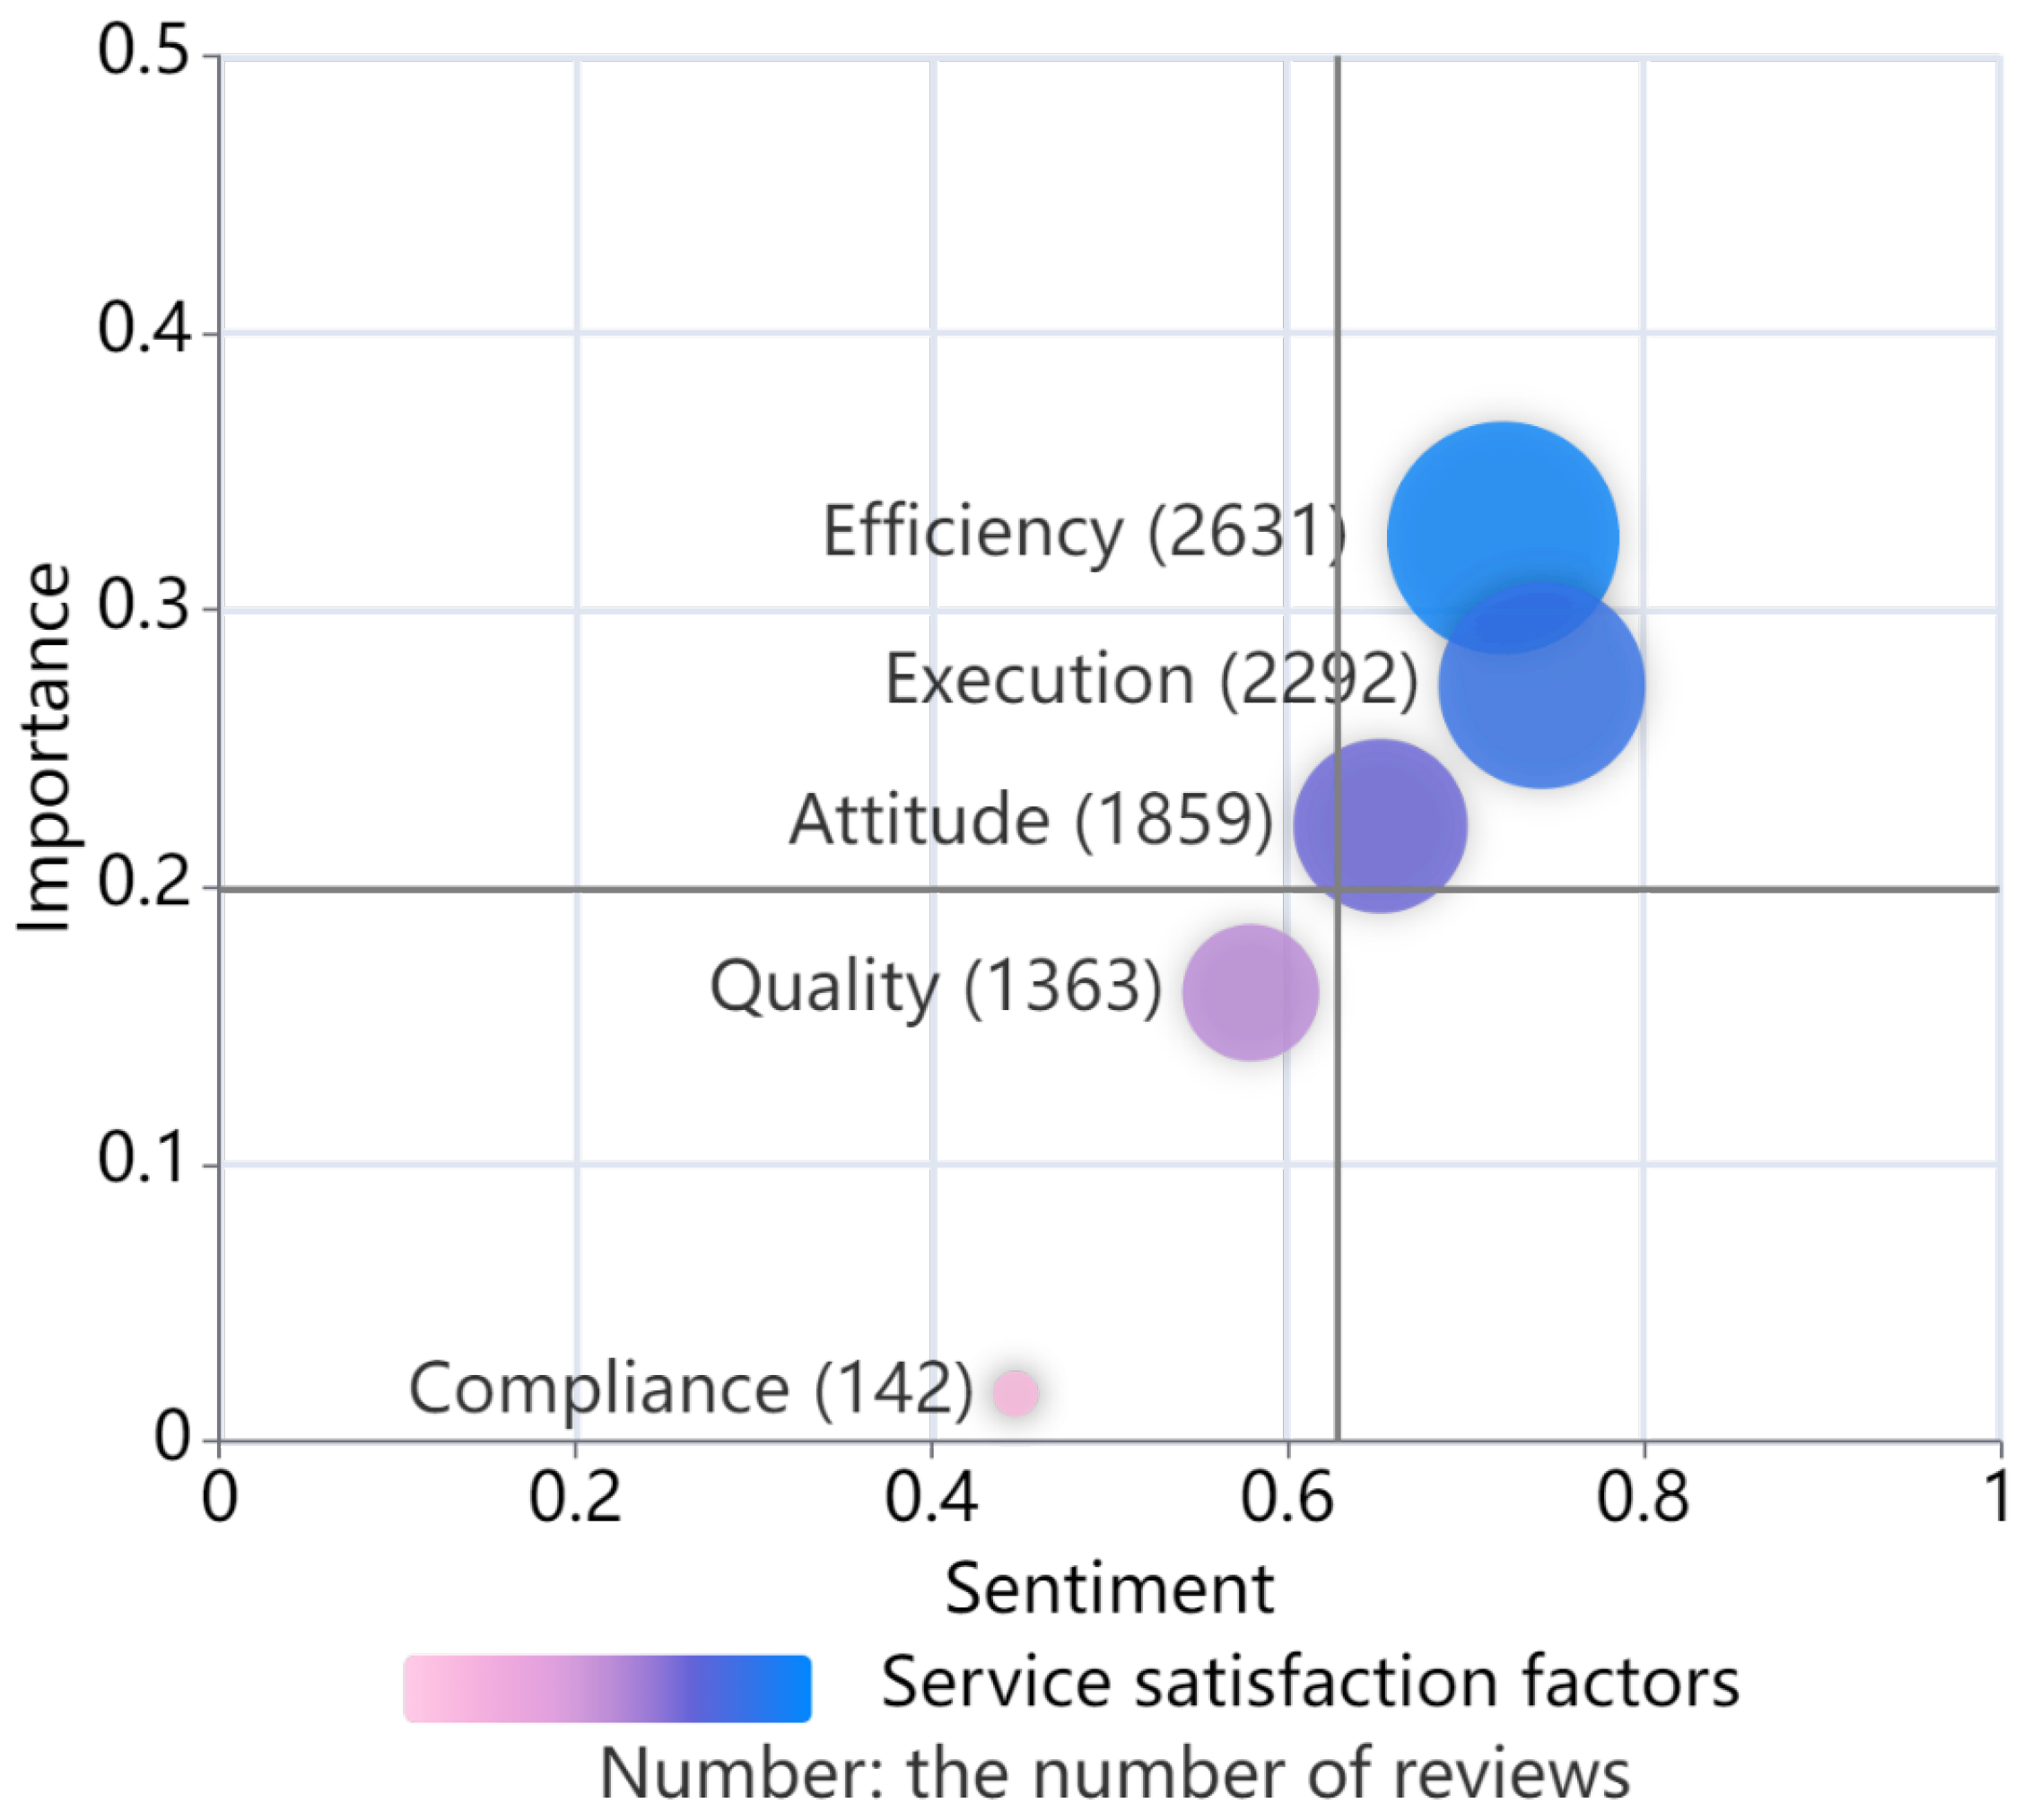
Next, we broke 10,684 citizen reviews down into 21,824 sentences based on punctuation and performed text classification. We set up the sentence classification task as five binary classification tasks. This means that each sentence is assessed five times to determine its association with the five identified service quality factors. Since there is no pre-labeled dataset for classification, we adopted an active learning [65] approach to manually annotate the data, continually adding manually labeled data until the accuracy in the validation set reaches convergence. In the end, we obtained five classification algorithms and used them to classify sentences sequentially. The sentence counts for Efficiency, Quality, Attitude, Compliance, and Execution are 2631, 2292, 1859, 1663, and 142 respectively. Other sentences discuss specific administrative matters without specifically mentioning service quality. Table 4 shows the split and classification results for an example review.

4.3. Sentiment and Importance Analysis

The sentiment and the importance of each factor were analyzed to understand citizens’ concerns and feelings about the five factors. Figure 6 shows the sentiment and importance of the factors in the overall data. In Figure 6, the horizontal and vertical axes represent the degree of sentiment and the importance of each factor respectively. The gray horizontal and vertical lines represent the mean value of importance and sentiment of five factors separately. The bubble size of each service quality factor indicates the number of reviews mentioning it. From Figure 6, we can observe that the efficiency and execution of response are relatively more positive and important than other factors. In other words, citizens of Luzhou city consider the efficiency and execution of online Q&A services to be important and the existing Q&A services perform well in these two aspects. The attitude and quality of the response are of secondary importance compared to efficiency and execution, and their sentiment is more negative than that of efficiency and execution. Sentiment for both attitude and quality of response is greater than 0.5, which means that most people have positive views regarding these two factors. Compliance was the least important, meaning that only a small percentage of reviews mentioned compliance. The sentiment for compliance was also the lowest (less than 0.5), suggesting that most people who mentioned it had negative feelings about the compliance of the response.
To discuss the chronological dynamics of the service quality factor, the variation in the sentiment and importance of each factor from 2014 to 2020 is analyzed, and the results are illustrated in Figure 7. To show the results more clearly, we divide the years into two groups, as the number of reviews grew rapidly in 2017 (as shown in Figure 4), the first group ranges from 2014 to 2016 (the number of reviews in 2012 and 2013 is 0), and the second group is 2017 to 2020. From Figure 7, it can be seen that the importance and sentiment of service quality factors have changed significantly over time. Over time, the sentiment of each factor has been greatly improved, which means that the government has made great improvements in service quality in recent years. Changes in the importance of each factor indicate that citizens pay attention to different service quality factors in different periods. The service quality factor about which citizens are most concerned changed from the quality to the efficiency of the response. The importance of execution surpassed the response attitude and jumped to second place. The importance of compliance has not changed and has always been the least important factor.

4.3.1. Question-Type Level

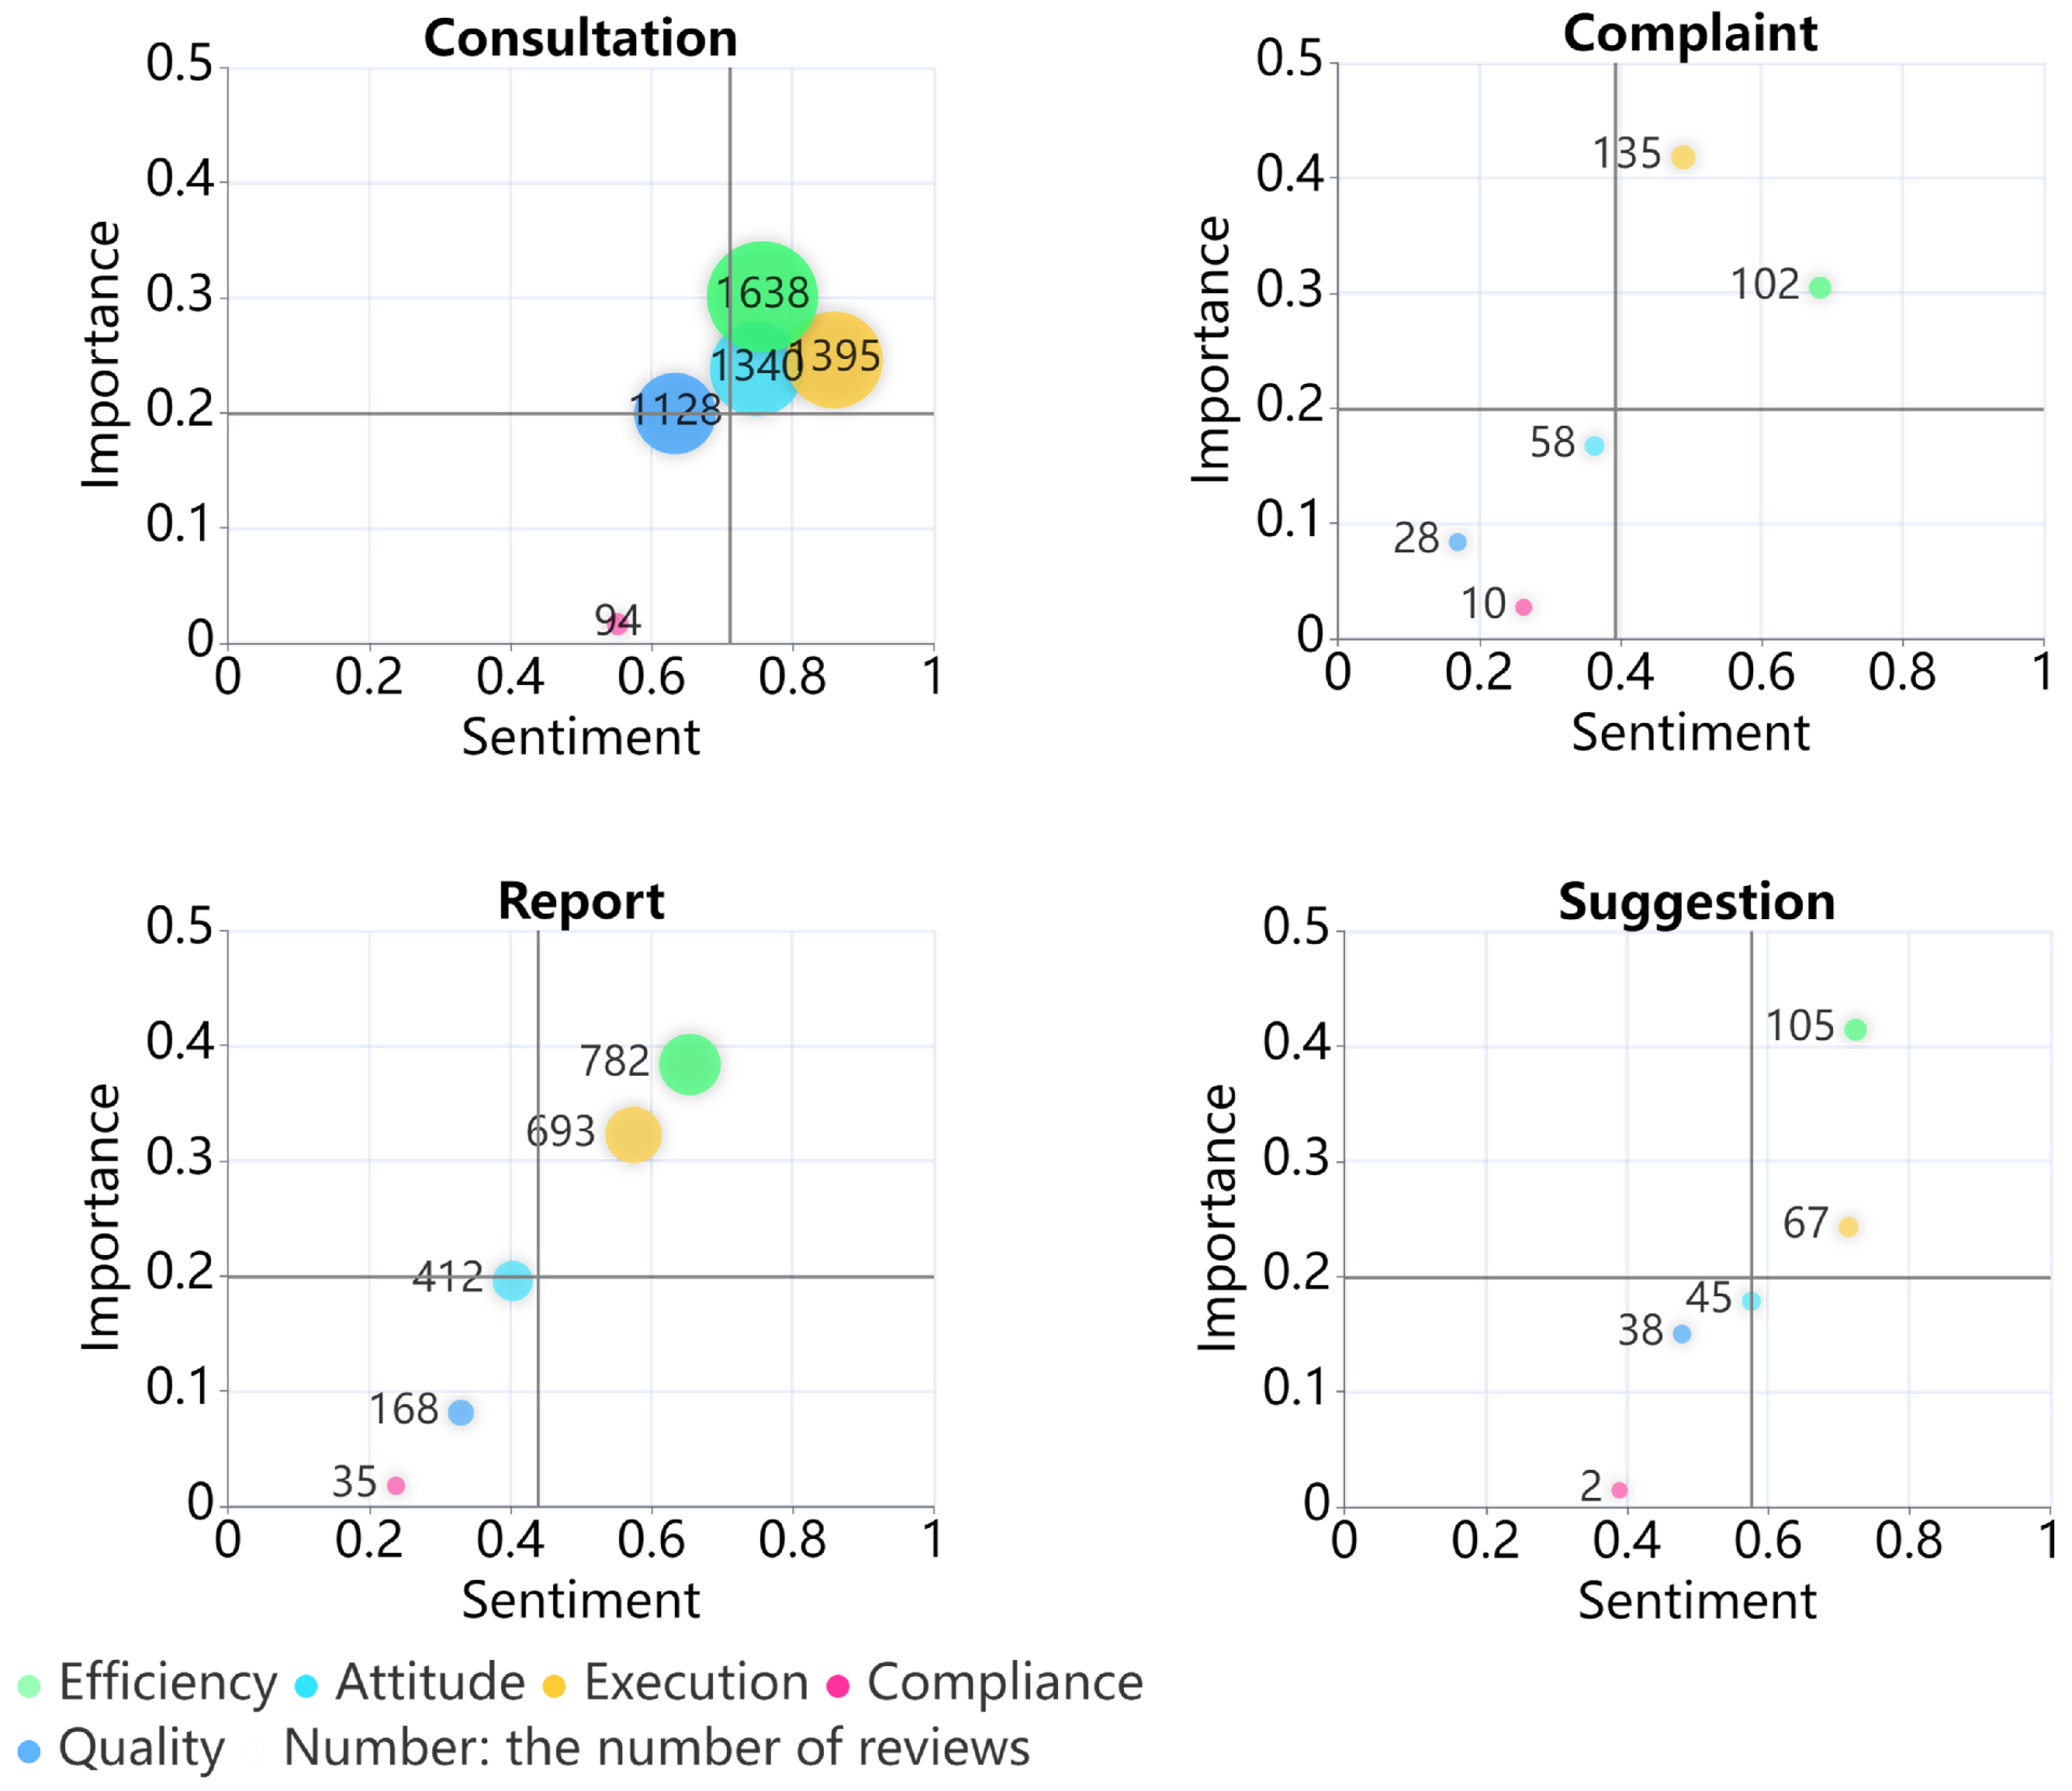
When citizens submit questions to the system, they are asked to choose the type of question: consultation (asking for information), complaint (request punishment of individuals who violate their legitimate rights and interests), report (request for dealing with unreasonable situation), and suggestion (suggestions for improvements in government policy). To understand the service quality and citizens’ different demands of the government, we conducted a sentiment and importance analysis for service quality factors at the question-type level.
Figure 8 shows the sentiment and importance of each factor for different question types. From Figure 8, we can see that the number of consultation questions is the most important aspect, followed by the report, while suggestions and complaints are the least important aspect. From the perspective of importance, the order of the five factors used for consultation, report, and suggestion is the same: from largest to smallest, efficiency, execution, attitude, quality, and compliance. The importance of execution for complaints is the highest, followed by efficiency, attitude, quality, and compliance. From the perspective of sentiments, all five factors for consultation questions are positive (greater than 0.5), which indicates that the government’s responses to the consultation questions are positively evaluated by the majority of citizens regarding these five factors. For complaints, the sentiment of efficiency is the most positive, followed by execution, while attitude, compliance, and quality are all negative emotions. The five factors of report and suggestion have the same sentiment arrangement: the most positive is efficiency and execution, followed by attitude, quality, and compliance. From the analysis of question-type level, it can be seen that citizens pay different levels of attention to the service quality factor of different types of questions, and government officers can respond with different levelsof emphasis according to the type of question. The different performance regarding the sentiment of different question types can also guide government officers to improve service quality in a more granular manner.

4.3.2. Department Level

To obtain a more detailed understanding of the service quality of each department, the three departments with the most reviews (i.e., bureau of housing and urban-rural development (BHRD), bureau of education and sports (BES), and the traffic police detachment of public security bureau (TPDPSB)) are selected to perform the sentiment and importance analysis at the department level. As shown in Figure 9, it is the analysis result of the selected departments. From Figure 9, we can find that citizens attach great importance to the efficiency of the response of the three departments, with a relatively high sentiment level, followed by the execution of the responsem with the highest sentiment. From the perspective of the department comparison, for BES, the execution, efficiency, attitude, and quality of response show a good sentiment performance. This implies that citizens are more satisfied with the BES services in these four areas than in the other two departments. From the analysis at the department level, it can be seen that the citizen’s focus on the service quality of each department is not very different, but the sentiment is different. Various departments can learn from each other to improve their service quality according to the differences in the sentiment of the analysis results.

4.4. Dominance Analysis

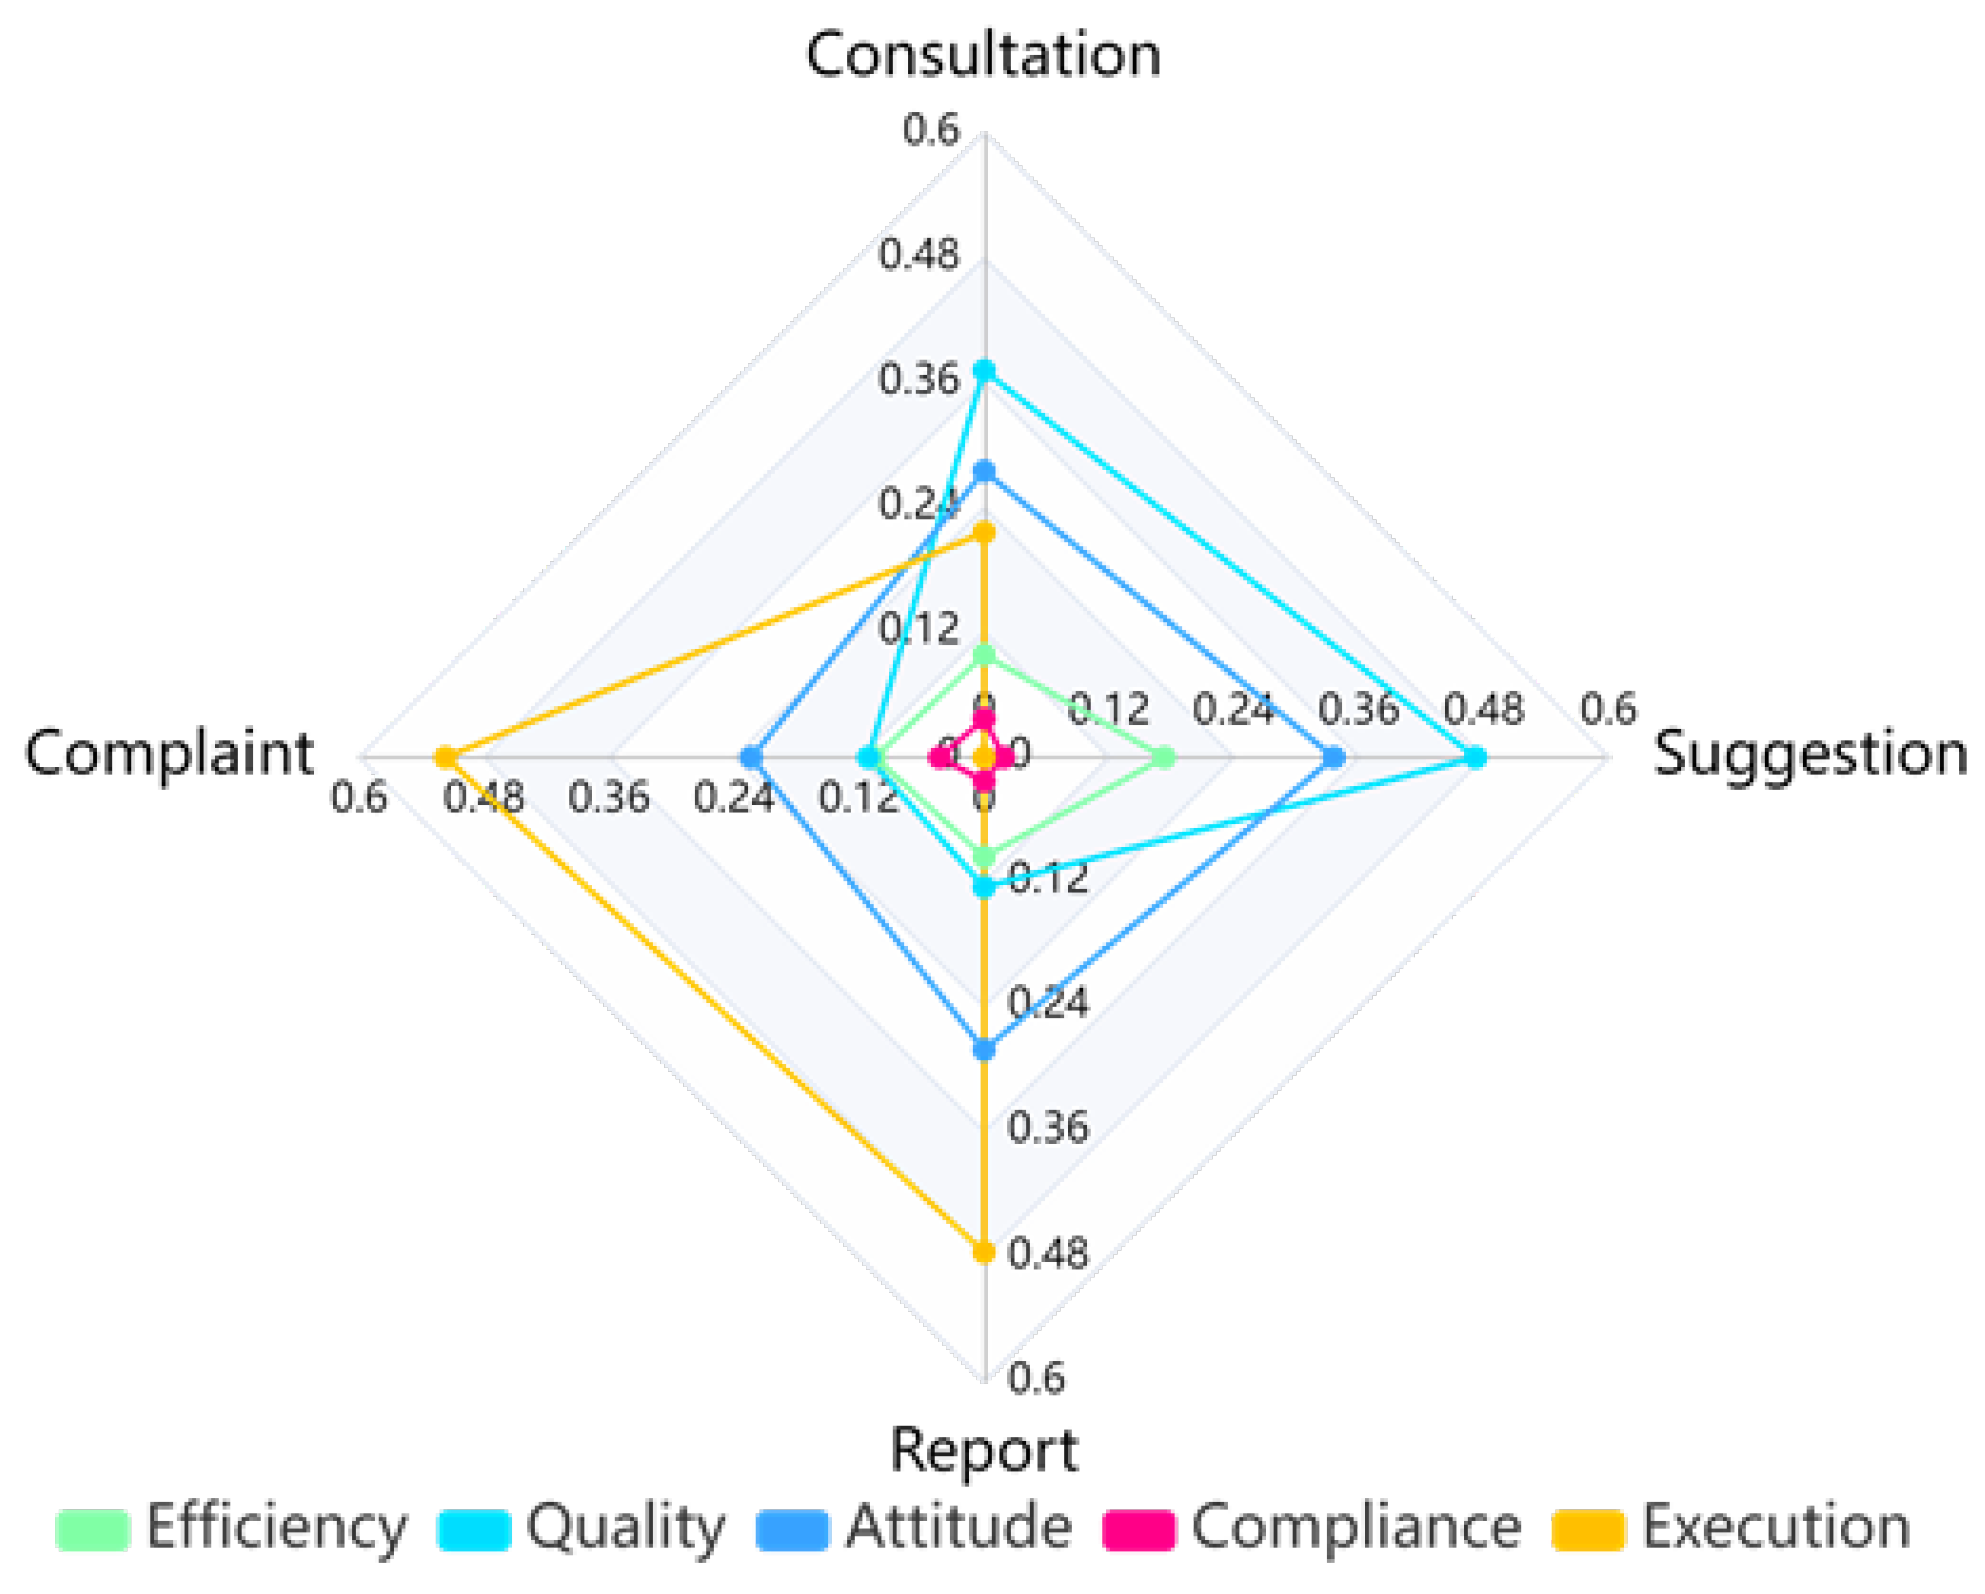
To identify the relative importance of the five service quality factors to overall citizen satisfaction, a dominance analysis was performed regarding the sentiment of these five factors and overall citizen satisfaction. We used the average sentiment polarity values of sentences related to certain service quality factors to calculate the sentiment. The explanatory variables in the dominance analysis are the sentiments of five service quality factors, which are calculated by Equation (3) and the explained variable is the overall citizen satisfaction rate. Note that the citizen satisfaction rate is measured by 0 or 1 (“0” for dissatisfaction, “1” for satisfaction) in this study, and thus the logical regression is used in dominance analysis. All of the regression models used in the dominance analysis are statistically significant at the 0.05 level of significance. Figure 10 and Figure 11 show the relative importance of service quality factors by question type and by department, respectively. For a more detailed and multidimensional analysis, the relative importance of service quality factors is analyzed according to question type and department.
The question type in Figure 10 was the same as that in Section 4.3.1. From Figure 10, we can see that the quality of response has the greatest impact on overall citizen satisfaction for consultations and suggestions, followed by the attitude of response. For complaints and reports, the execution of the response occupies the absolute advantage, followed by the attitude of response. The efficiency and compliance of the response had relatively small effects on overall citizen satisfaction in four question types. However, according to the analysis results of Figure 8, the sentiment and importance of the efficiency of response are relatively high. It can be inferred that efficiency may be the basic requirement of citizens for service, and when it is met, citizens are more concerned about other aspects of service quality. For suggestions, the impact of execution on overall satisfaction is minimal. This may be because people have low expectations of execution when making suggestions. The impact of compliance on overall satisfaction is very small across all four question types.
In Figure 11, we selected the same three departments (BHRD, BES, and TPDPSB) as Section 4.3.2 for dominance analysis. From Figure 11, we can observe that the attitude, execution, and quality of response have the greatest impact on overall citizen satisfaction among the selected three departments. The execution of response has an absolute advantage for TPDPSB. The efficiency and compliance of response have relatively small effects on overall citizen satisfaction in these three departments. From the analysis results of Figure 8 and Figure 11, we can see that the expression of the relative importance of the five factors on overall citizen satisfaction varies according to the different question types and departments. That is to say, the influence of service quality factors on overall citizen satisfaction is affected by the question type and department. Government officials should pay attention to this point when referring to corresponding conclusions, and analyze specific issues in detail.

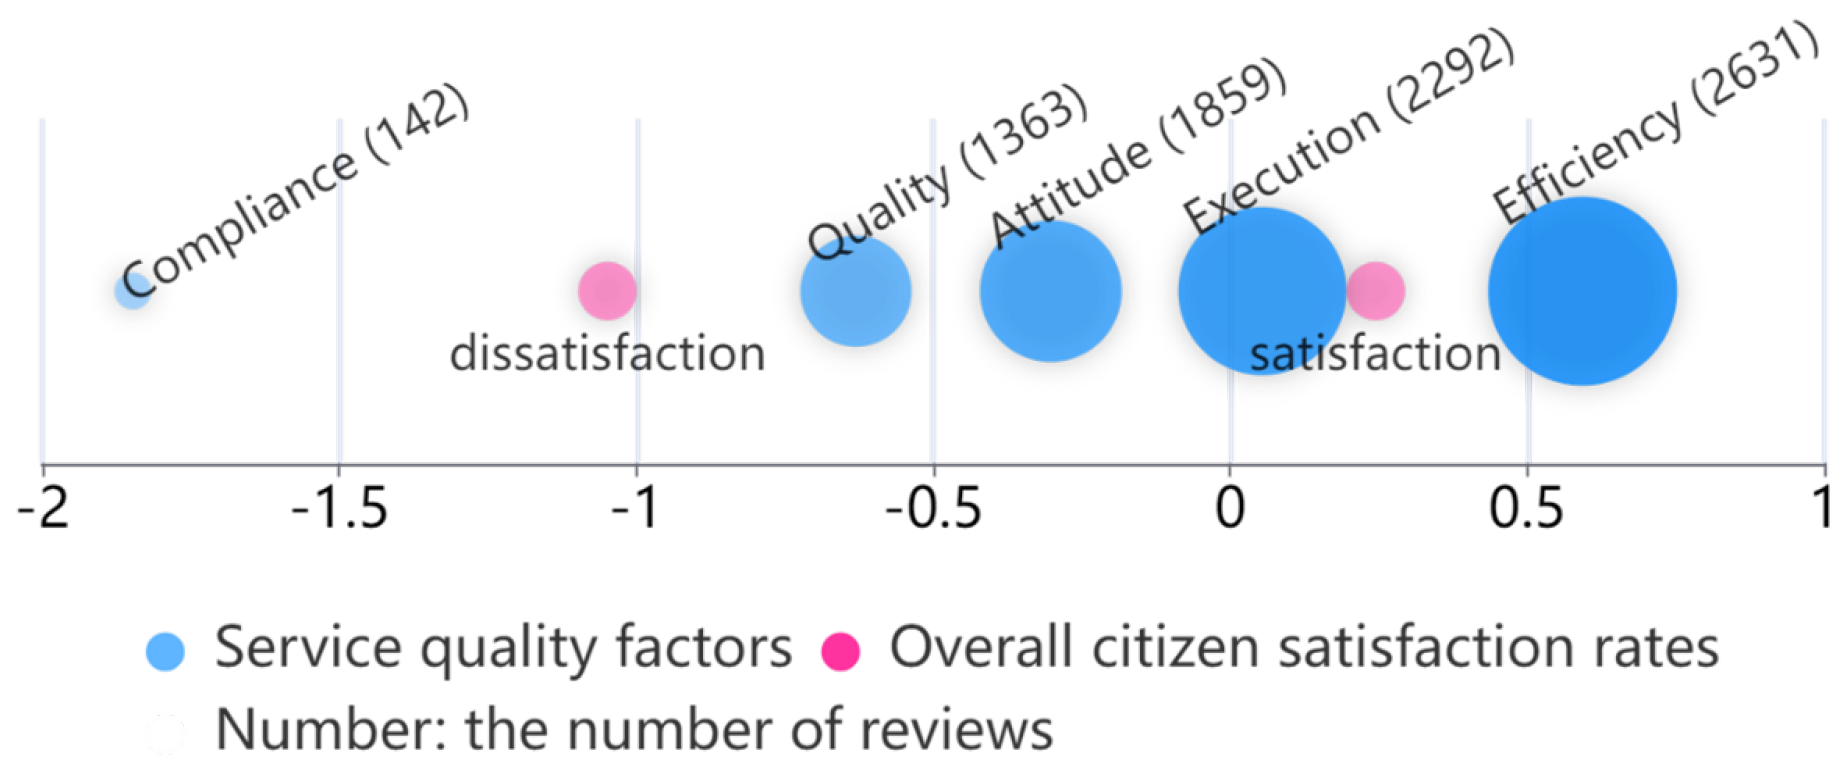
4.5. Correspondence Analysis

In correspondence analysis, five service quality factors and overall satisfaction rates are squashed into one-dimensional space to analyze the strength of their association. Figure 12 show the correspondence analysis result, where the distance between the factor and the overall satisfaction is a measurement of their association strength. For a service quality factor, its bubble size indicates the number of reviews mentioning it. From Figure 12, we can see that the quality and compliance of response have a strong correlation with dissatisfaction. The execution and efficiency of response have a strong correlation with satisfaction. The association between satisfaction rates and attitude of response is ambiguous. The results of the correspondence analysis can help government officers identify these associations, improve the factors that are strongly associated with dissatisfaction, and maintain the factors that are strongly associated with satisfaction.

4.6. Experiment Summary

In this section, we conduct experiments using data from Luzhou, China, to demonstrate the feasibility of our proposed framework. We extracted five service quality factors—efficiency, quality, attitude, compliance, and execution of response—based on the feedback text of the online Q&A service. Information or system factors were not involved. Generally, information or system factors are taken into consideration when users encounter system problems using e-government portals. In relatively mature and stable e-government services, technical issues such as information or system are no longer considered by citizens, and they are more concerned about the quality of the service itself. Although the service quality factors will be different in different scenarios, the conclusions of the experimental analysis can provide a certain degree of guidance for better government services.
Response efficiency is the most important service quality factor, that is to say, the most frequently mentioned by citizens in feedback. However, when the government performs well in this regard, it has little effect on the overall satisfaction of citizens. These findings are contradicted by some previous findings [17,18,30,39,75,76] suggesting that efficiency is an important factor affecting citizen satisfaction. The results of sentiment analysis and correspondence analysis show that most citizens are satisfied with the efficiency of the government. That is to say, efficiency may be a basic requirement of citizens for service, and when it is met, citizens are more concerned about other aspects of service quality. It is suggested that the government can pay more attention to improving other factors in addition to ensuring efficiency.
The importance of execution of response is second only to efficiency, especially for complaints, where its importance exceeds efficiency. Execution has the greatest impact on the overall satisfaction of citizens for reports and complaints. Both reports and complaints have demanded that the government handles the corresponding affairs, so whether the demands are executed has a great impact on citizens’ satisfaction. This is consistent with the findings of Papadomichelaki et al. [39], indicating that problem-solving affects the quality of e-government services.
The importance of response attitude comes after execution. Its impact on the overall satisfaction of citizens ranks second for all four question types. These findings are consistent with the findings of Selvanathan [79] and Lanin et al. [30]. Citizens have relatively high demands regarding staff attitude, and the government should pay attention to the staff attitude in their services.
Citizens place less importance on quality of response than attitude. Quality has the greatest impact on overall citizen satisfaction regarding consultation and suggestions. This is consistent with the research conclusions of Lanin et al. [30]. The main appeal of consultations is that desired information can be obtained, and the main purpose of suggestions is that the government can adopt the suggestions. Quality directly affects the satisfaction with these two types of problem. The results of the correspondence analysis show that the quality of the response is closely related to dissatisfaction, which means that most citizens are not satisfied with this factor, and the government should strengthen the quality of their response.
Compliance of response is the least important factor and has the lowest impact on overall satisfaction. These findings are consistent with the findings of Sha et al. [78] and Song [80]. From the experimental results, only a few people mention compliance in their feedback and express dissatisfaction when questioned about compliance. Nevertheless, as an essential element of government response behavior, compliance should be given high priority.
The comparison results of data from different years show that although citizens’ sentiments towards various service factors are different in different time periods, citizens’ emphasis on various service factors will not change. Looking at the services provided by different institutions, people’s emotions regarding service quality factors are different, and the influence of service quality factors on overall satisfaction is also different. In Q&A services, citizens pay various levels of attention to the service quality factors for different types of questions. For consultation and suggestions, the quality of the response has the greatest impact on overall satisfaction. For complaints and reports, the execution of response is most important to overall satisfaction. Government staff should pay attention to the types of questions when conducting Q&A services. The experiment proves that the proposed framework is feasible. Citizens’ views on e-government services can be mined from their feedback data. The machine learning method also makes the mining and analysis of service quality factors very efficient. The analysis results of the service quality of the Luzhou Q&A platform can not only improve the service quality of the Luzhou government but also provide a reference for the management of e-government services in other cities.

5. Discussion and Conclusions

Research on government service quality can help in the success of digital government services and has been the focus of numerous studies that propose different frameworks and approaches. Although each of them focused on specific aspects of evaluation and used various evaluation models, they succeeded in identifying some of the key factors that influence the quality of service and user satisfaction but failed to find a flexible and targeted method for service quality analysis. Most of the existing research use questionnaires, interviews, and other methods to analyze the quality of government services. These researcher-led methods cannot flexibly grasp the changing needs of users and target citizens’ specific demands for specific services. In addition, these traditional methods often require large, high-quality samples, which is not easy. We propose an information-technology-based framework to make up for the shortcomings of the existing research.
While digital government service involves many participants, each of them has different interests and objectives that would have an impact on the success of digital government services. Citizens (users) are the primary and most important participants in digital government services [60]. Accordingly, their views and satisfaction after experiencing the service play a central role in digital government service evaluation and are recorded by the service system in the form of feedback data. The proposed framework can tap into how citizens feel about specific services from these feedback data, which allows for a more flexible understanding of citizens’ demands. The proposed framework analyzes digital government service quality from multiple dimensions through sentiment and importance analysis. Furthermore, dominance and correspondence analysis is used to explore the relationship between service quality factors and overall citizen satisfaction. The efficient machine learning methods used in the framework make data collection and processing more efficient, especially for large-scale Internet data, which makes the conclusions more representative.
This study contributes theoretically to the digital government service evaluation domain by developing a technical framework that utilizes machine learning methods to analyze digital government service quality based on online review data, which is an unprecedented attempt. Compared to past studies, the proposed framwork, based on citizen feedback, are more focused on the quality of specific services. In addition, using machine learning techniques such as text-mining makes the method efficient. User satisfaction is the primary objective of digital government service providers and policymakers. One of the more challenging tasks is enhancing user satisfaction. This study makes managerial contributions. The proposed framework provides a series of analytical approaches to understanding citizen perceptions of services and the relationship between service quality and overall satisfaction. Such analysis allows for service providers to identify problem areas and concentrate their resources on improving those areas. Based on these abilities, better policies can be developed for unsuccessful digital government services.
Our study has some limitations, which also offer avenues for future research. First, online data collection may be affected by sampling bias. This research is based on citizen feedback data after citizens use e-government services. The sample source can be considered as an experienced Internet user, but may not represent an inexperienced Internet user. These experienced users are also essential to the continued use of e-government services, and they may adopt new services. However, future research can target inexperienced users to expand our work. Second, our framework uses a range of machine learning methods, the accuracy of which may have some impact on the analysis results. Although the current mainstream natural-language-processing methods were used to achieve an accuracy of more than 90% for the classification task, the small proportion of erroneous data does have a certain impact on the analysis. However, due to the large amount of citizen feedback data, a small amount of noise caused by the accuracy of the algorithm will not affect the overall comparative conclusions. Future research can focus on exploring relevant data-mining algorithms for digital government service quality analyses to improve the accuracy of the results.

Author Contributions

Conceptualization, X.Y.; methodology, X.Y. and X.S.; software, X.S. and Z.Y.; validation, L.-a.D.; formal analysis, Q.L.; investigation, Z.Y.; resources, X.S.; data curation, X.S.; writing—original draft preparation, X.S.; writing—review and editing, S.Y.; visualization, S.Y.; supervision, X.Y.; project administration, X.S. and X.Y.; funding acquisition, X.Y. All authors have read and agreed to the published version of the manuscript.

Funding

This research was funded by the National Key R&D Program of China (Grant No. 2021YFC3300200), National Natural Science Foundation of China (Grant No. 71874020), Dalian Science and Technology Innovation Project (Grant No. 2022JJ12GX012) and the Social Science Foundation of Liaoning Province (Grant No. L17CTQ002).

Data Availability Statement

The data presented in this study are available on request from the corresponding author. The data are not publicly available due to privacy.

Acknowledgments

Xin Ye thank Xiaoyan Su and Yongsheng Qian for technical assistance in experiments.

Conflicts of Interest

The authors declare no conflict of interest.

References

  1. Basu, S. E-government and developing countries: An overview. Int. Rev. Law Comput. Technol. 2004, 18, 109–132. [Google Scholar] [CrossRef]
  2. Desa, U. United Nations E-Government Survey 2018. In Gearing E-Government to Support Transformation towards Sustainable and Resilient Societies; United Nations: New York, NY, USA, 2018. [Google Scholar]
  3. Linders, D.; Liao, C.Z.P.; Wang, C.M. Proactive e-Governance: Flipping the service delivery model from pull to push in Taiwan. Gov. Inf. Q. 2018, 35, S68–S76. [Google Scholar] [CrossRef]
  4. Sharma, P.N.; Morgeson, F.V., III; Mithas, S.; Aljazzaf, S. An empirical and comparative analysis of E-government performance measurement models: Model selection via explanation, prediction, and parsimony. Gov. Inf. Q. 2018, 35, 515–535. [Google Scholar] [CrossRef]
  5. Zheng, Y.; Schachter, H.L. Explaining citizens’ E-participation use: The role of perceived advantages. Public Organ. Rev. 2017, 17, 409–428. [Google Scholar] [CrossRef]
  6. Chan, F.K.; Thong, J.Y.; Brown, S.A.; Venkatesh, V. Service Design and Citizen Satisfaction with E-Government Services: A Multidimensional Perspective. Public Adm. Rev. 2021, 81, 874–894. [Google Scholar] [CrossRef]
  7. Greaves, F.; Laverty, A.A.; Cano, D.R.; Moilanen, K.; Pulman, S.; Darzi, A.; Millett, C. Tweets about hospital quality: A mixed methods study. BMJ Qual. Saf. 2014, 23, 838–846. [Google Scholar] [CrossRef]
  8. Jones, S.; Murphy, F.; Edwards, M.; James, J. Doing things differently: Advantages and disadvantages of Web questionnaires. Nurse Res. 2008, 15, 15–26. [Google Scholar] [CrossRef]
  9. Zaman, N.; Goldberg, D.M.; Abrahams, A.S.; Essig, R.A. Facebook hospital reviews: Automated service quality detection and relationships with patient satisfaction. Decis. Sci. 2021, 52, 1403–1431. [Google Scholar] [CrossRef]
  10. Hawkins, J.B.; Brownstein, J.S.; Tuli, G.; Runels, T.; Broecker, K.; Nsoesie, E.O.; McIver, D.J.; Rozenblum, R.; Wright, A.; Bourgeois, F.T.; et al. Measuring patient-perceived quality of care in US hospitals using Twitter. BMJ Qual. Saf. 2016, 25, 404–413. [Google Scholar] [CrossRef] [Green Version]
  11. Chan, I.C.C.; Ma, J.; Ye, H.; Law, R. A comparison of hotel guest experience before and during pandemic: Evidence from online reviews. In Information and Communication Technologies in Tourism 2021: Proceedings of the ENTER 2021 eTourism Conference, 19–22 January 2021; Springer International Publishing: Berlin/Heidelberg, Germany, 2021; pp. 549–556. [Google Scholar]
  12. Luo, Y.; Tang, R.L. Understanding hidden dimensions in textual reviews on Airbnb: An application of modified latent aspect rating analysis (LARA). Int. J. Hosp. Manag. 2019, 80, 144–154. [Google Scholar] [CrossRef]
  13. Parasuraman, A.; Zeithaml, V.A.; Berry, L.L. A conceptual model of service quality and its implications for future research. J. Mark. 1985, 49, 41–50. [Google Scholar] [CrossRef]
  14. Engdaw, B.D. The impact of quality public service delivery on customer satisfaction in Bahir Dar city administration: The case of Ginbot 20 Sub-city. Int. J. Public Adm. 2020, 43, 644–654. [Google Scholar] [CrossRef]
  15. Lamsal, B.P.; Gupta, A.K. Citizen Satisfaction with Public Service: What Factors Drive? Policy Gov. Rev. 2022, 6, 78–89. [Google Scholar] [CrossRef]
  16. Sá, F.; Rocha, Á.; Cota, M.P. From the quality of traditional services to the quality of local e-Government online services: A literature review. Gov. Inf. Q. 2016, 33, 149–160. [Google Scholar] [CrossRef]
  17. Papadomichelaki, X.; Mentzas, G. A multiple-item scale for assessing e-government service quality. In Proceedings of the International Conference on Electronic Government, Lausanne, Switzerland, 29 August–2 September 2010; Springer: Berlin/Heidelberg, Germany, 2009; pp. 163–175. [Google Scholar]
  18. Alanezi, M.A.; Kamil, A.; Basri, S. A proposed instrument dimensions for measuring e-government service quality. Int. J. U-E-Serv. Sci. Technol. 2010, 3, 1–18. [Google Scholar]
  19. Parasuraman, A.; Zeithaml, V.A.; Malhotra, A. ES-QUAL: A multiple-item scale for assessing electronic service quality. J. Serv. Res. 2005, 7, 213–233. [Google Scholar] [CrossRef] [Green Version]
  20. Zaidi, S.F.H.; Qteishat, M.K. Assessing e-government service delivery (government to citizen). Int. J. Ebusiness Egovernment Stud. 2012, 4, 45–54. [Google Scholar]
  21. Hien, N.M. A study on evaluation of e-government service quality. Int. J. Humanit. Soc. Sci. 2014, 8, 16–19. [Google Scholar]
  22. Kurfalı, M.; Arifoğlu, A.; Tokdemir, G.; Paçin, Y. Adoption of e-government services in Turkey. Comput. Hum. Behav. 2017, 66, 168–178. [Google Scholar] [CrossRef]
  23. Janita, M.S.; Miranda, F.J. Quality in e-Government services: A proposal of dimensions from the perspective of public sector employees. Telemat. Inform. 2018, 35, 457–469. [Google Scholar] [CrossRef]
  24. Li, Y.; Shang, H. Service quality, perceived value, and citizens’ continuous-use intention regarding e-government: Empirical evidence from China. Inf. Manag. 2020, 57, 103197. [Google Scholar] [CrossRef]
  25. Feng, Z.; Zhang, L.; Shen, T. Research on the Way to Improve the Service Quality of Shanxi Government WeChat. In Proceedings of the 2019 Annual Conference of the Society for Management and Economics, Denver, CO, USA, 24–27 February 2019; The Academy of Engineering and Education: Washington, DC, USA, 2019; Volume 4, pp. 92–98. [Google Scholar]
  26. Chen, P.; Zhang, X. Evaluation and Empirical Study on the Information Service Quality of TikTok Government Accounts. Eurasian J. Soc. Sci. 2020, 8, 53–69. [Google Scholar] [CrossRef]
  27. Verdegem, P.; Verleye, G. User-centered E-Government in practice: A comprehensive model for measuring user satisfaction. Gov. Inf. Q. 2009, 26, 487–497. [Google Scholar] [CrossRef]
  28. Alawneh, A.; Al-Refai, H.; Batiha, K. Measuring user satisfaction from e-Government services: Lessons from Jordan. Gov. Inf. Q. 2013, 30, 277–288. [Google Scholar] [CrossRef]
  29. Stefanovic, D.; Marjanovic, U.; Delić, M.; Culibrk, D.; Lalic, B. Assessing the success of e-government systems: An employee perspective. Inf. Manag. 2016, 53, 717–726. [Google Scholar] [CrossRef]
  30. Lanin, D.; Hermanto, N. The effect of service quality toward public satisfaction and public trust on local government in Indonesia. Int. J. Soc. Econ. 2019, 46, 377–392. [Google Scholar] [CrossRef]
  31. Wang, C.; Teo, T.S. Online service quality and perceived value in mobile government success: An empirical study of mobile police in China. Int. J. Inf. Manag. 2020, 52, 102076. [Google Scholar] [CrossRef]
  32. El-Gamal, S.; Abd El Aziz, R.; Abouelseoud, M.F. E-Government Service Quality: The Moderating Role of Awareness and the Mediating Role of Consistency. Int. J. Electron. Gov. Res. 2022, 18, 1–21. [Google Scholar] [CrossRef]
  33. Gamaliel, H.; Kalangi, L.; Warongan, J. Service Quality of Government Institution and Its Influence on Public Satisfaction (Study in Regency/City Government of North Sulawesi). Int. J. Tour. Hosp. Asia Pasific 2022, 5, 1–12. [Google Scholar] [CrossRef]
  34. Barnes, S.J.; Vidgen, R. Interactive e-government: Evaluating the web site of the UK Inland Revenue. J. Electron. Commer. Organ. 2004, 2, 42–63. [Google Scholar] [CrossRef] [Green Version]
  35. Horan, T.A.; Abhichandani, T.; Rayalu, R. Assessing user satisfaction of e-government services: Development and testing of quality-in-use satisfaction with advanced traveler information systems (ATIS). In Proceedings of the 39th Annual Hawaii International Conference on System Sciences (HICSS’06), Kauai, HI, USA, 4–7 January 2006; Volume 4, p. 83b. [Google Scholar]
  36. Baker, D.L. Advancing e-government performance in the United States through enhanced usability benchmarks. Gov. Inf. Q. 2009, 26, 82–88. [Google Scholar] [CrossRef]
  37. Kaisara, G.; Pather, S. The e-Government evaluation challenge: A South African Batho Pele-aligned service quality approach. Gov. Inf. Q. 2011, 28, 211–221. [Google Scholar] [CrossRef]
  38. Omar, K.; Scheepers, H.; Stockdale, R. eGovernment service quality assessed through the public value lens. In Proceedings of the International Conference on Electronic Government, Tallinn, Estonia, 26–29 September 2011; Springer: Berlin/Heidelberg, Germany, 2011; pp. 431–440. [Google Scholar]
  39. Papadomichelaki, X.; Mentzas, G. e-GovQual: A multiple-item scale for assessing e-government service quality. Gov. Inf. Q. 2012, 29, 98–109. [Google Scholar] [CrossRef]
  40. Qutaishat, F.T. Users’ perceptions towards website quality and its effect on intention to use e-government services in Jordan. Int. Bus. Res. 2013, 6, 97. [Google Scholar] [CrossRef] [Green Version]
  41. Wijatmoko, T.E. E-Government Service Quality Using E-GovQual Dimensions Case Study Ministry of Law and Human Rights DIY. In Proceedings of the International Conference on Science and Engineering, Online, 3–4 October 2020; Volume 3, pp. 213–219. [Google Scholar]
  42. Chatterjee, S.; Goyal, D.; Prakash, A.; Sharma, J. Exploring healthcare/health-product ecommerce satisfaction: A text mining and machine learning application. J. Bus. Res. 2021, 131, 815–825. [Google Scholar] [CrossRef]
  43. Zhang, W.; Xu, H.; Wan, W. Weakness Finder: Find product weakness from Chinese reviews by using aspects based sentiment analysis. Expert Syst. Appl. 2012, 39, 10283–10291. [Google Scholar] [CrossRef]
  44. Yu, S.; Xia, F.; Liu, H. Academic team formulation based on Liebig’s barrel: Discovery of anticask effect. IEEE Trans. Comput. Soc. Syst. 2019, 6, 1083–1094. [Google Scholar] [CrossRef]
  45. Lee, A.J.; Yang, F.C.; Chen, C.H.; Wang, C.S.; Sun, C.Y. Mining perceptual maps from consumer reviews. Decis. Support Syst. 2016, 82, 12–25. [Google Scholar] [CrossRef]
  46. Shah, A.M.; Yan, X.; Tariq, S.; Ali, M. What patients like or dislike in physicians: Analyzing drivers of patient satisfaction and dissatisfaction using a digital topic modeling approach. Inf. Process. Manag. 2021, 58, 102516. [Google Scholar] [CrossRef]
  47. Yu, S.; Xia, F.; Wang, Y.; Li, S.; Febrinanto, F.G.; Chetty, M. PANDORA: Deep Graph Learning Based COVID-19 Infection Risk Level Forecasting. IEEE Trans. Comput. Soc. Syst. 2022, 1–14. [Google Scholar] [CrossRef]
  48. Marrese-Taylor, E.; Velásquez, J.D.; Bravo-Marquez, F. A novel deterministic approach for aspect-based opinion mining in tourism products reviews. Expert Syst. Appl. 2014, 41, 7764–7775. [Google Scholar] [CrossRef] [Green Version]
  49. Guo, Y.; Barnes, S.J.; Jia, Q. Mining meaning from online ratings and reviews: Tourist satisfaction analysis using latent dirichlet allocation. Tour. Manag. 2017, 59, 467–483. [Google Scholar] [CrossRef] [Green Version]
  50. Luo, J.M.; Vu, H.Q.; Li, G.; Law, R. Understanding service attributes of robot hotels: A sentiment analysis of customer online reviews. Int. J. Hosp. Manag. 2021, 98, 103032. [Google Scholar] [CrossRef]
  51. Mittal, D.; Agrawal, S.R. Determining banking service attributes from online reviews: Text mining and sentiment analysis. Int. J. Bank Mark. 2021, 40, 558–577. [Google Scholar] [CrossRef]
  52. Leem, B.H.; Eum, S.W. Using text mining to measure mobile banking service quality. Ind. Manag. Data Syst. 2021, 121, 993–1007. [Google Scholar] [CrossRef]
  53. Blei, D.M. Probabilistic topic models. Commun. ACM 2012, 55, 77–84. [Google Scholar] [CrossRef] [Green Version]
  54. Blei, D.M.; Ng, A.Y.; Jordan, M.I. Latent dirichlet allocation. J. Mach. Learn. Res. 2003, 3, 993–1022. [Google Scholar]
  55. Jung, Y.; Suh, Y. Mining the voice of employees: A text mining approach to identifying and analyzing job satisfaction factors from online employee reviews. Decis. Support Syst. 2019, 123, 113074. [Google Scholar] [CrossRef]
  56. Nassirtoussi, A.K.; Aghabozorgi, S.; Wah, T.Y.; Ngo, D.C.L. Text mining for market prediction: A systematic review. Expert Syst. Appl. 2014, 41, 7653–7670. [Google Scholar] [CrossRef]
  57. Do, H.H.; Prasad, P.; Maag, A.; Alsadoon, A. Deep learning for aspect-based sentiment analysis: A comparative review. Expert Syst. Appl. 2019, 118, 272–299. [Google Scholar] [CrossRef]
  58. Liu, Y.; Bi, J.W.; Fan, Z.P. Ranking products through online reviews: A method based on sentiment analysis technique and intuitionistic fuzzy set theory. Inf. Fusion 2017, 36, 149–161. [Google Scholar] [CrossRef] [Green Version]
  59. Yu, S.; Xia, F.; Li, S.; Hou, M.; Sheng, Q.Z. Spatio-Temporal Graph Learning for Epidemic Prediction. Acm Trans. Intell. Syst. Technol. 2023, 14, 36. [Google Scholar] [CrossRef]
  60. Osman, I.H.; Anouze, A.L.; Irani, Z.; Al-Ayoubi, B.; Lee, H.; Balcı, A.; Medeni, T.D.; Weerakkody, V. COBRA framework to evaluate e-government services: A citizen-centric perspective. Gov. Inf. Q. 2014, 31, 243–256. [Google Scholar] [CrossRef] [Green Version]
  61. Wang, Y.S.; Liao, Y.W. Assessing eGovernment systems success: A validation of the DeLone and McLean model of information systems success. Gov. Inf. Q. 2008, 25, 717–733. [Google Scholar] [CrossRef]
  62. Ward, J.H., Jr. Hierarchical grouping to optimize an objective function. J. Am. Stat. Assoc. 1963, 58, 236–244. [Google Scholar] [CrossRef]
  63. Devlin, J.; Chang, M.W.; Lee, K.; Toutanova, K. Bert: Pre-training of deep bidirectional transformers for language understanding. In Proceedings of the 2019 Conference of the North American Chapter of the Association for Computational Linguistics: Human Language 827 Technologies; Association for Computational Linguistics: Minneapolis, MN, USA, 2019; Volume 1, pp. 4171–4186. [Google Scholar]
  64. Vaswani, A.; Shazeer, N.; Parmar, N.; Uszkoreit, J.; Jones, L.; Gomez, A.N.; Kaiser, Ł.; Poloshin, I. Attention is all you need. Adv. Neural Inf. Process. Syst. 2017, 30, 5998–6008. [Google Scholar]
  65. Tong, S.; Koller, D. Support vector machine active learning with applications to text classification. J. Mach. Learn. Res. 2001, 2, 45–66. [Google Scholar]
  66. Ren, P.; Xiao, Y.; Chang, X.; Huang, P.Y.; Li, Z.; Gupta, B.B.; Chen, X.; Wang, X. A survey of deep active learning. ACM Comput. Surv. 2021, 54, 1–40. [Google Scholar] [CrossRef]
  67. Tian, H.; Gao, C.; Xiao, X.; Liu, H.; He, B.; Wu, H.; Wang, H.; Wu, F. SKEP: Sentiment Knowledge Enhanced Pre-training for Sentiment Analysis. arXiv 2020, arXiv:2005.05635. [Google Scholar]
  68. Liu, Y.; Ott, M.; Goyal, N.; Du, J.; Joshi, M.; Chen, D.; Levy, O.; Lewis, M.; Zettlemoyer, L.; Stoyanov, V. RoBERTa: A Robustly Optimized BERT Pretraining Approach. arXiv 2019, arXiv:1907.11692. [Google Scholar]
  69. Raffel, C.; Shazeer, N.; Roberts, A.; Lee, K.; Narang, S.; Matena, M.; Zhou, Y.; Li, W.; Liu, P.J. Exploring the Limits of Transfer Learning with a Unified Text-to-Text Transformer. J. Mach. Learn. Res. 2020, 21. [Google Scholar]
  70. Xie, Q.; Dai, Z.; Hovy, E.; Luong, T.; Le, Q. Unsupervised data augmentation for consistency training. Adv. Neural Inf. Process. Syst. 2020, 33, 6256–6268. [Google Scholar]
  71. Socher, R.; Perelygin, A.; Wu, J.; Chuang, J.; Manning, C.D.; Ng, A.; Potts, C. Recursive Deep Models for Semantic Compositionality Over a Sentiment Treebank. In Proceedings of the 2013 Conference on Empirical Methods in Natural Language Processing, Seattle, WA, USA, 18–21 October 2013; pp. 1631–1642. [Google Scholar]
  72. Zhang, X.; Zhao, J.; LeCun, Y. Character-Level Convolutional Networks for Text Classification. In Proceedings of the 28th International Conference on Neural Information Processing Systems (NIPS’15), Cambridge, MA, USA, 7–12 December 2015; Volume 1, pp. 649–657. [Google Scholar]
  73. Budescu, D.V. Dominance analysis: A new approach to the problem of relative importance of predictors in multiple regression. Psychol. Bull. 1993, 114, 542. [Google Scholar] [CrossRef]
  74. Hoffman, D.L.; Franke, G.R. Correspondence analysis: Graphical representation of categorical data in marketing research. J. Mark. Res. 1986, 23, 213–227. [Google Scholar] [CrossRef]
  75. Lee, J.; Kim, H.J.; Ahn, M.J. The willingness of e-Government service adoption by business users: The role of offline service quality and trust in technology. Gov. Inf. Q. 2011, 28, 222–230. [Google Scholar] [CrossRef]
  76. Batini, C.; Viscusi, G.; Cherubini, D. GovQual: A quality driven methodology for E-Government project planning. Gov. Inf. Q. 2009, 26, 106–117. [Google Scholar] [CrossRef]
  77. Thomson, W. Customer Satisfaction With Key Public Services. CabinetOffice 2004, 1, 1–7. [Google Scholar]
  78. Yongzhong, S.; Zhengrong, W.; Jian, Z. How does the interaction between politicians and citizens affect the effect of online political inquiries?—Based on the exploration and inference of big data based on “Inquiring Politics in Luzhou”. J. Public Adm. 2019, 16, 15–27. [Google Scholar]
  79. Selvanathan, M. The Effects of Employees’ Attitude on Excellent Work Quality among Malaysian Government Employees towards Customers’ Satisfaction. Glob. Manag. J. 2015, 7, 14–26. [Google Scholar]
  80. XiangRong, S. “Online” response and “offline” governance: A study on the coupling factors of the effect of online political inquiry. E-Government 2020, 112–124. [Google Scholar]
Figure 1. A snapshot of Q&A e-government portal.
Mathematics 11 03122 g001
Figure 2. The process of proposed framework.
Mathematics 11 03122 g002
Figure 3. An example of text classification and sentiment polarity analysis for reviews.
Mathematics 11 03122 g003
Figure 4. The amount of Questions and feedback in the dataset by year.
Mathematics 11 03122 g004
Figure 5. The perplexity with a different number of research topics.
Mathematics 11 03122 g005
Figure 6. Sentiment and importance of the factors of the overall data.
Mathematics 11 03122 g006
Figure 7. Sentiment and importance of the factors of the overall data by years.
Mathematics 11 03122 g007
Figure 8. Sentiment and importance of the factors in question type level: Consultation, Complaint, Report, Suggestion.
Mathematics 11 03122 g008
Figure 9. Sentiment and importance of the factors at the department level.
Mathematics 11 03122 g009
Figure 10. Relative importance of citizen satisfaction factors by question type.
Mathematics 11 03122 g010
Figure 11. Relative importance of citizen satisfaction factors by department.
Mathematics 11 03122 g011
Figure 12. Correspondence analysis of online citizen reviews.
Mathematics 11 03122 g012
Table 1. Recent e-government quality evaluation research.
AuthorsTimeResearch MethodSampleSample Size
Barnes and Vidgen [34]2004literature review,
questionnaire survey
Users of the UK Inland Revenue website420
Horan et al. [35]2006literature review,
questionnaire survey
Older citizens (over 55) and graduate students of America119
Baker [36]2009literature review--
Verdegem and Verleye [27]2009literature review,
questionnaire survey, interview
Citizens of Flanders1679
Alanezi et al. [18]2010literature review--
Kaisara and Pather [37]2011literature review,
questionnaire survey
Citizens around Cape Town metropolis and university students161
Omar et al. [38]2011literature review--
Papadomichelaki and Mentzas [39]2012literature review,
questionnaire survey
Users of KEP website894
Zaidi and Qteishat [20]2012literature review--
Qutaishat et al. [40]2012literature review,
questionnaire survey
Citizens of Jordan211
Alawneh et al. [28]2013literature review,
questionnaire survey
University employees206
Stefanovic et al. [29]2016literature review,
questionnaire survey
Employees of e-government systems in Serbia154
Kurfalı et al. [22]2017literature review,
questionnaire survey
Citizens of Turkey529
Janita and Miranda [23]2018literature review,
questionnaire survey
Quality management specialists in the Spanish university sector62
Lanin and Hermanto [30]2019literature review,
questionnaire survey
Citizens of West Sumatra4177
Li and Shang [24]2020literature review,
questionnaire survey
Citizens of China1650
Chen and Zhang [26]2020literature review,
questionnaire survey
Citizens of China249
Wang and Teo [31]2020literature review,
questionnaire survey
Citizens of Henan Province, China286
Chan et al. [6]2020literature review,
questionnaire survey
Ysers of the government web portal10,381
Wijatmoko [41]2020literature review,
questionnaire survey
Users of e-Government82
Lamsa and Gupta [15]2021literature review,
questionnaire survey, interview
Citizens of Nepal12,872
Gamaliel et al. [33]2022literature review,
questionnaire survey
Citizens who have experienced the services200
El-Gamal et al. [32]2022literature review,
questionnaire survey
Users of e-government services350
Table 2. Comparison of accuracy between SKEP and RoBERTa and previous SOTA.
ModelSST-2Amazon-2
Previous SOTA97.197.37
RoBERTa b a s e 94.996.61
RoBERTa b a s e + SKEP96.796.94
RoBERTa l a r g e 96.597.33
RoBERTa l a r g e + SKEP97.097.56
Table 3. Service quality factors obtained from textual reviews.
FactorKeywords
Efficiency效率 (efficiency), 时间 (time), 速度 (speed), 及时 (in time), 快 (fast), 慢 (slow)
Quality清楚 (clear), 详细 (detailed), 简洁 (brief), 准确 (accurate)
Attitude态度 (attitude), 热情 (enthusiastic), 踢皮球 (kick the ball), 走过场 (go through the motions)
Compliance合法 (legal), 政策 (policy), 法规 (law), 制度 (system), 规划 (plan), 规范 (norm)
Execution解决 (figure out), 解决方案 (solution), 办理 (handle), 落实 (implement), 处理结果 (outcome)
Table 4. An example of review classification.
Review TextSentencesCategory
Thank you very much for answering my questions in time. But the proposals you have put forward cannot solve the fundamental problem. The pollution of the river has caused great discontent among the local people, who have repeatedly lodged complaints to the higher authorities. Whenever someone reports it, the discharge of sewage greatly decreases. However, as soon as the situation calms down, the pollution actually worsens. Please strengthen government supervision to effectively address the pollution issues for the citizens!Thank you very much for answering my questions in time.Efficiency
But the proposals you have put forward cannot solve the fundamental problem.Execution
The pollution of the river has caused great discontent among the local people, who have repeatedly lodged complaints to the higher authorities.None
Whenever someone reports it, the discharge of sewage greatly decreases.None
However, as soon as the situation calms down, the pollution actually worsens.None
Please strengthen government supervision to effectively address the pollution issues for the citizens!None
Disclaimer/Publisher’s Note: The statements, opinions and data contained in all publications are solely those of the individual author(s) and contributor(s) and not of MDPI and/or the editor(s). MDPI and/or the editor(s) disclaim responsibility for any injury to people or property resulting from any ideas, methods, instructions or products referred to in the content.