Article

Study on Vehicle Supply Chain Operation Mode Selection Based on Battery Leasing and Battery Swapping Services

School of Business Administration, Guizhou University of Finance and Economics, Guiyang 550025, China
*
Author to whom correspondence should be addressed.
Mathematics 2023, 11(14), 3119; https://doi.org/10.3390/math11143119
Submission received: 10 June 2023 / Revised: 11 July 2023 / Accepted: 11 July 2023 / Published: 14 July 2023

Abstract

:
Considering the impact of the battery leasing service and battery swapping service on the vehicle supply chain operation mode, a vehicle supply chain with a vehicle manufacturer and a battery asset company is investigated. Decision models are formulated in three cases: (a) both battery leasing and battery swapping services are provided by the vehicle manufacturer; (b) both services are provided by the battery asset company; (c) the battery swapping service is provided by the vehicle manufacturer and the battery leasing service by the battery asset company. The optimal decisions for the vehicle manufacturer and the battery asset company in the three cases are derived and compared. The results show that: (1) When the battery leasing increasing time cost coefficient is smaller, it is advisable for the vehicle manufacturer to provide both services; otherwise, the vehicle manufacturer should only provide the battery swapping service. (2) The battery asset company should actively provide-the battery swapping service, since the provision of the battery swapping service can increase its profit. (3) The mode of the vehicle manufacturer providing both services is optimal for the supply chain. (4) When the battery asset company provides battery leasing service, the vehicle manufacturer can “free ride” to enjoy the benefits of the battery asset company extending battery leasing time. (5) With the high cost of new energy vehicles (NEVs) limiting their development in China, extending the battery leasing increasing time is an effective measure to facilitate the diffusion of new energy vehicles (NEVs).

1. Introduction

According to the statistics of the China Association of Automobile Manufacturers, China’s NEV sales have shown an increasing trend year by year from 2015 to 2022, and sales in 2022 reached 6.887 million units, with a year-on-year growth of 93.4%. Simultaneously, the market penetration rate of NEVs reached 25.6%, which is a significant increase compared with 13.4% in 2021 [1,2]. However, from the perspective of the market share, there is still a big gap between the market penetrate rate of NEVs and that of fuel vehicles. The main reason is that high battery prices keep the prices of NEVs high. In addition, consumers remain concerned about battery performance, including endurance and residual value anxiety caused by battery decay [3].
To eliminate consumers’ concerns about purchasing NEVs, the NEV industry has taken measures toward two aspects [4,5,6]. On the one hand, to better solve the problems of high battery price, battery decay and residual value anxiety, the battery leasing service has begun to be developed in the NEV market [7]. Such a service includes NIO’s “Battery as a Service”, BAIC’s “Vehicle and Electrical Value Separation Business Model”, Geometry Auto’s “Battery Leasing Program” and SAIC’s “Battery Bank”. The battery leasing service means that for NEVs, battery swapping vehicle manufacturers (vehicle manufacturers for short) have changed the traditional sales mode of the whole vehicle by selling the vehicle body without the battery (vehicle body for short) and the power battery (battery for short) separately. In this mode, vehicle manufacturers only sell the vehicle body to consumers while providing the battery leasing service to consumers by themselves or third-party enterprises where consumers only have the usage right but not ownership of the battery [8]. In this way, the initial purchase cost of consumers is greatly reduced, which completely solves the problem of battery decay and residual value anxiety caused by the purchase of batteries [9]. On the other hand, for the issue of mileage anxiety, the battery swapping service has become another important choice for consumers to shorten the refueling time [10]. Generally speaking, battery charging and battery swapping are the two energy replenishment methods of NEVs. Compared with the battery charging mode, battery swapping not only greatly shortens the energy replenishment time, but is also advantageous in alleviating mileage anxiety and improving battery safety level [11,12]. With the rapid growth of the NEV market, the market size of the battery swapping service amounts to 100 billion RMB YUAN, which is attracting many enterprises to join in. For example, in China, battery manufacturers headed by CATL, vehicle manufacturers headed by NIO and Geely Automobile, and third-party operators headed by Aulton New Energy Automotive Technology Company (Aulton Technology for short) and Botan Technology Engineering Company (Botan Technology for short) have entered the battery swapping market.
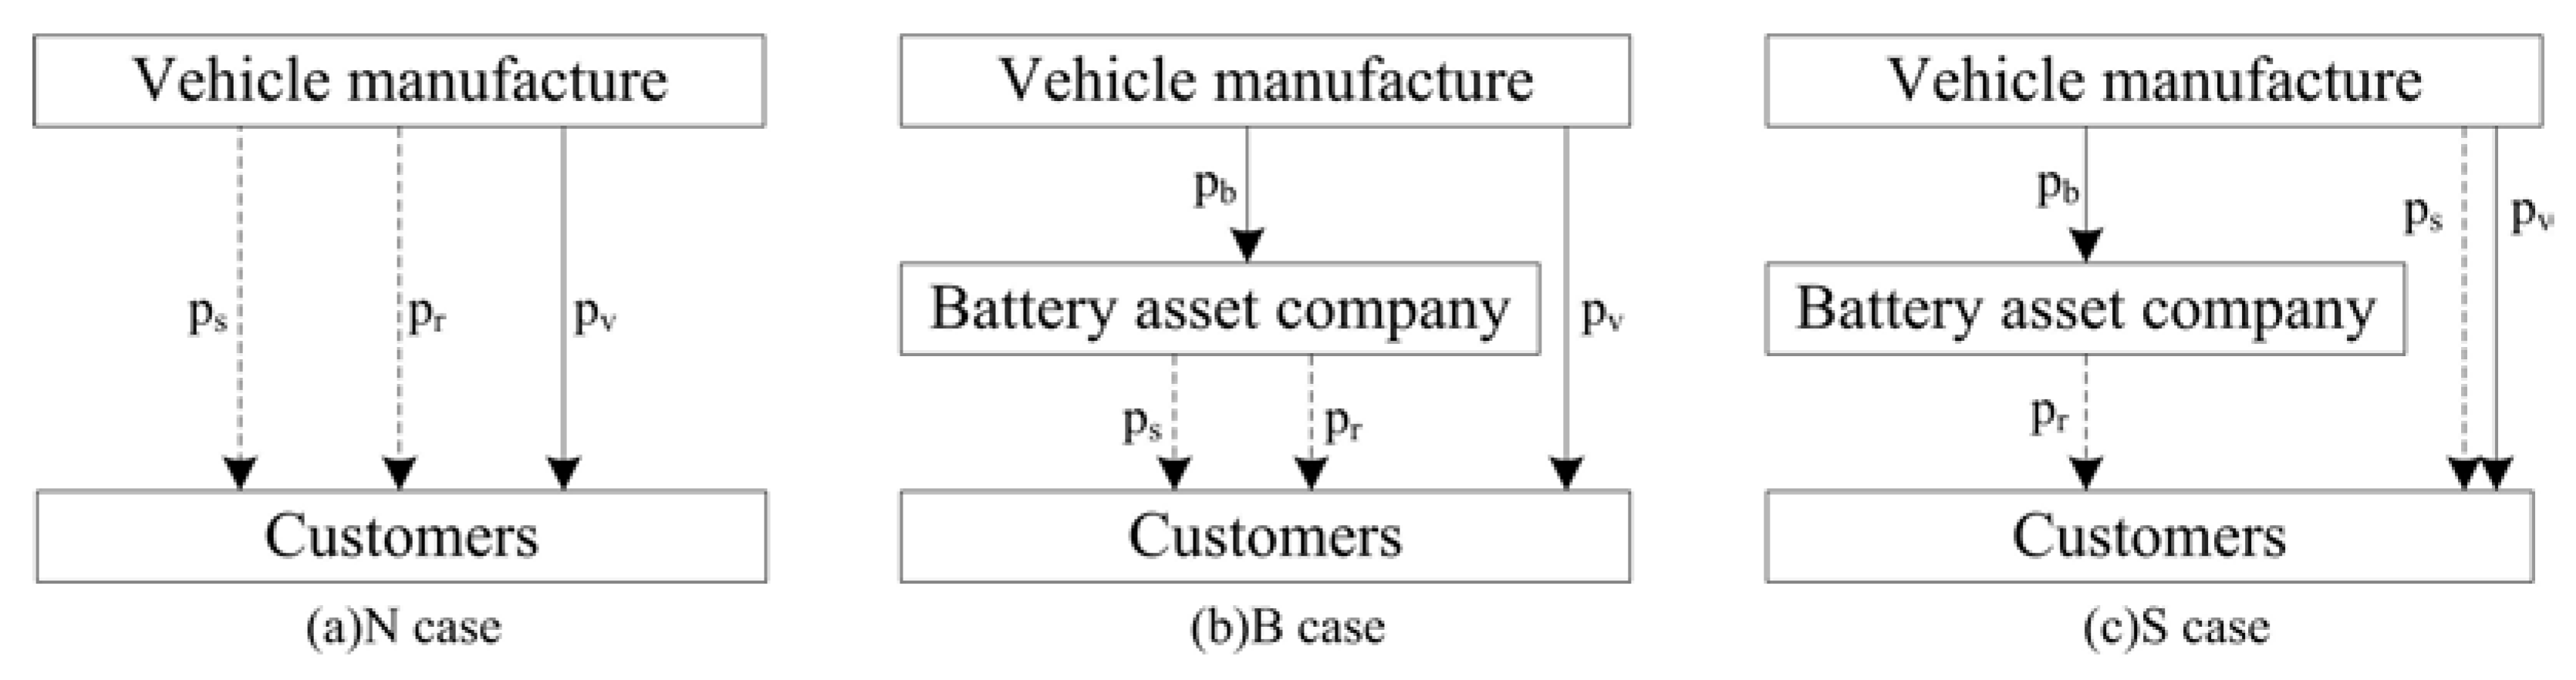
The battery leasing service and battery swapping service have become a significant business model to solve the pain points of NEVs. However, the choice of operation mode has become an urgent issue for the vehicle supply chain members. Currently, there are three operation modes in the market:
  • Vehicle manufacturers provide the battery leasing service and battery swapping service. In this mode, vehicle manufacturers sell the vehicle body to consumers while taking advantage of its OEM to provide the battery leasing service and battery swapping service for battery swapping vehicles. For example, NIO and Geely Automobile provide the battery leasing service and battery swapping service for their battery swapping vehicle through self-built battery swapping systems.
  • Vehicle manufacturers provide the battery swapping service and battery asset management companies (battery asset companies for short) provide the battery leasing service. To address the high battery cost pressure in the first mode, vehicle manufacturers transfer the ownership of the battery to the battery asset companies. In this mode, vehicle manufacturers sell the vehicle body and provide the battery swapping service to consumers while selling the battery to the battery asset companies; additionally, the battery asset companies obtain battery ownership and carry out battery life cycle management while providing the battery leasing service. For example, the NEV brand of SAIC MOTOR such as RISING AUTO provides the battery swapping service to customers and transfers the battery ownership of its battery swapping model R7 to a third-party company that provides the battery leasing service.
  • Battery asset companies provide the battery leasing service and battery swapping service, which means that they enter the battery swapping market with a scale of hundreds of billion RMB YUAN by virtue of the advantage of battery ownership. In this mode, vehicle manufacturers sell the vehicle body to consumers and the battery to the battery asset companies. For example, Aulton Technology owns the battery ownership of BAIC’s EU5 battery swapping vehicles. As the battery asset company, Aulton Technology provides the battery leasing service and battery swapping service for EU5 battery swapping vehicles.
As for the fact that the battery leasing service involves the battery leasing time and that the battery swapping service extends the battery leasing time through battery maintenance, this paper constructs three operation modes of the battery leasing service and battery swapping service, i.e., the two services are provided by vehicle manufacturers and battery asset companies, respectively, and the battery swapping service is provided by the vehicle manufacturers while the battery leasing service is provided by the battery asset companies. Then, it analyzes the optimal decisions of supply chain members under the three operation modes and gives relevant managerial insight through a comparative analysis. All in all, we desire to answer the following questions:
  • Regarding the three operation modes of battery leasing and battery swapping services, which mode is best for consumers? Which mode provides the lowest price for the battery leasing service and battery swapping service?
  • Which mode is more favorable to the development of the NEV industry?
  • Which mode should vehicle manufacturers and battery asset companies choose?
The main conclusions are as follows:
First, by comparing the three operation modes, the mode where the vehicle manufacturer provides the battery leasing and battery swapping services is the best. Second, the battery swapping service can increase the battery asset company’s profit. However, the impact of the battery leasing and battery swapping services on the vehicle manufacturer’s profit depends on the battery leasing increasing time cost coefficient. In addition, the battery asset company extending the battery leasing time can increase the vehicle manufacturer’s profit. Finally, the NEV industry should positively extend the battery leasing increasing time to increase the demand for NEVs.
The rest of this paper is organized as follows. Section 2 briefly reviews the related literature. Section 3 is the problem description and case assumptions. Section 4 develops three operation modes and gives their equilibrium solutions. Section 5 analyzes and compares the equilibrium solutions. Section 6 conducts a numerical example. Section 7 presents the conclusions and future research opportunities. All the proofs are detailed in Appendix A, Appendix B, Appendix C and Appendix D.

2. Literature Review

The literature related to our work mainly involves three aspects: the battery leasing service, battery swapping service and NEV supply chain decision.

2.1. Battery Leasing Service

When the NEV market only sells the vehicle body and provides the battery leasing service rather than selling the battery, the battery leasing service becomes an important issue in the battery swapping vehicle supply chain. However, relevant research is limited. Many scholars have studied the influence factors of the battery leasing service. Based on the second life cycle of the plug-in hybrid vehicle battery, Williams [13] uses the Monte Carlo method to calculate the battery leasing cost, and the results show that the secondary utilization of the battery is beneficial to reducing its leasing cost. Similarly, Li and Ouyang [14] find that the impact of battery cost on marginal rent is dominant. Considering the impact of consumers’ mileage anxiety and resale anxiety on the diffusion of NEVs, Lim et al. [7] develop a two-period model in the secondary market, and the results indicate that when the vehicle resale anxiety is high, the battery leasing mode is more beneficial to the promotion of electric vehicles than the purchase mode. Considering the quality level of recycled batteries, Li et al. [15] analyze the decisions of NEV battery sellers in battery leasing mode and battery sales mode, and study shows that only when the returned batteries’ quality level is relatively high will suppliers re-manufacture the battery in a single sales mode. On the contrary, suppliers will choose to re-manufacture it in a single lease mode. In the above literature, the research on introducing the battery leasing service into the battery swapping vehicle supply chain has not been reported. Although in the Li et al. [15] study the sales mode and leasing mode of power battery, their research focuses on the power battery. Moreover, their research neither involves the NEV body nor introduces the battery leasing service into the battery swapping vehicle supply chain.

2.2. Battery Swapping Service

As a critical way to replenish energy for NEVs, the battery swapping is another research focus. At present, in the field of operation management, there is research on the feasibility analysis, pricing, policy, coordination and so on regarding batter swapping. In terms of the feasibility of the battery swapping mode, Vallera et al. [16] compare the impact of four electrified transportation modes on the power grid: hybrid, hybrid and catenary, hybrid and hydrogen energy, and battery swapping and show that the battery swapping mode is optimal. In addition, Zhu et al. [17] study the economic competitiveness of the three energy replenishment modes of overcharging, battery swapping and fast charging. Through the analysis of the cost model, it can be concluded that the three charging methods are more economical in short, medium and long charging distances, respectively. Patyal et al. [18] analyze the influencing factors of barriers to the adoption of NEVs, and the research shows that the development of a battery swapping mode makes resale anxiety and energy replenishment time anxiety no longer important factors affecting the popularity of NEVs. Liang and Zhang [19] analyze the charging and swapping pricing system, which consists of five modules, i.e., grid load monitoring, generator dispatching, battery exchange station operation, electric taxi driver response, and stakeholder benefit assessment, and propose four battery replacement pricing schemes and two charging strategies. Considering consumers’ refueling time preference, Hu et al. [4] study the pricing issues under the pay-per-use and monthly charging strategies of battery swapping service providers and the battery leasing pricing of battery leasing companies. In a supply chain consisting of two automakers and a battery exchange operator, Yang et al. [20] research the strategic choice between the self-operation and authorization of the automaker’s battery swapping service. The study shows that when the market is highly competitive, automakers should choose the authorization strategy. Based on Yang et al. [20], Yang et al. [21] construct a competitive market composed of battery swapping service providers and charging service providers, and study the social welfare maximization problem of three modes: no subsidy, consumer subsidy and provider subsidy. The research shows that subsidizing service providers is more effective than subsidizing consumers. Considering the randomness of leasing demand, Long et al. [22] study the coordination problem of the leasing supply chain composed of battery suppliers and battery swapping stations. The research shows that battery suppliers can achieve channel coordination by setting battery buyback strategies. The above work on the battery swapping service mainly focuses on the comparison of battery charging and swapping modes, but does not discuss the impact of the battery swapping service in the battery swapping vehicle supply chain.

2.3. New Energy Vehicle Supply Chain Decision

The study of decisions in the NEV supply chain is attracting more attention. Some scholars have conducted research on the impact of charging and swapping stations on the supply chain of NEVs. Wang and Deng [23] discuss whether the charging network should be invested by the manufacturer or the dealer under the exogenous and endogenous situations of automobile prices. The research shows that when the price is exogenous, the manufacturer invests optimally in the early market; otherwise, the dealer invests optimally. Aiming at the investment strategy of charging facilities, considering the subsidy policy and consumer heterogeneity, Yu et al. [24] construct an automobile retail supply chain composed of the government, manufacturers, retailers and consumers, and analyze pricing strategies and investment strategies through the Stackelberg model. The research shows that retailers have an advantage in investing in charging facilities. In addition, NEVs have the characteristics of a two-sided market platform [25]. Yu et al. [26] describe the bilateral market effect between charging station investors and consumers based on a sequential game model. The research shows that the number of charging stations required under the standard of social welfare maximization is more than the market solution. On the basis of Yu et al. [26], Jang et al. [27] further introduce platform competition between fuel vehicle manufacturers and electric vehicle manufacturers to study the indirect network effects on consumers and energy suppliers. The research shows that the indirect network effects of energy suppliers and consumers have a significant impact on the adoption of the NEV market. Therefore, electric vehicle manufacturers should take measures to encourage energy suppliers to join the NEV platform. Additionally, lower oil prices do not always have a negative impact on EV sales. Unlike the Jang et al. [27] research, Zhu et al. [28] consider the impact of government subsidy behavior on a two-sided market platform for NEVs. The interaction between the government, charging infrastructure investors and electric vehicle consumers is analyzed by constructing a three-level game model. The study has shown that the indirect network effects of the electric vehicle market can help the government save more subsidies. Considering the network externality of the number of charging stations, Yoo et al. [29] study pricing and profit under three scenarios of cooperation between enterprises and charging service providers, i.e., vehicle companies and charging service providers provide services independently and cooperatively.
The main differences between this work and the relevant literature are summarized in Table 1. In conclusion, there is little research on the decisions of battery swapping vehicle supply chain regarding the battery leasing service and battery swapping service. Compared with the existing literature, the main differences of our work are as follows: (1) we consider the impact of the battery leasing service price and battery swapping service price on the vehicle supply chain; (2) the characteristic of battery leasing service is portrayed through the battery leasing time; the battery swapping service results in the special cost of battery maintenance; (3) the battery maintenance process of the battery swapping service helps to increase the battery leasing time.

3. Problem Description and Model Assumptions

3.1. Problem Description

The supply chain structure is shown in Figure 1. The vehicle manufacturer produces and sells the vehicle body at the price of p v to consumers and decides to sell the battery at the price of p b to the battery asset company, which provides the battery leasing service. Considering that the battery leasing and battery swapping services can be provided by different supply chain members, there are two kinds of supply chain structures with three operation modes: The first involves only the vehicle manufacturer. Specifically, it means that the vehicle manufacturer provides the battery leasing and battery swapping services (N case for short). The second involves both the vehicle manufacturer and the battery asset company. It includes two modes: (1) the battery asset company provides the battery leasing and battery swapping services (B case for short); (2) the vehicle manufacturer provides the battery swapping service and the battery asset company provides the battery leasing service (S case for short). In the operation modes, supply chain members need to decide on the battery leasing price p r and battery swapping price p s .

3.2. Model Assumptions

Assumption 1. 
Combined with practice, the life cycle of the vehicle body is much longer than that of the power battery, i.e., the number of batteries consumed in the life cycle of the vehicle body is greater than 1. Based on the life cycle of the vehicle body, the sum of the battery life used in the life cycle of the vehicle body is expressed as the average battery leasing time (battery leasing time for short). In addition, to simplify the model, the number of batteries required in the life cycle of the vehicle body is standardized to 1.
Assumption 2. 
In the sales phase of the battery swapping vehicle, the price of the battery swapping vehicle based on the battery leasing service is composed of the vehicle body price and the battery leasing service price. According to Zhang and Rao [6] and Avci et al. [30], the demand function is denoted as D n = 1 p r p v , where p r ( p r > 0 ) is the battery leasing service price (the battery leasing price for short), and p v ( p v > 0 ) is the vehicle body price.
Assumption 3. 
The battery swapping service is the way to replenish energy in the use stage of battery swapping vehicles, so the demand for the battery swapping service is the derivative demand for battery swapping vehicles. The demand for the battery swapping service D s is affected by the demand for battery swapping vehicles D n and the cost of the battery swapping service p s during the life cycle of the battery swapping vehicles. According to Jang et al. [27] and Yoo et al. [29] on the assumption of NEV supplementary energy cost, the demand function of battery swapping service is denoted as: D s = D n η p s , where η ( η > 0 ) is the price sensitivity coefficient of the battery swapping service and p s ( p s > 0 ) is the average price of the battery swapping service in the life cycle of the battery swapping vehicles (battery swapping price for short).
Assumption 4. 
According to Sun et al. [31], the cost of the battery swapping service is mainly composed of the site cost of the battery swapping station, battery swapping equipment cost, battery cost and operation cost. Since the site cost, battery swapping equipment cost and battery cost are fixed costs and are not affected by market demand, they are not taken into account. The operation cost c m = c s + c u is a variable cost, where c s is the battery maintenance cost and c u are battery swapping charges. Generally speaking, since battery swapping charges are transparent and stable, according to Yoo et al. [29], we assume c u = 0 .
In the process of providing the battery swapping service, the battery life can be effectively increased by maintenance, so that the battery leasing time of the battery in the battery swapping station can be increased. The battery leasing time of the battery in the battery swapping station is assumed as t s = t 0 + Δ t . Here, t 0 is the basic leasing time without maintenance during the life cycle of the battery and Δ t is the increased leasing time after the battery is maintained (the battery leasing increasing time for short). Moreover, Δ t is related to operation cost. The higher the operation cost, the higher the battery maintenance cost, and the longer the battery can be leased. However, the battery life is limited, i.e., when the battery life reaches a certain value, the battery maintenance cost greatly increases as the battery leasing time increases. The battery maintenance cost, i.e., the battery leasing increasing time cost is c s = 1 2 k Δ t 2 . Here, k is the battery leasing increasing time cost coefficient. For the payer of the battery maintenance cost, according to the relevant interpretation of NIO Automobile and RISING AUTO on the battery maintenance, the battery maintenance cost is borne by the battery ownership enterprises.
The notations of this paper are shown in Table 2.

4. Model Establishment and Solution

4.1. N Case

In the N case, the vehicle manufacturer sells the vehicle body and offers the battery leasing service and battery swapping service to consumers. For example, NIO sells the vehicle bodies to consumers and provides battery leasing package options of 980 CNY per month and 1680 CNY per month. Moreover, consumers are provided with the battery swapping service through NIO’s self-built battery swapping system. Similarly, Geely Automobile provides the battery swapping service for Geely’s Maple Leaf series V80 and S60 through its battery swapping operation company—E—ENERGEE. In this model, the vehicle manufacturer simultaneously decides on the battery leasing price p r and battery swapping price p s . Therefore, the vehicle manufacturer’s profit is:
π n N = ( p v + t s p r c n ) D n + ( p s D s 1 2 k Δ t 2 ) .
By the backwards induction, the optimal decisions of the vehicle manufacturer are as follows:
p r N = 2 η ( t s p v t s c n + p v ) p v + 1 4 η t s 1 ,
p s N = t s p v t s + c n p v 4 η t s 1 ,
D n N = 2 η ( t s p v t s + c n p v ) 4 η t s 1 ,
D s N = η ( t s p v t s + c n p v ) 4 η t s 1 ,
π n N = 2 η X 2 t s 2 + 4 η ( k Δ t 2 X Y ) t s 2 η Y 2 k Δ t 2 2 ( 4 η t s 1 ) .
where X = p v 1 and Y = c n p v . Besides, the parameter should meet k < k 1 = 2 η ( t s X + Y ) 2 Δ t 2 ( 4 η t s 1 ) to ensure that the vehicle manufacturer’s profit is positive.
Proof. 
The proof process is shown in Appendix A. □

4.2. B Case

In the B case, the vehicle manufacturer sells the vehicle body to customers. As the battery swapping service operator, the battery asset company provides the battery leasing service and battery swapping service to customers while the vehicle manufacturer sells the battery ownership to the battery asset company. For instance, the cooperation mode between BAIC and Aulton Technology is similar to this. In this model, the vehicle manufacturer decides on the battery price p b , and the battery asset company simultaneously decides on the battery leasing price p r and battery swapping price p s . The profits of the vehicle manufacturer and the battery asset company are:
π n B = ( p v + p b c n ) D n ,
π b B = ( t s p r p b ) D n + ( p s D s 1 2 k Δ t 2 ) .
Similar to Section 4.1, the optimal decisions of the vehicle manufacturer and the battery asset company are as follows:
p b B = t s p v + t s + c n p v 2 ,
p r B = 3 η t s p v 3 η t s η c n + η p v p v + 1 4 η t s 1 ,
p s B = t s p v t s + c n p v 2 ( 4 η t s 1 ) ,
D n B = η ( t s p v t s + c n p v ) 4 η t s 1 ,
D s B = η ( t s p v t s + c n p v ) 2 ( 4 η t s 1 ) ,
π n B = ( t s p v t s + c n p v ) 2 η 2 ( 4 η t s 1 ) ,
π b B = η X 2 t s 2 + 2 η ( 4 k Δ t 2 X Y ) t s η Y 2 2 k Δ t 2 4 ( 4 η t s 1 ) .
The parameter should meet k < k 2 = η ( t s X + Y ) 2 2 Δ t 2 ( 4 η t s 1 ) to ensure that the battery asset company’s profit is positive.
Proof. 
The proof process is similar to the N case; omitted. □

4.3. S Case

In the S case, the vehicle manufacturer sells the vehicle body to the customers and the battery to the battery asset company while providing the battery swapping service to the consumers through their own battery swapping service system. Meanwhile, the battery asset company provides the battery leasing service to the customers. In this model, because of the inconsistency of property rights regarding the use of the battery, the battery maintenance cost of the battery asset company needs to be paid to the vehicle manufacturer, according to the principle that the battery maintenance cost is borne by the battery ownership company. The business model of RISING AUTO is similar to this. In this model, the vehicle manufacturer simultaneously decides on the battery price p b and battery swapping price p s , and the battery asset company decides on the battery leasing price p r . The profits of the vehicle manufacturer and the battery asset company are:
π n S = ( p v + p b c n ) D n + ( p s D s + 1 2 k Δ t 2 ) ,
π b S = ( t s p r p b ) D n 1 2 k Δ t 2 .
Similarly, the optimal decisions of the vehicle manufacturer and the battery asset company are as follows:
p b S = t s ( 4 η t s p v 4 η t s 4 η c n + 4 η p v p v + 1 ) 8 η t s 1 ,
p s S = t s p v t s + c n p v 8 η t s 1 ,
p r S = 6 η t s p v 6 η t s 2 η c n + 2 η p v p v + 1 8 η t s 1 ,
D n S = 2 η ( t s p v t s + c n p v ) 8 η t s 1 ,
D s S = η ( t s p v t s + c n p v ) 8 η t s 1 ,
π n S = 2 η X 2 t s 2 + 4 η ( 2 k Δ t 2 + X Y ) t s + 2 Y 2 η k Δ t 2 2 ( 8 η t s 1 ) ,
π b S = 8 η 2 X 2 t s 3 + 16 η 2 ( 4 k Δ t 2 X Y ) t s 2 8 η ( Y 2 η + 2 k Δ t 2 ) t s + k Δ t 2 2 ( 8 η t s 1 ) 2 .
The parameter should meet k < k 3 = 8 η 2 t s ( t s X + Y ) 2 Δ t 2 ( 8 η t s 1 ) 2 to ensure that the battery asset company’s profit is positive.
Proof. 
The proof process is similar to the N case; omitted. □

5. Model Analysis and Comparison

5.1. The Impact of Battery Leasing Increasing Time Δ t in N Case

Corollary 1. (1) If max { c n 1 , 0 } < c n < c n 2 , p r N Δ t > 0 , p s N Δ t < 0 , D n N Δ t < 0 , D s N Δ t < 0 ; otherwise, p r N Δ t 0 , p s N Δ t 0 , D n N Δ t 0 , D s N Δ t 0 ; 
  • (2) If c n > c n 3 , or max { c n 1 , 0 } < c n < c n 3 and k 1 < k < k 4 , π n N Δ t > 0 ; if max { c n 1 , 0 } < c n < c n 3 and k > k 4 , π n N Δ t < 0 .
  • Where c n 1 = 2 η t s X + 2 η p v p v + 1 2 η , c n 2 = 4 η p v p v + 1 4 η , k 4 = 2 η Z 1 Z 2 Δ t ( 4 η Δ t + 4 η t 0 1 ) 2 , c n 3 = ( t 0 X p v ) ( 4 t s η 1 ) + 2 η Δ t ( t s X p v ) 4 t 0 η + 6 η Δ t 1 , Z 1 = Δ t p v + p v t 0 Δ t + c n p v t 0 , Z 2 = 2 η Δ t p v + 2 η p v t 0 2 η Δ t 2 η c n + 2 η p v 2 η t 0 p v + 1 .
Proof. 
The proof process is shown in Appendix B. □
From Corollary 1, the impact of the battery leasing increasing time Δ t on the service price and demand is affected by the vehicle production cost c n . The impact of the battery leasing increasing time Δ t on the vehicle manufacturer profit depends on the vehicle production cost c n and the battery leasing increasing time cost coefficient k . When c n is larger or c n and k are smaller, the vehicle manufacturer is more advantageous in extending the battery leasing increasing time.
Specifically, when the vehicle production cost is lower ( max { c n 1 , 0 } < c n < c n 2 ), with the increase in Δ t , the battery leasing price increases and the battery swapping price, battery swapping vehicle demand and battery swapping service demand gradually decrease. In this case, the vehicle manufacturer can set a lower vehicle body price so that the demand for battery swapping vehicles becomes larger. Consequently, the vehicle manufacturer will raise the battery leasing price to increase revenue with the increase in Δ t , thus reducing the demand for the battery swapping service. Clearly, to increase the demand for the battery swapping service, the price of the battery swapping service should be reduced. However, the increase in demand for a battery swapping vehicle caused by the reduction in the battery swapping price is less than the decrease in demand for the battery swapping service caused by the demand for a battery swapping vehicle, which reduces the demand for the battery swapping service.
When the vehicle production cost is higher ( c n > c n 2 ), with the increase in Δ t , the battery leasing price decreases and the battery swapping price, battery swapping vehicle demand and battery swapping service demand gradually increase. Obviously, a higher vehicle production cost will prompt the vehicle manufacturer to raise the vehicle body price, thereby reducing the demand for vehicles. Therefore, to increase the demand for a battery swapping vehicle, the vehicle manufacturer will lower battery leasing price with the increase in Δ t . In addition, the longer the Δ t , the higher the cost of the battery swapping service, hence raising the battery swapping price. However, the demand for the battery swapping service increases because the decline in demand for the battery swapping service caused by the increase in the battery swapping price is less than the increase in demand for the battery swapping service caused by the demand for battery swapping vehicles.
The variation in profit with Δ t is related to the vehicle production cost c n and the battery leasing increasing time cost coefficient k . When the vehicle production cost c n is larger ( c n > c n 3 ) or both the vehicle production cost c n and the cost of battery leasing increasing time are smaller ( max { c n 1 , 0 } < c n < c n 3 and k 1 < k < k 4 ), extending the battery leasing increasing time is equivalent to extending the battery leasing time on the basis of the same basic battery leasing time t 0 . As a result, the vehicle manufacturer’s battery leasing service revenue increases, thereby increasing their profits. However, if the battery leasing increasing time cost is higher ( k > k 4 ), then extending the battery leasing increasing time will reduce the vehicle manufacturer profit even though the vehicle production cost c n is smaller.

5.2. The Impact of Battery Leasing Increasing Time Δ t in B Case

Corollary 2. (1) p b B Δ t > 0 ; 
  • (2) If max { c n 4 , 0 } < c n < c n 2 , p r B Δ t > 0 , p s B Δ t < 0 , D n B Δ t < 0 , D s B Δ t < 0 ; otherwise, p r B Δ t 0 , p s B Δ t 0 , D n B Δ t 0 , D s B Δ t 0 ;
  • (3) (a) π n B Δ t > 0 ; (b) if c n > c n 3 or max { c n 4 , 0 } < c n < c n 3 and k 2 < k < k 5 , π b B Δ t > 0 ; if max { c n 4 , 0 } < c n < c n 3 and k > k 5 , π b B Δ t < 0 ; (c) if c n > c n 3 or max ( c n 4 , 0 ) < c n < c n 3 and k 6 < k < k 7 , π T B Δ t > 0 ; if max ( c n 4 , 0 ) < c n < c n 3 and k > k 7 , π T B Δ t < 0 .
  • Where c n 4 = 3 η t s X + η p v p v + 1 η , k 5 = η Z 1 Z 2 2 Δ t ( 4 η Δ t + 4 η t 0 1 ) 2 , k 6 = 3 η t s X + c n p v 2 2 Δ t 2 4 η t s 1 , k 7 = 3 η Z 1 Z 2 2 Δ t ( 4 η Δ t + 4 η t 0 1 ) 2 .
Proof .
The proof process is similar to Corollary 1; omitted. □
From Corollary 2, the impact of Δ t on the service price, demand and profits is the same as Corollary 1, which indicates that the impact of Δ t on supply chain members’ decisions in the B case is similar to that in the N case. In addition, the longer the Δ t in the B case, the higher the battery price is. Namely, if the battery leasing increasing time is longer, then the unit battery leasing service income is higher based on the same battery leasing price, which encourages the vehicle manufacturer to increase the battery price when selling the battery to the battery asset company.
In terms of profit, for the vehicle manufacturer, the longer the battery leasing time, the higher the battery price, which is more conductive to improving its profit. For the battery asset company and the supply chain, the impact of Δ t on profit depends on the vehicle production cost c n and the battery leasing increasing time cost coefficient k . If the vehicle production cost is larger ( c n > c n 3 ) or both the vehicle production cost and the cost of battery leasing increasing time are smaller ( max { c n 4 , 0 } < c n < c n 3 and k 2 < k < k 5 ), then increasing the battery leasing increasing time will raise the profits of the battery asset company and system. However, when the cost of the battery leasing increasing time is larger based on the smaller vehicle production cost, extending the battery leasing increasing time can reduce the battery leasing service revenue, thus reducing the profits of the battery asset company and system.

5.3. The Impact of Battery Leasing Increasing Time Δ t in S Case

Corollary 3. (1) p b S Δ t > 0 ; 
  • (2) If max { c n 5 , 0 } < c n < c n 6 , p r S Δ t > 0 , p s S Δ t < 0 , D n S Δ t < 0 , D s S Δ t < 0 ; otherwise, p r S Δ t 0 , p s S Δ t 0 , D n S Δ t 0 , D s S Δ t 0 ;
  • (3) (a) π n S Δ t > 0 ; (b) if η > η 2 and c n > c n 7 , or η > η 2 , max { c n 5 , 0 } < c n < c n 7 and k 3 < k < k 8 , π b S Δ t > 0 ; if η 1 < η < η 2 , or η > η 2 , max { c n 5 , 0 } < c n < c n 7 and k > k 8 , π b S Δ t < 0 ; (c) if t s > t s 1 or 1 8 η < t s < t s 1 and c n > c n 8 , π T S Δ t > 0 , if 1 8 η < t s < t s 1 and max { c n 5 , 0 } < c n < c n 8 , π T S Δ t < 0 .
  • Where, η 1 = p v 1 4 ( t s p v t s c n + p v ) , η 2 = 3 t s X + Y 8 t s t s X Y , c n 5 = 4 η t s X + 4 η p v p v + 1 4 η , c n 6 = 8 η p v p v + 1 8 η , t s 1 = 24 η p v + 3 ( 8 η p v p v + 1 ) ( 24 η p v 11 p v + 11 ) 9 X 48 X η , c n 7 = 8 η t s ( 2 t 0 2 X + 3 t 0 Δ t X + Δ t 2 X 2 t 0 p v 3 Δ t p v ) 2 X t 0 2 + ( 2 p v Δ t X ) t 0 + Δ t 2 X + Δ t p v 16 t 0 2 η + 40 t 0 η Δ t + 24 η Δ t 2 2 t 0 Δ t , c n 8 = 48 η 2 t s 2 X + 48 η 2 t s p v 18 η t s X 2 η p v + X 2 η ( 24 η t s 1 ) , k 8 = 4 η 2 Z 1 ( 8 η t s 2 X 8 η t s c n + 8 η t s p v 3 t s X c n + p v ) Δ t ( 8 η Δ t + 8 η t 0 1 ) 3 .
Proof .
The proof process is similar to Corollary 1; omitted. □
From Corollary 3, the impact of Δ t on battery price, service price and demand is the same as Corollary 1, which indicates that the impact of Δ t on supply chain members’ decisions in the S case is similar to that in the N case. With regard to profits, for the vehicle manufacturer, the longer the Δ t , the more battery maintenance fees the vehicle manufacturer can gain from the battery asset company, which is more favorable to increasing its profit. For the battery asset company, the η , c n and k all affect the impact of Δ t on profit. Furthermore, when customers are not sensitive to battery swapping, extending the battery leasing increasing time will reduce the battery asset company profit. For the supply chain, only in the two case, i.e., the battery leasing time is longer ( t s > t s 1 ), the battery leasing time is shorter and the vehicle production cost is larger ( 1 8 η < t s < t s 1 and c n > c n 8 ), the longer the battery leasing increasing time, the more the battery leasing service revenue, and the greater the system profit.
From Corollaries 1–3, despite the vehicle production cost being higher, the provider of the battery leasing service, whether it be the vehicle manufacturer in the N case or the battery asset company in the B and S cases, will choose to reduce the battery leasing price with the increase in Δ t to further expand the market demand for electric vehicles. At the same time, although the unit profit space of the battery leasing service is reduced, both the supply chain members and system profit can be increased. Because the battery swapping price increases, and the demand for battery swapping vehicles and the battery swapping service increases. This case is in line with the current situation of the development stage of battery swapping vehicles. To promote the expansion of battery swapping vehicles and the battery swapping service, and to make more profits, both the vehicle manufacturer and the battery asset company strive to maintain a lower battery leasing price with the increase in the battery leasing increasing time in the background of high vehicle production cost. Nevertheless, the battery price remains high.

5.4. The Impact of Vehicle Body Price p v

Corollary 4. (1) p b B p v < 0 , p b S p v < 0 ; 
  • (2) (a) If c n > 1 and X 2 ( t s X Y ) < η < 1 2 t s + 2 , p r N p v > 0 ; if c n < 1 , or c n > 1 and η > 1 2 t s + 2 , p r N p v < 0 ; (b) if c n > 1 and X 3 t s X Y < η < 1 3 t s + 1 , p r B p v > 0 , if c n < 1 , or c n > 1 and η > 1 3 t s + 1 , p r B p v < 0 ; (c) p r S p v < 0 ;
  • (3) p s N p v < 0 , p s B p v < 0 , p s S p v < 0 , D n N p v < 0 , D n B p v < 0 , D n S p v < 0 , D s N p v < 0 , D s B p v < 0 , D s S p v < 0 , π n N p v < 0 , π n B p v < 0 , π n S p v < 0 , π b B p v < 0 , π b S p v < 0 , π T B p v < 0 , π T S p v < 0 .
Proof. 
The proof process is shown in Appendix C. □
From Corollary 4, with the increase in p v , the battery price decreases. This means that a higher vehicle body price will reduce the demand for battery swapping vehicles, so that the vehicle manufacturer will reduce the battery price to increase profit. Furthermore, the impact of p v on battery leasing prices is different. More specifically, with the increase in p v , the battery leasing price declines in the S case. The reason is that the battery leasing price and vehicle body price simultaneously affect the demand for battery swapping vehicles as well as the battery leasing service provided by the battery asset company in the S case. Thus, the battery asset company will lower the battery leasing price to slow down the decline in battery swapping vehicle demand when the increase in p v reduces the demand for battery swapping vehicles. What is more, the impact of p v on the battery leasing price depends on the vehicle production cost c n and the sensitivity of the battery swapping price η in the N case and B case. In both cases, the two services are provided by the same supply chain member. If the battery swapping price sensitivity is higher based on the larger vehicle production cost, then battery leasing price falls with the increase in p v . Otherwise, the battery leasing price rises. That is to say, if consumers are more sensitive to the battery swapping price and the vehicle production cost is high, then the battery leasing price can be reduced to expand the potential market of the battery swapping service; otherwise, the battery leasing price can be raised.
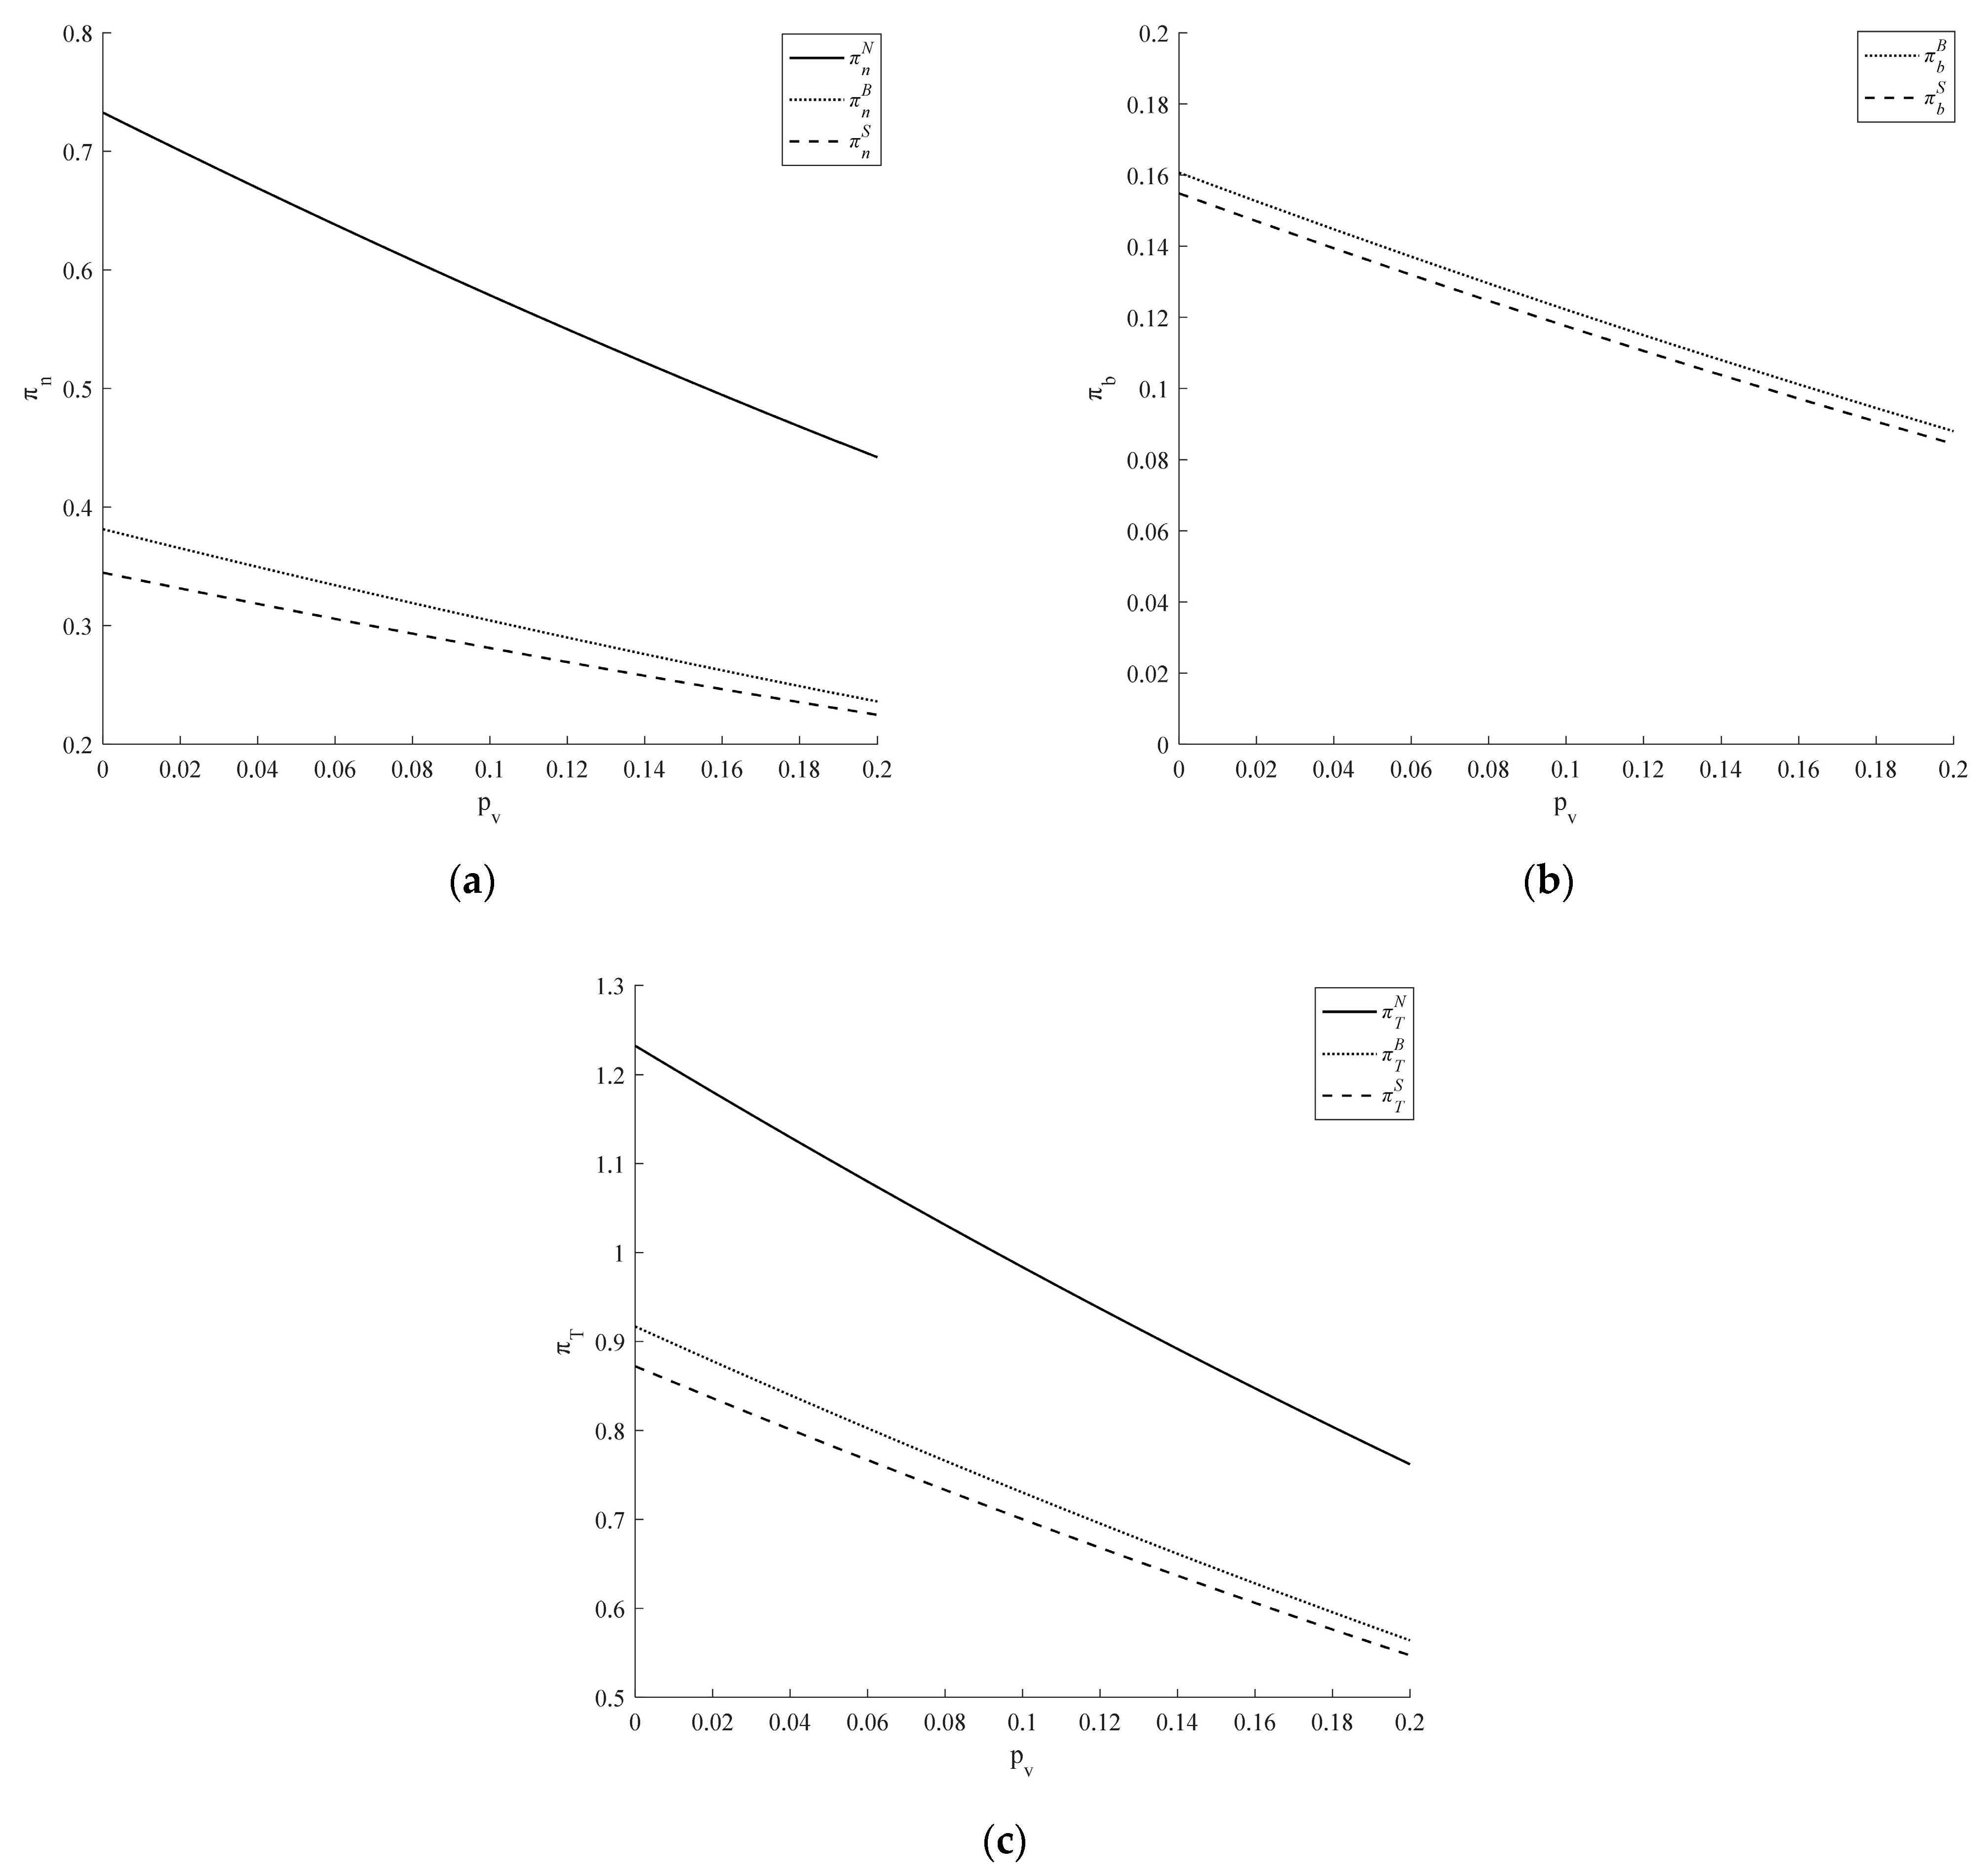
With the increase in p v , the battery swapping price, the demand for electric vehicles, the demand for battery swapping service and profit all decrease. This is because the increase in vehicle body price reduces the demand for battery swapping vehicles, thereby indirectly reducing the demand for the battery swapping service. Therefore, the service providers in the three cases will reduce the battery swapping price to promote the increase in demand. Additionally, even if the battery leasing price increases when the consumer is not sensitive to the battery swapping price, its impact on profit is less than the impact of the demand for electric vehicles and the profit reduction of the battery swapping service, thereby reducing the profits of the supply chain members and the system.
Corollary 4 shows that the lower the vehicle body price is, the more favorable it is to increase demand, supply chain members and system profit.

5.5. The Impact of Battery Swapping Price Sensitive Coefficient η

Corollary 5.  (1) p r N η > 0 , p s N η < 0 , D n N η < 0 , D s N η < 0 , π n N η < 0 ; 
  • (2) p b B η = 0 , p r B η > 0 , p s B η < 0 , D n B η < 0 , π n B η < 0 , π b B η < 0 , π T B η < 0 ;
  • (3) p b S η > 0 , p r S η > 0 , p s S η < 0 , D n S η < 0 , D s S η < 0 , π n S η < 0 , π b S η < 0 , π T S η < 0 .
Proof .
Corollary 5 can be obtained by the partial derivative of decision variables, demand and profit in the three cases. The proof process is omitted. □
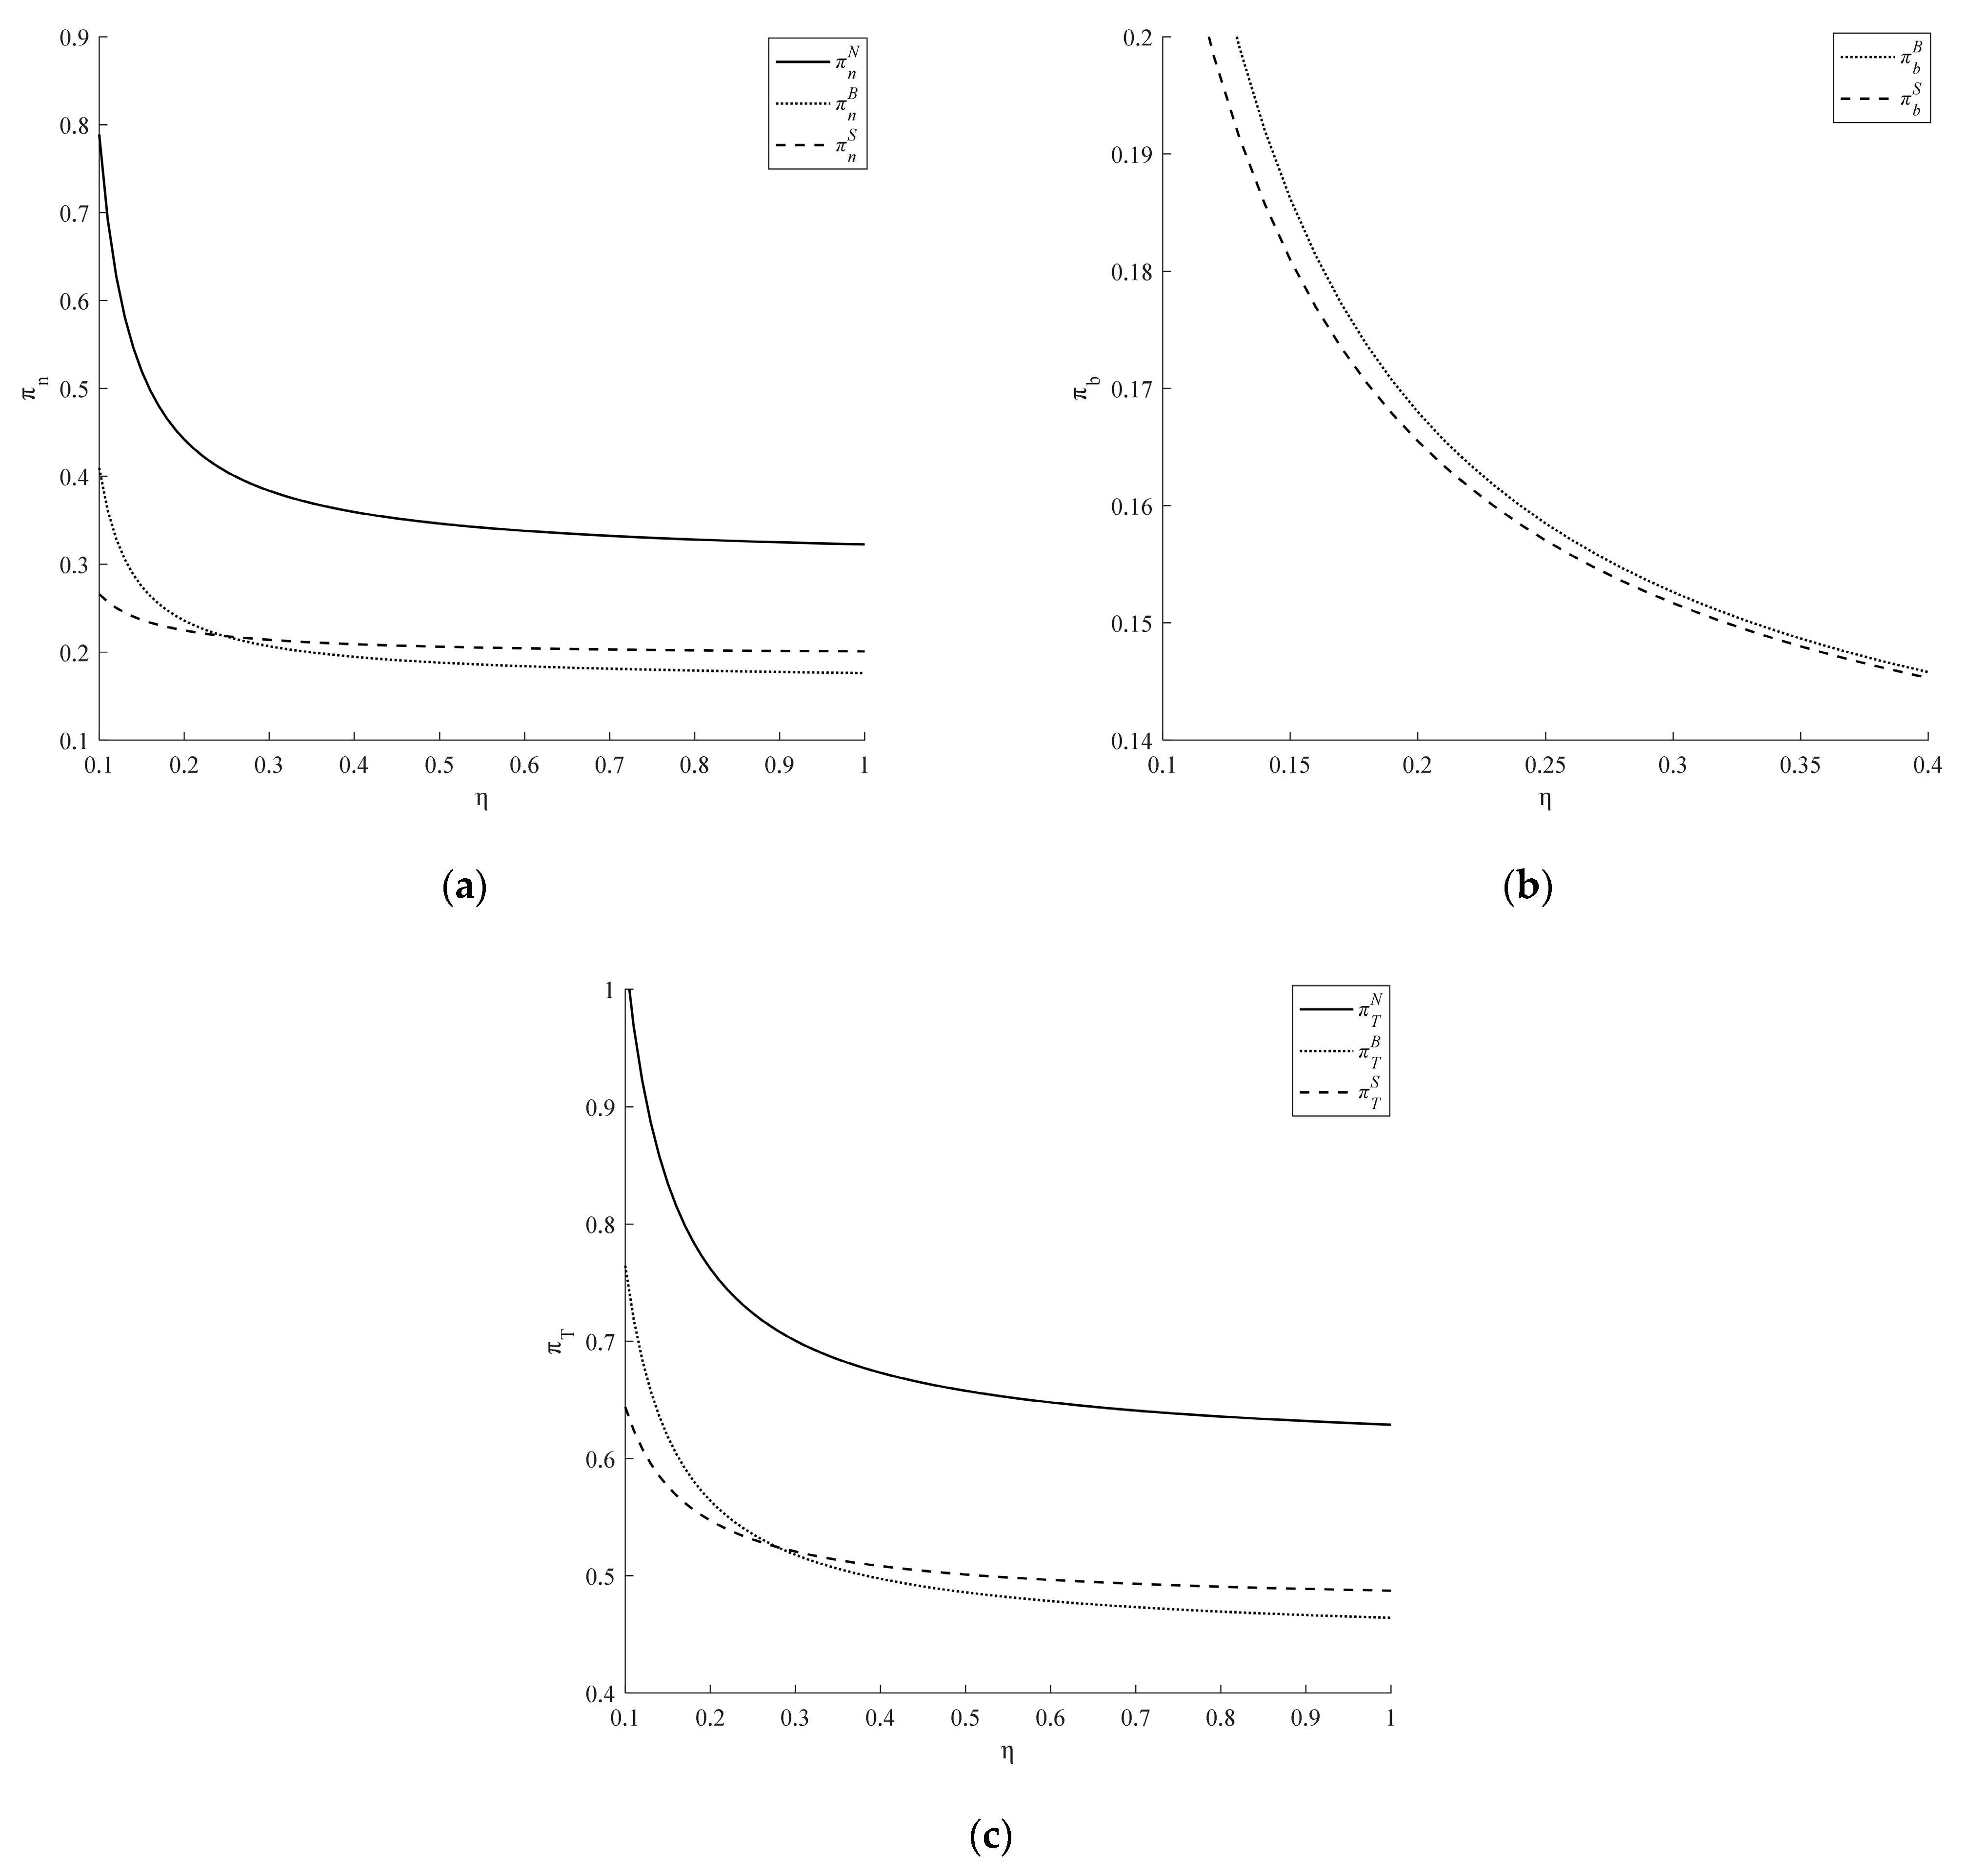
From Corollary 5, with the increase in η , the battery leasing price rises, and thebattery swapping price, battery swapping vehicle demand, battery swapping service demand and profit all decrease. The reasons for the increase in battery leasing price and the decrease in battery swapping price are different in the three cases. The two services are provided by the same supply chain members in the N case and B case. With the increase in η , supply chain members who provide both services will choose to reduce the price of the battery swapping service and increase the battery leasing price. However, the battery swapping service is provided by the vehicle manufacturer while the battery leasing service is provided by the battery asset company in the S case. When consumers are sensitive to the battery swapping price, the vehicle manufacturer will reduce the battery swapping price to increase the battery swapping demand. In turn, the battery asset company will increase the battery leasing price to increase the battery leasing service income while the demand for battery swapping vehicles is reduced. However, the decline in demand for battery swapping vehicles is greater than the increase in demand caused by the decline in the battery swapping price, thereby reducing the demand for the battery swapping service. Furthermore, the profit increase brought by the increase in the battery leasing price is less than the decrease brought by the decrease in battery swapping vehicle demand, so the profits of the supply chain members are reduced. This shows that the more sensitive consumers are to the battery swapping price, the more the demand, supply chain members and system profit are reduced, although it is beneficial to reducing the battery swapping price. In conclusion, the above conclusions are in agreement with the current development status of the battery swapping vehicle. In this instance, consumers are more sensitive to the battery swapping price, the battery leasing price is higher, and the demand for battery swapping vehicles and the battery swapping service is smaller while the supply chain members and system do not achieve significant profits.

5.6. Comparative Analysis of the Three Cases

Corollary 6. (1) p b B > p b S , p r N < p r B < p r S , p s S < p s B < p s N , D n S < D n B < D n N , D s S < D s B < D s N ; 
  • (2) If k 9 < k < k 1 , π n N < π n B ; otherwise, π n N π n B ; if k 10 < k < k 1 , π n N < π n S ; otherwise, π n N π n S ; if k 11 < k < k 3 , π n B < π n S ; otherwise, π n B π n S ;
  • (3) π b B π b S ;
  • (4) π T N > π T B ; π T N > π T S ; if k 13 < k < k 12 , π T B < π T S ; otherwise, π T B π T S .
  • Where k 9 = η t s X + Y 2 Δ t 2 4 η t s 1 , k 10 = 4 η 2 t s ( t s X + Y ) 2 Δ t 2 ( 4 η t s 1 ) ( 8 η t s 1 ) , k 11 = η ( t s X + Y ) 2 Δ t 2 ( 4 η t s 1 ) ( 8 η t s 1 ) , k 12 = 3 η ( t s X + c n p v ) 2 2 Δ t 2 ( 4 η t s 1 ) , k 13 = η ( t s X + Y ) 2 ( 16 η t s 1 ) 2 Δ t 2 ( 4 η t s 1 ) ( 8 η t s 1 ) 2 .
Proof .
The proof process is shown in Appendix D. □
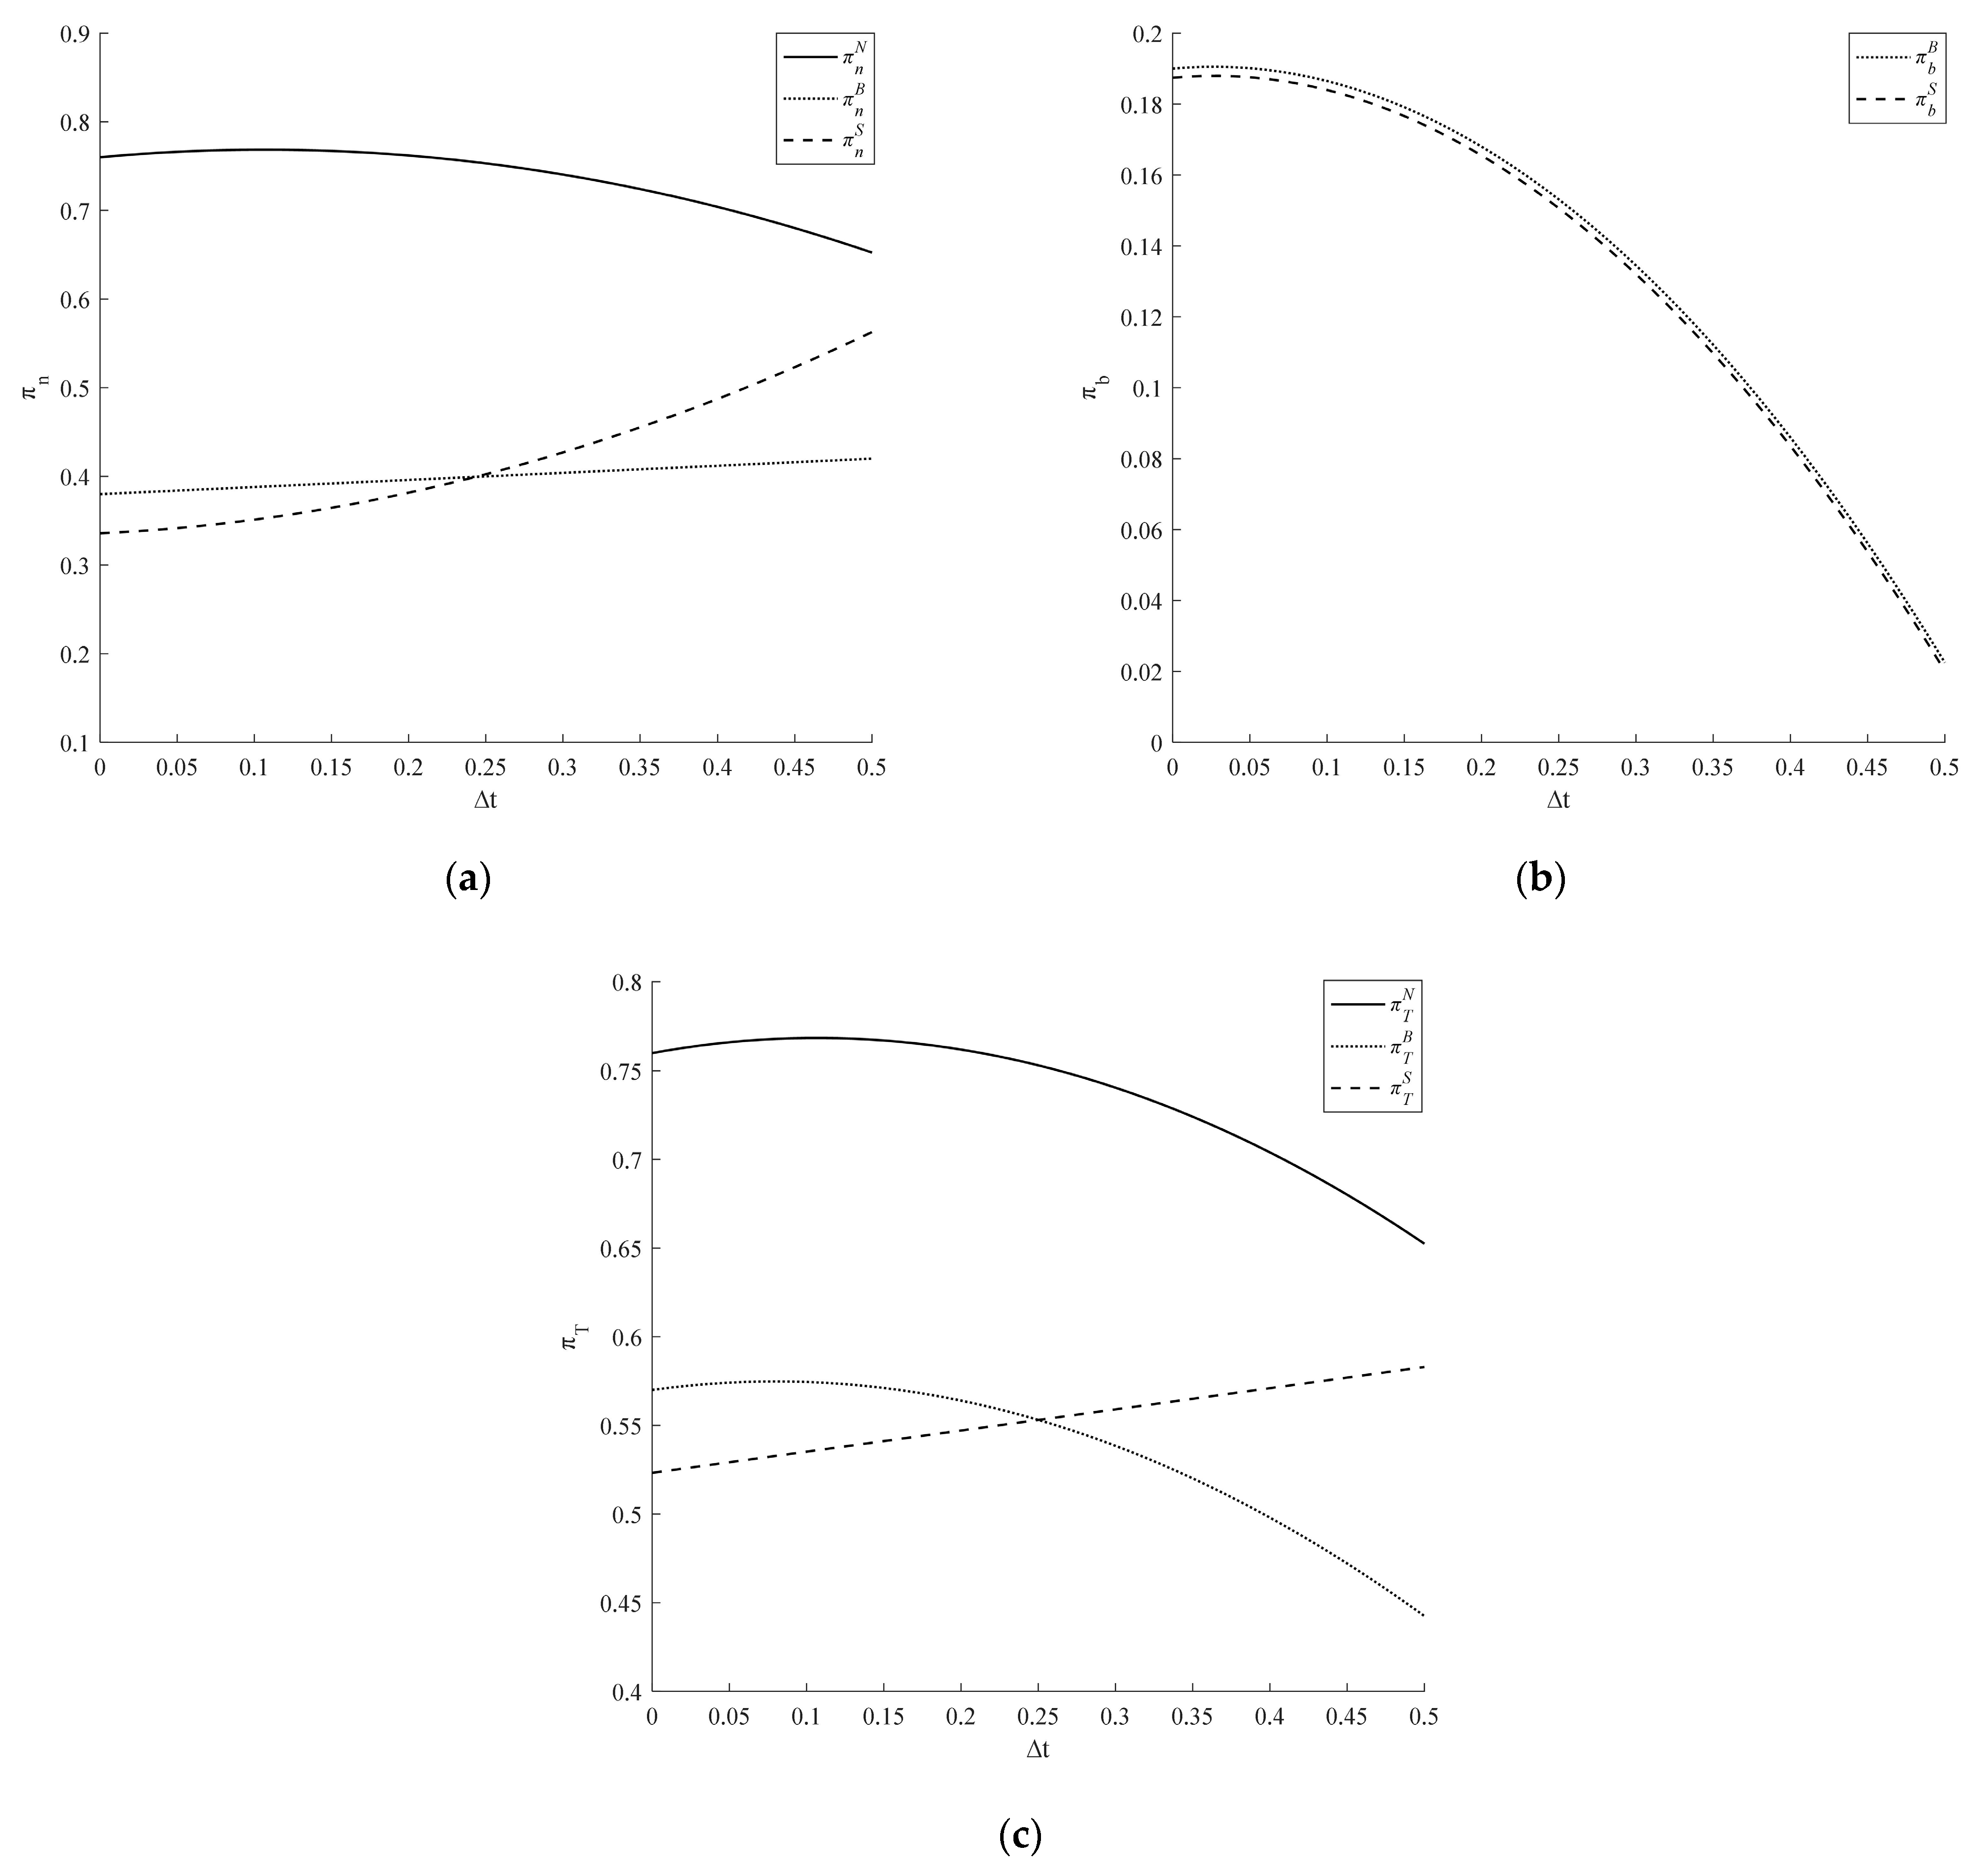
Corollary 6 shows that in the N case, the battery leasing price is the lowest and the demand for battery swapping vehicles and the battery swapping service is the largest. This shows that when the vehicle manufacturer provides battery leasing and battery swapping services, the lower battery leasing price is helpful to promote the growth of demand for battery swapping vehicles and the battery swapping service. In addition, the battery price is the highest in the B case. Given that in the B case, the revenue of the vehicle manufacturer only includes vehicle body sales revenue and battery sales revenue, the vehicle manufacturer will adopt a higher battery price strategy to increase profit since it has more service revenue from the battery swapping service in the S case compared with the B case.
The comparison of the vehicle manufacturer and system profit in the three cases depends on the battery leasing increasing time cost coefficient k , and the battery asset company profit is higher in the B case, which indicates that providing the battery swapping service can increase profit. Specifically, if k is smaller, then the vehicle manufacturer profit in the N case is larger; otherwise, that in the S case is larger. This shows that only when the cost of the battery leasing increasing time is smaller, namely, the battery maintenance cost is smaller, is providing the battery leasing service conducive to improving the vehicle manufacturer profit. Conversely, providing the battery swapping service will reduce profit. Thus, the impact of the battery leasing service is greater than that of the battery swapping service. In addition, it is more advantageous for the supply chain that the vehicle manufacturer provides centralized battery leasing and battery swapping services.
Overall, the battery asset company should actively provide the battery swapping service. For the vehicle manufacturer, if the battery leasing increasing time cost coefficient is smaller, then it is best to provide two types of services; otherwise, providing the battery swapping service is a better choose. For the supply chain, the vehicle manufacturer providing two types of service is optimal.

6. Numerical Example

To further analyze the profit variation of supply chain members in the three operation modes, numerical examples are given, and the related parameters are assumed as k = 1.5, t 0 = 6, Δ t = 0.2, p v = 0.2, c n = 1.2, η = 0.2.

6.1. Impact of Battery Leasing Increasing Time Δ t on Profit

From Figure 2, we can find that: (1) With the increase in the battery leasing increasing time Δ t , the vehicle manufacturer profit in the N case and the supply chain profit in the N case and B case all decrease, while those profits increase in the S case. (2) If Δ t is shorter, then π n N > π n B > π n S when Δ t is consistent. Otherwise, π n N > π n S > π n B . This shows that to obtain the maximum profit, the vehicle manufacturer should provide two services for a smaller Δ t . However, with the increase in Δ t , the profit advantage of the vehicle manufacturer providing two services gradually weakens, while the profit advantage of the vehicle manufacturer only providing the battery swapping service increases. Therefore, when Δ t is shorter, the vehicle manufacturer should provide both services; when Δ t is longer, the vehicle manufacturer should outsource the battery leasing service to the battery asset company, while only selling the vehicle body and providing the battery swapping service to consumers. (3) For the battery asset company, the profit in the B case and S case is negatively correlated with Δ t . When Δ t is consistent, π b B > π b S . This indicates that providing the battery swapping service will increase the battery asset company profit. Corollary 6 is further validated.

6.2. Impact of Vehicle Body Price p v on Profit

From Figure 3, we can find that: (1) With the increase in p v , the profits of the vehicle manufacturer, the battery asset company and supply chain all decrease, which verifies Corollary 4. (2) For the vehicle company profit, when p v is consistent, π n N > π n B > π n S . Meanwhile, the profit advantage of the vehicle manufacturer providing two services weakens. (3) For the battery asset company profit, when p v is consistent, π b B > π b S . This shows that for the vehicle manufacturer and the battery asset company, the lower the price of the vehicle body, the more obvious the advantages for both the vehicle manufacturer and the battery asset company choosing to provide two services.

6.3. Impact of Battery Swapping Service Price Sensitive Coefficient η on Profit

Figure 4 shows that with the increase in η , the profits of the vehicle manufacturer, the battery asset company and supply chain all decrease, which confirms Corollary 5. What is more, with the increase in consumers’ sensitivity to the price of the battery swapping service, the profit deceleration of the vehicle manufacturer, the battery asset company and supply chain in the three cases gradually decreases. In other words, when η is greater, its effect on profit is not more obvious.

7. Summary and Discussions

The battery leasing service and battery swapping service have emerged as significant solutions to overcome the challenges in the development of NEVs. Therefore, it is crucial and necessary to study the operation mode of the two services in the new energy vehicle supply chain. Based on the battery leasing service and battery swapping service, this paper proposes three operation modes of the battery leasing service and battery swapping service for the battery swapping vehicle supply chain composed of the vehicle manufacturer, the battery asset company and consumers: (1) the vehicle manufacturer provides the battery leasing and battery swapping services (N case), (2) the battery asset company provides the battery leasing and battery swapping services (B case) and (3) the vehicle manufacturer provides the battery swapping service while the battery asset company provides the battery leasing service (S case). According to the characteristics of the two services, the decision models under the three modes are constructed individually, and the relevant optimal decisions are obtained by backward induction. The decision results under the different modes are compared and analyzed. Finally, numerical examples are given to verify the results. This study finds that:
  • The N case is the optimal. In addition, for the comparison of the B case and the S case, when the battery leasing increasing time cost coefficient is smaller, the B case is the best. Otherwise, the S case is.
  • For supply chain members, when the battery leasing increasing time cost coefficient is smaller, the vehicle manufacturer should provide two services for the maximum profit. In the meantime, the battery leasing price is the lowest, and the vehicle demand and battery swapping service demand are the largest. In addition, the battery asset company should provide the battery swapping service to gain the maximum profit.
  • When the battery asset company provides the battery leasing service, the longer the battery leasing time and the greater the vehicle manufacturer profit.
  • For price and demand, the longer battery leasing time is not better. Only when the vehicle production cost is higher is increasing the battery leasing time conducive to reducing the battery leasing price, which is more beneficial to consumers, thus promoting demand growth.
Compared with the related literature on the pricing and strategy selection of energy replenishment methods for NEVs (Hu et al. [4]; Yang et al. [21]), this paper provides some new insights. Different from the above two literature studies from the perspective of consumer utility, this paper focuses on battery leasing and battery swapping services in the vehicle supply chain from the perspective of businesses and systematically considers the business mode in terms of the three aspects of battery leasing service, battery swapping service and vehicle body. Specifically, this paper considers that battery maintenance during battery swapping can increase the battery leasing time and discusses the boundaries of different operation modes for battery leasing and battery swapping services.
The battery leasing service and battery swapping service are of great significance to promoting NEVs. Based on the above research, the following managerial insight can be obtained:
  • The mode of the vehicle manufacturer providing two services to the supply chain is the optimal.
  • The vehicle manufacturer should decide on the service mode according to the battery leasing increasing time cost coefficient, while the battery asset company should actively provide the battery swapping service.
  • When the battery asset company provides battery leasing service, the vehicle manufacturer can “free ride” to enjoy the benefits of extending the battery leasing time.
  • With the high cost of NEVs limiting their development in China, extending the battery leasing increasing time is an effective measure to facilitate the diffusion of NEVs.
The limitation of this paper is that it does not consider the impact of the network externalities of the battery swapping station layout on the battery leasing and battery swapping services. This paper only considers the impact of the battery swapping service on the basis of the battery leasing service. In fact, as the operation place of battery swapping service, the network layout of the battery swapping station has a great influence on battery swapping vehicles and the battery swapping service. Therefore, further study is needed to consider the impact of the battery swapping station network layout on the basis of battery leasing and battery swapping services.

Author Contributions

Conceptualization, K.Y. and C.L.; methodology, C.L.; software, C.L.; validation, K.Y., C.L. and G.W.; formal analysis, C.L.; writing—original draft preparation, C.L.; writing—review and editing, K.Y., C.L. and G.W.; All authors have read and agreed to the published version of the manuscript.

Funding

This research was funded by National Natural Science Foundation of China, grant number 72161003.

Institutional Review Board Statement

Not applicable.

Informed Consent Statement

Not applicable.

Data Availability Statement

Not applicable.

Conflicts of Interest

The authors declare that they have no conflict of interest.

Appendix A

Proof of the N case. To obtain the Hessian matrix of the vehicle manufacturer profit function with respect to p r and p s , using Formula (1), we obtain 2 π n ( p s , p r ) p r 2 = 2 t s , 2 π n ( p s , p r ) p s 2 = 2 η , 2 π n ( p s , p r ) p s p r = 1 , 2 π n ( p s , p r ) p r p s = 1 . Correspondingly, we have the Hessian matrix of the vehicle manufacturer profit function with respect to p r and p s : H = 2 t s 1 1 2 η , and the Hessian matrix’ first-order derivatives are negative, and the second-order derivatives are positive for 4 t s η 1 > 0 . In this case π n ( p r , p s ) is the concave function of p r and p s ; there is a unique set of optimal solutions. Letting the first-order derivatives for π n ( p r , p s ) of p r and p s be zero, π n ( p r , p s ) p r = 0 , π n ( p r , p s ) p s = 0 , we obtain the optimal battery leasing and battery swapping prices:
p r N = 2 η ( t s p v t s c n + p v ) p v + 1 4 η t s 1
p s N = t s p v t s + c n p v 4 η t s 1
Substituting the optimal price Formulas (A1) and (A2) into the demand function of battery swapping vehicle and battery swapping service, the optimal battery swapping vehicle and battery swapping service demand is as follows:
D n N = 2 η ( t s p v t s + c n p v ) 4 η t s 1
D s N = η ( t s p v t s + c n p v ) 4 η t s 1
Substituting Formulas (A1)–(A4) into Formula (1), we obtain the vehicle manufacturer profit: π n N = 2 η X 2 t s 2 + 4 η ( k Δ t 2 X Y ) t s 2 η Y 2 k Δ t 2 2 ( 4 η t s 1 ) .

Appendix B

From the N case, we have p r N Δ t = 2 η ( 4 η c n 4 η p v + p v 1 ) ( 4 η t s 1 ) 2 , p s N Δ t = 4 η c n 4 η p v + p v 1 ( 4 η t s 1 ) 2 , D n N Δ t = 2 η ( 4 η c n 4 η p v + p v 1 ) ( 4 η t s 1 ) 2 , D s N Δ t = η ( 4 η c n 4 η p v + p v 1 ) ( 4 η t s 1 ) 2 . π n N Δ t = 4 η 2 Z 3 t 0 2 + 2 η Z 3 ( 4 η Δ t 1 ) t 0 + 16 η 2 k Δ t 3 4 η ( η Z 1 2 + 2 k ) Δ t 2 + ( 2 η Z 1 2 + k ) Δ t + 2 η Z 2 2 η Z 2 + Z 1 ( 4 η Δ t + 4 η t 0 1 ) 2 , Where Z 3 = 4 k Δ t X 2 . We have c n 1 = 2 η t s X + 2 η p v p v + 1 2 η and c n 1 < c n < t s + p v t s p v to ensure that the decision variables are positive and k < k 1 = 2 η ( t s p v t s + c n p v ) 2 Δ t 2 ( 4 η t s 1 ) to ensure that the profit is positive. The positivity or negativity of the above formula is related to f ( c n 2 ) = 4 η c n 2 4 η p v + p v 1 . We can obtain p v 1 from the vehicle demand function, and c n 1 < c n 2 = 4 η p v p v + 1 4 η < t s + p v t s p v . Then, when c n c n 2 , we have f ( c n 2 ) 0 , p r N Δ t 0 , p s N Δ t 0 , D n N Δ t 0 , D s N Δ t 0 ; otherwise, we have f ( c n 2 ) < 0 , p r N Δ t > 0 , p s N Δ t < 0 , D n N Δ t < 0 , D s N Δ t < 0 . For formula π n N Δ t , the molecule can be seen as f ( k 4 ) . we obtain k 4 = 2 η ( Δ t p v + p v t 0 Δ t + c n p v t 0 ) ( 2 η Δ t p v + 2 η p v t 0 2 η Δ t 2 η c n + 2 η p v 2 η t 0 p v + 1 ) Δ t ( 4 η Δ t + 4 η t 0 1 ) 2 . So k 4 k 1 = 2 η ( t s p v t s + c n p v ) ( ( t 0 p v t 0 p v ) ( 4 t s 1 ) + 2 η Δ t ( t s p v t s p v ) + ( 4 t 0 η + 6 η Δ t 1 ) c n ) Δ t 2 4 t s η 1 2 . The positivity or negativity of the above formula is related to f ( c n 3 ) = 2 η ( X t s + c n 3 p v ) ( ( t 0 p v t 0 p v ) ( 4 t s 1 ) + 2 η Δ t ( t s p v t s p v ) + ( 4 t 0 η + 6 η Δ t 1 ) c n 3 ) . When letting the formula f ( c n 3 ) with respect to c n 3 be zero, we obtain c n 3 = ( t 0 p v t 0 p v ) ( 4 t s η 1 ) + 2 η Δ t ( t s p v t s p v ) 4 t 0 η + 6 η Δ t 1 > 0 and c n 1 < c n 3 . So, if c n > c n 3 or c n < c n 3 and k < k 4 , π n N Δ t > 0 ; otherwise, π n N Δ t 0 .
The impact analysis of Δ t in the B case and the S case is similar; omitted.

Appendix C

From the N case, we have p r N p v = 2 η t s + 2 η 1 4 η t s 1 , p s N p v = t s 1 4 η t s 1 < 0 , D n N p v = 2 η ( t s 1 ) 4 η t s 1 < 0 , D s N p v = η ( t s 1 ) 4 η t s 1 < 0 , π n N p v = 2 η ( t s 1 ) ( t s p v t s + c n p v ) 4 η t s 1 < 0 . According to Corollary 1, we have η > p v 1 2 ( t s X Y ) > 1 4 t s to ensure that the parameter p r is positive. For formula p r N p v , its positivity or negativity is related to the molecule that can be seen as f ( η ) = ( 2 η t s + 2 η 1 ) . Then, letting f ( η ) with respect to η be zero, we obtain η = 1 ( 2 t s + 2 ) , and 1 ( 2 t s + 2 ) p v 1 2 ( t s X Y ) = 1 c n 2 ( t s X Y ) ( t s + 1 ) . So, when c n < 1 , p r N p v < 0 ; when c n > 1 , if η ( p v 1 2 ( t s X Y ) , 1 2 t s + 2 ) , p r N p v > 0 ; otherwise, p r N p v < 0 .
The impact analysis of p v in the B case and the S case is similar, omitted.

Appendix D

From Corollary 6, we obtain p r N p r B = η ( t s p v t s + c n p v ) 4 η t s 1 < 0 , p r N p r S = 8 η 2 t s ( t s p v t s + c n p v ) ( 4 η t s 1 ) ( 8 η t s 1 ) < 0 , p r B p r S = η ( t s p v t s + c n p v ) ( 4 η t s 1 ) ( 8 η t s 1 ) < 0 , p s N p s B = t s p v t s + c n p v 2 ( 4 η t s 1 ) > 0 , p s N p s S = 4 ( t s p v t s + c n p v ) η t s ( 4 η t s 1 ) ( 8 η t s 1 ) > 0 , p s B p s S = t s p v t s + c n p v 2 ( 4 η t s 1 ) ( 8 η t s 1 ) > 0 , D n N D n B = η ( t s p v t s + c n p v ) 4 η t s 1 > 0 , D n N D n S = 8 η 2 t s ( t s p v t s + c n p v ) ( 4 η t s 1 ) ( 8 η t s 1 ) > 0 , D n B D n S = η ( t s p v t s + c n p v ) ( 4 η t s 1 ) ( 8 η t s 1 ) > 0 , D s N D s B = η ( t s p v t s + c n p v ) 2 ( 4 η t s 1 ) > 0 , D s N D s S = 4 η 2 t s ( t s p v t s + c n p v ) ( 4 η t s 1 ) ( 8 η t s 1 ) > 0 , D s B D s S = η ( t s p v t s + c n p v ) 2 ( 4 η t s 1 ) ( 8 η t s 1 ) > 0 , π n N π n B = η Z 1 2 t s 2 + 2 η ( 2 k Δ t 2 Z 1 Z 2 ) t s η Z 2 2 k Δ t 2 2 ( 4 η t s 1 ) , π n N π n S = 4 η 2 Z 1 2 t s 3 + 8 η 2 ( 4 k Δ t 2 Z 1 Z 2 ) t s 2 4 η ( η Z 2 2 + 3 k Δ t 2 ) t s + k Δ t 2 ( 4 η t s 1 ) ( 8 η t s 1 ) , π n B π n S = η ( 32 η k Δ t 2 Z 1 2 ) t s 2 2 η ( 6 k Δ t 2 + Z 1 Z 2 ) t s η Z 2 2 + k Δ t 2 2 ( 4 η t s 1 ) ( 8 η t s 1 ) , π b B π b S = η ( t s p v t s + c n p v ) 2 4 ( 4 η t s 1 ) ( 8 η t s 1 ) 2 , π T N π T B = η ( t s p v t s + c n p v ) 2 4 ( 4 η t s 1 ) , π T N π T S = 32 η 3 Z 1 2 t s 4 + 64 η 3 ( 4 k Δ t 2 Z 1 Z 2 ) t s 3 32 η 2 ( η Z 2 2 + 4 k Δ t 2 ) t s 2 + k Δ t 2 ( 20 η t s 1 ) 2 ( 4 η t s 1 ) ( 8 η t s 1 ) 2 , π T B π T S = 16 η 2 ( 32 η k Δ t 2 Z 1 2 ) t s 3 η ( 256 η k Δ t 2 + Z 1 ( 32 η Z 2 Z 1 ) ) t s 2 2 η ( 8 η Z 2 2 20 k Δ t 2 Z 1 Z 2 ) t s + η Z 2 2 2 k Δ t 2 4 ( 4 η t s 1 ) ( 8 η t s 1 ) 2 .
We can obtain p r N < p r B < p r S , p s S < p s B < p s N , D s S < D s B < D s N , D n S < D n B < D n N .
For formula π n N π n B , its positivity or negativity is related to the molecule that can be seen as f ( k 9 ) = ( 4 η Δ t 2 t s Δ t 2 ) k 9 + η ( t s p v t s + c n p v ) 2 . When letting the formula f ( k 9 ) with respect to k 9 be zero, we obtain k 9 = η t s X + Y 2 Δ t 2 4 η t s 1 . In addition, we can obtain k 9 k 1 = η t s X + Y 2 Δ t 2 4 η t s 1 < 0 . So, when k 1 > k > k 9 , π n N < π n B ; k k 9 , π n N π n B .
The analysis of the remaining formulas are similar; omitted.

References

  1. People’s Daily. Our Country’s Auto Exports Will Exceed 3 Million in 2022, and Its Production and Sales Will Rank First in the World for 14 Consecutive Years-Taking Advantage of the Momentum, the Auto Industry Is Full of Horsepower. Available online: https://www.gov.cn/xinwen/2023-01/17/content_5737416.htm (accessed on 9 July 2023).
  2. People’s Daily. In the First 10 Months, the Production and Sales of New Energy Vehicles Exceeded 5 Million, and Exports Continued to Grow at a High Rate. Available online: https://www.gov.cn/xinwen/2022-11/15/content_5727006.htm (accessed on 9 July 2023).
  3. Letmathe, P.; Suares, M. A consumer-oriented total cost of ownership model for different vehicle types in Germany. Transport. Res. Part D Transport. Environ. 2017, 57, 314–335. [Google Scholar] [CrossRef]
  4. Hu, X.; Yang, Z.; Sun, J.; Zhang, Y. Optimal pricing strategy for electric vehicle battery swapping: Pay-per-swap or subscription? Transp. Res. Part E Logist. Transp. Rev. 2023, 171, 103030. [Google Scholar] [CrossRef]
  5. Yang, S.; Yao, J.; Kang, T.; Zhu, X. Dynamic operation model of the battery swapping station for EV (electric vehicle) in electricity market. Energy 2014, 65, 544–549. [Google Scholar] [CrossRef]
  6. Zhang, X.; Rao, R. A benefit analysis of electric vehicle battery swapping and leasing modes in China. Emerg. Mark. Financ. Trade 2016, 52, 1414–1426. [Google Scholar] [CrossRef]
  7. Lim, M.K.; Mak, H.-Y.; Rong, Y. Toward mass adoption of electric vehicles: Impact of the range and resale anxieties. MSOM Manuf. Serv. Oper. Manag. 2015, 17, 101–119. [Google Scholar] [CrossRef]
  8. Huang, Y.; Qian, L.; Soopramanien, D.; Tyfield, D. Buy, lease, or share? Consumer preferences for innovative business models in the market for electric vehicles. Technol. Forecast. Soc. Chang. 2021, 166, 120639. [Google Scholar] [CrossRef]
  9. Lidicker, J.; Lipman, T.; Williams, B. Business model for subscription service for electric vehicles including battery swapping, for San Francisco Bay Area, California. Transp. Res. Rec. 2011, 2252, 83–90. [Google Scholar] [CrossRef]
  10. Liang, Y.; Cai, H.; Zou, G. Configuration and system operation for battery swapping stations in Beijing. Energy 2021, 214, 118883. [Google Scholar] [CrossRef]
  11. Yang, J.; Guo, F.; Zhang, M. Optimal planning of swapping/charging station network with customer satisfaction. Transp. Res. Part E Logist. Transp. Rev. 2017, 103, 174–197. [Google Scholar] [CrossRef]
  12. Rao, R.; Zhang, X.; Xie, J.; Ju, L. Optimizing electric vehicle users’ charging behavior in battery swapping mode. Appl. Energy 2015, 155, 547–559. [Google Scholar] [CrossRef]
  13. Williams, B. Second life for plug-in vehicle batteries effect of grid energy storage value on battery lease payments. Transp. Res. Rec. 2012, 2287, 64–71. [Google Scholar] [CrossRef] [Green Version]
  14. Li, Z.; Ouyang, M. A win-win marginal rent analysis for operator and consumer under battery leasing mode in China electric vehicle market. Energy Policy 2011, 39, 3222–3237. [Google Scholar] [CrossRef]
  15. Li, K.; Zhou, T.; Liu, B. The comparison between selling and leasing for new and remanufactured products with quality level in the electric vehicle industry. J. Ind. Manag. Optim. 2021, 17, 1505–1529. [Google Scholar] [CrossRef] [Green Version]
  16. Vallera, A.M.; Nunes, P.M.; Brito, M.C. Why we need battery swapping technology. Energy Policy 2021, 157, 112481. [Google Scholar] [CrossRef]
  17. Zhu, F.; Li, L.; Li, Y.; Li, K.; Lu, L.; Han, X.; Du, J.; Ouyang, M. Does the battery swapping energy supply mode have better economic potential for electric heavy-duty trucks? Etransportation 2023, 15, 100215. [Google Scholar] [CrossRef]
  18. Patyal, V.S.; Kumar, R.; Kushwah, S. Modeling barriers to the adoption of electric vehicles: An Indian perspective. Energy 2021, 237, 121554. [Google Scholar] [CrossRef]
  19. Liang, Y.; Zhang, X. Battery swap pricing and charging strategy for electric taxis in China. Energy 2018, 147, 561–577. [Google Scholar] [CrossRef]
  20. Yang, Z.J.; Lei, Q.L.; Sun, J.; Hu, X.; Zhang, Y.L. Strategizing battery swap service: Self-operation or authorization? Transp. Res. Part D Transp. Environ. 2022, 110, 103411. [Google Scholar] [CrossRef]
  21. Yang, Z.; Hu, X.; Sun, J.; Lei, Q.; Zhang, Y. Is it worth promoting battery swapping? A social welfare perspective on provider- and consumer-side incentives. J. Environ. Manag. 2023, 330, 117157. [Google Scholar] [CrossRef]
  22. Long, Y.; Xu, D.; Li, X. Channel coordination of battery supplier and battery swap station of micro-grid with uncertain rental demand. Soft Comput. 2019, 23, 9733–9745. [Google Scholar] [CrossRef]
  23. Wang, T.; Deng, S. Supply chain leading models of building charging stations: Leaders, subsidy policies, and cost sharing. Int. J. Sustain. Transp. 2021, 15, 958. [Google Scholar] [CrossRef]
  24. Yu, Y.; Zhou, D.; Zha, D.; Wang, Q. Joint optimization of charging facility investment and pricing in automobile retail supply chain and coordination. Comput. Ind. Eng. 2021, 156, 107296. [Google Scholar] [CrossRef]
  25. Rochet, J.-C.; Tirole, J. Platform competition in two-sided markets. J. Eur. Econ. Assoc. 2003, 1, 990–1029. [Google Scholar] [CrossRef] [Green Version]
  26. Yu, Z.; Li, S.; Tong, L. Market dynamics and indirect network effects in electric vehicle diffusion. Transp. Res. Part D Transp. Environ. 2016, 47, 336–356. [Google Scholar] [CrossRef] [Green Version]
  27. Jang, D.-C.; Kim, B.; Lee, S.-Y. A two-sided market platform analysis for the electric vehicle adoption: Firm strategies and policy design. Transp. Res. Part D-Transp. Environ. 2018, 62, 646–658. [Google Scholar] [CrossRef]
  28. Zhu, L.; Wang, P.; Zhang, Q. Indirect network effects in China’s electric vehicle diffusion under phasing out subsidies. Appl. Energy 2019, 251, 113350. [Google Scholar] [CrossRef]
  29. Yoo, S.H.; Choi, T.Y.; Sheu, J.-B. Electric vehicles and product-service platforms: Now and in future. Transp. Res. Part E Logist. Transp. Rev. 2021, 149, 102300. [Google Scholar] [CrossRef]
  30. Avci, B.; Girotra, K.; Netessine, S. Electric Vehicles with a Battery Switching Station: Adoption and Environmental Impact. Manag. Sci. 2015, 61, 772–794. [Google Scholar] [CrossRef] [Green Version]
  31. Sun, H.; Yang, J.; Yang, C. A robust optimization approach to multi-interval location-inventory and recharging planning for electric vehicles. Omega-Int. J. Manag. Sci. 2019, 86, 59–75. [Google Scholar] [CrossRef]
Figure 1. Supply chain structure.
Mathematics 11 03119 g001
Figure 2. (a) The impact of Δ t on the vehicle manufacturer profit. (b) The impact of Δ t on the battery asset company profit. (c) The impact of Δ t on the supply chain profit.
Mathematics 11 03119 g002
Figure 3. (a) The impact of p v on the vehicle manufacturer profit. (b) The impact of p v on the battery asset company profit. (c) The impact of p v on the supply chain profit.
Mathematics 11 03119 g003
Figure 4. (a) The impact of η on the vehicle manufacturer profit. (b) The impact of η on the battery asset company profit. (c) The impact of η on the supply chain profit.
Mathematics 11 03119 g004
Table 1. The difference between this work and the related literature.
LiteratureBattery Leasing
Service
NEV Energy Supplement MethodStrategy
Selection
Battery
Maintenance
Battery Swapping
Service
Charging
Williams [13]
Li et al. [15]
Hu et al. [4]
Zhu et al. [17]
Yang et al. [21]
Yoo et al. [29]
This work
Table 2. Notations.
Table 2. Notations.
ParametersDefinitionUnit
D n Demand for battery swapping vehicle and battery leasing serviceunit
D s Demand for battery swapping serviceunit
η Price sensitivity coefficient of battery swapping service——
k Battery leasing increasing time cost coefficientyuan/year2
t s Battery leasing timeyear
t 0 Basic (no maintenance) leasing time of batteryyear
Δ t Increased leasing time after maintenanceyear
p v Battery swapping vehicle body priceyuan/unit
c s Battery maintenance costyuan/unit
c n Vehicle production costyuan/unit
π n Vehicle manufacturer profityuan
π b Battery asset company profityuan
π T Supply chain profityuan
Decision variables
p b Battery priceyuan/unit
p r Battery leasing service priceyuan/unit
p s Battery swapping service priceyuan/unit
Disclaimer/Publisher’s Note: The statements, opinions and data contained in all publications are solely those of the individual author(s) and contributor(s) and not of MDPI and/or the editor(s). MDPI and/or the editor(s) disclaim responsibility for any injury to people or property resulting from any ideas, methods, instructions or products referred to in the content.

