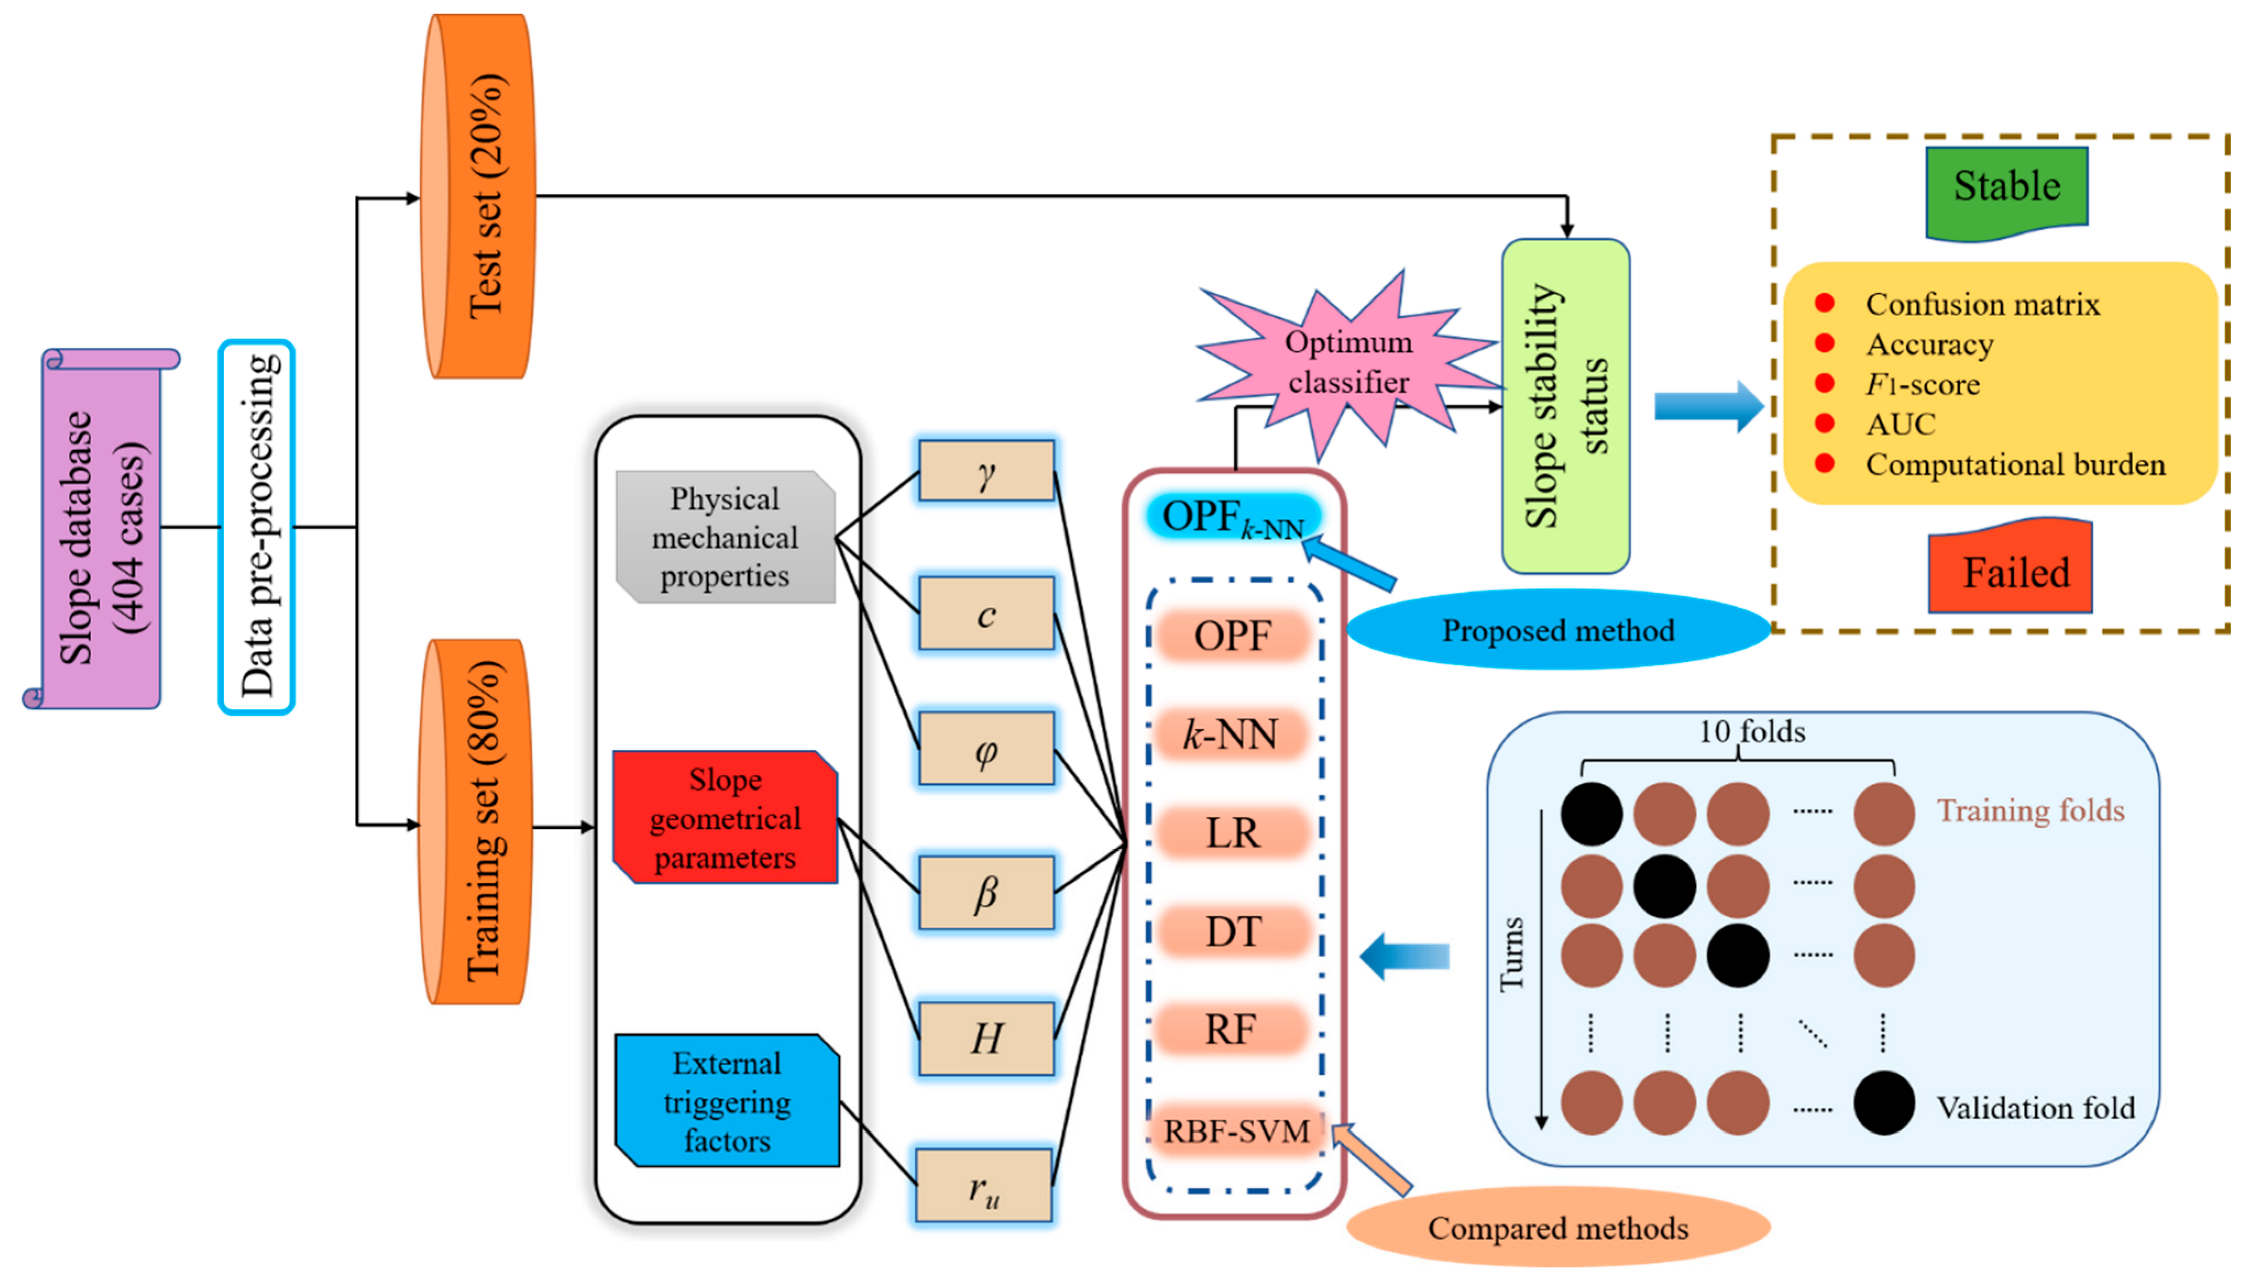
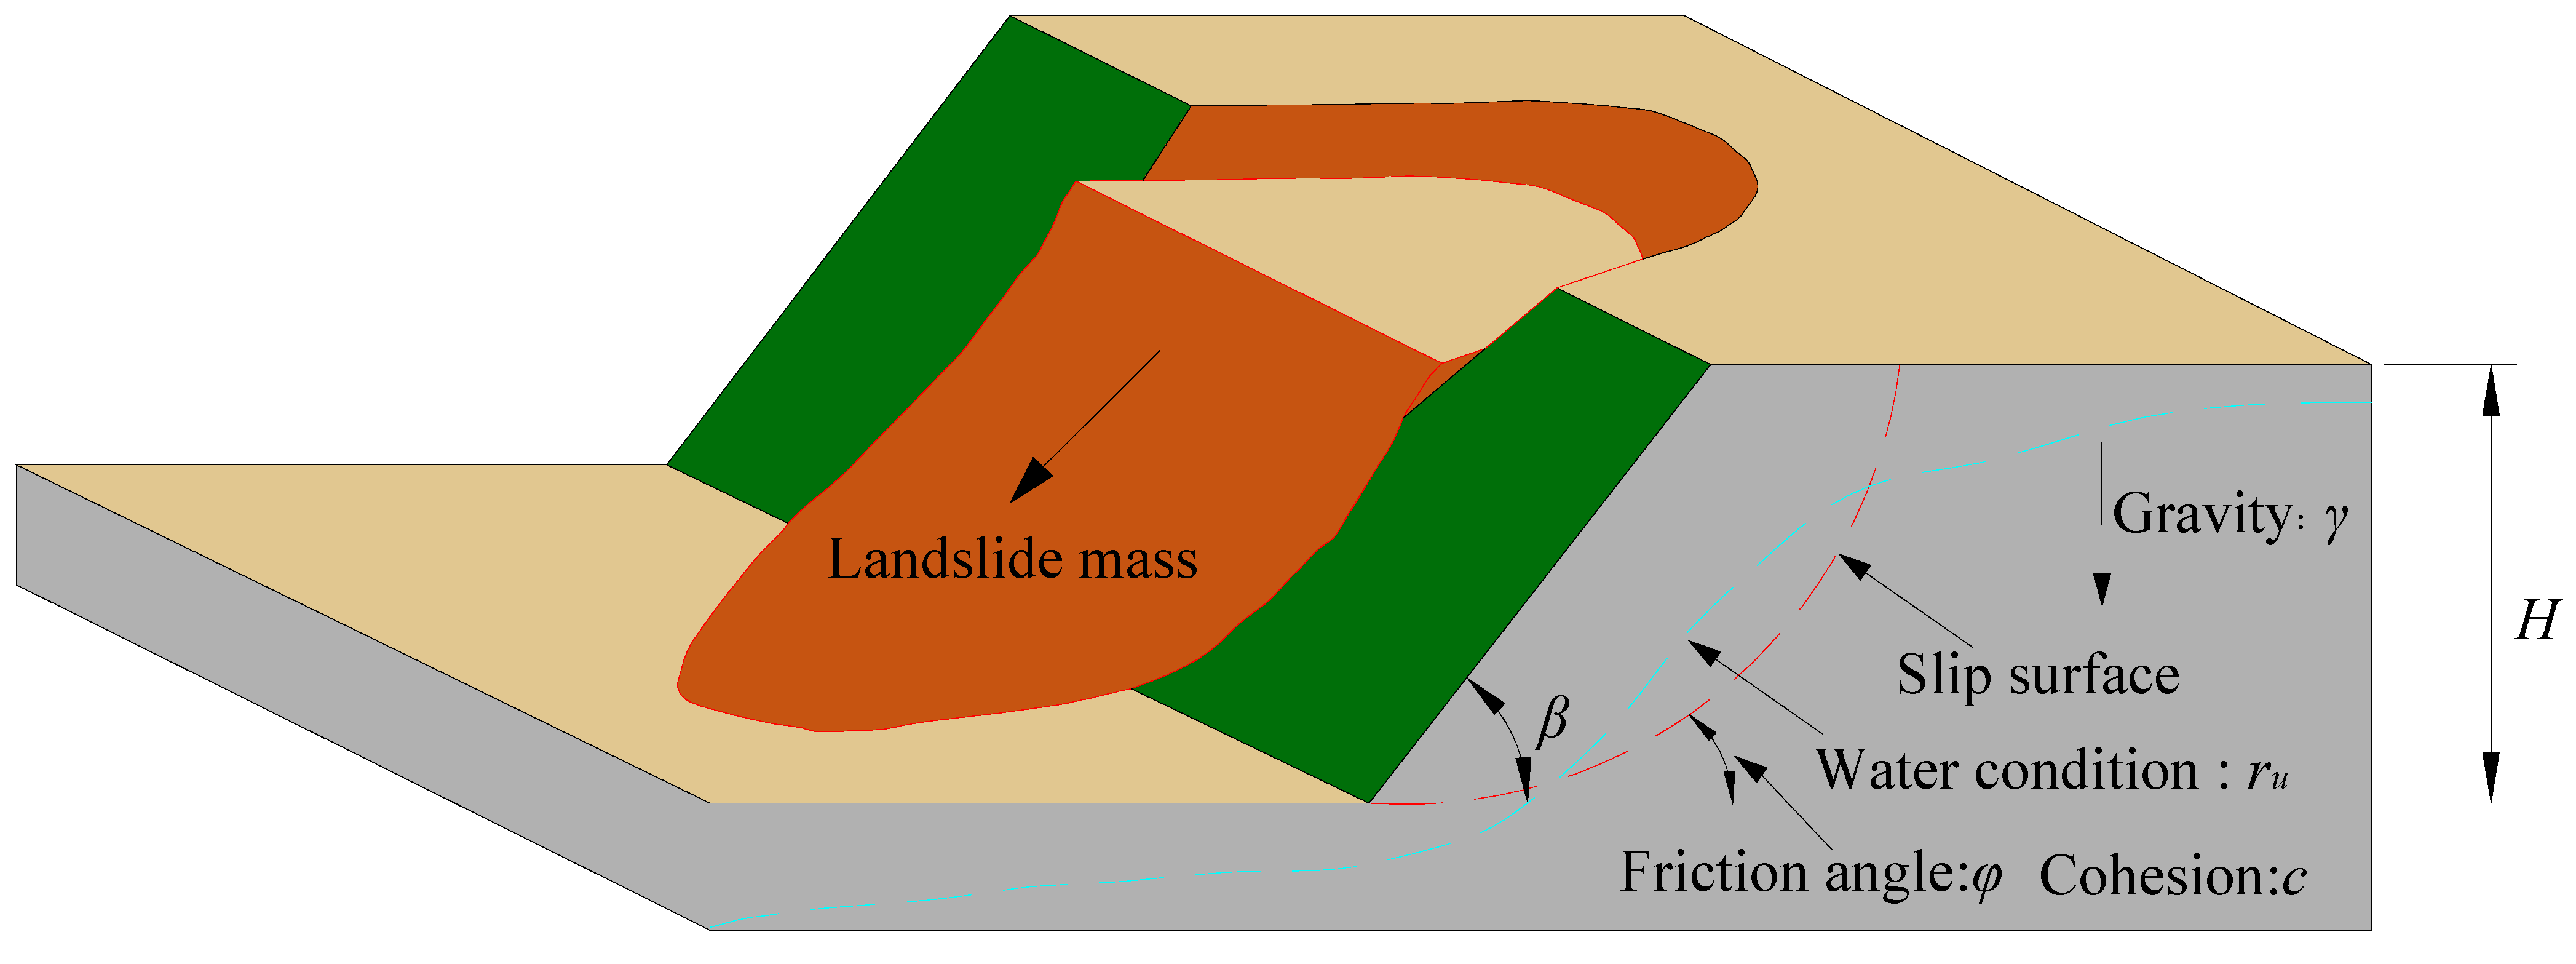
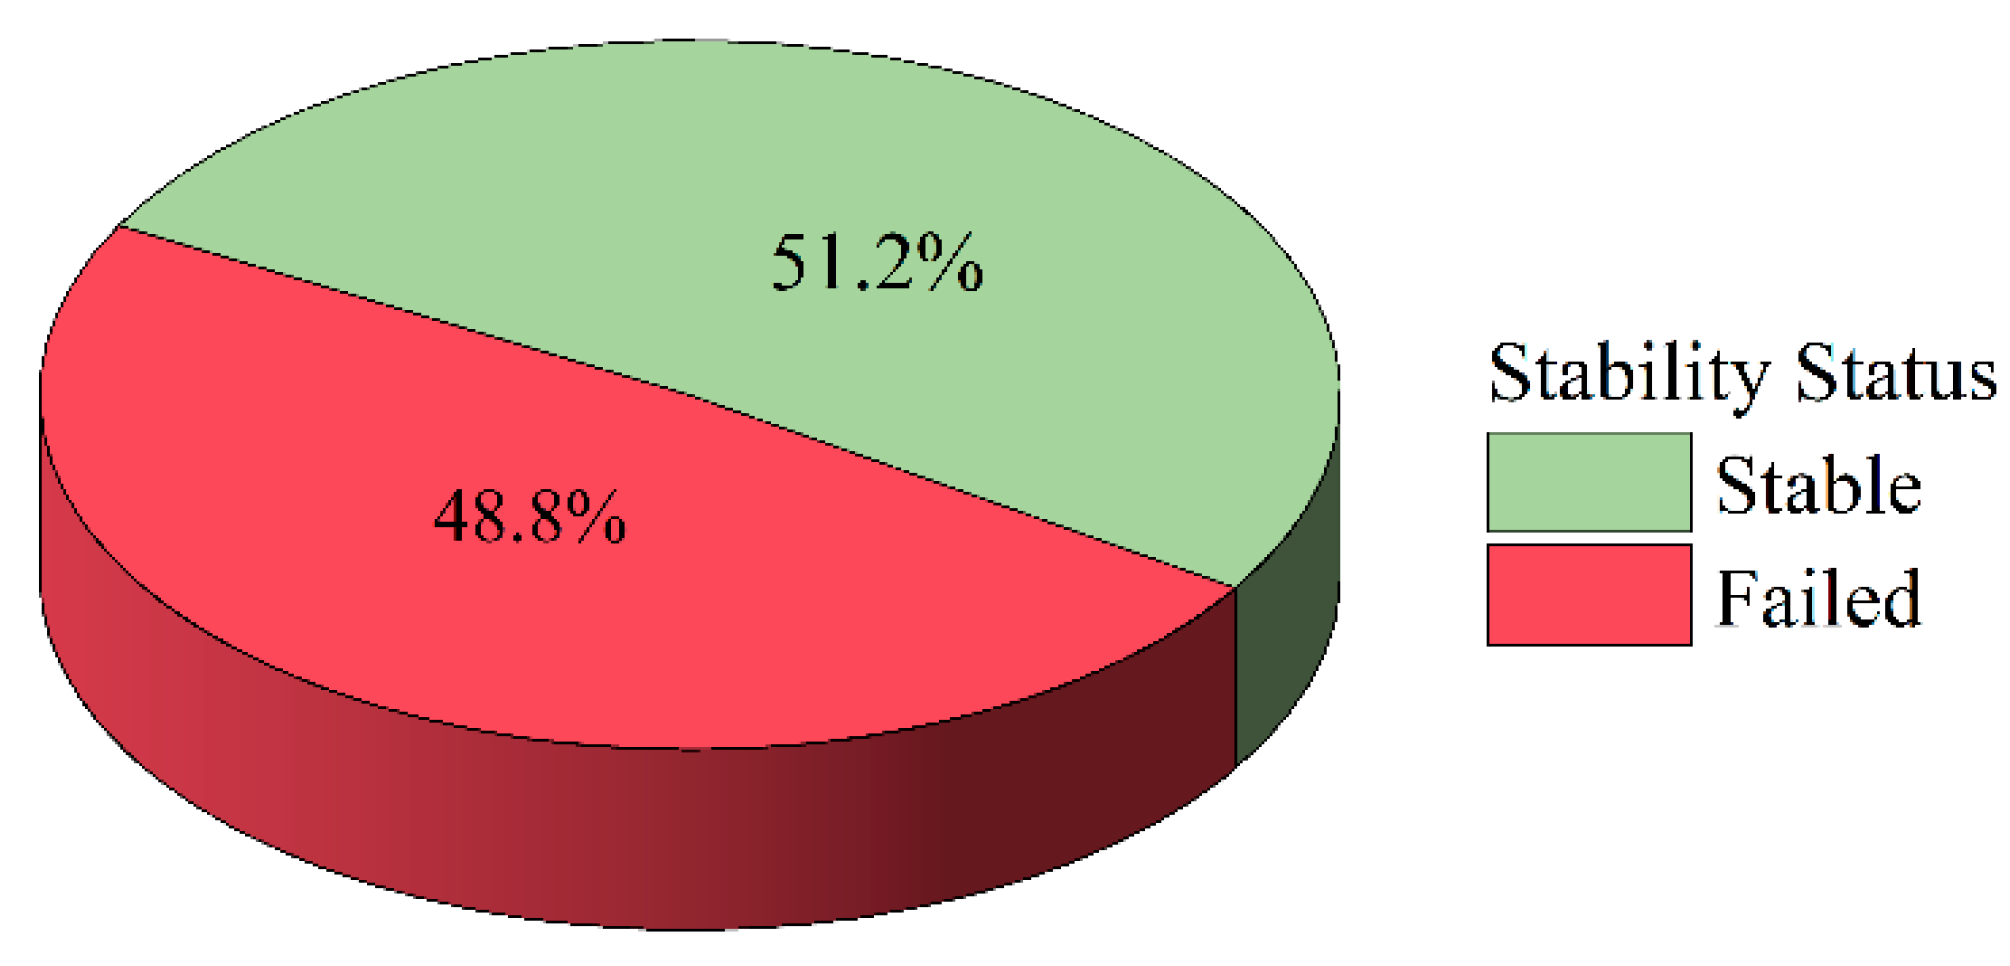
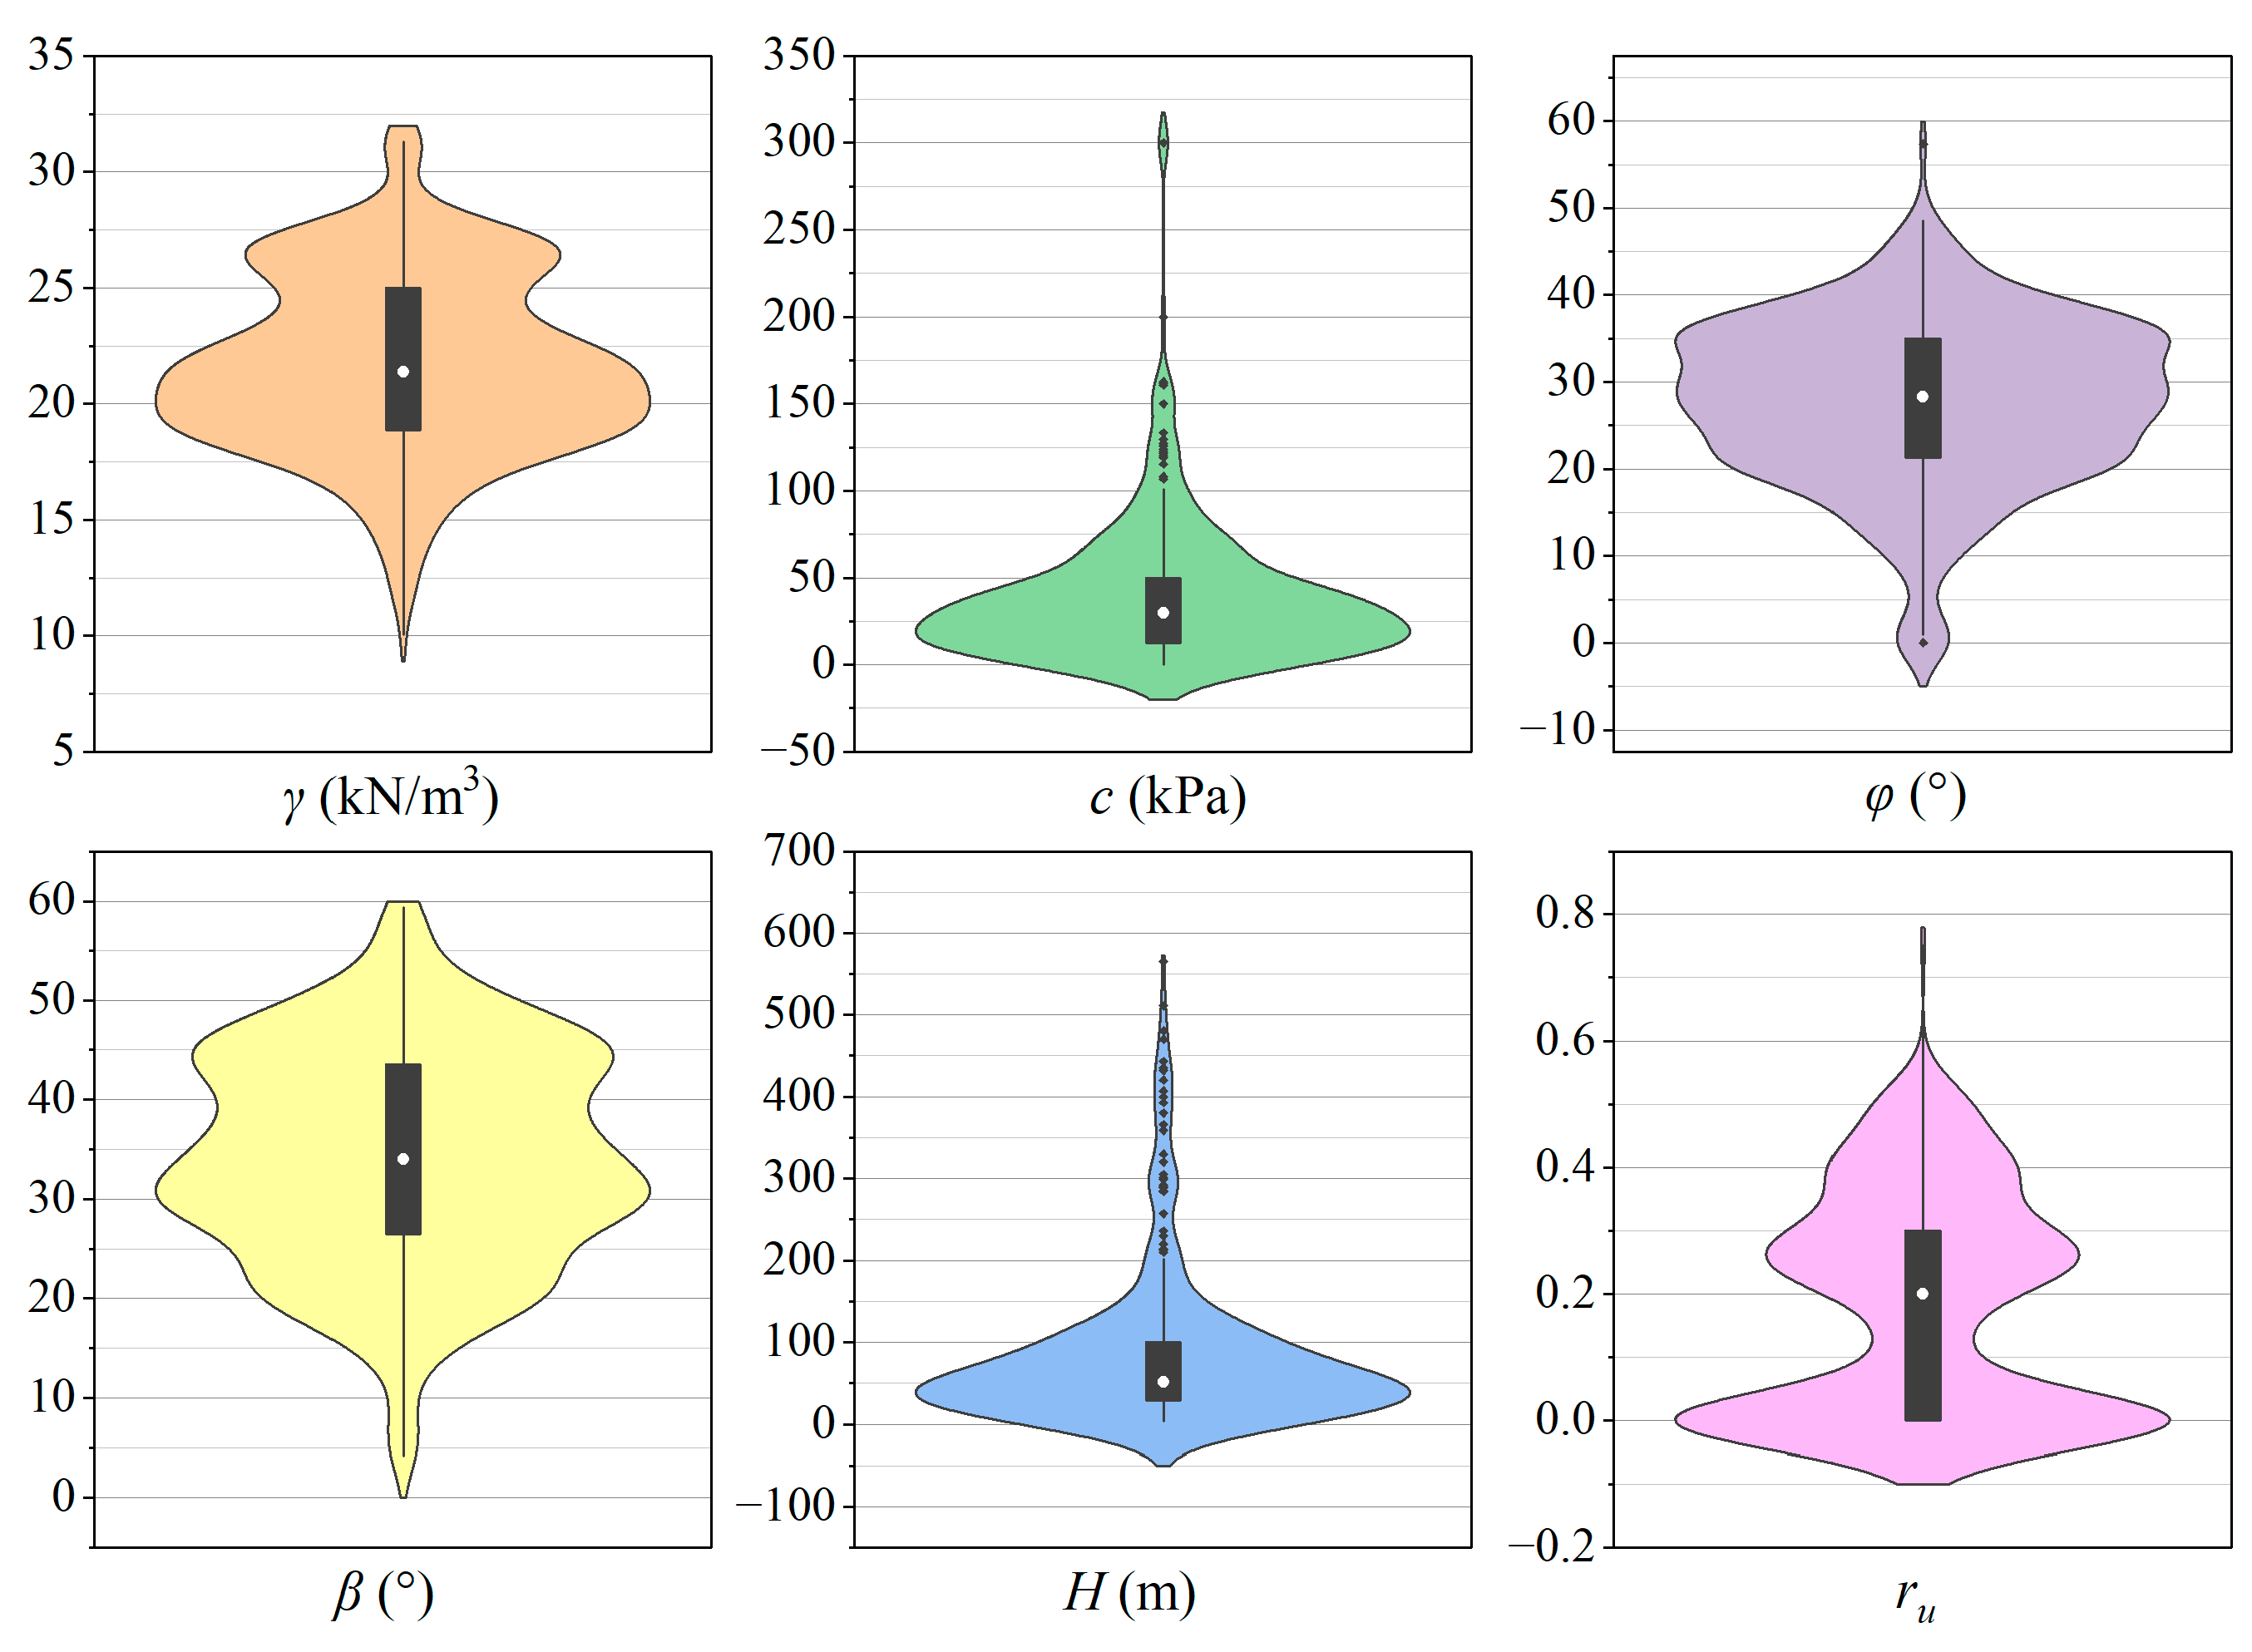
Article

Slope Stability Prediction Using k-NN-Based Optimum-Path Forest Approach

School of Resources and Safety Engineering, Central South University, Changsha 410083, China
*
Author to whom correspondence should be addressed.
Mathematics 2023, 11(14), 3071; https://doi.org/10.3390/math11143071
Submission received: 15 June 2023 / Revised: 10 July 2023 / Accepted: 10 July 2023 / Published: 12 July 2023

Abstract

:
Slope instability can lead to catastrophic consequences. However, predicting slope stability effectively is still challenging because of the complex mechanisms and multiple influencing factors. In recent years, machine learning (ML) has received great attention in slope stability prediction due to its strong nonlinear prediction ability. In this study, an optimum-path forest algorithm based on k-nearest neighbor (OPFk-NN) was used to predict the stability of slopes. First, 404 historical slopes with failure risk were collected. Subsequently, the dataset was used to train and test the algorithm based on randomly divided training and test sets, respectively. The hyperparameter values were tuned by combining ten-fold cross-validation and grid search methods. Finally, the performance of the proposed approach was evaluated based on accuracy, F1-score, area under the curve (AUC), and computational burden. In addition, the prediction results were compared with the other six ML algorithms. The results showed that the OPFk-NN algorithm had a better performance, and the values of accuracy, F1-score, AUC, and computational burden were 0.901, 0.902, 0.901, and 0.957 s, respectively. Moreover, the failed slope cases can be accurately identified, which is highly critical in slope stability prediction. The slope angle had the most important influence on prediction results. Furthermore, the engineering application results showed that the overall predictive performance of the OPFk-NN model was consistent with the factor of safety value of engineering slopes. This study can provide valuable guidance for slope stability analysis and risk management.

1. Introduction

Slope instability is a global geological problem, which is one of the three major geological problems in nature besides earthquakes and volcanoes. Many geotechnical projects, such as open-pit mining, mountain roads, tailings dams, and landfills, are seriously threatened by slope instability. A serious slope instability disaster can cause casualties, building damages, and huge economic losses. For example, on 20 December 2015, a catastrophic landslide occurred at the Hong’ao landfill in Shenzhen, China, resulting in 77 deaths, 33 buildings buried, and direct economic losses of more than 880 million RMB [1]. On the evening of 11 March 2017, a landslide at the Koshe landfill in Ethiopia’s capital, Yah, caused 113 deaths and more than 80 people missing [2]. Due to heavy rainfall on 18 October 2020, a landslide occurred in Vietnam’s Quang Tri province, claiming the lives of 22 soldiers [3]. Because of its serious consequences, predicting the risk of slope instability is crucial and plays a significant role in disaster prevention.
The prediction methods of slope stability can be classified into four categories. The first one is instrumental monitoring technology. Currently, many on-site monitoring techniques of slope deformation have been applied to monitor the early warning signs of slope instability. For example, Zhang et al. [4] used distributed fiber optic strain sensors to monitor the shear displacement in the Three Gorges Reservoir region in China, and two potential circular sliding surfaces were successfully identified. Dixon et al. [5], Shiotani [6], and Codeglia et al. [7] adopted the acoustic emissions (AE) technology to monitor the signals generated by the fracture of soil and rock materials in the slope. By analyzing the relationship between AE characteristics and slope deformation, AE-based criteria were used to evaluate the long-term stability of slopes. In addition, some other techniques, such as remote sensing [8], terrestrial laser scanning [9], synthetic aperture radar [10], and time domain reflectometry [11], were applied to slope stability monitoring. These technologies have relatively high prediction accuracy because the precursor information of slope instability can be obtained directly, but the installation process is complicated, and the cost is high.
The second one is the theoretical analysis method. It is proposed from the view of mechanical mechanisms. Many theoretical and analytical approaches have been used to analyze slope stability, such as the limit equilibrium method (LEM) [12], the strength reduction method (SRM) [13], and the limit analysis method [14]. The factor of safety (FOS), calculated by the ratio of resisting force to driving force, is used to evaluate the stability of the slope. When the value of FOS is larger than 1, the slope is stable; otherwise, it is unstable [15]. Faramarzi et al. [16] employed LEM to calculate the FOS and analyzed the rock slope stability of the Chamshir dam pit. Liu [17] adopted the SRM to obtain the FOS of the established slope model. Mbarka et al. [18] combined the Monte Carlo approach, LEM, and SRM for the reliability analysis of homogeneous slopes with circular-type failure. Although the theoretical and analytical methods are simple, they are unsuitable for slopes with complex conditions due to the simplified formulas and assumptions.
The third one is the numerical simulation technique. With the rapid development of numerical simulation methods, finite element method (FEM) [19], boundary element method [20], discrete element method [21], numerical manifold method [22], and other methods have been widely used in slope stability analysis. Sun et al. [23] simulate the progressive failure process of jointed rock slopes based on the combined finite-discrete element method. Ma et al. [24] analyzed the slope stability under a complex stress state with saturated and unsaturated seepage using the fast Lagrangian analysis of continua. Wei et al. [25] investigated the kinetic features of slope instability based on particle flow code. Haghnejad et al. [26] analyzed the effect of blast-induced vibration on slope stability using dynamic pressure in three dimensions distinct element codes. Song et al. [27] adopted an improved smoothed-particle hydrodynamics method to calculate the slope safety factor. Zhang et al. [28] adopted a realistic failure process analysis to evaluate the stability and investigated the failure mode of the high rock slope during excavations. In addition, some researchers have integrated numerical simulation and mathematical methods to analyze the slope stability. For example, Dyson and Tolooiyan [29] adopted FEM and Monte Carlo to determine the FOS and damage probability of slopes. Although the numerical simulation methods are convenient to operate, the accuracy strongly depends on constitutive models and mechanical parameters [30].
The fourth one is the machine learning (ML) algorithm. With the accumulation of slope cases, some researchers attempted to develop slope stability prediction models using ML algorithms. There are two types of predicted outputs: FOS and stability status. Lu and Rosenbaum [31] adopted an artificial neural network to estimate the FOS and SS on 46 slope cases collected by Sah et al. [32]. Based on the same database, Samui [33] and Yang et al. [34] used a support vector machine (SVM) and genetic programming to determine FOS, respectively. Amirkiyaei and Ghasemi [35] constructed two tree-based models to assess circular-type failure slopes based on 87 cases. Zhou et al. [36] collected 221 slope cases and employed the gradient-boosting machine to predict the SS. Wang et al. [37] hybridized a genetic algorithm with a multi-layer perceptron to predict FOS using 630 cases. In addition, several researchers performed a comparative analysis of multiple ML algorithms. Hoang and Tien Bui [38] carried out a comparative study of SS prediction using a radial basis function neural network, an extreme learning machine, and least squares SVM. Mahmoodzadeh et al. [39] adopted Gaussian process regression, support vector regression, decision trees (DT), long-short-term memory, deep neural networks, and k-nearest neighbors (k-NN) to determine FOS. All the above ML algorithms performed well on slope stability prediction. However, a large number of slope stability cases are required to improve its credibility.
Compared with other approaches, ML algorithms can obtain reliable prediction results by establishing the nonlinear relationship between input and output. It is a promising method for predicting slope stability. But to date, there is no one ML algorithm that can be applied to all slope engineering conditions under the consensus of the geotechnical industry. Accordingly, it is meaningful to investigate more robust ML algorithms to achieve better prediction results. Recently, the optimum-path forest (OPF) algorithm has been successfully applied in many fields, such as face recognition [40], Parkinson’s disease identification [41], laryngeal cancer pathology detection [42], land use classification [43], and network intrusion detection [44]. However, the OPF algorithm is susceptible to outliers. In response to this deficiency, Papa et al. [45] proposed the OPF algorithm based on k-NN (OPFk-NN), and the discriminative performance of the OPF model was improved. In combination with the k-NN algorithm, the OPFk-NN algorithm can provide better performance for classification tasks by leveraging the topological properties of the data [46]. Compared to other classification algorithms, the OPFk-NN algorithm has several advantages, including (1) it is free of hyperparameters, (2) it does not assume separability of the feature space, (3) it has a unique feature selection and classification mechanism that can effectively handle the high-dimensional and nonlinear data with outliers, (4) and its training step is usually much faster than traditional ML approaches.
Considering that the OPFk-NN has great predictive performance and has not yet been employed to predict the stability of slopes, this study aims to investigate the feasibility of OPFk-NN for predicting slope stability. In addition, a comparison against OPF, radial basis function support vector machine (RBF-SVM), random forest (RF), DT, k-NN, and logistic regression (LR) classifiers is performed.

2. Methodology

2.1. k-NN Based OPF Classifier

The OPF is a graph-based classifier [47,48]. Its classification principle is to denote the training samples as nodes and connect them by path. Then, the optimal path tree (OPT) is constructed by executing the shortest path algorithm on the graph. Finally, the test sample is mapped onto the OPT, and its class is determined. Figure 1 shows the schematic diagram of the OPF-based classifiers. The nodes with different colors in the set S represent different classes, and the nodes outside the set S are the samples to be classified. A series of adjacent nodes are defined as path π. Among all paths, the one with the maximum path-cost function f(πt) is called OPT, and all OPTs constitute OPF. There are three different classes in Figure 1; the blue sample s is the root node of the OPT where sample t is located, so sample t is classified as blue.
The OPFk-NN is a variant of the OPF algorithm, and the main difference between them is the adjacency of the samples in the training set. The latter is to construct a complete graph, while the former is to construct a k-NN graph [45]. The OPFk-NN algorithm is divided into training and classification phases.

2.1.1. Training Phase

The first step is to construct a k-NN graph Gk based on the training set Z1. The sample s is weighed by a probability density function ρ(s):
ρ ( s ) = 1 2 π σ 2 | G k ( s ) | t G k ( s ) exp ( d 2 ( s , t ) 2 σ 2 ) ,
where σ = d f 3 , df is the maximum arc weight in Gk, and d(s, t) is the distance between sample s and sample t.
The second step is to calculate the path cost function fmin, which is defined as:
f min ( t ) = { ρ ( t ) if   t S ρ ( t ) 1 otherwise f min ( π s s , t ) = min { f min ( π s ) , ρ ( t ) } ,
According to the method proposed by Papa et al. [50], the k value of k-NN is determined by maximizing the accuracy of the training set in the range [1, kmax]. The value of kmax defaults to 5. After determining the value of k, the algorithm is applied to retrain the classifier. The function fmin is replaced by f min , which is defined as:
f min ( t ) = { ρ ( t ) if   t S ρ ( t ) 1 otherwise f min ( π s s , t ) = { if   λ ( t ) λ ( s ) min { f min ( π s ) , ρ ( t ) }   otherwise .
Figure 2 is the schematic diagram of the training phase, where Figure 2a indicates the k-NN graph generated from the training set, Figure 2b represents the minimum spanning tree calculated by the k-NN graph, Figure 2c denotes the two samples of different colors labeled as prototype samples (marked by black dashed circles), and Figure 2d signifies the OPFk-NN classifier composed by all the OPTs. The red squares and green circles represent different classes, respectively.

2.1.2. Classification Phase

After training the OPFk-NN classifier, the sample t in the test set Z2 is classified. The k-NN is first calculated from Z1 to a testing sample t. Then, it is verified which sample sZ1 satisfies the equation below:
V ( t ) = max { min [ V ( s ) , ρ ( t ) ] } s Z 1
Figure 3 indicates the classification process of OPFk-NN. The blue triangle is the sample to be classified. Figure 3a shows that the blue triangle is connected to the k-nearest training samples in the generated OPF, and Figure 3b illustrates that the triangle is conquered by the samples of the red squares class and labeled as red.

2.2. Proposed Approach

Figure 4 depicts the flowchart of the proposed approach. First, due to the different units of indicators and the diversity of data distribution, the raw data is pre-processed. The dataset is standardized using a Gaussian distribution with zero mean and unit standard deviation. Subsequently, 80% of samples are used for training, and the remaining 20% are adopted for testing [51,52]. For the k-NN, RBF-SVM, RF, DT, and LR algorithms, the grid search and ten-fold cross-validation (CV) methods are used to select the optimal hyperparameters. Finally, the test set is predicted, and the optimal classifier is determined according to the evaluation metrics.
The OPFk-NN and OPF are implemented based on the Python library “opfython” [53], and the k-NN, RBF-SVM, RF, DT, and LR are conducted on the Python library “scikit-learn” [54]. All experiments are conducted using a Windows1064 bits computer with 8Gb of RAM running an Intel® Core™ i7-9700F CPU @ 3.00 GHz × 2.
If the predictive performance of our proposed approach is acceptable, it can be used for engineering applications in several ways. For example, it can be integrated into slope monitoring systems to provide real-time alerts for potential instability. The model can also be used to evaluate slope stability during the design phase of construction projects to ensure the safety and stability of the slope. Additionally, the model can be applied to slope stability analysis and risk management, which can be used by geotechnical engineers in various projects related to slope instability.

2.3. Performance Evaluation Metrics

In this study, several metrics are used to evaluate the performance of classifiers and figure out the optimal classifier for slope stability prediction [30,55].
A confusion matrix, which can also be called a likelihood table or error matrix, is used to visually represent whether the performance is ideal or not. Table 1 shows the confusion matrix for the slope-stability prediction, where true positive (TP) means the number of stable cases predicted correctly, false positive (FP) means the number of stable cases predicted incorrectly, true negative (TN) means the number of failed cases predicted correctly, and false negative (FN) means the number of failed cases predicted incorrectly. According to Table 1, true negative rate (TN/(TN + FP)) and false positive rate (FP/(FP + TN)) can be defined.
Accuracy indicates the ratio of the cases correctly predicted to the total cases, which can be calculated by: accuracy = (TP + TN)/(TP + TN + FP + FN).
F1-score indicates the harmonic mean of precision and recall, which can be calculated by: F1-score = 2precision · recall/(precision + recall), where precision = TP/(TP + FP), recall = TP/(TP + FN).
The area under the curve (AUC) is defined as the area under the receiver operating characteristic (ROC) curve, which is commonly used to evaluate the performance of classifiers. Bradley [56] proposed classification criteria of AUC as follows: not discriminating (0.5–0.6), poor (0.6–0.7), fair (0.7–0.8), good (0.8–0.9), and excellent (0.9–1).
Computational burden is used to evaluate the computational efficiency of algorithms. The mean and standard deviation of computation time are used as the evaluation metrics in this study.

2.4. Hyperparameter Tuning

In general, the performance of most ML algorithms is highly dependent on the hyperparameters. There are several hyperparameter tuning methods, such as manual search, grid search, random search, Bayesian optimization, gradient-based optimization, and evolutionary optimization [57]. In this study, the grid search algorithm is combined with the k-fold CV method to select the optimal hyperparameters.
The grid search algorithm is to grid the hyperparameters in a fixed range in equal steps, compare all hyperparameter combinations exhaustively, and then select the optimal hyperparameters. To avoid the risk of overfitting or selection bias in the model, the k-fold CV method is used in the hyperparameter tuning process, illustrated in Figure 5. The original training set is randomly split into k folds, of which k − 1 folds are used as the training sub-set, and the remaining fold is used as the validation set in turn. Then, the average accuracy of k rounds is calculated to evaluate the performance and determine the optimal hyperparameters [58]. In this study, k was selected as 10 after considering the calculation time and variance [59].

3. Data Collection

3.1. Dataset Description

The failure surfaces of the slopes are prone to occur near the potential slip surface. Because of the excavation at the foot of the slope or water seepage at the top of the slope, the shear stress on the potential slip surface exceeds the shear strength, causing the local slope instability, as shown in Figure 6. A large number of engineering cases and theoretical analyses indicate that there are three main aspects that affect slope stability: the physical–mechanical properties of the potential slip surface, the basic geometrical parameters, and the external triggering factors. [12,18,60,61,62]. Considering the independent correlation between indicators and the easy availability of indicator values, six indicators were selected in this study, including the unit weight (γ), the cohesion (c), the internal friction angle (φ), the slope angle (β), the slope height (H), and the pore pressure ratio (ru). The detailed descriptions of these indicators are displayed in Table 2.
In this study, a database of 404 slopes with failure risk from various countries was collected (available in “Appendix A”) [32,36,57,63,64,65,66,67,68,69,70,71,72]. There are two statuses of slope stability: stable (207 cases) and failed (197 cases). Among them, most of the failed slopes were circular-type failures. The distribution of slope SS on the overall dataset is given in Figure 7, and the statistical values of data samples are illustrated in Table 3.

3.2. Dataset Analysis

The violin plots of six indicators are shown in Figure 8. They were a combination of box plots and density plots and indicated the overall distribution of the dataset. For each violin plot, the white dot in the center was the median of the samples, the top and bottom of the thick black line represented the third and first quartile of the samples, and the top and bottom of the thin black line indicated the upper and lower adjacent value. From Figure 8, it can be seen that the distribution of γ, φ, β was relatively balanced, and the medians were basically in the middle of the violin plots. While for c, H, ru, there were some individual outliers.
The heatmap of the Pearson correlation coefficient between each indicator is shown in Figure 9. According to Figure 9, all correlation coefficients were less than 0.5, and the highest correlation was only 0.41, which indicated that the correlation between indicators was poor. Therefore, all indicators were relatively independent and important for predicting slope stability.
To visualize the distribution of the dataset, the correlation pair plots of the two slope SS were displayed in Figure 10. The distribution plots of these six indicators were shown on the diagonal line, and the correlation scatter plots between indicators were shown on the non-diagonal line. It can be seen that the differences in the distribution of indicators for both slope statuses were slight, and there was no apparent correlation among the indicators. Therefore, it was difficult to classify the slope SS only using one indicator, and the effect of all indicators should be incorporated for better accuracy.

4. Results and Analysis

4.1. Results of Hyperparameters Tuning

The average accuracy of ten-fold CV corresponding to different hyperparameters for k-NN, LR, DT, RF, and RBF-SVM algorithms is shown in Figure 11. According to Figure 11, the overall performance can be observed. With the increase of hyperparameter values, the average accuracy of LR decreased, but the other models had several peaks. Compared with other models, the results of RF were more stable. Based on the best average accuracy of ten-fold CV, the optimal hyperparameter values were determined. The scope, interval, and final optimization results of hyperparameter values are indicated in Table 4.

4.2. Models Comparison and Evaluation

After the hyperparameters were tuned, these seven ML algorithms were used to predict slope stability based on the test set. The confusion matrix, accuracy, and F1-score were calculated to compare the performance of each algorithm, which were illustrated in Table 5. It can be observed that OPFk-NN performed best with the highest accuracy of 0.901, followed by OPF, RF, k-NN, RBF-SVM, and DT with an accuracy of 0.876, 0.827, 0.815, 0.802, and 0.765, respectively. LR performed worst with an accuracy of 0.679. Furthermore, the rank was the same when using the F1-score. Therefore, based on the overall prediction performance, the rank was OPFk-NN > OPF > RF > k-NN > RBF-SVM > DT > LR.
The ROC curves and AUC values of these seven classifiers are presented in Figure 12. It can be seen that the ROC curve of the OPFk-NN classifier was closer to the left and upper axes than others, indicating better performance. The AUC values of OPFk-NN, RBF-SVM, RF, OPF, k-NN, DT, and LR were 0.895, 0.885, 0.876, 0.870, 0.783, and 0.720, respectively. According to the AUC classification criterion mentioned in Section 2.3, only OPFk-NN performed excellently, RBF-SVM, RF, OPF, and k-NN performed well, while DT and LR performed fair.
The average computation time for each classifier during the training and testing phases over 20 runs was calculated, as listed in Table 6. The results were presented in the following format: x ± y, where x and y indicated the average time and standard deviation, respectively—noted that the values in bold indicated the minimum time consumed. It can be observed that the k-NN took the least time in the training phase, followed by LR, OPF, OPFk-NN, RBF-SVM, and RF. In the testing phase, the time consumed by each classifier was not significantly different, and the difference between the maximum and minimum values was less than 0.2 s. For the total time, the rank was k-NN > LR > OPF > OPFk-NN > DT > RBF-SVM > RF. The total computation time of the OPFk-NN classifier was less than 1 s.

4.3. Relative Importance of Indicators

The relative importance of indicators was significant for the design of support structures in slope engineering. In this study, the relative importance of each indicator was calculated by combining the OPFk-NN model with the permutation feature importance technique [73]. The permutation feature importance is a model inspection technique available in the Python library “scikit-learn” [54]. Values of indicators were shuffled in turn within the test set, the slope stability prediction results were generated by the OPFk-NN model, and the accuracy changes were recorded. Then, the prediction accuracy changes of indicators were ranked, and the relative importance was derived. As shown in Figure 13, the slope angle was the most important indicator with an importance value of 30.5%, followed by internal friction angle (22%), cohesion (19.7%), unit weight (12.3%), slope height (7.93%), and pore pressure ratio (7.63%).

5. Discussions

The prediction of failed cases is particularly important, which may lead to the development of slope instability if predicted incorrectly [74]. Therefore, the false positive rate and true negative rate were presented together in Figure 14. It can be seen that the false positive rate and true negative rate of RBF-SVM, k-NN, and RF were the same, and the OPFk-NN had the largest true negative rate and the lowest false positive rate. From this view, the OPFk-NN classifier performed better. The reason is that the OPFk-NN algorithm can effectively process high-dimensional and nonlinear slope data with outliers, improve the data quality of the model in the training phase, and predict the failed slope cases more accurately.
When the trade-off between AUC and the computational burden was considered, the OPFk-NN classifier was the most prominent because it demonstrated the optimal performance (AUC = 0.901) in less computation time (total time < 1 s) among the seven classifiers. It is worth noting that the OPFk-NN classifier was pretty much faster than RBF-SVM (86.2 times faster) and RF (123.1 times faster), although the difference in their performance was not significant. Therefore, the OPFk-NN classifier achieved the best trade-off between performance and efficiency.
According to the importance scores, all indicators were non-negligible for slope stability prediction. The physical–mechanical properties had the greatest influence on the slope stability (φ = 22%, c = 19.7%, γ = 12.3%), followed by the geometrical parameters (β = 30.5%, H = 7.93%). Some measures can be adopted to improve the slope stability from two directions. One is to optimize the slope geometry parameters, especially the slope angle. Another is to improve the physical–mechanical properties by using grouting-reinforcement techniques.
Although the OPFk-NN approach obtained excellent results in the slope stability prediction, there are also some limitations:
(1) More indicators should be considered. Although the six indicators in this study affect the slope stability significantly, other factors such as excavation, the properties of clay minerals, vegetation coverage, earthquake, and rainfall also have an effect on the slope stability. It is significant to analyze the influences of these indicators on the prediction results;
(2) The dataset is relatively small. The performance of ML algorithms greatly depends on the quantity and quality of data. Although the OPFk-NN algorithm performs well on this dataset, a better dataset might further improve the predictive performance. Therefore, it is necessary to build a larger slope database;
(3) Slopes are typically composed of multiple layers of various geotechnical materials whose properties and spatial distribution can significantly affect slope stability. As the number of slope failure cases increases, a comprehensive and diverse slope dataset should be expanded in future work. Such efforts are crucial for advancing the field of geotechnical engineering and ensuring the safety of human lives and infrastructure;
(4) The safety factor of slope stability can reflect the percentage of slope instability, and the slope stability analysis can be better considered a regression problem. Therefore, it is necessary to compile relevant data and develop relevant ML models for slope FOS value estimation in future work.

6. Engineering Application

In order to further verify the reliability of the proposed OPFk-NN model, it was necessary to apply it to evaluate the stability of engineering slopes. For this, eight typical slopes were collected from the Jing-xin expressway in Hebei Province, China, where landslides frequently occurred [75].
The FOS values of these eight slopes and the estimation results of the OPFk-NN model were recorded in Table 7. It can be seen that the overall prediction performance of the OPFk-NN model was consistent with the FOS values of the slopes.

7. Conclusions

Slope stability prediction is a crucial task in geotechnical engineering. This study investigated the performance of the OPFk-NN algorithm for the stability prediction of slopes. A total of 404 historical slope cases with failure risk from various countries were collected after considering the slope damage mechanism and geological conditions simultaneously. The OPFk-NN, OPF, RBF-SVM, RF, k-NN, DT, and LR were used to evaluate and compare the predictive performance. To avoid the risk of overfitting or selection bias, ten-fold CV and grid search methods were selected to tune the hyperparameters. Overall, the prediction results of the OPFk-NN algorithm were better and more reliable, and its prediction accuracy and F1-score were 0.901 and 0.902, respectively. According to the ROC curves and AUC values, the performance rank of the seven classifiers was OPFk-NN > RBF-SVM > RF > OPF > k-NN > DT > LR. In addition, the OPFk-NN achieved the highest TNR and the lowest FPR, which indicated that it could predict failed slope cases better. After considering the total calculation time, the OPFk-NN classifier achieved the optimal trade-off between performance and efficiency. Based on the importance scores of indicators, the slope angle was the most influential indicator on prediction results. Furthermore, the engineering application results showed that the overall predictive performance of the OPFk-NN model was consistent with the FOS value of engineering slopes.
In the future, more parameters such as excavation, the properties of clay minerals, geological formation, vegetation coverage, earthquake, and rainfall can be considered so that the feasibility of the OPFk-NN classifier can be further validated using more comprehensive and diverse slope datasets. In addition, the proposed methodology can be recommended for the application of other mining and geotechnical engineering projects, such as rockburst risk prediction and pillar stability prediction.

Author Contributions

Conceptualization, L.L.; methodology, L.L.; software, L.L.; validation, W.L. and G.Z.; formal analysis, L.L.; investigation, L.L.; resources, L.L.; data curation, L.L.; writing—original draft preparation, L.L.; writing—review and editing, W.L.; visualization, W.L.; supervision, G.Z.; project administration, G.Z.; funding acquisition, G.Z. and W.L. All authors have read and agreed to the published version of the manuscript.

Funding

This research was funded by the National Key Research and Development Program of China (2018YFC0604606) and the National Natural Science Foundation of China (52204117).

Data Availability Statement

The data presented in this study are available upon request from the corresponding author.

Conflicts of Interest

The authors declare no conflict of interest.

Nomenclature

AbbreviationFull Name
AEAcoustic emissions
LEMLimit equilibrium method
SRMStrength reduction method
FOSFactor of safety
FEMFinite element method
MLMachine learning
RBF-SVMRadial basis function support vector machine
DTDecision trees
OPFOptimum-path forest
k-NNk-nearest neighbors
RFRandom forest
LRLogistic regression
OPTOptimal path tree
CVCross-validation
TPTrue positive
FPFalse positive
TNTrue negative
FNFalse negative
TNRTrue negative rate
FPRFalse positive rate
AUCArea under the curve
ROCReceiver operating characteristic

Appendix A. Database of Slope Cases

No.Locationγ (kN/m3)c (kPa)φ (°)β (°)H (m)ruStatusInstability Type
1Congress street, open cut slope, Chicago, USA18.6826.3415358.230FailedCircular
2Brightlingsea slide, UK16.511.490303.660FailedCircular
3Unknown18.8414.36252030.50Stable-
4Unknown18.8457.46202030.50Stable-
5Case 1: open pit iron ore mine, India28.4429.4235351000Stable-
6Case 2: open pit iron ore mine, India28.4439.2338351000Stable-
7Open pit chromite mine, Orissa, India20.616.2826.530400FailedCircular
8Sarukuygi landslide, Japan14.801720500FailedCircular
9Open pit iron ore mine, Goa, India1411.972630880FailedCircular
10Mercoirol open pit coal mine, France2512045531200Stable-
11Marquesade open pit iron ore mine, Spain26150.0545502000Stable-
12Unknown18.52503060FailedCircular
13Unknown18.51203060FailedCircular
14Case 1: Highvale coal mine, Alberta, Canada22.4103530100Stable-
15Case 2: Highvale coal mine, Alberta, Canada21.41030.3430200Stable-
16Case 1: open pit coal mine, Newcastle coalfield, Australia22203645500FailedCircular
17Case 2: open pit coal mine, Newcastle coalfield, Australia2203645500FailedCircular
18Unknown120303540Stable-
19Unknown120304580FailedCircular
20Pima open pit mine, Arizona, USA23.47032372140FailedCircular
21Case 1: Wyoming, USA167020401150FailedCircular
22Seven Sisters Landslide, UK20.4124.9132210.670.35Stable-
23Case 1: The Northolt slide, UK19.6311.97202212.190.405FailedCircular
24Selset Landslide, Yorkshire, UK21.828.62322812.80.49FailedCircular
25Saskatchewan dam, Canada20.4133.52111645.720.2FailedCircular
26Case 2: The Northolt slide, UK18.8415.32302510.670.38Stable-
27Sudbury slide, UK18.84020207.620.45FailedCircular
28Folkstone Warren slide, Kent, UK21.4302020610.5FailedCircular
29River bank side, Alberta, Canada19.0611.712835210.11FailedCircular
30Unknown18.8414.36252030.50.45FailedCircular
31Unknown21.516.94303176.810.38FailedCircular
32Case 2: open pit iron ore mine, Goa, India1411.972630880.45FailedCircular
33Athens slope, Greece182430.1545200.12FailedCircular
34Open pit coal mine Allori coalfield, Italy23020201000.3FailedCircular
35Case 1: open pit coal mine, Alberta, Canada22.41004545150.25Stable-
36Case 2: open pit coal mine, Alberta, Canada22.4103545100.4FailedCircular
37Case 3: open pit coal mine, Newcastle coalfield, Australia20203645500.25FailedCircular
38Case 4: open pit coal mine, Newcastle coalfield, Australia20203645500.5FailedCircular
39Case 5: open pit coal mine, Newcastle coalfield, Australia2003645500.25FailedCircular
40Case 6: open pit coal mine, Newcastle coalfield, Australia2003645500.5FailedCircular
41Case 1: Harbour slope, Newcastle, Australia220403380.35Stable-
42Case 2: Harbour slope, Newcastle, Australia240403380.3Stable-
43Case 3: Harbour slope, Newcastle, Australia20024.52080.35Stable-
44Case 4: Harbour slope, Newcastle, Australia185302080.3Stable-
45Unknown27403547.12920FailedCircular
46Unknown254635502840Stable-
47Unknown31.36837463660FailedCircular
48Unknown25463644.52990Stable-
49Unknown27.31039404800Stable-
50Unknown254635463930Stable-
51Unknown254840493300Stable-
52Unknown31.368.637473050.25FailedCircular
53Unknown25553645.52990.25Stable-
54Unknown31.36837472130.25FailedCircular
55Three Gorges hydropower project, China26.491503345730.15Stable-
56Three Gorges hydropower project, China26.715033501300.25Stable-
57Three Gorges hydropower project, China26.8915033521200.25Stable-
58Three Gorges hydropower project, China26.5730038.745.3800.15FailedUnknown
59Three Gorges hydropower project, China26.7830038.7541550.25FailedUnknown
60Three Gorges hydropower project, China26.8120035581380.25StableUnknown
61Three Gorges hydropower project, China26.435026.64092.20.15StableUnknown
62Three Gorges hydropower project, China26.695026.6501700.25StableUnknown
63Three Gorges hydropower project, China26.816028.8591080.25StableUnknown
64Dingjiahe phosphorus mine, China27.827.827412360.1Stable-
65Guilin-Liuzhou highway, China27.12218.625.61000.19FailedUnknown
66Xiaolangdi reservoir, China22.304026.5780.25Stable-
67Jingzhumiao reservoir, China18.603226.5460.25Stable-
68Jingzhumiao reservoir, China18.603221.8460.25Stable-
69Yuecheng reservoir, China18.89.82119.29390.25FailedUnknown
70Yuecheng reservoir, China21.203518.43730.25Stable-
71Gushan reservoir, China17.21024.2517.07380.4Stable-
72Laobu reservoir, China1911.920.421.04540.75Stable-
73Wenyuhe reservoir, China18526.515.52530.4FailedUnknown
74Wenyuhe reservoir, China1852215.52530.4FailedUnknown
75Hongwuyi reservoir, China17.4202418.43510.4FailedUnknown
76Hongwuyi reservoir, China17.821.213.9218.43510.4Stable-
77Lingli reservoir, China18.882621.8400.4FailedUnknown
78Lingli reservoir, China182121.3321.8400.4FailedUnknown
79Zhejiang sea wall, China17.6101621.890.4Stable-
80Zhejiang sea wall, China17.610821.890.4Stable-
81Hunan anxiang reservoir, China17.414.9521.245150.4FailedUnknown
82A reservoir dam in Jiangxi, China18.822514.620.32500.4FailedUnknown
83Qing River area landslide, China222915184000FailedCircular
84Qing River area landslide, China232419.8233800FailedCircular
85Qing River area landslide, China224030301960Stable-
86Qing River area landslide, China22.5429.420242100Stable-
87Qing River area landslide, China222123302570FailedCircular
88Qing River area landslide, China23.51027261900FailedCircular
89Qing River area landslide, China22.51820202900Stable-
90Qing River area landslide, China22.52016252200Stable-
91Qing River area landslide, China212024215650Stable-
92Guzhang gaofeng slope, China2727.329.1351500.26FailedCircular
93Guzhang gaofeng slope, China2727.329.1371840.22FailedCircular
94Guzhang gaofeng slope, China2727.329.134126.50.3FailedCircular
95Chengmenshan open pit copper mine, China254635502850.25Stable-
96Baijiagou earth slope, China20.45161530360.25Stable-
97Jingping first stage hydropower station, China277022.845600.32Stable-
98Left bank accumulation body of Xiaodongjiang hydropower station, China22103545100.403FailedUnknown
99Longxi landslide of Longyangxia hydropower Station, China20203645300.503FailedUnknown
100Chana landslide of Longyangxia hydropower Station, China200.13645500.25FailedUnknown
101Canal slope of Baoji gorge with Wei River diversion project, China200.13645500.503FailedUnknown
102Yellowstone landslide in the Three Gorges of the Yangtze River, China220403380.393Stable-
103Baiyian landslide in the Three Gorges reservoir area, China240403380.303Stable-
104Baihuanping landslide in the Three Gorges reservoir area, China20024.52080.35Stable-
105Gaojiazui landslide in the Three Gorges reservoir area, China180303380.303Stable-
106Songshan ancient landslide at Lechangxia hydropower station, China274335434200.25FailedUnknown
107Back channel landslide in the Three Gorges reservoir area, China275040424070.25Stable-
108Jipazi landslide in the Three Gorges reservoir area, China273535423590.25Stable-
109Jiuxianping Landslide in the Three Gorges reservoir area, China2737.53537.83200.25Stable-
110Heishe landslide, China27323342.63010.25FailedUnknown
111Liujiawuchang landslide in the Three Gorges reservoir area, China27323342.22890.25Stable-
112Majiaba landslide in the Three Gorges Reservoir Area, China27.31431411100.25Stable-
113Sandengzi landslide in the Three Gorges Reservoir Area, China27.331.529.703411350.25Stable-
114Yaqianwan landslide in the Three Gorges Reservoir Area, China27.316.8285090.50.25Stable-
115No. 3 landslide of Sanbanxi hydropower station, China27.336150920.25Stable-
116Shijiapo landslide, China27.31039415110.25Stable-
117Tanggudong landslide, China27.31039404700.25Stable-
118Tianbao landslide, China254635474430.25Stable-
119Shipingtai landslide of Xiaoxi hydropower station, China254635444350.25Stable-
120Dongyemiao landslide, China254635464320.25Stable-
121Hongtupo landslide, China2615045302300.25FailedUnknown
122Lianziya landslide in the Three Gorges reservoir area, China18.5250306.0030.25FailedUnknown
123No. 6 landslide of Jishixia hydropower station, China18.5120306.0030.25FailedUnknown
124Unknown21.41030.34330200.25Stable-
125No. 1 landslide of Jishixia hydropower station, China22203645500FailedUnknown
126Daxi landslide, China2203645500FailedUnknown
127Right Bank landslide of Zihong reservoir, China120303540Stable-
128Zhongyangcun landslide, China120304580FailedUnknown
129Yangdagou landslide of Xunyang hydropower station, China31.3683749200.50.25FailedUnknown
130Unknown20203645500.29FailedUnknown
131Maidipo Landslide, China19.621.829.537.840.30.25Stable-
132Maidipo Landslide, China23.125.229.236.561.90.4Stable-
133Shaling Landslide, China23.83138.747.523.50.31Stable-
134Niugunhan Landslide, China22.320.13140.2880.19Stable-
135Xieliupo Landslide, China23.5252049.11150.41Stable-
136Zhaojiatang Landslide, China232020.346.240.30.25Stable-
137Touzhaigou Landslide, China21.5152941.5123.60.36Stable-
138Shenzhen reservoir diversion tunnel landslide, China23.41538.530.345.20.28FailedUnknown
139Taipingyi hydropower station diversion tunnel landslide, China19.617.829.246.8201.20.37Stable-
140Bawangshan Landslide, China22.124.239.745.849.50.21Stable-
141Unknown18.917.53133.590.50.26StableCircular
142Unknown20.216.722.342.426.60.25StableCircular
143Unknown21.51419.33565.90.32StableCircular
144KSH Slope in Tailie elementary school, China2082010100FailedUnknown
145KSH Slope on the right of Circle E of Tailie Overpass, China27.337.33130300Stable-
146KSH Landslide on the left of K71 + 625~K71 + 700, China20.626.312225350FailedUnknown
147KSH Slope of Pingxite Bridge, China21.66.51940500FailedUnknown
148KSH Slope on the right of K76 + 085~K76 + 200, China22.428.92428350FailedUnknown
149KSH Slope on the left of K77 + 920~K78 + 100, China23.231.22330330FailedUnknown
150KSH Slope on the left of K79 + 165~K79 + 300, China26.837.53230260Stable-
151KSH Slope on the right of K79 + 920~K80 + 035, China27.438.13125420Stable-
152KSH Landslide on the right of ZAK0 + 315~ZAK0 + 407, China21.832.72750500FailedUnknown
153KSH Slope on the left of K83 + 260~K83 + 360, China21.827.62535600FailedUnknown
154KSH Slope on the right of K88 + 300~K88 + 420, China26.535.43230210Stable-
155KSH Slope on the right of K88 + 700~K88 + 876, China26.536.13135390Stable-
156KSH Slope on the right of K89 + 730~K89 + 841, China2735.83230690Stable-
157KSH Slope on the right of K90 + 225~K90 + 345, China2738.43325220Stable-
158KSH Slope on the right of K90 + 225~K90 + 345, China21.428.82050520FailedUnknown
159KSH Slope on the left of K99 + 120~K99 + 260, China2642.43738550Stable-
160KSH Slope on the left of K100 + 280~K100 + 410, China2639.43625300Stable-
161KSH Slope on the left of K100 + 615~K100 + 915, China25.638.83625260Stable-
162KSH Landslide on the left of K103 + 330~K103 + 450, China2030.32545530FailedUnknown
163KSH Landslide on the left of K103 + 330~K103 + 450, China25.834.73330500Stable-
164KSH Landslide on the left of K104 + 892~K105 + 052, China21.828.82635990FailedUnknown
165KSH Landslide on the left of K105 + 260~K105 + 330, China21.831.22530600FailedUnknown
166KSH Slope on the left of K106 + 268~K106 + 577, China2441.53630510Stable-
167KSH Slope on the left of K106 + 992~K107 + 085, China2440.83535500Stable-
168KSH Landslide on the left of K107 + 856~K107 + 968, China20.627.82735700FailedUnknown
169KSH Landslide on the left of K108 + 960~K109 + 010, China20.632.42635550Failed-
170KSH Landslide on the left of K108 + 960~K109 + 010, China25.838.23327400StableUnknown
171KSH Landslide on the left of K108 + 960~K109 + 010, China25.839.43325450StableUnknown
172KSH Landslide on the left of K110 + 421~K110 + 500, China21.133.52840310Failed-
173KSH Landslide on the left of K110 + 980~K110 + 240, China21.134.22630750Failed-
174KSH Slope on the right of K112 + 720~K112 + 815, China26.642.43725520StableUnknown
175KSH Slope on the left of K113 + 500~K113 + 580, China26.644.13835420StableUnknown
176KSH Slope on the left of K113 + 500~K113 + 580, China26.640.73535600StableUnknown
177KSH Slope on the left of K114 + 224~K114 + 258, China25.841.23530400StableUnknown
178KSH Slope on the left of K117 + 200~K117 + 412, China25.843.33730330StableUnknown
179KSH Front slope of tunnel in Songjieya K122 + 310, China21.7322745600Failed-
180KSH Landslide on the right of K122 + 350~K122 + 455, China20.628.52740650Failed-
181KSH Landslide on the left of K127 + 440~K127 + 590, China21.529.82640700Failed-
182KSH Landslide on the left of K127 + 440~K127 + 590, China26.542.93834360StableUnknown
183KSH Landslide on the left of K137 + 650~K137 + 730, China20.815.62030450Failed-
184KSH Landslide on the left of K138 + 624~K138 + 797, China20.814.82130400Failed-
185KSH Landslide on the right of K75 + 760~K76 + 000, China19.629.62340580Failed-
186KSH Slope on the right of ZBK0 + 000~ZBK0 + 185, China25.4333320350Failed-
187KSH Landslide on the left of K84 + 602~K85 + 185, China22.429.32650500FailedUnknown
188KSH Slope on the right of K91 + 614~K91 + 660, China26.241.53635300Stable-
189KSH Slope on the right of K91 + 720~K91 + 771, China26.242.33623360Stable-
190KSH Slope on the left of K100 + 950~K101 + 300, China25.639.83630320Stable-
191KSH Slope on the left of K102 + 691~K102 + 880, China25.636.83435600Stable-
192KSH Slope on the right of K118 + 360~K118 + 549, China26.242.83730370Stable-
193KSH Slope on the right of K119 + 823~K119 + 951, China26.243.83835680Stable-
194KSH Landslide on the right of K124 + 340~K124 + 562, China20.632.42630420FailedUnknown
195KSH Slope on the right of K131 + 280~K131 + 380, China26.541.83642540Stable-
196KSH Landslide on the left of K138 + 840~K138 + 930, China20.815.42130530FailedUnknown
197Unknown17.984.9530.0219.9880.3Stable-
198Unknown21.476.930.0231.0176.80.38FailedCircular
199Unknown21.788.553227.9812.80.49FailedCircular
200Unknown21.41030.3430200Stable-
201Unknown21.3610.0530.3330200Stable-
202Unknown19.9710.0528.9834.0360.3Stable-
203Unknown22.3810.0535.0130100Stable-
204Unknown22.3810.0535.0145100.4FailedCircular
205Unknown19.0810.059.9925.02500.4FailedCircular
206Unknown19.0810.0519.9830500.4FailedCircular
207Unknown18.8310.3521.2934.03370.3FailedCircular
208Unknown16.4711.550303.60FailedCircular
209Unknown19.0311.727.9934.98210.11FailedCircular
210Unknown19.0611.712835210.11FailedCircular
211Unknown19.61219.982212.20.41FailedCircular
212Unknown13.971226.0130880FailedCircular
213Unknown18.461203060FailedCircular
214Unknown13.971226.0130880.45FailedCircular
215Unknown18.8414.362520.3500.45FailedCircular
216Unknown18.814.425.0219.9830.60Stable-
217Unknown18.814.425.0219.9830.60.45FailedCircular
218Unknown18.815.3130.0225.0210.60.38Stable-
219Unknown20.5616.2126.5130400FailedCircular
220Unknown27.316.8285090.50.25Stable-
221Unknown2716.8285090.50.25Stable-
222Unknown20.9619.9640.0140.02120Stable-
223Unknown21.9819.963645500FailedCircular
224Unknown19.9719.963645500.25FailedCircular
225Unknown19.9719.963645500.5FailedCircular
226Unknown18.7719.969.9925.02500.3FailedCircular
227Unknown18.7719.9619.9830500.3FailedCircular
228Unknown21.9819.9622.0119.981800.1FailedCircular
229Unknown22203645500FailedCircular
230Unknown182430.1545200.12FailedCircular
231Unknown18.8324.7621.2929.2370.5FailedCircular
232Unknown18.7725.0619.9830500.2FailedCircular
233Unknown18.7725.069.9925.02500.2FailedCircular
234Unknown27.3263150920.25Stable-
235Unknown20.9630.0135.0140.02120.4Stable-
236Unknown18.9730.0135.0134.98110.2Stable-
237Unknown27323342.42890.25Stable-
238Unknown20.3933.4610.9816.0145.80.2FailedCircular
239Unknown20.9634.9627.9940.02120.5Stable-
240Unknown274035434200.25FailedCircular
241Unknown19.9740.0630.0230150.3Stable-
242Unknown19.9740.0640.0140.02100.2Stable-
243Unknown20.9645.0225.0249.03120.3Stable-
244Unknown17.9845.0225.0225.02140.3Stable-
245Unknown26.75026.6501700.25Stable-
246Unknown18.857.4719.9819.9830.60Stable-
247Unknown26.86028.8591080.25Stable-
248Unknown31.36837472130.25FailedCircular
249Unknown31.36837463660.25Stable-
250Unknown31.368.637473050.25FailedCircular
251Unknown15.9970.0719.9840.021150FailedCircular
252Unknown22.3899.934545150.25Stable-
253Unknown19.810830100.25Stable-
254Unknown19.6311.97202221.190.4FailedCircular
255Simulated by finite element analysis17.9378.218.4933.42120.790FailedCircular
256Simulated by finite element analysis18.0240.9221.1821.8634.650.1Stable-
257Simulated by finite element analysis25.7664.1121.415.7630.380.5Stable-
258Simulated by finite element analysis25.5514.83.4441.0633.310.4FailedCircular
259Simulated by finite element analysis23.8578.4833.922.88118.090.1Stable-
260Simulated by finite element analysis18.3492.240.5140.89139.480Stable-
261Simulated by finite element analysis25.1533.3639.2545.48148.370.3FailedCircular
262Simulated by finite element analysis19.2465.3434.221.864.560Stable-
263Simulated by finite element analysis19.9146.8332.818.1577.250.2Stable-
264Simulated by finite element analysis24.360.4127.0428.4499.280.3FailedCircular
265Simulated by finite element analysis20.0467.5942.9125.864.060Stable-
266Simulated by finite element analysis20.3171.4331.4628.18110.810.2Stable-
267Simulated by finite element analysis19.2643.8834.2644.16122.490FailedCircular
268Simulated by finite element analysis17.997.219.2355.5682.750FailedCircular
269Simulated by finite element analysis17.8573.2122.2246.3277.080FailedCircular
270Simulated by finite element analysis19.1494.5214.633.78105.010.5FailedCircular
271Simulated by finite element analysis21.0144.0826.4928.9497.570FailedCircular
272Simulated by finite element analysis19.3399.333.134.8255.540Stable-
273Simulated by finite element analysis16.165.2520.2120.1717.270.3Stable-
274Simulated by finite element analysis19.973.0545.4632.999.530.4Stable-
275Simulated by finite element analysis19.623.6731.065.8792.130.4Stable-
276Simulated by finite element analysis20.7128.3714.4926.4963.780FailedCircular
277Simulated by finite element analysis22.1237.5538.1133.3329.930.1Stable-
278Simulated by finite element analysis21.5432.0718.8927.0658.890.3FailedCircular
279Simulated by finite element analysis17.4108.1930.0447.3111.280.3FailedCircular
280Simulated by finite element analysis17.3920.2626.656.3834.450.3FailedCircular
281Simulated by finite element analysis18.63106.6614.2738.6268.730.5FailedCircular
282Simulated by finite element analysis17.6894.9225.445.1165.970.4FailedCircular
283Simulated by finite element analysis14.5910.9227.5547.11141.660.1FailedCircular
284Simulated by finite element analysis18.7287.5323.2833.1561.820Stable-
285Simulated by finite element analysis15.1735.5742.0614.6183.270Stable-
286Simulated by finite element analysis15.7931.6328.0948.9712.090.5Stable-
287Simulated by finite element analysis15.8769.5348.4727.117.830Stable-
288Simulated by finite element analysis16.5674.1518.3337.231.920Stable-
289Simulated by finite element analysis16.2744.3221.627.07151.390.4FailedCircular
290Simulated by finite element analysis17.0952.72642.5517.870.4Stable-
291Simulated by finite element analysis19.49100.8231.3454.8121.060.3Stable-
292Simulated by finite element analysis23.4656.1531.0643.6753.540FailedCircular
293Simulated by finite element analysis15.4846.5443.5639.4214.920.2Stable-
294Simulated by finite element analysis24.3664.739.1446.87141.850.3FailedCircular
295Simulated by finite element analysis22.3959.9111.8922.794.670.2FailedCircular
296Simulated by finite element analysis22.42161.5520.739.0315.890Stable-
297Simulated by finite element analysis19.5163.2737.0118.7790.450.4Stable-
298Simulated by finite element analysis21.1612421.9230.41116.840.5Stable-
299Simulated by finite element analysis22.5334.6126.8158102.930FailedCircular
300Simulated by finite element analysis22.7727.5125.2314.9567.590.2Stable-
301Simulated by finite element analysis19.255.2824.0229.891.590.3FailedCircular
302Simulated by finite element analysis23.1717.7523.653.5124.80.3FailedCircular
303Simulated by finite element analysis24.89121.6330.235.3216.180.5Stable-
304Simulated by finite element analysis24.0372.3728.7737.7459.210.1Stable-
305Simulated by finite element analysis23.0512.161423.389.050FailedCircular
306Simulated by finite element analysis18.2277.6446.5843.1924.520.4Stable-
307Simulated by finite element analysis20.4716.8735.4827.5817.860Stable-
308Simulated by finite element analysis20.9963.5848.5430.9168.820Stable-
309Simulated by finite element analysis18.7449.0517.5414.34118.980FailedCircular
310Simulated by finite element analysis21.269.7843.2317.4290.730Stable-
311Simulated by finite element analysis21.0729.8914.4621.9822.310FailedCircular
312Simulated by finite element analysis20.2725.3323.758.3742.760Stable-
313Simulated by finite element analysis19.925.0525.4644.1537.030FailedCircular
314Simulated by finite element analysis20.3214.914.3542.6680.260FailedCircular
315Simulated by finite element analysis20.5734.5544.4138.36122.280Stable-
316Simulated by finite element analysis19.1133.3841.531.38109.110Stable-
317Simulated by finite element analysis18.889.7721.0151.4933.340FailedCircular
318Simulated by finite element analysis20.26122.6123.4424.92114.170Stable-
319Simulated by finite element analysis16.391.7227.741.8287.530FailedCircular
320Simulated by finite element analysis13.658.0738.6336.6132.970Stable-
321Simulated by finite element analysis19.6528.7917.3835.7968.780FailedCircular
322Simulated by finite element analysis16.181.1830.164.84125.440Stable-
323Simulated by finite element analysis26.5268.7420.7624.86123.990FailedCircular
324Simulated by finite element analysis23.1257.2129.9626.3994.950Stable-
325Simulated by finite element analysis25.0614.9714.8647.79142.710FailedCircular
326Simulated by finite element analysis23.1546.4123.5648.5422.440FailedCircular
327Simulated by finite element analysis19.27129.4627.5434.6187.630Stable-
328Simulated by finite element analysis22.340.6421.9324.05103.190FailedCircular
329Simulated by finite element analysis22.3743.3719.1545.03119.950FailedCircular
330Simulated by finite element analysis15.3753.0328.0640.94790.35FailedCircular
331Simulated by finite element analysis23.3529.9716.3839.7333.920.405FailedCircular
332Simulated by finite element analysis17.14127.0541.9231.87114.990.49Stable-
333Simulated by finite element analysis16.171.6920.8152.7770.060.2FailedCircular
334Simulated by finite element analysis23.1817.7413.8626.7160.390.38FailedCircular
335Simulated by finite element analysis18.3436.3430.1929.44143.10.45FailedCircular
336Simulated by finite element analysis16.931.833.6529.2181.740.5Stable-
337Simulated by finite element analysis24.83119.2813.2426.86113.910.11FailedCircular
338Simulated by finite element analysis13.9380.937.1334.1658.250.45Stable-
339Simulated by finite element analysis17.6159.3119.143.2831.250.38FailedCircular
340Simulated by finite element analysis24.611.361.720.1911.060.45FailedCircular
341Simulated by finite element analysis30.312223.9436.99104.020.12FailedCircular
342Simulated by finite element analysis20.6969.6840.3449.39111.420.3FailedCircular
343Simulated by finite element analysis23.8230021.7720.5723.90.25Stable-
344Simulated by finite element analysis16.7724.093422.5326.720.4Stable-
345Simulated by finite element analysis28.110.692118.2299.460.25FailedCircular
346Simulated by finite element analysis18.276.4520.6926.317.040.5FailedCircular
347Simulated by finite element analysis10.0662.4139.9939.0458.310.25Stable-
348Simulated by finite element analysis20.8574.4211.3439.5713.170.5Stable-
349Simulated by finite element analysis20.9852.523.5533.6749.70.35FailedCircular
350Simulated by finite element analysis17.5627.8217.2337.2367.610.3FailedCircular
351Simulated by finite element analysis21.467.9938.1132.72132.330.35Stable-
352Simulated by finite element analysis25.29125.82048.07560.3Stable-
353Simulated by finite element analysis15.4779.3947.8832.4681.140.15Stable-
354Simulated by finite element analysis22.338.6431.0143.92470.25FailedCircular
355Simulated by finite element analysis16.820.0523.9229.4536.220.25FailedCircular
356Simulated by finite element analysis25.9313.7222.3635.7953.370.15Stable-
357Simulated by finite element analysis22.5663.5131.1338.3649.540.25Stable-
358Simulated by finite element analysis18.5621.0424.825.345.920.25Stable-
359Simulated by finite element analysis21.4741.5918.7645.7348.470.15FailedCircular
360Simulated by finite element analysis19.0129.3412.1930.3512.070.25Stable-
361Simulated by finite element analysis22.8468.4610.9135.9463.730.25FailedCircular
362Simulated by finite element analysis20.3611.8936.616.58108.920Stable-
363Simulated by finite element analysis25.2883.6718.436.46106.80.1FailedCircular
364Simulated by finite element analysis30.2738.5522.463929.530.5FailedCircular
365Simulated by finite element analysis21.7116.5719.682960.80.4FailedCircular
366Simulated by finite element analysis23.6755.7238.3638.68100.020.1Stable-
367Simulated by finite element analysis21.8453.2135.1215.3108.670Stable-
368Simulated by finite element analysis18.5882.6521.8931.6420.110.3Stable-
369Simulated by finite element analysis22.2330.8121.831.443.450Stable-
370Simulated by finite element analysis24.0530.8928.5736.8771.360.2FailedCircular
371Simulated by finite element analysis23.57162.6212.5956.79155.280.3FailedCircular
372Simulated by finite element analysis21.038.3228.2231.6349.250FailedCircular
373Simulated by finite element analysis19.8830.8621.4750.1438.230.2FailedCircular
374Simulated by finite element analysis27.253.6228.321.8256.780Stable-
375Simulated by finite element analysis23.8843.526.4843.0713.520Stable-
376Simulated by finite element analysis25.5564.9116.9733.4597.580FailedCircular
377Simulated by finite element analysis18.0438.4943.9632.4427.540.5Stable-
378Simulated by finite element analysis25.784.4918.6642.657.750Stable-
379Simulated by finite element analysis15.073.5835.1236.5222.10FailedCircular
380Simulated by finite element analysis22.2186.7427.4325.213.370.3Stable-
381Simulated by finite element analysis20.5646.913.4710.753.880.4Stable-
382Simulated by finite element analysis21.0595.9436.2437.34132.920.4Stable-
383Simulated by finite element analysis18.939.2831.4643.3133.060FailedCircular
384Simulated by finite element analysis23.8810.0722.7528.323.920.1FailedCircular
385Simulated by finite element analysis22.4410.4831.8826.22101.930.3Stable-
386Simulated by finite element analysis21.1712.5840.5149.4111.540.3FailedCircular
387Simulated by finite element analysis28.07160.7726.224.64162.760.3Stable-
388Simulated by finite element analysis24.345.9644.3538.1256.210.5Stable-
389Simulated by finite element analysis21.1376.3437.5519.95.050.4Stable-
390Simulated by finite element analysis20.4144.6628.2333.8986.390.1FailedCircular
391Simulated by finite element analysis13.1294.388.1120.6634.420Stable-
392Simulated by finite element analysis18.0911.873.4634.4378.520FailedCircular
393Simulated by finite element analysis18.67115.427.114.5691.160.5Stable-
394Simulated by finite element analysis17.4699.0324.14.2442.940Stable-
395Simulated by finite element analysis20.0591.2932.1739.2670.970Stable-
396Simulated by finite element analysis27.1714.5515.0244.8219.180.4FailedCircular
397Simulated by finite element analysis22.35057.3637.515.10.4Stable-
398Simulated by finite element analysis19.58014.627.1877.830.3FailedCircular
399Simulated by finite element analysis16.44029.2240.2421.740Stable-
400Simulated by finite element analysis23.96028.0432.474.580.2FailedCircular
401Simulated by finite element analysis19.6022.7959.35155.730.3FailedCircular
402Simulated by finite element analysis27.35033.9234.035.70.2FailedCircular
403Simulated by finite element analysis21.03017.725.7957.310Stable-
404Simulated by finite element analysis25.74017.2330.0380.530.4FailedCircular
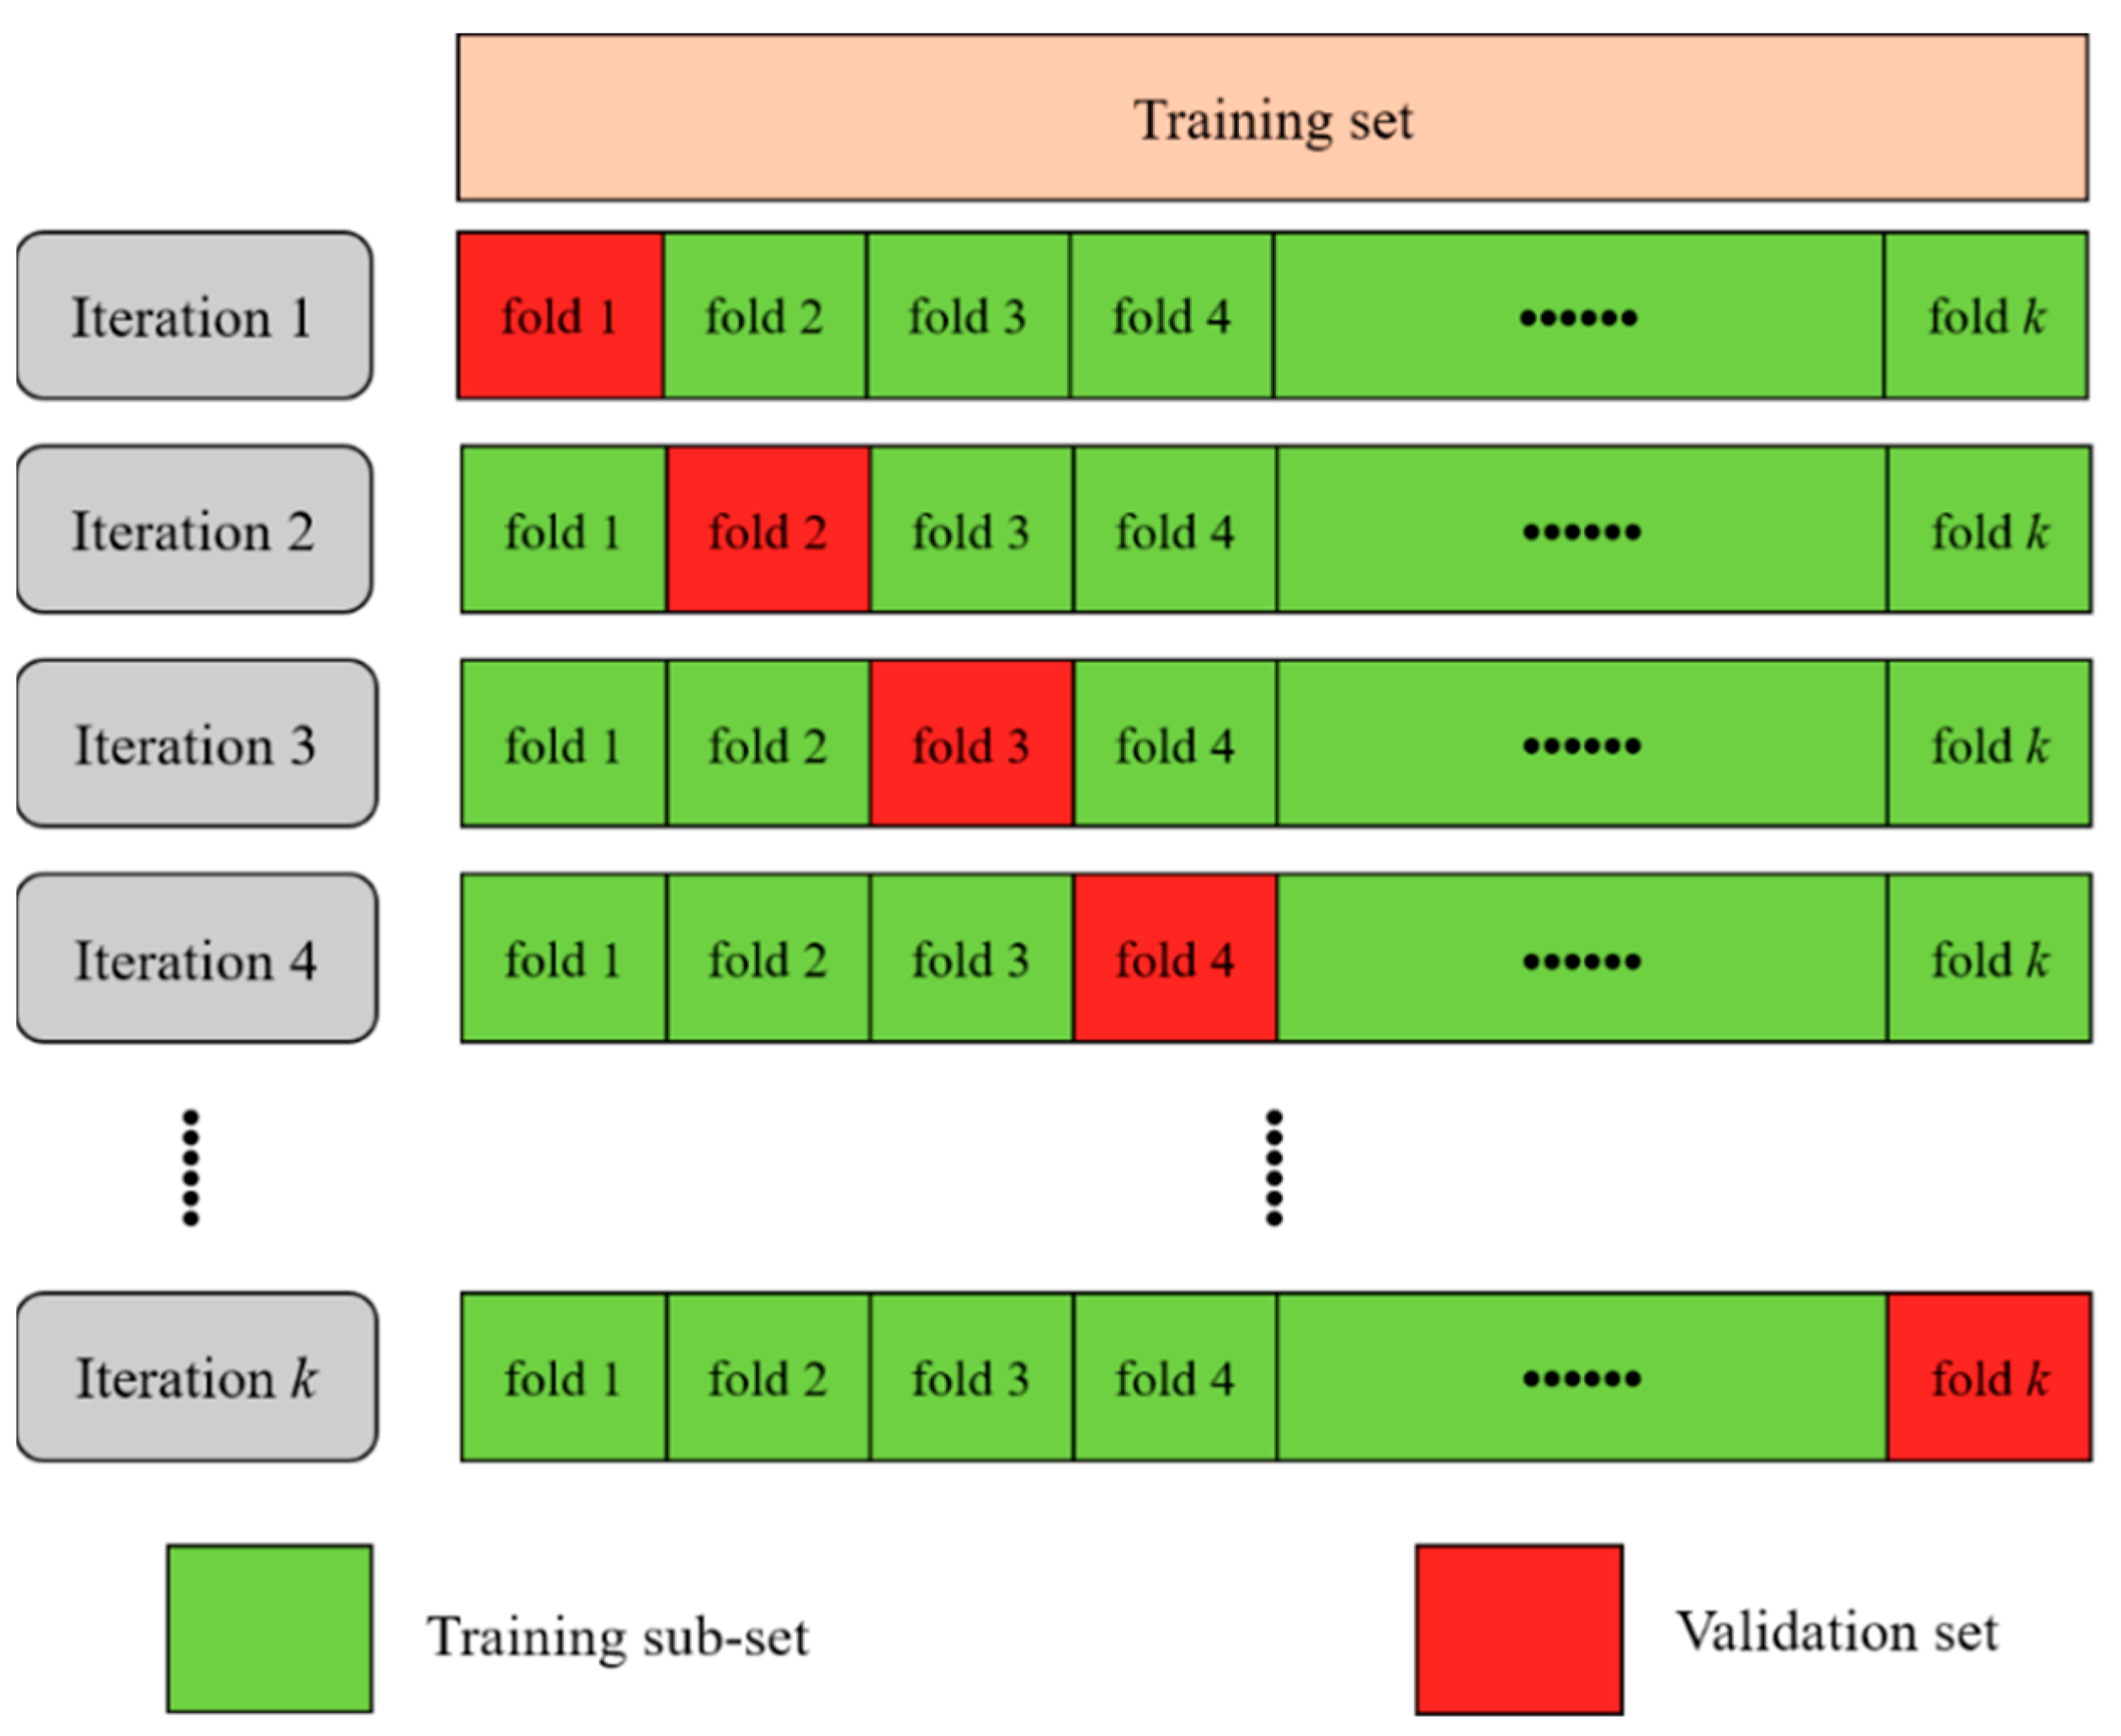
Case 1–44 reported by [32]. Case 45–54 reported by [63]. Case 55–63 reported by [64]. Case 64 reported by [65]. Case 65–82 reported by [70]. Case 83–91 reported by [66]. Case 92–94 reported by [67]. Case 95–97 reported by [36]. Case 98–140 reported by [68]. Case 141–143 reported by [36]. Case 144–196 reported by [72]. Case 197–254 reported by [69]. Case 255–404 reported by [57]. KSH denotes Kaili-Sansui highway.

References

  1. Zhan, L.-T.; Guo, X.-G.; Sun, Q.-Q.; Chen, Y.-M.; Chen, Z.-Y. The 2015 Shenzhen catastrophic landslide in a construction waste dump: Analyses of undrained strength and slope stability. Acta Geotech. 2021, 16, 1247–1263. [Google Scholar] [CrossRef]
  2. Asnakew, S.; Shumet, S.; Ginbare, W.; Legas, G.; Haile, K. Prevalence of post-traumatic stress disorder and associated factors among Koshe landslide survivors, Addis Ababa, Ethiopia: A community-based, cross-sectional study. BMJ Open 2019, 9, e028550. [Google Scholar] [CrossRef] [PubMed]
  3. Van Tien, P.; Luong, L.H.; Duc, D.M.; Trinh, P.T.; Quynh, D.T.; Lan, N.C.; Thuy, D.T.; Phi, N.Q.; Cuong, T.Q.; Dang, K.; et al. Rainfall-induced catastrophic landslide in Quang Tri Province: The deadliest single landslide event in Vietnam in 2020. Landslides 2021, 18, 2323–2327. [Google Scholar] [CrossRef]
  4. Zhang, C.-C.; Zhu, H.-H.; Liu, S.-P.; Shi, B.; Zhang, D. A kinematic method for calculating shear displacements of landslides using distributed fiber optic strain measurements. Eng. Geol. 2018, 234, 83–96. [Google Scholar] [CrossRef]
  5. Dixon, N.; Smith, A.; Flint, J.A.; Khanna, R.; Clark, B.; Andjelkovic, M. An acoustic emission landslide early warning system for communities in low-income and middle-income countries. Landslides 2018, 15, 1631–1644. [Google Scholar] [CrossRef] [Green Version]
  6. Shiotani, T. Evaluation of long-term stability for rock slope by means of acoustic emission technique. NDT E Int. 2006, 39, 217–228. [Google Scholar] [CrossRef]
  7. Codeglia, D.; Dixon, N.; Fowmes, G.J.; Marcato, G. Analysis of acoustic emission patterns for monitoring of rock slope deformation mechanisms. Eng. Geol. 2017, 219, 21–31. [Google Scholar] [CrossRef] [Green Version]
  8. Akbar, T.A.; Ha, S.R. Landslide hazard zoning along Himalayan Kaghan Valley of Pakistan—By integration of GPS, GIS, and remote sensing technology. Landslides 2011, 8, 527–540. [Google Scholar] [CrossRef]
  9. Marsella, M.; D’Aranno, P.J.V.; Scifoni, S.; Sonnessa, A.; Corsetti, M. Terrestrial laser scanning survey in support of unstable slopes analysis: The case of Vulcano Island (Italy). Nat. Hazard. 2015, 78, 443–459. [Google Scholar] [CrossRef]
  10. Atzeni, C.; Barla, M.; Pieraccini, M.; Antolini, F. Early Warning Monitoring of Natural and Engineered Slopes with Ground-Based Synthetic-Aperture Radar. Rock Mech Rock Eng. 2015, 48, 235–246. [Google Scholar] [CrossRef] [Green Version]
  11. Ho, S.-C.; Chen, I.H.; Lin, Y.-S.; Chen, J.-Y.; Su, M.-B. Slope deformation monitoring in the Jiufenershan landslide using time domain reflectometry technology. Landslides 2019, 16, 1141–1151. [Google Scholar] [CrossRef]
  12. Chen, Z.Y.; Mi, H.L.; Zhang, F.M.; Wang, X.G. A simplified method for 3D slope stability analysis. Can. Geotech. J. 2003, 40, 675–683. [Google Scholar] [CrossRef]
  13. Nie, Z.; Zhang, Z.; Zheng, H. Slope stability analysis using convergent strength reduction method. Eng. Anal. Boundary Elem. 2019, 108, 402–410. [Google Scholar] [CrossRef]
  14. Wang, L.; Sun, D.; Li, L. Three-dimensional stability of compound slope using limit analysis method. Can. Geotech. J. 2019, 56, 116–125. [Google Scholar] [CrossRef]
  15. Liu, H.; Xu, D.; Min, Y. Discussion on the Multi-Solution of Three-Dimensional Slope Safety Factor. Geotech. Geol. Eng. 2021, 39, 3361–3370. [Google Scholar] [CrossRef]
  16. Faramarzi, L.; Zare, M.; Azhari, A.; Tabaei, M. Assessment of rock slope stability at Cham-Shir Dam Power Plant pit using the limit equilibrium method and numerical modeling. Bull. Eng. Geol. Environ. 2017, 76, 783–794. [Google Scholar] [CrossRef]
  17. Liu, F. Stability Analysis of Geotechnical Slope Based on Strength Reduction Method. Geotech. Geol. Eng. 2020, 38, 3653–3665. [Google Scholar] [CrossRef]
  18. Mbarka, S.; Baroth, J.; Ltifi, M.; Hassis, H.; Darve, F. Reliability analyses of slope stability. Eur. J. Environ. Civ. Eng. 2010, 14, 1227–1257. [Google Scholar] [CrossRef]
  19. Ma, Z.; Liao, H.; Dang, F.; Cheng, Y. Seismic slope stability and failure process analysis using explicit finite element method. Bull. Eng. Geol. Environ. 2021, 80, 1287–1301. [Google Scholar] [CrossRef]
  20. Nie, Z.; Zhang, Z.; Zheng, H.; Lin, S. Stability analysis of landslides using BEM and variational inequality based contact model. Comput. Geotech. 2020, 123, 103575. [Google Scholar] [CrossRef]
  21. Zhao, Y.; Zhao, G.; Zhou, J.; Ma, J.; Cai, X. Failure mechanism analysis of rock in particle discrete element method simulation based on moment tensors. Comput. Geotech. 2021, 136, 104215. [Google Scholar] [CrossRef]
  22. Yang, Y.; Xu, D.; Liu, F.; Zheng, H. Modeling the entire progressive failure process of rock slopes using a strength-based criterion. Comput. Geotech. 2020, 126, 103726. [Google Scholar] [CrossRef]
  23. Sun, L.; Grasselli, G.; Liu, Q.; Tang, X.; Abdelaziz, A. The role of discontinuities in rock slope stability: Insights from a combined finite-discrete element simulation. Comput. Geotech. 2022, 147, 104788. [Google Scholar] [CrossRef]
  24. Ma, Z.; Zhu, C.; Yao, X.; Dang, F. Slope Stability Analysis under Complex Stress State with Saturated and Unsaturated Seepage Flow. Geofluids 2021, 2021, 6637098. [Google Scholar] [CrossRef]
  25. Wei, J.; Zhao, Z.; Xu, C.; Wen, Q. Numerical investigation of landslide kinetics for the recent Mabian landslide (Sichuan, China). Landslides 2019, 16, 2287–2298. [Google Scholar] [CrossRef]
  26. Haghnejad, A.; Ahangari, K.; Moarefvand, P.; Goshtasbi, K. Numerical investigation of the impact of geological discontinuities on the propagation of ground vibrations. Geomech. Eng. 2018, 14, 545–552. [Google Scholar] [CrossRef]
  27. Song, X.; Zhang, X.; Wu, S. Study on slope stability analysis and large deformation characteristics of failure based on SPH method. Comput. Part. Mech. 2023. [Google Scholar] [CrossRef]
  28. Zhang, Y.W.; Tang, L.X.; Bai, D.C.; Zhou, P. Numerical Simulation of Failure Process on Soil Slope with Different Support Measures. Appl. Mech. Mater. 2014, 580–583, 665–668. [Google Scholar] [CrossRef]
  29. Dyson, A.P.; Tolooiyan, A. Comparative Approaches to Probabilistic Finite Element Methods for Slope Stability Analysis. Simul. Modell Pract. Theory 2020, 100, 102061. [Google Scholar] [CrossRef]
  30. Liang, W.; Luo, S.; Zhao, G.; Wu, H. Predicting Hard Rock Pillar Stability Using GBDT, XGBoost, and LightGBM Algorithms. Mathematics 2020, 8, 765. [Google Scholar] [CrossRef]
  31. Lu, P.; Rosenbaum, M.S. Artificial neural networks and Grey Systems for the prediction of slope stability. Nat. Hazard. 2003, 30, 383–398. [Google Scholar] [CrossRef]
  32. Sah, N.K.; Sheorey, P.R.; Upadhyaya, L.N. Maximum likelihood estimation of slope stability. Int. J. Rock Mech. Mining Sci. Geomech. Abstracts 1994, 31, 47–53. [Google Scholar] [CrossRef]
  33. Samui, P. Slope stability analysis: A support vector machine approach. Environ. Geol. 2008, 56, 255–267. [Google Scholar] [CrossRef]
  34. Yang, C.X.; Tham, L.G.; Feng, X.T.; Wang, Y.J.; Lee, P.K.K. Two-stepped evolutionary algorithm and its application to stability analysis of slopes. J. Comput. Civ. Eng. 2004, 18, 145–153. [Google Scholar] [CrossRef]
  35. Amirkiyaei, V.; Ghasemi, E. Stability assessment of slopes subjected to circular-type failure using tree-based models. Int. J. Geotech. Eng. 2020, 16, 301–311. [Google Scholar] [CrossRef]
  36. Zhou, J.; Li, E.; Yang, S.; Wang, M.; Shi, X.; Yao, S.; Mitri, H.S. Slope stability prediction for circular mode failure using gradient boosting machine approach based on an updated database of case histories. Saf. Sci. 2019, 118, 505–518. [Google Scholar] [CrossRef]
  37. Wang, H.; Moayedi, H.; Kok Foong, L. Genetic algorithm hybridized with multilayer perceptron to have an economical slope stability design. Eng. Comput. 2021, 37, 3067–3078. [Google Scholar] [CrossRef]
  38. Hoang, N.-D.; Tien Bui, D. Chapter 18—Slope Stability Evaluation Using Radial Basis Function Neural Network, Least Squares Support Vector Machines, and Extreme Learning Machine. In Handbook of Neural Computation; Samui, P., Sekhar, S., Balas, V.E., Eds.; Academic Press: Cambridge, MA, USA, 2017; pp. 333–344. [Google Scholar]
  39. Mahmoodzadeh, A.; Mohammadi, M.; Ali, H.F.H.; Ibrahim, H.H.; Abdulhamid, S.N.; Nejati, H.R. Prediction of safety factors for slope stability: Comparison of machine learning techniques. Nat. Hazard. 2021, 111, 1771–1799. [Google Scholar] [CrossRef]
  40. Papa, J.P.; Falcao, A.X.; Levada, A.L.; Corrêa, D.C.; Salvadeo, D.H.; Mascarenhas, N.D. Fast and accurate holistic face recognition using optimum-path forest. In Proceedings of the 2009 16th International Conference on Digital Signal Processing, Santorini, Greece, 5–7 July 2009; pp. 1–6. [Google Scholar]
  41. Bernardo, L.S.; Quezada, A.; Munoz, R.; Maia, F.M.; Pereira, C.R.; Wu, W.; de Albuquerque, V.H.C. Handwritten pattern recognition for early Parkinson’s disease diagnosis. Pattern Recognit Lett. 2019, 125, 78–84. [Google Scholar] [CrossRef]
  42. Papa, J.P.; Spadotto, A.A.; Falcao, A.X.; Pereira, J.C. Optimum path forest classifier applied to laryngeal pathology detection. In Proceedings of the 2008 15th International Conference on Systems, Signals and Image Processing, Bratislava, Slovakia, 25–28 June 2008; pp. 249–252. [Google Scholar]
  43. Pisani, R.J.; Mizobe Nakamura, R.Y.; Riedel, P.S.; Lopes Zimback, C.R.; Falcao, A.X.; Papa, J.P. Toward Satellite-Based Land Cover Classification Through Optimum-Path Forest. IEEE Trans Geosci. Remote Sens. 2014, 52, 6075–6085. [Google Scholar] [CrossRef]
  44. Bertoni, M.A.; de Rosa, G.H.; Brega, J.R.F. Optimum-path forest stacking-based ensemble for intrusion detection. Evol. Intell. 2021, 15, 2037–2054. [Google Scholar] [CrossRef]
  45. Papa, J.P.; Nachif Fernandes, S.E.; Falcao, A.X. Optimum-Path Forest based on k-connectivity: Theory and applications. Pattern Recognit Lett. 2017, 87, 117–126. [Google Scholar] [CrossRef] [Green Version]
  46. Hensel, F.; Moor, M.; Rieck, B. A Survey of Topological Machine Learning Methods. Front. Artif. Intell. 2021, 4, 681108. [Google Scholar] [CrossRef]
  47. Papa, J.P.; Falcao, A.X.; Suzuki, C.T.N. Supervised Pattern Classification Based on Optimum-Path Forest. Int. J. Imaging Syst. Technol. 2009, 19, 120–131. [Google Scholar] [CrossRef] [Green Version]
  48. Papa, J.P.; Falcao, A.X.; de Albuquerque, V.H.C.; Tavares, J.M.R.S. Efficient supervised optimum-path forest classification for large datasets. Pattern Recognit. 2012, 45, 512–520. [Google Scholar] [CrossRef]
  49. Chen, S.; Sun, T.; Yang, F.; Sun, H.; Guan, Y. An improved optimum-path forest clustering algorithm for remote sensing image segmentation. Comput. Geosci. 2018, 112, 38–46. [Google Scholar] [CrossRef]
  50. Papa, J.P.; Falcao, A.X. A New Variant of the Optimum-Path Forest Classifier. In Proceedings of the 4th International Symposium on Visual Computing, Las Vegas, NV, USA, 16–18 October 2008; pp. 935–944. [Google Scholar]
  51. Zhao, G.; Wang, M.; Liang, W. A Comparative Study of SSA-BPNN, SSA-ENN, and SSA-SVR Models for Predicting the Thickness of an Excavation Damaged Zone around the Roadway in Rock. Mathematics 2022, 10, 1351. [Google Scholar] [CrossRef]
  52. Liang, W.; Sari, A.; Zhao, G.; McKinnon, S.D.; Wu, H. Short-term rockburst risk prediction using ensemble learning methods. Nat. Hazard. 2020, 104, 1923–1946. [Google Scholar] [CrossRef]
  53. de Rosa, G.H.; Papa, J.P. OPFython: A Python implementation for Optimum-Path Forest. Software Impacts 2021, 9, 100113. [Google Scholar] [CrossRef]
  54. Pedregosa, F.; Varoquaux, G.; Gramfort, A.; Michel, V.; Thirion, B.; Grisel, O.; Blondel, M.; Prettenhofer, P.; Weiss, R.; Dubourg, V.; et al. Scikit-learn: Machine Learning in Python. J. Mach. Learn Res. 2011, 12, 2825–2830. [Google Scholar]
  55. Yuan, C.; Moayedi, H. The performance of six neural-evolutionary classification techniques combined with multi-layer perception in two-layered cohesive slope stability analysis and failure recognition. Eng. Comput. 2020, 36, 1705–1714. [Google Scholar] [CrossRef]
  56. Bradley, A.P. The use of the area under the ROC curve in the evaluation of machine learning algorithms. Pattern Recognit. 1997, 30, 1145–1159. [Google Scholar] [CrossRef] [Green Version]
  57. Kardani, N.; Zhou, A.; Nazem, M.; Shen, S.-L. Improved prediction of slope stability using a hybrid stacking ensemble method based on finite element analysis and field data. J. Rock Mech. Geotech. Eng. 2021, 13, 188–201. [Google Scholar] [CrossRef]
  58. Moayedi, H.; Osouli, A.; Nguyen, H.; Rashid, A.S.A. A novel Harris hawks’ optimization and k-fold cross-validation predicting slope stability. Eng. Comput. 2021, 37, 369–379. [Google Scholar] [CrossRef]
  59. Liang, W.; Sari, Y.A.; Zhao, G.; McKinnon, S.D.; Wu, H. Probability Estimates of Short-Term Rockburst Risk with Ensemble Classifiers. Rock Mech Rock Eng. 2021, 54, 1799–1814. [Google Scholar] [CrossRef]
  60. Bishop, A.W.; Morgenstern, N. Stability Coefficients for Earth Slopes. Geotechnique 1960, 10, 129–153. [Google Scholar] [CrossRef]
  61. Fellenius, W. Calculation of stability of Earth dam. In Transactions of the Second Congress Large Dams; International Commission on Large Dams: Washington, DC, USA, 1936; pp. 445–462. [Google Scholar]
  62. Morgenstern, N.R.; Price, V.E. The Analysis of the Stability of General Slip Surfaces. Geotechnique 1965, 15, 79–93. [Google Scholar] [CrossRef]
  63. Feng, X.-T.; Hudson, J.A. The ways ahead for rock engineering design methodologies. Int. J. Rock Mech. Min. Sci. 2004, 41, 255–273. [Google Scholar] [CrossRef]
  64. Xu, W.; Shao, J.F. Artificial Neural Network Analysis for the Evaluation of Slope Stability. In Application of Numerical Methods to Geotechnical Problems; Cividini, A., Ed.; Springer: Vienna, Austria, 1998; pp. 665–672. [Google Scholar]
  65. Li, W.-X.; Yang, S.-C.; Chen, E.-Z.; Qiao, J.-L.; Dai, L.-F. Neural network method of analysis of natural slope failure due to underground mining in mountainous areas. Yantu Lixue Rock Soil Mech. 2006, 27, 1563–1566. [Google Scholar]
  66. Wang, H.B.; Xu, W.Y.; Xu, R.C. Slope stability evaluation using back propagation neural networks. Eng. Geol. 2005, 80, 302–315. [Google Scholar] [CrossRef]
  67. Jin, L.; Feng, W.; Zhang, J. Maximum likelihood estimation on safety coefficients of rocky slope near DAM of Fengtan project. Yanshilixue Yu Gongcheng Xuebao/Chinese J. Rock Mech. Eng. 2004, 23, 1891–1894. [Google Scholar]
  68. Wang, C. Study on Prediction Methods for High Engineering Slope. Master’s Thesis, Beijing Jiaotong University, Beijing, China, 2009. [Google Scholar]
  69. Qi, C.; Tang, X. Slope stability prediction using integrated metaheuristic and machine learning approaches: A comparative study. Comput. Ind. Eng. 2018, 118, 112–122. [Google Scholar] [CrossRef]
  70. Chen, L.-Q.; Peng, Z.-B.; Chen, W.; Peng, W.-X.; Wu, Q.-H. Artificial neural network simulation on prediction of clay slope stability based on fuzzy controller. Zhongnan Daxue Xuebao Ziran Kexue Ban J. Central South Univ. Sci. Technol. 2009, 40, 1381–1387. [Google Scholar]
  71. Lin, S.; Zheng, H.; Han, B.; Li, Y.; Han, C.; Li, W. Comparative performance of eight ensemble learning approaches for the development of models of slope stability prediction. Acta Geotech. 2022, 17, 1477–1502. [Google Scholar] [CrossRef]
  72. Chen, C.; Xiao, Z.; Zhang, G. Stability assessment model for epimetamorphic rock slopes based on adaptive neuro-fuzzy inference system. Electron. J. Geotech. Eng. 2011, 16 A, 93–107. [Google Scholar]
  73. Altmann, A.; Tolosi, L.; Sander, O.; Lengauer, T.J.B. Permutation importance: A corrected feature importance measure. Bioinformatics 2010, 26, 1340–1347. [Google Scholar] [CrossRef] [PubMed] [Green Version]
  74. Viet-Ha, N.; Nhat-Duc, H.; Hieu, N.; Phuong Thao Thi, N.; Tinh Thanh, B.; Pham Viet, H.; Samui, P.; Dieu Tien, B. Effectiveness assessment of Keras based deep learning with different robust optimization algorithms for shallow landslide susceptibility mapping at tropical area. Catena 2020, 188, 104458. [Google Scholar] [CrossRef]
  75. Sun Jishu, X.J.; Wang, J.; Li, W. Application of Relevance Vector Machine Model in Slope Stability Prediction. Sci. Tech. Eng. 2021, 21, 12234–12242. [Google Scholar]
Figure 1. Schematic diagram of OPF-based classifiers [49].
Mathematics 11 03071 g001
Figure 2. Schematic diagram of the training phase [50], (a) a two-class (“green circles” and “red squares”) complete graph, (b) minimum spanning tree (MST), (c) labeled prototypes (marked by black dashed circles), (d) optimal path forest.
Mathematics 11 03071 g002
Figure 3. Schematic diagram of classification phase [50], (a) the sample to be classified (blue triangle) is connected to all training nodes in the generated optimal path forest, and the connection strength fmax is calculated for each path, (b) the triangle is conquered by “red squares” class samples and classified as “red”.
Mathematics 11 03071 g003
Figure 4. Flowchart of the proposed approach.
Mathematics 11 03071 g004
Figure 5. Flowchart of k-fold CV.
Mathematics 11 03071 g005
Figure 6. The 3D schematic diagram of slope failure.
Mathematics 11 03071 g006
Figure 7. Distribution of slope stability status.
Mathematics 11 03071 g007
Figure 8. Violin plots of the dataset.
Mathematics 11 03071 g008
Figure 9. Correlation matrix of six indicators.
Mathematics 11 03071 g009
Figure 10. Correlation pair plots of six indicators.
Mathematics 11 03071 g010
Figure 11. Grid search of hyperparameters tuning: (a) k-NN, (b) LR, (c) DT, (d) RF, and (e) RBF-SVM.
Mathematics 11 03071 g011aMathematics 11 03071 g011bMathematics 11 03071 g011c
Figure 12. ROC curves and AUC of seven classifiers.
Mathematics 11 03071 g012
Figure 13. Relative importance of indicators.
Mathematics 11 03071 g013
Figure 14. False positive rate and true negative rate of each classifier.
Mathematics 11 03071 g014
Table 1. Confusion matrix for slope stability prediction.
Actual ConditionPredicted Condition
StableFailed
StableTrue positiveFalse negative
FailedFalse positiveTrue negative
Table 2. Descriptions of input indicators.
IndicatorDescriptionMeasurement Method
γ (kN/m3)It indicates the weight of soil/rock per unit volume.It can be measured by performing the standard mass volume method, mercury displacement method, or gravimeter method in the laboratory.
c (kPa)It indicates the attraction between molecules on the surface of adjacent material particles within the soil/rock.It can be determined by performing direct shear tests and triaxial compression tests in the laboratory.
φ (°)It indicates a measure of the ability of a unit of soil/rock to withstand shear stress.It can be determined by performing direct shear tests and triaxial compression tests in the laboratory.
β (°)It indicates the angle between the slope plane and the slope bottom.It can be measured in the field by an inclinometer.
H (m)It indicates the vertical distance from the slope bottom to the slope top.It can be measured in the field using a surveying instrument such as a total station.
ruIt is defined as the ratio of the pore pressure and normal stress at a certain point within a slope.It can be measured by installing pore water piezometers on-site or by performing immersion tests or infiltration tests in the laboratory.
Table 3. Statistical values of slope stability dataset.
Value Typeγ (kN/m3)c (kPa)φ (°)β (°)H (m)ru
Minimum10.06004.243.450
Median21.3829.728.2734.03510.2
Maximum31.330057.3659.355650.75
Mean21.6939.3827.7434.1984.260.18
Standard3.8440.549.6310.8694.970.17
Table 4. Results of hyperparameters tuning.
ML AlgorithmsHyperparametersScope of ValuesInterval of ValuesOptimal Values
k-NNn_neighbors(1, 31)17
LRInverse of regularization strength C1(0.1, 10)0.10.1
DTmax_depth(1, 10)17
min_samples_leaf(1, 10)13
RFn_estimators(1, 101)1031
max_depth(1, 20)111
RBF-SVMgamma(0.01, 0.6)0.010.55
Penalty coefficient C2(3, 4)0.13.3
Table 5. Confusion matrix, accuracy, and F1-score of the classifiers.
ClassifiersActual ConditionPredicted ConditionAccuracyF1-Score
StableFailed
OPFk-NNStable3740.9010.902
Failed436
OPFStable3830.8760.884
Failed733
RFStable3770.8270.841
Failed730
k-NNStable3680.8150.828
Failed730
RBF-SVMStable3590.8020.814
Failed730
DTStable33110.7650.776
Failed829
LRStable28160.6790.683
Failed1027
Table 6. Average computation time of classifiers over 20 runs.
TimeOPFk-NNOPFRFRBF-SVMDTLRk-NN
Train0.915 ± 0.0270.322 ± 0.034117.751 ± 1.16382.326 ± 1.1492.162 ± 0.0670.402 ± 0.0350.187 ± 0.011
Test0.042 ± 0.0020.097 ± 0.0040.055 ± 0.0030.171 ± 0.0050.008 ± 0.0010.008 ± 0.0010.011 ± 0.002
Total0.957 ± 0.0260.419 ± 0.033117.806 ± 1.16482.497 ± 1.1492.170 ± 0.0670.410 ± 0.0360.198 ± 0.011
Table 7. Predictive results of OPFk-NN model on engineering slopes.
Slopesγ (kN/m3)c (kPa)φ (°)β (°)H (m)ruFOSStatus
122.420.027.030.054.00.121.208Stable
221.431.542.034.018.00.232.448Stable
319.050.032.042.026.00.171.786Stable
419.617.829.241.250.00.310.979Failed
520.216.722.342.426.60.470.869Failed
620.425.020.435.065.90.420.833Failed
720.020.036.045.050.00.141.102Stable
823.018.325.239.661.20.300.824Failed
Disclaimer/Publisher’s Note: The statements, opinions and data contained in all publications are solely those of the individual author(s) and contributor(s) and not of MDPI and/or the editor(s). MDPI and/or the editor(s) disclaim responsibility for any injury to people or property resulting from any ideas, methods, instructions or products referred to in the content.

