Abstract
We present a mathematical model of an individual cell to expand the simulation of invadopodia formation to a three-dimensional (3D) domain for a more realistic complexity. Simulating invadopodia replication in order for it to be biologically relevant is important since it helps us to understand cancer invasion and metastasis better as well as giving some insight into investigating ways to stop the spread of this fatal disease. Invadopodia formation is formulated using the Stefan problem approach, where the free boundary is characterised by the Stefan free boundary condition, in which the boundary membrane is not known in advance. Level set method is proposed to indicate the behaviour of the cell interface and the motion of the plasma membrane. An enthalpy method (phase-transition problem) is used to describe the cell membrane diffusion. In addition to this, we were able to improve the simulation outcome, giving it a more realistic complexity by using a different simulation technique and domain as well as a different data set. Singularities and instabilities were eliminated. The results that were achieved have the potential to be helpful for novel approaches or to be extended to other methods in the development of a more accurate numerical simulation.
Keywords:
invadopodia; individual cell model; free boundary problem; finite element method; Stefan problem; level set method; phase transition; enthalpy MSC:
92-08; 92-10
1. Introduction
The term cancer encompasses a variety of diseases that are broadly categorised by abnormal cell behaviour which act differently from normal cells due to the gene mutations that alter the normal cellular instructions [1]. Tissue invasion and metastasis are one of the “hallmarks of cancer” [2,3] and the leading cause of death among cancer patients [4]. Invasion of cancer cells is the capacity of the cells to disrupt the basement membrane (BM) and secondary tumours arise when it penetrates the surrounding tissue or extracellular matrix (ECM), also referred to as metastasis.
The key factor in tumour invasion and metastasis is proteolytic deterioration of the ECM [5,6] which are propelled by actin-rich protrusions of the plasma membrane, also called invadopodia [7]. Invadopodia is also called ’invasive feet’ as it is most commonly detected on the basal surfaces of invasive cancer cells; invadopodia have the ability to invade through the ECM [8]. The morphology of invadopodia is a small punctuated finger-like protrusion or elongated shapes [9]. According to Saitou et al. [10], cancer cells can form one to ten invadopodia with a lifespan of several tens of minutes to 60 min and a size ranging from 0.05 to 2 m [11]. Numerous cell biological processes must be coordinated for the formation of invadopodia and the degradation of ECM. The formation of invadopodia and the degradation of ECM require the coordination of numerous cell biological processes. The molecular dynamics and biological phenomena related to invadopodia formation and ECM degradation are further detailed in [12]. Figure 1 depicts the scheme of invadopodia in invasive cancer cell while Figure 2 shows the role of invadopodia in cancer invasion and metastasis.
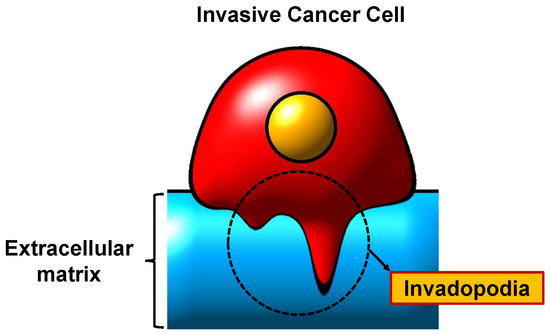
Figure 1.
A scheme of invadopodia.
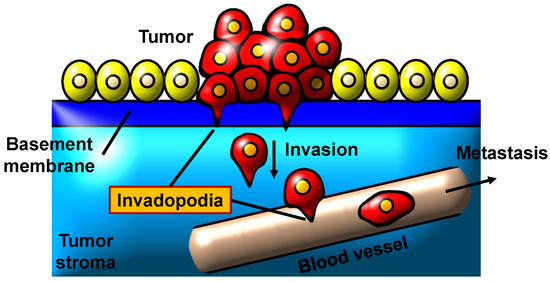
Figure 2.
Invadopodia’s role in cancer invasion and metastasis.
Over the past decade, numerous studies have been carried out to comprehend the mechanism of tumour growth and cancer invasion from a mathematical point of view using continuous and discrete models, particularly in partial differential equations (PDEs) and ordinary differential equations (ODEs) [13,14,15,16]. Some studies have been successful in capturing the structure of cancer at the tissue level [17,18]. At present, the model of cancer cell invasion at the subcellular level (single cell) is of particular interest [9,10,12,19,20,21], while numerical analysis on the cancer cell invasion model with the free boundary problem was conducted in [22].
Saitou et al. [10] investigated the formation of invadopodia by introducing mathematical models of several fundamental processes. In [10], they analysed the spatio-temporal dynamics of the model in two spatial dimensions by using the numerical computational approach. In their results, the dynamics of the model is explored, particularly in space and time for two spatial dimensions by using the Monte-Carlo approach. This study is extremely significant because it offers new insight on how invadopodia exist in cancer cells. Numerous subsequent studies built on this one by using or modifying the model presented here such as [9,12,19,20,21].
For instance, ref. [20] investigates a free boundary problem for cell protrusion formation where the aim of the paper is to model the chemical interactions between the cell and its environment during the process of invadopodia formation. They prove the free boundary problem is well-posed. They eventually exhibit the main biological feature that can be accounted for via the model which is the formation of invadopodia. Ref. [9] present a superconvergent second order Cartesian method to solve a free boundary problem with two harmonic phases coupled through the moving interface. The model was proposed to describe the formation of cell protrusions. The finite difference method (FDM) proposed in this paper consists of second-order discretisation and a new stabilised ghost fluid method.
This paper aims to improve the simulation of invadopodia formation with respect to the previous research of [12] in which the results were simulated in a two-dimensional (2D) domain and an in silico model of an individual cell was presented. Therefore, we simulated our results in a 3D domain for accurate results and conditions where the complexities of simulations are more realistic. Simulating invadopodia formation accurately in order for it to be biologically relevant is important since it helps us to understand cancer invasion and metastasis better, as well as giving some insight into investigating ways to stop the spread of this fatal disease. We note that in the previous work of [12], the simulations demonstrate the existence of singularities and instabilities. For that reason, eliminating the existence of singularities and instabilities is crucial in simulating the results for the solution to be more accurate.
2. Materials and Methods
There are two parts to this section, individual cell model and numerical scheme, in accordance with [12].
2.1. Individual Cell Model
2.1.1. Classical Solution Scheme
This subsection describes the mathematical cell-deformation model that explains the invadopodia-formation process, as depicted in Figure 3. According to [12,20], ECM is in the outer domain of the cell. We define the flux of type 1 matrix metalloproteinase (MT1-MMP) enzymes, denoted by . MT1-MMP generates ligands which is a flux-degraded matrix at the cell boundary which then diffuses into the ECM. Ligands will then activate signals that diffuse within the cell when bound to the cell membrane.
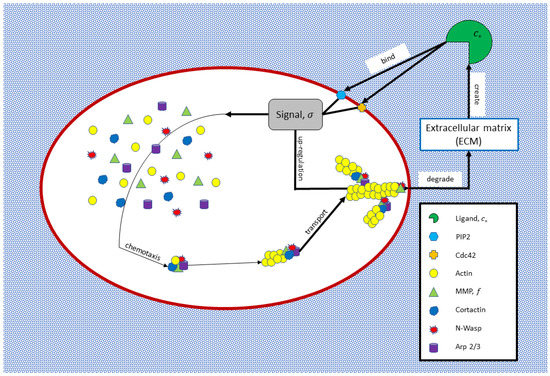
Figure 3.
An individual cell model.
The model of a single cell is described by using the Eulerian approach. Let be defined across the entire domain to detect the cell membrane. The plasma membrane is define as:
where is the Lipschitz domain indicating the cancer cell with smooth boundary, , and a particle on the moving interface is defined by x.
While the zero level set function, detects the location of the plasma membrane which satisfies:
which is a smooth level set function, whereas at the interface, is defined as the velocity of the plasma membrane:
where is a positive constant and is the signal gradient inside the cell. Keep in mind that it would be impossible for the domain to grow the shape’s volume, which can lead to discontinuity, because velocity is only defined on the boundary. Since the zero level set function takes the plasma membrane into account, velocity extension is defined throughout the entire domain to prevent discontinuity as:
where:
The cell’s plasma membrane may shrink or expand. On the plasma membrane, and MMPs, f degraded ECM and c and produced an ECM fragment that is ligands. Henceforth, the chemical reactions that occur between ECM and MMPs are derived by:
where is the reaction rate of the diffusion coefficient. Then, f and are defined inside the cell as:
Since the density of MMPs does not change during ECM fibre proteinase cutting, it can be concluded that:
We define as a one-domain inside cell. Hence:
and as an outside cell. Thus:
If the solution of to:
is denoted by , then:
The total mass of conservation of f guarantees, by Liouville’s Theorem, that the following derivations on the boundary will be produced:
As the MMPS density at the boundary will not change during cutting through the fiber-proteinases of ECM, it holds that:
Figure 4 shows a simplified version of the signalling pathways depicted in Figure 3. From Figure 4, the MMP generates ligands on the cell membrane which then diffuses into the ECM as described in (13). Ligands will then activate signals that diffuse within the cell when bound to the cell membrane as in (11). The membrane is then pushed by the interface’s normal velocity (3).
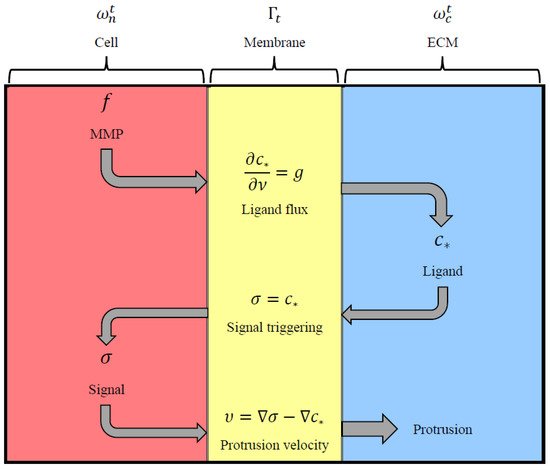
Figure 4.
A schematic representation of the molecular interactions.
2.1.2. Free Boundary Problem
In order to simulate the formation of invadopodia, we proposed velocity extension to the entire domain of the cell. The cell model from Figure 3 was simplified, as shown in Figure 5. According to [12,20], when the velocity of protrusion is not imposed, the free boundary problem enables accurate membrane localisation even when it is unknown with respect to the PDE systems. As a result, we used the cell membrane as a free boundary to distinguish between any activity occurring within and outside of cells.
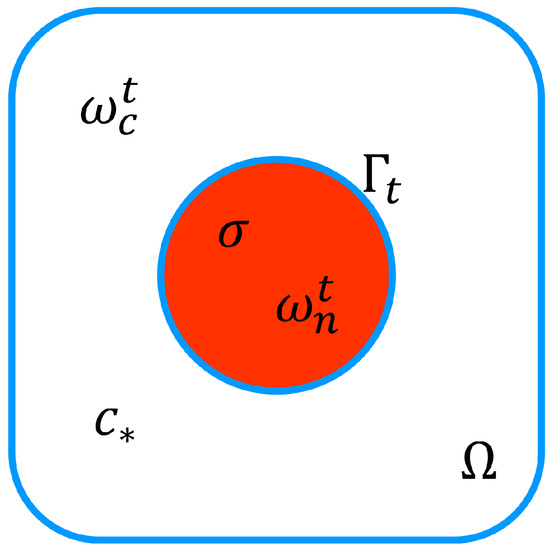
Figure 5.
A simple cell model.
Given MT1-MMP at any time on the cell membrane and signal generation for actin polymerisation is represented by:
while degradation of ECM is:
where is a diffusion coefficient. Let , considering the cell’s primary problem. Define:
Next, define the Stefan condition. Suppose that g is continuous and diffuse where if and only if ; it holds that:
Therefore:
where on .
2.2. Numerical Scheme
2.2.1. Weak Form Derivation
In this subsection, we will solve the modelling of invadopodia formation and migration of a single cell. Based on the phase-transition formulation, a mathematical model was developed to address these problems. According to [12,23,24], the problems are characterised as time-dependent differential equations with boundary conditions at an unknown interface concerning which it has to be part of the solution. Let = 1, 2, … be a smooth bounded domain and:
where represents the temperature distribution and H represents the enthalpy function.
Let be trial function:
Using integration by parts:
Hence:
2.2.2. Stefan Problems—Phase-Transition Formulation
Generally, Stefan problems is the emergence of smooth boundaries or interfaces between different phases of a substance that result from a phase transformation [12,25]. Therefore, for this research, Stefan problems are involved in the deformation of the cancer cell membrane or interfaces between inner and outer cell domains that arise from the molecular interactions to produce protrusions called invadopodia. Defining the temperature field is represented by Q and its evolution is given by:
where . On jump condition , it is taken between the inner and outer cell or otherwise the following holds:
where ℓ is the heat transfer of the cell, are the constant for thermal diffusivities on and is the outward normal vector. Setting , the problem is then simplified into finding as well as , such that:
The outward normal vector, , is defined by:
and the curvature term, , by:
From (24) and (25), expression is rewritten as:
where is the jump taken between two regions—inner and outer cell or otherwise. As a result from (5), we obtained:
where is the Stefan condition.
During the process of physical or chemical transformations, Liouville’s Theorem of the first volume of enthalpy H between two regions where it must be equal guarantees the total mass of conservation, which is in line with [26].
Based on Theorem 1 (Liouville’s Theorem) from [12], the volume of ligands that diffuse outside the cell which then bind to the cell membrane are equal to the volume of signals generated inside the cell to produce invadopodia during the molecular interactions of cell membrane deformation.
2.2.3. Cell Deformation: Free Boundary Conversion
Based on degenerate parabolic equations, we describe the boundary of the cell as free boundary. See details on this in [12]. A cell’s phase interfaces may experience sudden shifts during the phase-transition process that happen between the outer and inner cell, which can result in singularities and instabilities. During this process, invadopodia will pierce and move through the complex-appearing collagen walls.
The simulation procedure is carried out in discrete time steps as the phase-transition formulation is built on a time-dependent scheme. Phase transition begins when invadopodia start to break through a cell, a process known as invasion that is easily observed in 2D rather than 3D. Let:
where
We discretise the problem based on Euler time discretisation such that:
2.2.4. Phase-Transition Formulation
For this subsection, the density of signals, ligands and plasma membrane are time-dependent. However, only the plasma membrane is treated as free boundary. From (28), we define enthalpy, by:
if and only if . Based on Theorem 2 in [12]:
3. Results
To verify the methods, we begin our numerical simulations. We divide our results into two parts: level set method and enthalpy method (phase-transition formulation), where the results obtained will be discussed in Section 4. The PDEs are solved numerically using FreeFem++ (v 4.10) [27] using a P1 finite element method (FEM) and meshes were generated using Gmsh (v 4.9.3) [28].
3.1. Level Set Method
When dealing with moving boundaries, numerical simulations for the free boundary problem of this model encountered significant challenges. Therefore, the level set method is carried out for a single cell model, while the level set approach is used to represent the plasma membrane, in order to overcome the difficulty in dealing with moving boundaries. Let be a smooth level set function, as you may recall from Section 2.
Consider that at the start of the computation there is no signal density. ECM will degrade, create diffused ligands outside of the cell, bind to receptors and generate an internal signal as a result. Inside the cell, signal densities spread and activate actin polymerisation. We defined the boundary data as follows based on (14) and (15):
- Test 1: and level set solution as where and .
- Test 2: Modifications of equations from Test I. and level set solution as where and .
Figure 6 and Figure 7 illustrate the formation of invadopodia and protrusion at the cell’s boundary. Protrusion developed as a result of membrane displacement brought on by the presence of a signal gradient that was sparked by interactions between the membrane and the surrounding ECM.
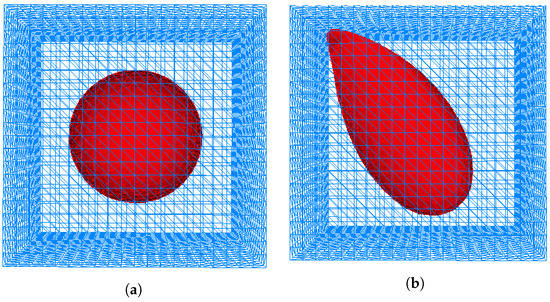
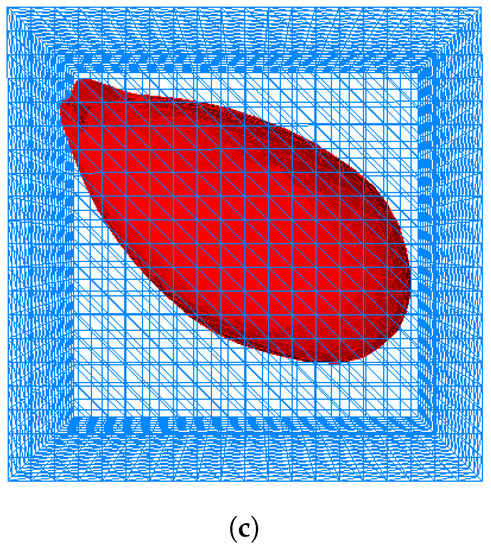
Figure 6.
Simulation of invadopodia formation with outer domain (box). (a) Initial cell shape. (b) Invadopodia formed based on Test 1. (c) Invadopodia formed based on Test 2.
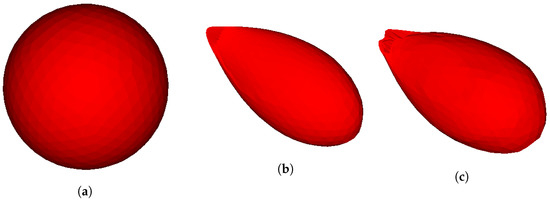
Figure 7.
Simulation of invadopodia formation without outer domain (box). (a) Initial cell shape. (b) Invadopodia formed based on Test 1. (c) Invadopodia formed based on Test 2.
3.2. Enthalpy Method
Phase transition begins when invadopodia start to break through a cell, a process known as invasion. As described previously, the plasma membrane is regarded as a free boundary and is time-dependent in this problem, although the density of signals and ligands does not change over time. Figure 8 and Figure 9 show the invasion of invadopodia and cell migration from Tests 1 and 2 based on (28).
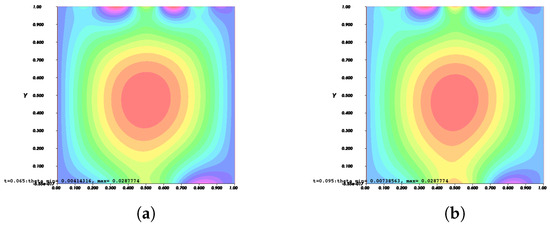
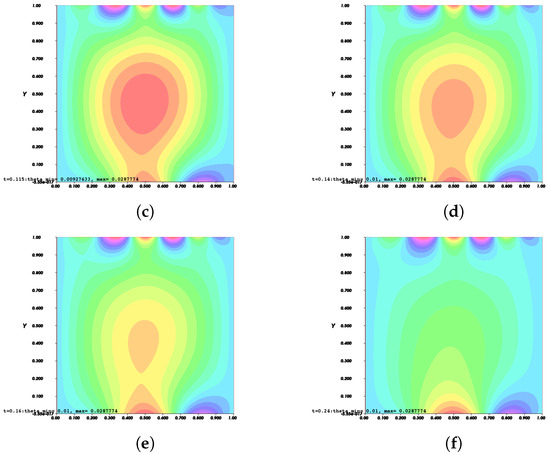
Figure 8.
Invasion of invadopodia and cell migration from Test 1 based on (28).
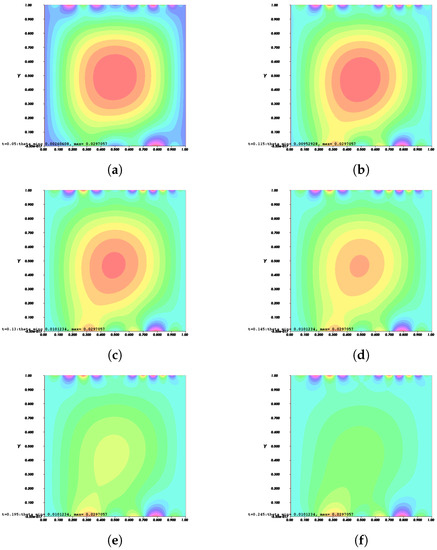
Figure 9.
Invasion of invadopodia and cell migration from Test 2 based on (28).
On the other hand, Figure 10 and Figure 11 show the invasion of invadopodia and cell migration from Tests 1 and 2 based on (31).
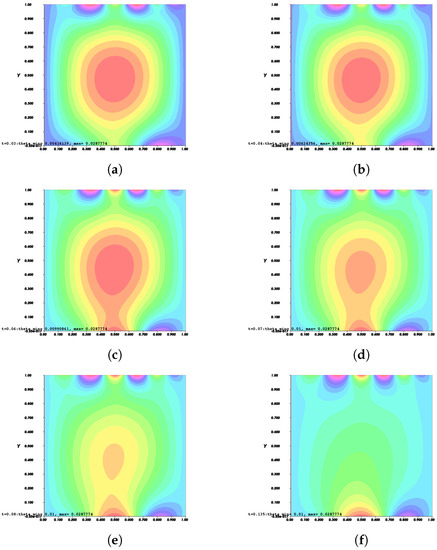
Figure 10.
Invasion of invadopodia and cell migration from Test 1 based on (31).
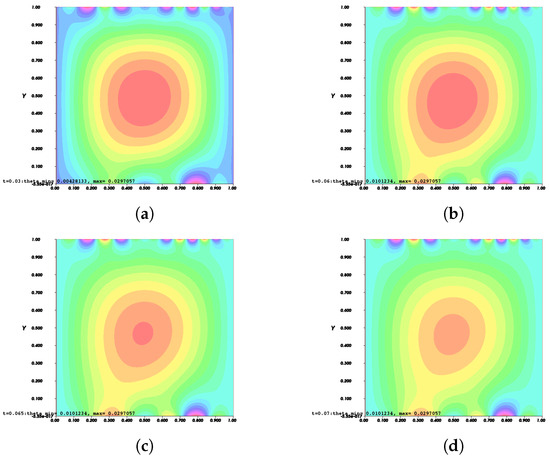
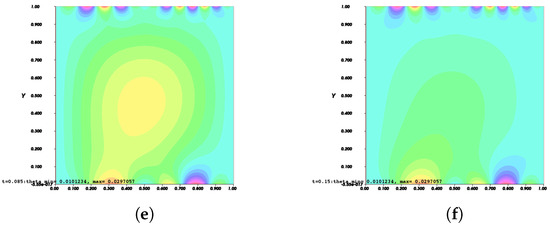
Figure 11.
Invasion of invadopodia and cell migration from Test 2 based on (31).
4. Discussion
Level set serves the purpose of dealing with cell membranes in order to denote the membrane interfaces when the problem is investigated as a free boundary because they are simple to execute and computationally inexpensive. The discountinuity in the level set function derivatives between two outer and inner cell interfaces that are near to one another can affect the estimation of velocity and curvature. As a result, the level set approach makes it straightforward to determine an interface’s curvature and velocity in order to locate the plasma membrane interface. Therefore, we define the velocity extension to the entire domain in order to prevent singularities and instabilities as described in Section 3.
In order to enhance the simulation of invadopodia formation and also to surmount singularities and instabilities that occurred in [12] as discussed in Section 1, 3D simulations were used, resulting in Figure 6 and Figure 7. The initial shape of a cell is depicted in Figure 6 and Figure 7. Figure 6a and Figure 7b illustrate the formation of invadopodia and protrusions at the cell’s boundary using Test 1 while Figure 6c and Figure 7c used Test 2. Protrusion is caused by the membrane’s displacement due to the presence of a signal gradient induced by contact of the membrane with the surrounding ECM.
As previously discussed, the authors of [12] demonstrate the existence of singularities and instabilities. On the basis of the results shown in Figure 6 and Figure 7, both instabilities and singularities have been prevented from occurring in the simulation. This could be due to the fact that Tests 1 and 2 used a different simulation technique and set of data. The graphs for level set function, for Tests 1 and 2 in Figure 12 demonstrate that the values of the level set during the deformation of the cell in both tests fluctuated.
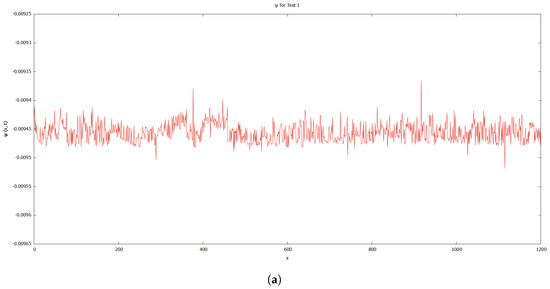
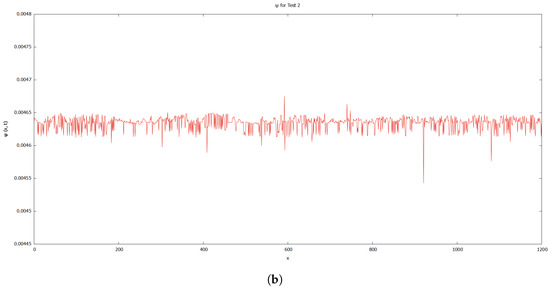
Figure 12.
Graphs for level set function, . (a) Test 1. (b) Test 2.
ECM is broken down by MT1-MMP, which also generates ligands that diffuse and attach to membrane receptors. The signal is then generated inside the cell which will spread and cause the actin molecule to polymerise. The morphology of the plasma membrane was harmed by this process. During this process, the plasma membrane begins to undergo phase transition, which can result in singularities and instabilities. Invadopodia begin to invade through the intricately patterned collagen walls in the cell’s interfaces between outer and inner cells and migration occurs.
The phase field variable in the enthalpy method (phase-transition formulation) smoothly varies between two phases over a small yet numerically resolvable thickness on the diffused interface area. As a result, it offers a hazy depiction of the thinned-out membrane interface between the outer and inner cell.
Figure 8, Figure 9, Figure 10 and Figure 11 depict the process of cell deformation that occurs when a normal cell undergoes mutation before it develops into a cancer cell. Invasion begins in a cancer cell after invadopodia protrude and begin to separate from the primary cell. The invasion process can be seen starting with Figure 8a and the movement of the invasive cancer cell is depicted in Figure 8b–e. These can also be seen in Figure 9a–e, Figure 10a–e, and Figure 11a–e. The interactions between the cell membrane and the surrounding ECM causing the cell to change and move, which in turn promotes the existence of ligands and activates the signal gradient. As time passes, the cell disperses to nearby regions as illustrated in Figure 8f–Figure 11f which then grows in various parts of the body.
The results of Figure 8 and Figure 9 indicate that the phase transition of the cell membrane based on (31) is significantly faster than (28). Moreover, (31) describes why the phase-transition problem depicted in Figure 10 and Figure 11 occurred more rapidly than in Figure 8 and Figure 9. In (31), it is presumed that the concentration of MT1-MMP, f, embedded in the cell membrane degrades the ECM by contact and that the signal density equals the function , which also represents MT1-MMP at any time, t, at the interface based on (16), while (28) only evaluates the signal or ligand density.
When compared to [12], our findings demonstrate that phase transition occurred more slowly. The simulation results of Figure 8, Figure 9, Figure 10 and Figure 11 show that as protrusion took place, the cell began to migrate through the ruptured membrane and as protrusion velocity decreased, it showed that the formation of invadopodia had stabilised. As the amount of time increases and the distance from the primary cell increases, the position of the phase-transition interface diminishes, as well as the density of the signal. Figure 13 depicts the graphs for density of signals and ligands, , during the cancer cell’s phase transition for Tests 1 and 2, where the values fluctuated in both tests. Figure 14 displays the graphs also for density of signals and ligands during phase transition of cancer cell, , but with MT1-MMP enzyme flux, g, also for Tests 1 and 2 which likewise fluctuate.
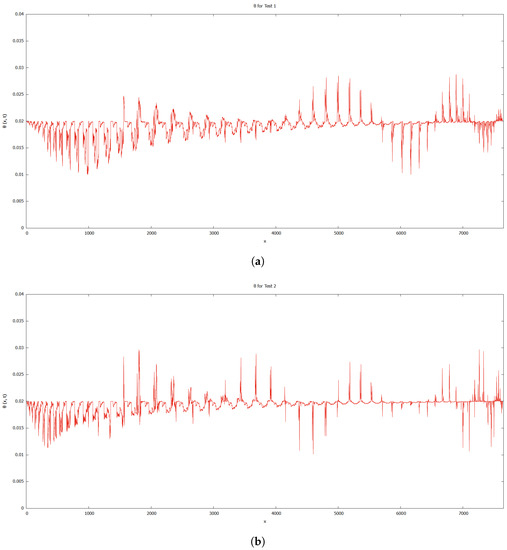
Figure 13.
Graphs for density of signals and ligands, . (a) Test 1. (b) Test 2.
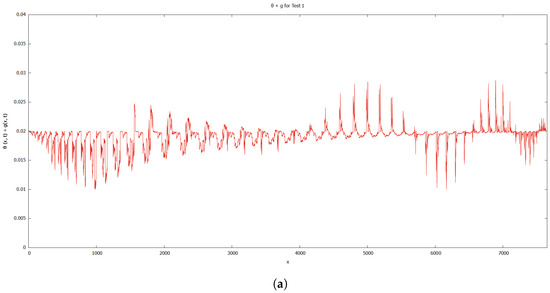
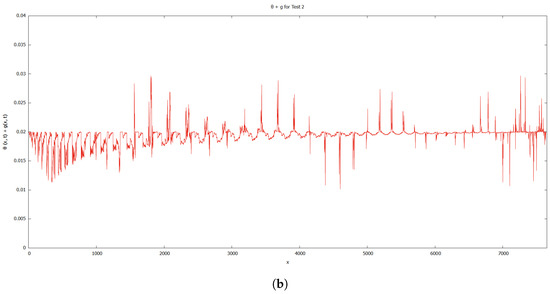
Figure 14.
Graphs for density of signals and ligands with MT1-MMP enzyme flux, . (a) Test 1. (b) Test 2.
5. Conclusions
We created a numerical method, based on the level set technique and the phase-transition formulation (enthalpy method), to address the Stefan problem of invadopodia formation. FreeFem++ and Gmsh were used to carry out all described methods. Phase-transition problems in cancer cells were created using phase-transition formulation and level set was used to determine the location of the membrane using the zero level function of . The enthalpy technique was shown to be effective and precise in solving this kind of issue. Both approaches were used to mathematically resolve the deformation and invasion of cancer cells, where protrusions were caused by the presence of invadopodia and invasion was caused when the cancer cell began to disseminate to another area of the body. In addition to this, we were able to enhance the simulation outcome from [12] to a more realistic complexity for the solution to be accurate by using a different simulation technique and domain as well as a different data set for Tests 1 and 2. Singularities and instabilities were eliminated. The results that were achieved in this paper have the potential to be helpful for novel approaches or extended to other methods in the development of a more accurate numerical simulation.
Author Contributions
Methodology, T.S. and N.L.O.; software, M.A.R. and N.L.O.; writing—original draft preparation, M.A.R.; writing—review and editing, N.L.O.; supervision, N.L.O.; funding acquisition, T.S. All authors have read and agreed to the published version of the manuscript.
Funding
This work is supported partly by JST-CREST JPMJCR2022.
Data Availability Statement
No new data were created or analysed in this study. Data sharing is not applicable to this article.
Conflicts of Interest
The authors declare no conflict of interest.
Abbreviations
The following abbreviations are used in this manuscript:
| BM | basement membrane |
| ECM | extracellular matrix |
| PDE | partial differential equation |
| ODE | ordinary differential equation |
| 2D | two-dimensional |
| 3D | three-dimensional |
| TLA | Three letter acronym |
| LD | Linear dichroism |
| FDM | finite difference method |
| FEM | finite element method |
| MMP | matrix metalloproteinases |
| MT1-MMP | type 1-matrix metalloproteinases |
References
- Preziosi, L. Cancer Modelling and Simulation; Chapman Hall/CRC Press: Boca Raton, FL, USA, 2003. [Google Scholar]
- Hanahan, D.; Weinberg, R.A. The hallmarks of cancer. Cell 2000, 100, 57–70. [Google Scholar] [CrossRef]
- Hanahan, D.; Weinberg, R.A. Hallmarks of cancer: The next generation. Cell 2011, 144, 646–674. [Google Scholar] [CrossRef] [PubMed]
- Sporn, M.B. The war on cancer. Lancet 1996, 347, 1377–1381. [Google Scholar] [CrossRef] [PubMed]
- Andasari, V.; Chaplain, M.A.J. Intracellular modelling of cell-matrix adhesion during cancer cell invasion. Math. Mod. Nat. Phen. 2012, 7, 29–48. [Google Scholar] [CrossRef]
- Andasari, V.; Roper, R.T.; Swat, M.H.; Chaplain, M.A.J. Integrating intracellular dynamics using CompuCell3D and Bionetsolver: Applications to multiscale modelling of cancer cell growth and invasion. PLoS ONE 2012, 7, e33726. [Google Scholar] [CrossRef] [PubMed]
- Stylli, S.S.; Kaye, A.H.; Lock, P. Invadopodia: At the cutting edge of tumour invasion. J. Clin. Neurosci. 2008, 15, 725–737. [Google Scholar] [CrossRef] [PubMed]
- Weaver, A.M. Invadopodia. Curr. Biol. 2008, 18, R362–R364. [Google Scholar] [CrossRef]
- Gallinato, O.; Poignard, C. Superconvergent second order Cartesian method for solving free boundary problem for invadopodia formation. J. Comput. Phys. 2017, 339, 412–431. [Google Scholar] [CrossRef]
- Saitou, T.; Rouzimaimaiti, M.; Koshikawa, N.; Seiki, M.; Ichikawa, K.; Suzuki, T. Mathematical modeling of invadopodia formation. J. Theo. Biol. 2012, 298, 138–146. [Google Scholar] [CrossRef] [PubMed]
- Murphy, D.A.; Courtneidge, S.A. The ’ins’ and ’outs’ of podosomes and invadopodia: Characteristics, formation and function. Nat. Rev. Mol. Cell Biol. 2011, 12, 413–426. [Google Scholar] [CrossRef]
- Loling Othman, N.; Suzuki, T. Free Boundary Problem of Cell Deformation and Invasion. In Proceedings of the Methods of Mathematical Oncology: Fusion of Mathematics and Biology, Osaka, Japan, 26–28 October 2020; pp. 107–123. [Google Scholar]
- Anderson, A.R.A.; Chaplain, M.A.J.; Newman, E.L.; Steele, R.J.C.; Thompson, A.M. Mathematical modelling of tumour invasion and metastasis. Comput. Math. Methods Med. 2000, 2, 129–154. [Google Scholar] [CrossRef]
- Chaplain, M.A.J.; Lolas, G. Mathematical modelling of cancer invasion of tissue: Dynamic heterogeneity. Net. Hetero. Med. 2006, 1, 399–439. [Google Scholar] [CrossRef]
- Ramis-Conde, I.; Chaplain, M.A.J.; Anderson, A.R.A. Mathematical modelling of cancer cell invasion of tissue. Math. Comput. Modelling 2008, 47, 533–545. [Google Scholar] [CrossRef]
- Chaplain, M.A.J.; Lachowicz, M.; Szymańska, Z.; Wrzosek, D. Mathematical modelling of cancer invasion: The importance of cell–cell adhesion and cell–matrix adhesion. Math. Models Methods Appl. Sci. 2011, 21, 719–743. [Google Scholar] [CrossRef]
- Chaplain, M.A.J.; Lolas, G. Mathematical modelling of cancer cell invasion of tissue: The role of the urokinase plasminogen activation system. Math. Models Methods Appl. Sci. 2005, 15, 1685–1734. [Google Scholar] [CrossRef]
- Andasari, V.; Gerisch, A.; Lolas, G.; South, A.P.; Chaplain, M.A.J. Mathematical modeling of cancer cell invasion of tissue: Biological insight from mathematical analysis and computational simulation. J. Math. Biol. 2011, 63, 141–171. [Google Scholar] [CrossRef]
- Admon, M.A.B. Mathematical Modeling and Simulation in an Individual Cancer Cell Associated with Invadopodia Formation. Ph.D. Thesis, Osaka University, Suita, Japan, 2015. [Google Scholar]
- Gallinato, O.; Ohta, M.; Poignard, C.; Suzuki, T. Free boundary problem for cell protrusion formations: Theoretical and numerical aspects. J. Math. Biol. 2017, 75, 263–307. [Google Scholar] [CrossRef]
- Yaacob, N.; Shafie, S.; Suzuki, T.; Admon, M.A. Level set method for free boundary of invasive cancer cell using different functions of matrix metalloproteinases. J. Phys. Conf. Ser. 2021, 1988, 012020. [Google Scholar] [CrossRef]
- Mahemuti, R.; Muhammadhaji, A.; Suzuki, T. Research on the Solution of Cell Invasion Model with Free Boundary. Open J. Appl. Sci. 2017, 7, 242. [Google Scholar] [CrossRef]
- Crank, J. The Mathematics of Diffusion; Oxford University Press: Oxford, UK, 1979. [Google Scholar]
- Groot, R.D. Second order front tracking algorithm for Stefan problem on a regular grid. J. Comput. Phys. 2018, 372, 956–971. [Google Scholar] [CrossRef]
- Chen, S.; Merriman, B.; Osher, S.; Smereka, P. A simple level set method for solving Stefan problems. J. Comput. Phys. 1997, 135, 8–29. [Google Scholar] [CrossRef]
- Hansen, J.P.; McDonald, I.R. Theory of Simple Liquids: With Applications to Soft Matter; Academic Press: Cambridge, MA, USA, 2013. [Google Scholar]
- Hecht, F. New development in FreeFem++. J. Numer. Math. 2012, 20, 251–265. [Google Scholar] [CrossRef]
- Geuzaine, C.; Remacle, J.F. Gmsh: A 3-D finite element mesh generator with built-in pre-and post-processing facilities. J. Comput. Phys. 2009, 79, 1309–1331. [Google Scholar] [CrossRef]
Disclaimer/Publisher’s Note: The statements, opinions and data contained in all publications are solely those of the individual author(s) and contributor(s) and not of MDPI and/or the editor(s). MDPI and/or the editor(s) disclaim responsibility for any injury to people or property resulting from any ideas, methods, instructions or products referred to in the content. |
© 2023 by the authors. Licensee MDPI, Basel, Switzerland. This article is an open access article distributed under the terms and conditions of the Creative Commons Attribution (CC BY) license (https://creativecommons.org/licenses/by/4.0/).