Article

Mathematical Modelling of Fused Deposition Modeling (FDM) 3D Printing of Poly Vinyl Alcohol Parts through Statistical Design of Experiments Approach

1
Faculty of Arts, Science and Technology, University of Northampton, Northampton NN1 5PH, UK
2
Department of Mechanics, Mathematics and Management, Polytechnic University of Bari, Via Orabona 4, 70125 Bari, Italy
3
Department of Mechanical Engineering, École de Technologie Supérieure, 1100 Notre-Dame West, Montreal, QC H3C 1K3, Canada
4
Department of Mechanical Engineering, University of Zakho, Dahouk 42001, Iraq
5
Center for Structural Integrity, Micromechanics, and Reliability of Materials (CIEFMA)-Department of Materials Science and Engineering, Universitat Politècnica de Catalunya-BarcelonaTECH, 08019 Barcelona, Spain
6
Gas Turbine and Transmissions Research Centre, University of Nottingham, Northampton NN1 5PH, UK
7
Department of Applied Physics and Electronics, Umeå Universitet, 90187 Umeå, Sweden
*
Author to whom correspondence should be addressed.
Mathematics 2023, 11(13), 3022; https://doi.org/10.3390/math11133022
Submission received: 21 May 2023 / Revised: 28 June 2023 / Accepted: 4 July 2023 / Published: 7 July 2023
(This article belongs to the Special Issue Advances in Control Systems and Automatic Control)

Abstract

:
This paper explores the 3D printing of poly vinyl alcohol (PVA) using the fused deposition modeling (FDM) process by conducting statistical modeling and optimization. This study focuses on varying the infill percentage (10–50%) and patterns (Cubic, Gyroid, tri-hexagon and triangle, Grid) as input parameters for the response surface methodology (DOE) while measuring modulus, elongation at break, and weight as experimental responses. To determine the optimal parameters, a regression equation analysis was conducted to identify the most significant parameters. The results indicate that both input parameters significantly impact the output responses. The Design Expert software was utilized to create surface and residual plots, and the interaction between the two input parameters shows that increasing the infill percentage (IP) leads to printing heavier samples, while the patterns do not affect the weight of the parts due to close printing structures. On the contrary, the discrepancy between the predicted and actual responses for the optimal samples is below 15%. This level of error is deemed acceptable for the DOE experiments.

1. Introduction

3D printing, also known as additive manufacturing, is a process of creating a physical object from a digital model [1]. The object is built up layer-by-layer using a variety of materials such as plastic, metal, or resin [2,3]. 3D printing can be used to create a wide range of objects, from small figurines to complex mechanical parts [4]. This technology has become increasingly popular in recent years and is used in industries such as manufacturing, healthcare, and architecture [5,6,7]. There are several types of 3D printing technologies. Fused deposition modeling (FDM) is a technology that builds objects by heating and extruding thermoplastic filaments layer-by-layer [8,9]. PVA (polyvinyl alcohol) is a water-soluble support material commonly used in FDM 3D printing [10,11,12,13]. PVA filament is extruded alongside the primary material and acts as a support structure for complex or overhanging parts of 3D printing [14,15,16].
Padhi et al. [17] investigated how layer thickness affects ABSP 400 samples, while Gardan et al. [18] focused on improving the quality of parts produced using two different methods. Peng et al. [19] examined how layer thickness, filling speed, extrusion speed, and line width influence build time and dimensions. They utilized a fuzzy inference system to convert three responses into a single output and employed the response surface methodology (RSM) to establish the relationship between four input parameters and comprehensive output. MATLAB software was also utilized to implement a fitness function in the genetic algorithm. The results suggested that this approach could significantly enhance the accuracy and efficiency of the FDM process. Sajan et al. [20] conducted a study to enhance the surface quality of ABS (acrylonitrile butadiene styrene) filaments, taking into account five 3D printer input parameters, including printing speed, layer thickness, and infill percentage. For optimization, they employed the Taguchi method to achieve high-quality surface finishes. The results showed that the surface quality improved in the XY and XZ planes. The compressive effect of FDM-made ABS Kagome truss unit cells was studied by Gautam et al. [21]. As carbon fiber was added to the composite filaments during the FDM process, Ning et al. [22] looked at the characteristics of carbon-fiber-reinforced plastic (CFRP) composite parts. Due to the cohesiveness of the material, standard production techniques, such as plastic molding, can provide sufficient tensile strength. However, additive manufacturing can produce parts with weaker mechanical qualities, including electrical and thermal conductivity, optical clarity, and strength. This study used the design of experiment (DOE) method and input parameter adjustments to improve the mechanical properties of FDM components [23,24,25,26]. Examining the mechanical properties of samples through various tests, including tensile, roughness, and bending tests, is crucial for optimizing the 3D printing process in polymers. Acquiring sufficient information and identifying patterns in the fabrication of printed parts have a significant influence on the resulting mechanical properties [27,28,29]. Furthermore, the utilization of artificial intelligence (AI) and machine learning techniques offers a promising avenue to mitigate errors encountered during sample fabrication. By leveraging machine-learning algorithms, it becomes feasible to identify and rectify issues that may arise during or after the printing process. The integration of AI-based approaches can greatly enhance the overall quality and performance of printed samples, further advancing the optimization of 3D printing in polymer-based applications [30,31].
In this study, eleven samples of polyvinyl alcohol (PVA) filament were printed using FDM, in which two important parameters, infill percentage (IP) and printing pattern, were considered as an input parameter. Design of experiment (DOE) utilized the RSM to design the 3D printing experiments. Responses in this experiment were modulus, elongation at break, and weight of samples. The optimization was arranged to optimize two input parameters to reach the goals for each response. The simultaneous optimization of responses for PVA samples, considering multi-pattern printing, was investigated in this study for the first time. The aim was to assess the effect of these input parameters on the quality of fabricated samples.

2. Methodology and Experimental Work

2.1. Methodology

Statistical modeling used in this paper involves the implementation of statistical techniques to model and understand the behavior of the 3D printing process. Statistical modeling utilized for characterizing the relationships between process parameters, material properties, and the quality of the printed parts. It allows for the identification of key factors that influence the process and helps in optimizing the process settings to achieve desired outcomes. On the other hand, mathematical optimization is used to focus on finding the best possible solution within a given set of constraints. It involves formulating an objective function and identifying the optimal values of the decision variables that maximize or minimize the objective function. In the context of 3D printing, mathematical optimization is used to determine the optimal combination of process parameters to achieve specific objectives defined in optimization section.
A response variable and many predictor variables are modeled and analyzed using the statistical design of experiments approach known as RSM [32,33]. Finding the ideal set of predictor variables that yields the highest (or lowest) response value is the aim of RSM [34,35]. By fitting a polynomial equation to the data, one creates a mathematical model of the response surface, which is then used to determine the input variables that lead to the desired response using optimization techniques. RSM has a wide range of applications, including control, process optimization, and product design [36]. The RSM procedure is iterative and calls for careful consideration of the DOE selection, model choice, and optimization methods applied (Figure 1).
Making educated judgments regarding product design, process optimization, and control can benefit from understanding the correlations between the response variable and predictor factors through the application of the RSM data. In Table 1, the independent process parameters with design levels were depicted. Design levels refer to the different settings or values assigned to a factor or independent variable in an experimental design.
This RSM design includes a center point (Infill Percentage: 30, Pattern: Tri-Hexagonal) that is replicated three times to assess the lack of fit and provide an estimation of the experimental error. The Design Expert software also suggests a fractional factorial design to evaluate the main effects of the two parameters at different levels efficiently. This design requires 8 experiments. Therefore, the total number of experiments recommended by the Design Expert software for this RSM design with two parameters and 5 levels is 11 (center point 3 replications + 8 factorial points). In Table 2, the input parameters and responses as well as the relative error of mathematical model predictions were reported.

2.2. Experimental Work

Solid Work software was used to draft the dimensions of the specimen then the specimen can be saved in a file type, such as SLDPRT, or can be imported as an STL file. The created STL file created can be used as an input to the 3D printing machines for further printing. The material we used for the study was a PVA filament; each specimen was printed using a PVA filament on an Ultimaker FDM 3D printer.
Polyvinyl alcohol (PVA) holds significant importance as a structural material for 3D printing, especially for support structures. PVA is a biodegradable and non-toxic material, making it an environmentally friendly choice for support structures.
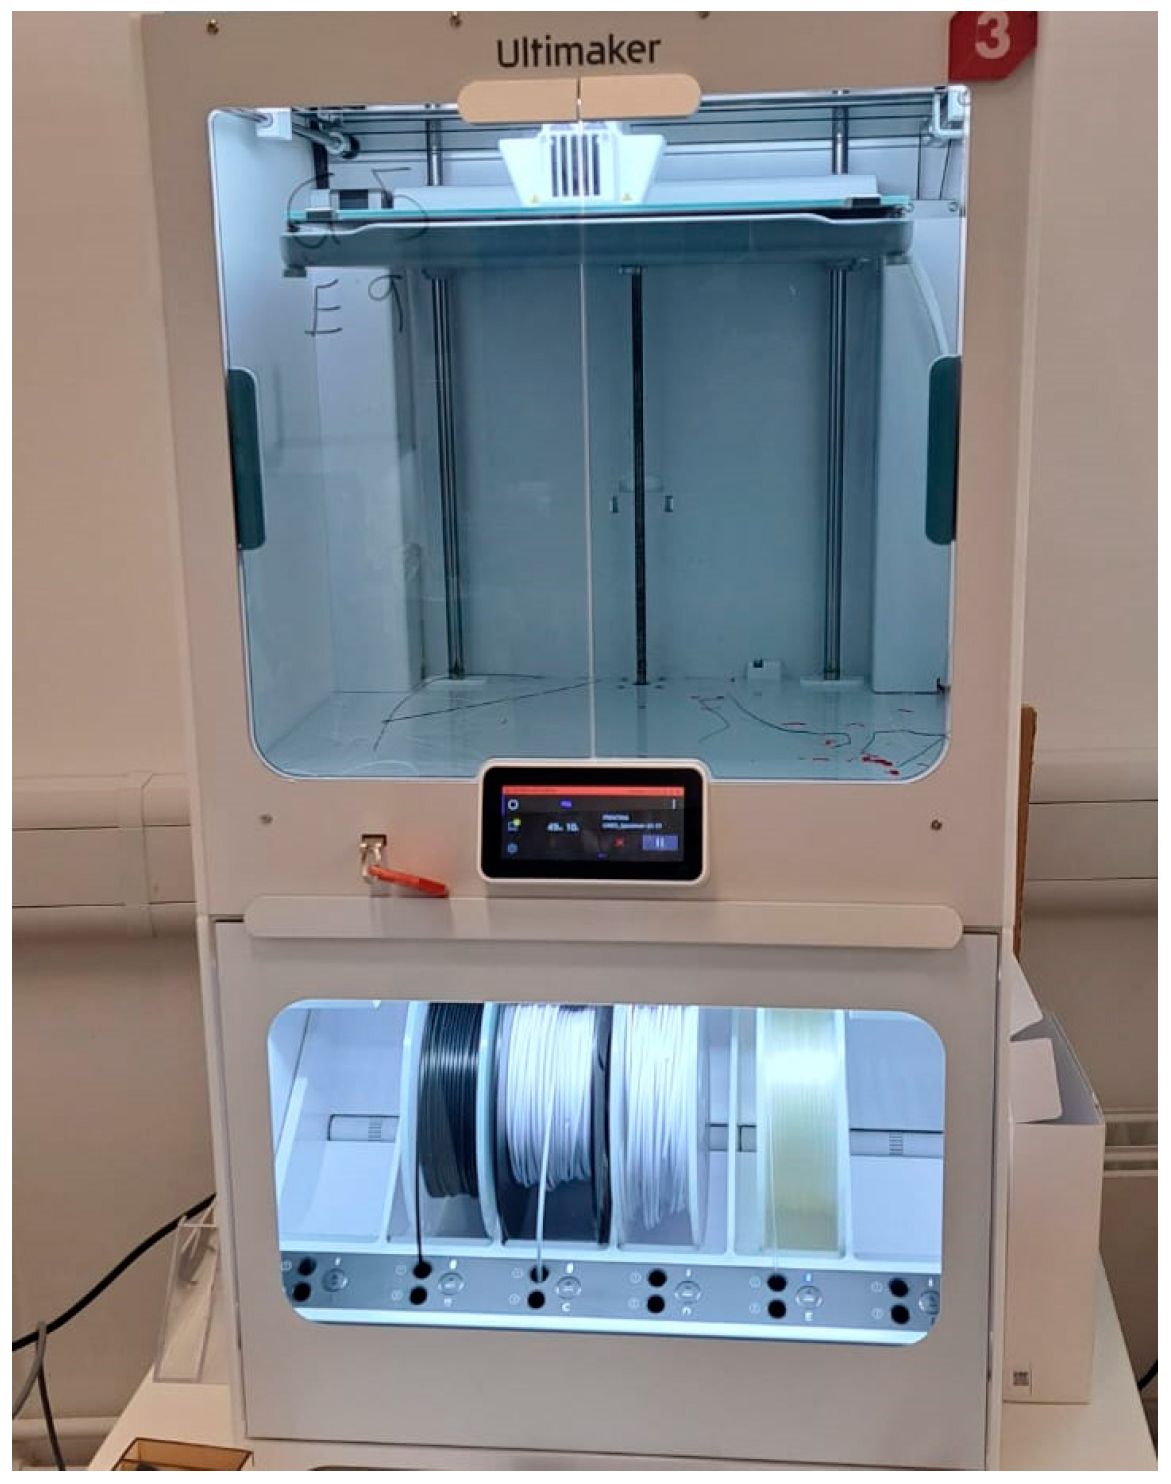
Figure 2 shows the 3D-printer device which was used in this study. The IP rates are based on the design done in the previous study [2].
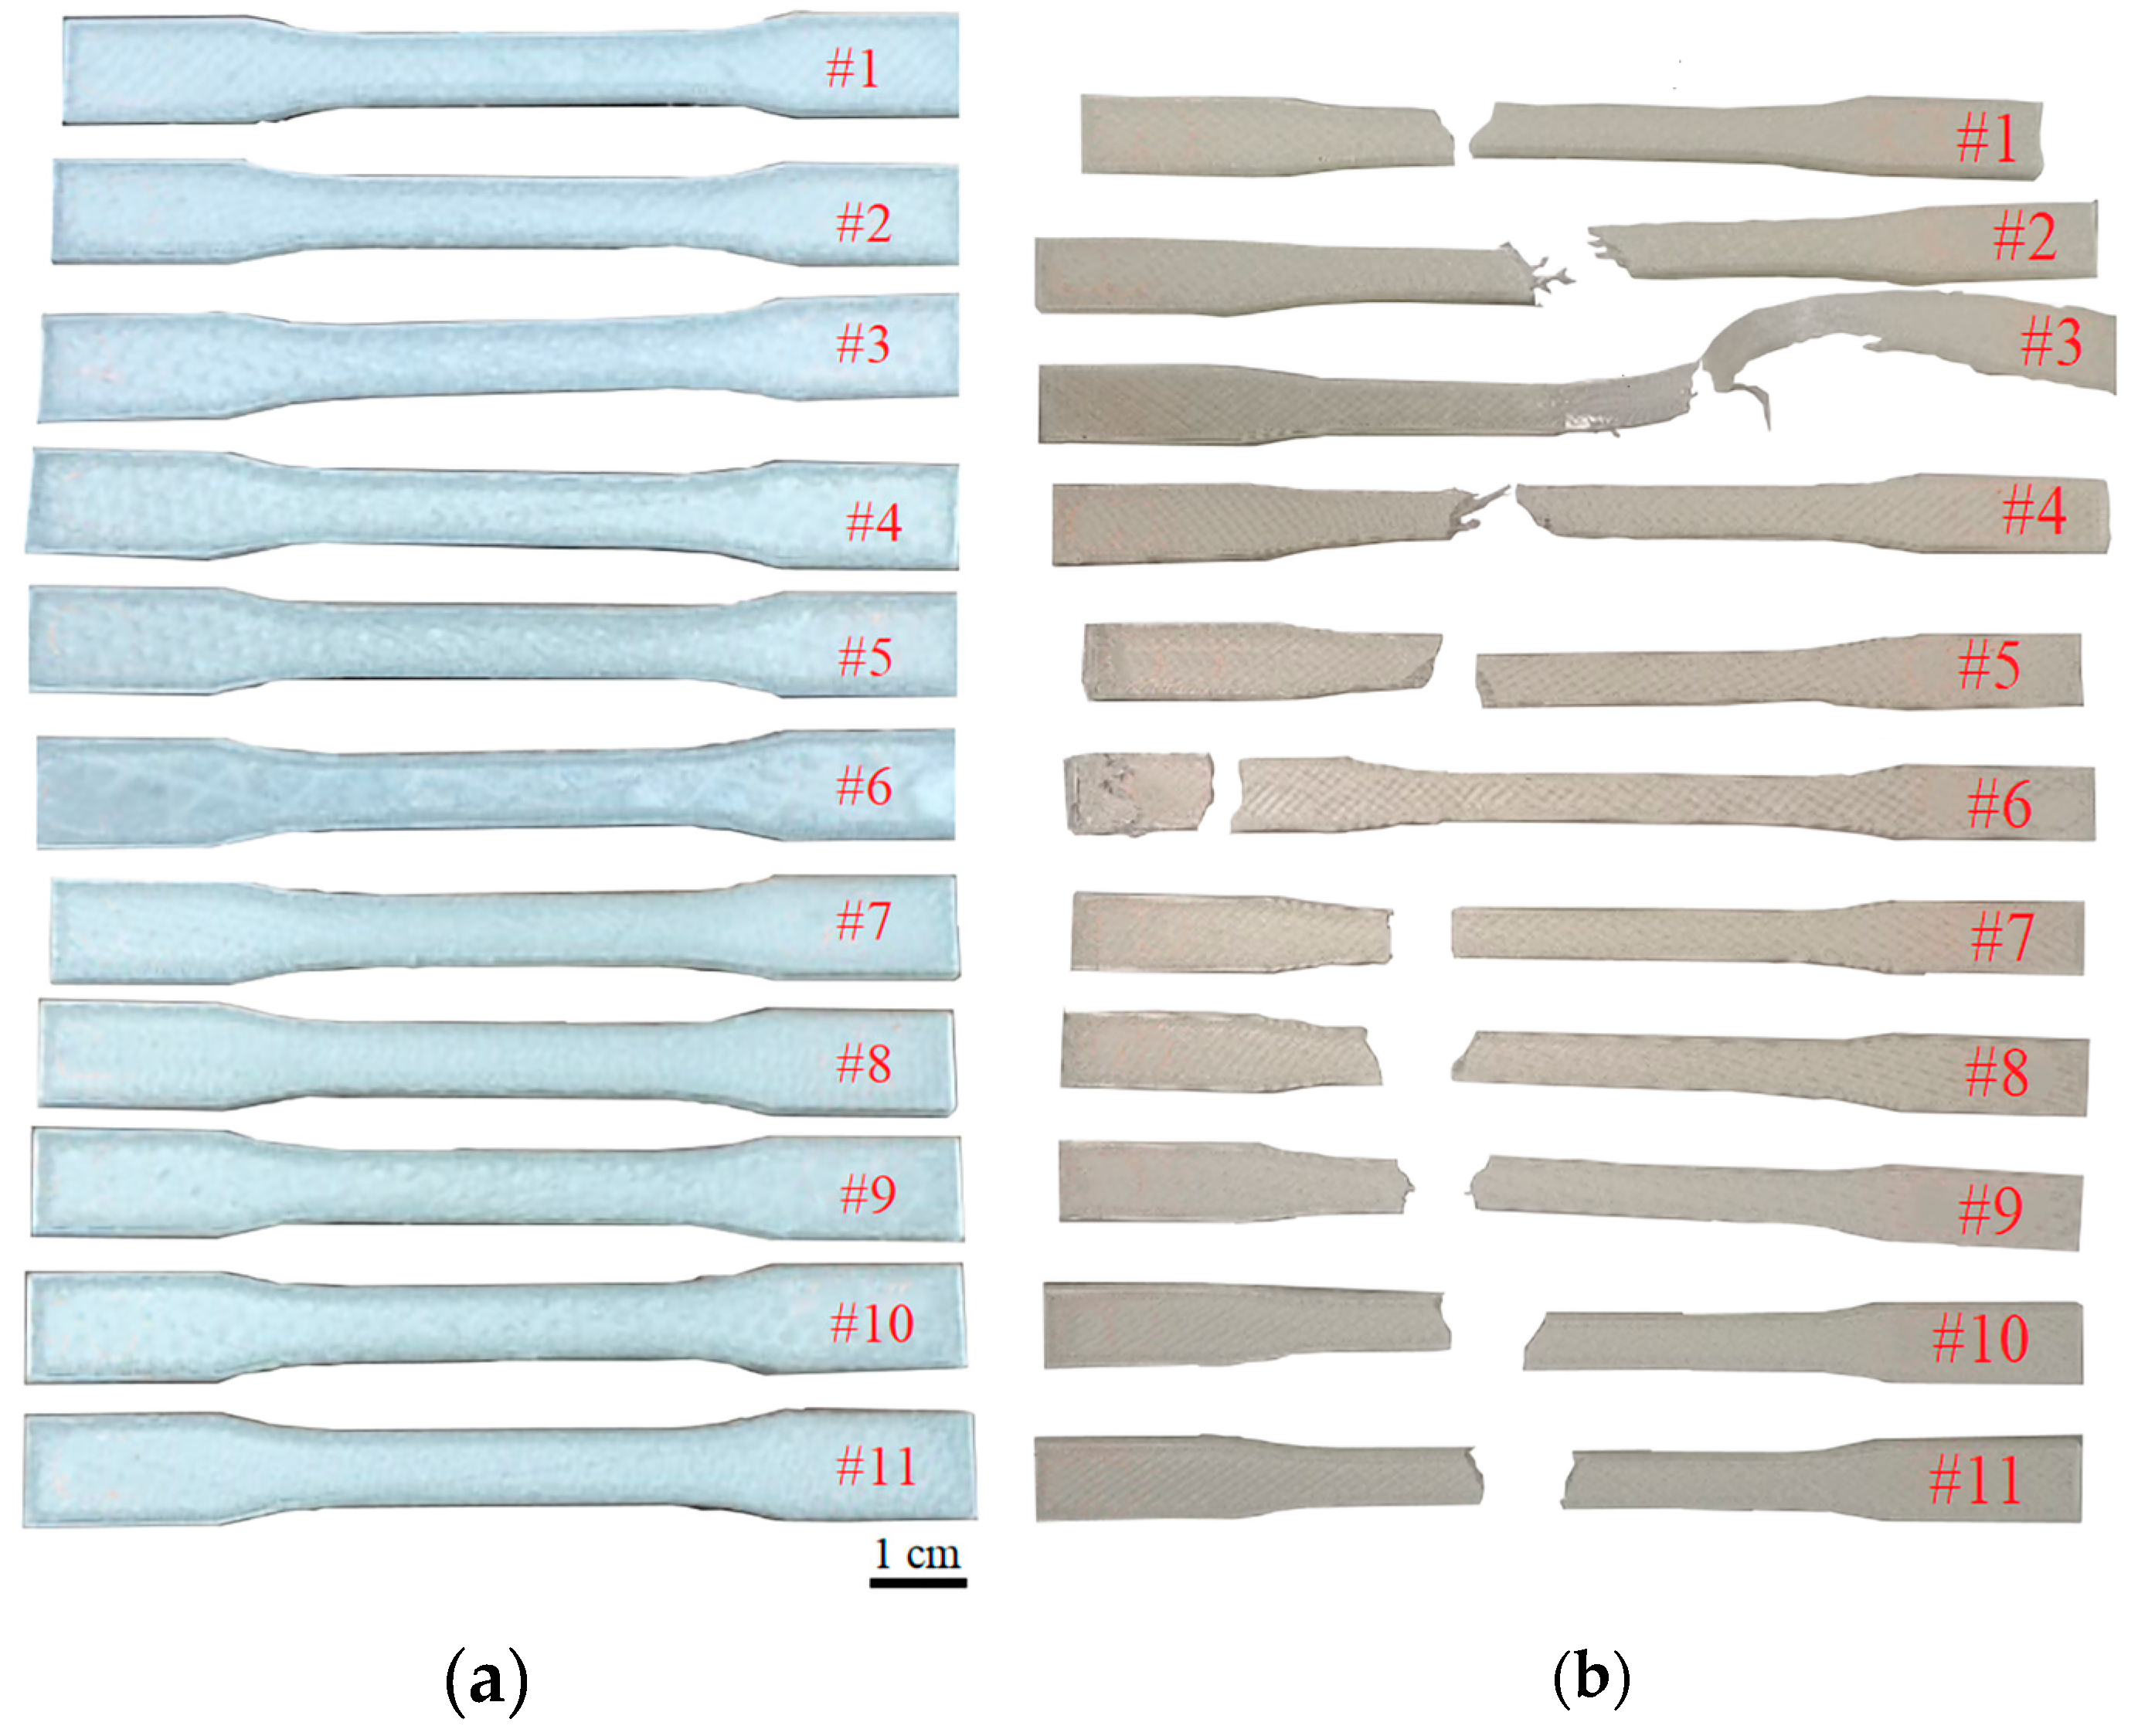
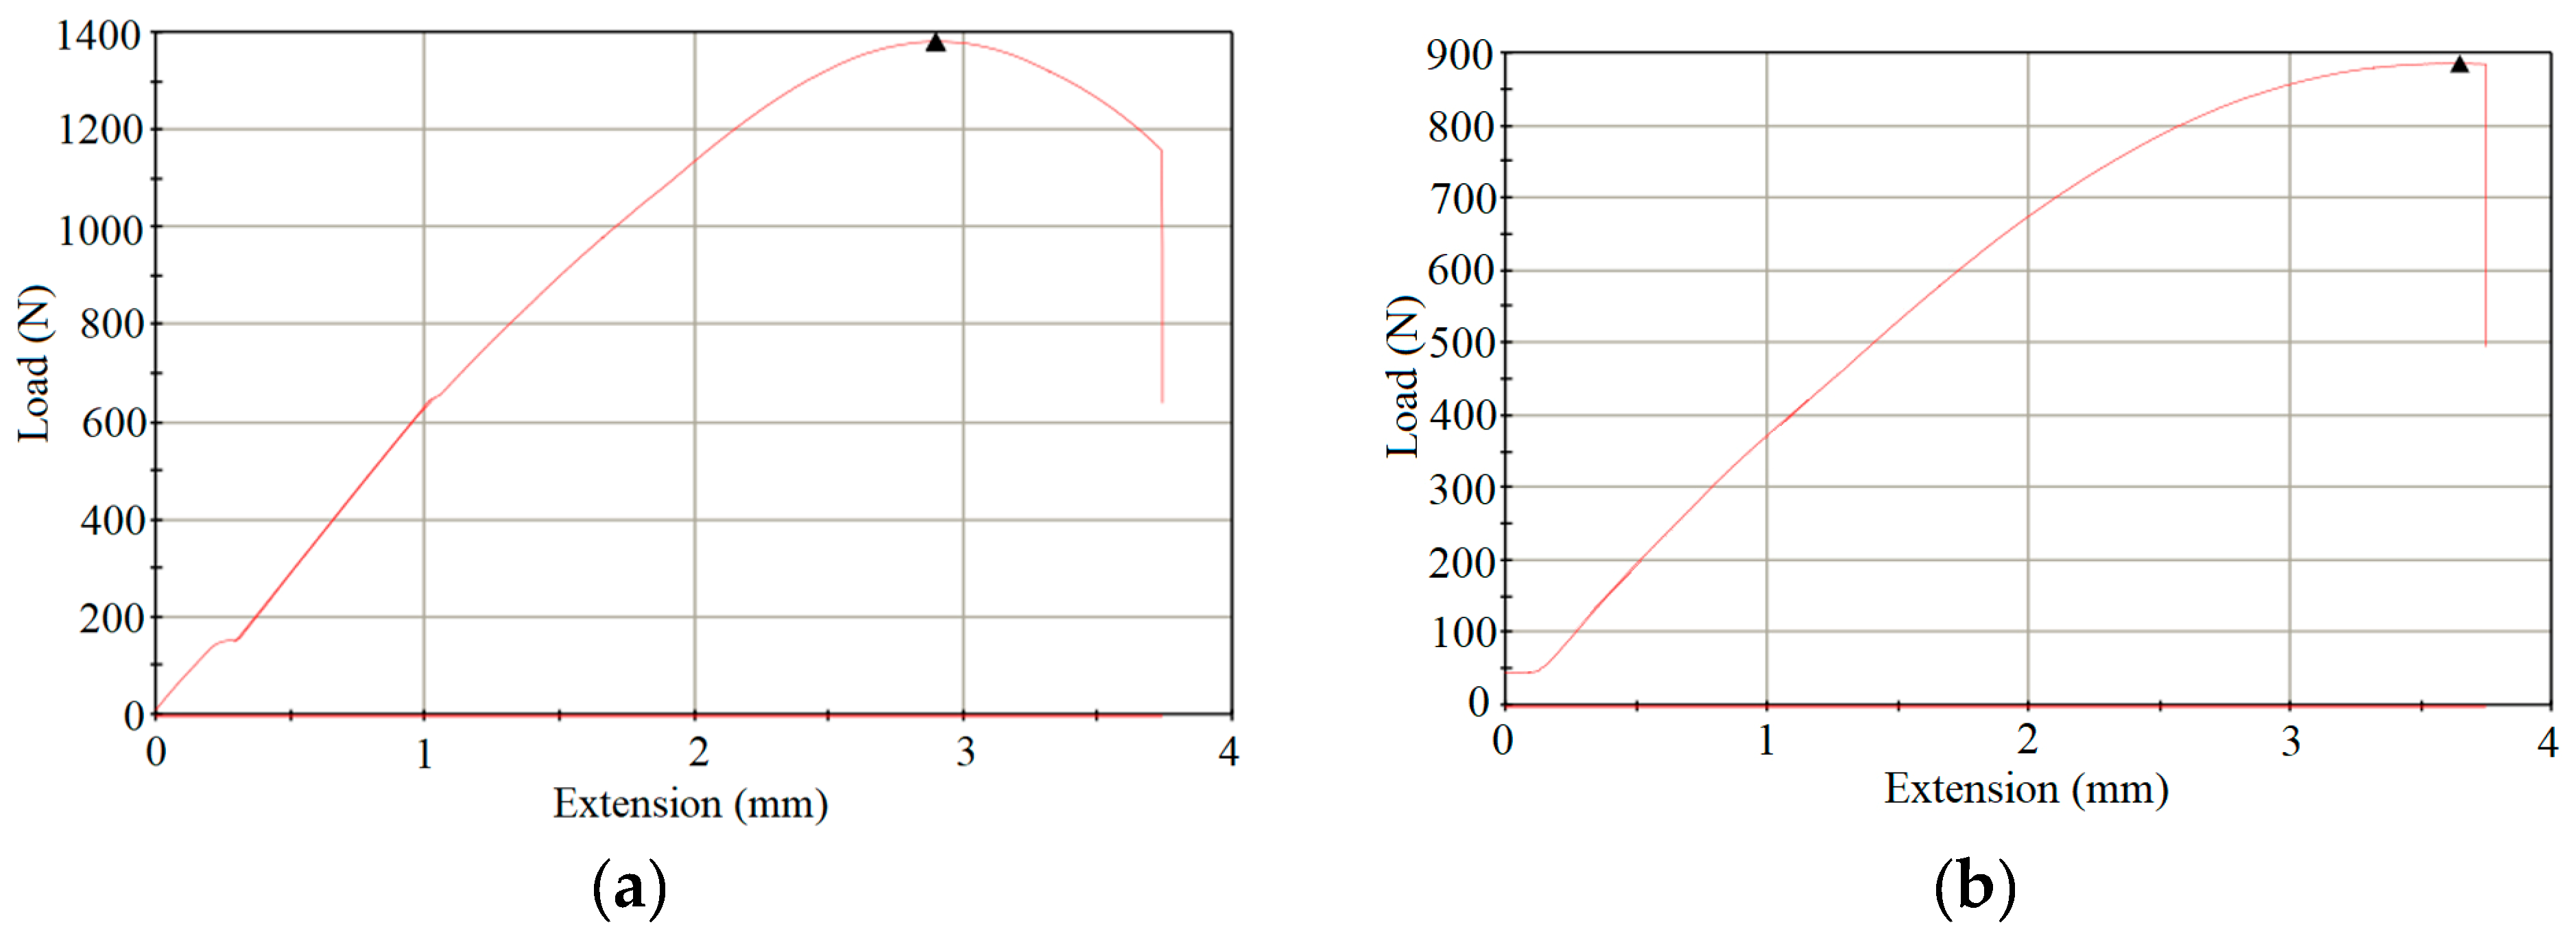
The 3D model is sliced into thin layers using slicing software, which converts the 3D model into machine-readable code. The slicing software also generates a toolpath for the 3D printer, indicating the path that the extruder should follow to build the object. The filament is then melted to a temperature that is specific to the material being used. The melted filament is deposited layer-by-layer onto the build platform, following the toolpath generated using the slicing software. The extruder moves in the X and Y axes, while the build platform moves in the Z axis. After each layer is deposited, it cools and solidifies. The build platform then moves down slightly, and the next layer is deposited on top. After the object is finished printing, it is removed from the build platform and any support structures are removed. After the print is complete, the PVA can be easily removed by soaking the object in water, leaving behind a smooth surface and intricate details. After printing, the specimen underwent post-processing in which the edges were chipped off. Along with other procedures that looked at the product’s weight and production time, tensile tests were carried out to disclose mechanical qualities. The specimen was stretched until it was broken, and the corresponding elongation and stress were noted. According to ASTM D638 2003, dog-bone-shaped specimens are advised for uniaxial tension testing to lessen the impact of stress concentrations brought on the loading grips. ASTM D638 provides information on appropriate specimen dimensions. Specimens for the current test are also a Dog bone shape and its design dimensions are in close resemblance with the dimensions specified as per ASTM D638 2003 (Figure 3a). While measuring the dimensions, it was found that the length was 164.5 mm and the thickness was between 3.94 mm and 4.02 mm, which is close to the design. The weight of the specimen was found to be between 8.37 gm and 9.87 gm. The printed specimens contained sharp edges and excess material; under the post-processing stage, the sharp edges were filed, and the excess thin film was removed using a plier before being taken for a tensile test. The specimen is stretched until it breaks and the elongation at that point is noted (Figure 3b). Moreover, Figure 4 shows some sample tensile test diagrams.

3. Result and Discussion

Each sample was mounted on the tensile test machine and stretched. The output values that we obtained are Young’s modulus, elongation at break, and samples’ weight, which need to be tabulated for the optimization process.

3.1. Modulus

The ANOVA Table 3 provides valuable insights into the effective parameters in the 3D-printing process of PVA samples and their respective effects. By analyzing this table, researchers can identify the key factors that significantly impact the outcome of the 3D-printing process. Equation (1) represents the regression model, which includes the coefficients associated with each input parameter in the 3D-printing process. These coefficients quantify the magnitude and direction of the influence of each input parameter on the response variable. By examining the values of these coefficients, researchers can determine which input parameters have a substantial impact on the outcome of the 3D-printing process. The coefficients derived from Equation (1) provide valuable information about the relationship between the input parameters and the response variable. A positive coefficient indicates that increasing the corresponding input parameter would lead to an increase in the response variable, while a negative coefficient suggests that increasing the input parameter would result in a decrease in the response variable.
(Modulus (MPa))1.66 = + 8.27969 + 2.00265 × IP −12.45601 × Pattern + 0.32983 × IP × Pattern + 2.72387 × 10⁻³ × IP2 + 4.84307 × Pattern2
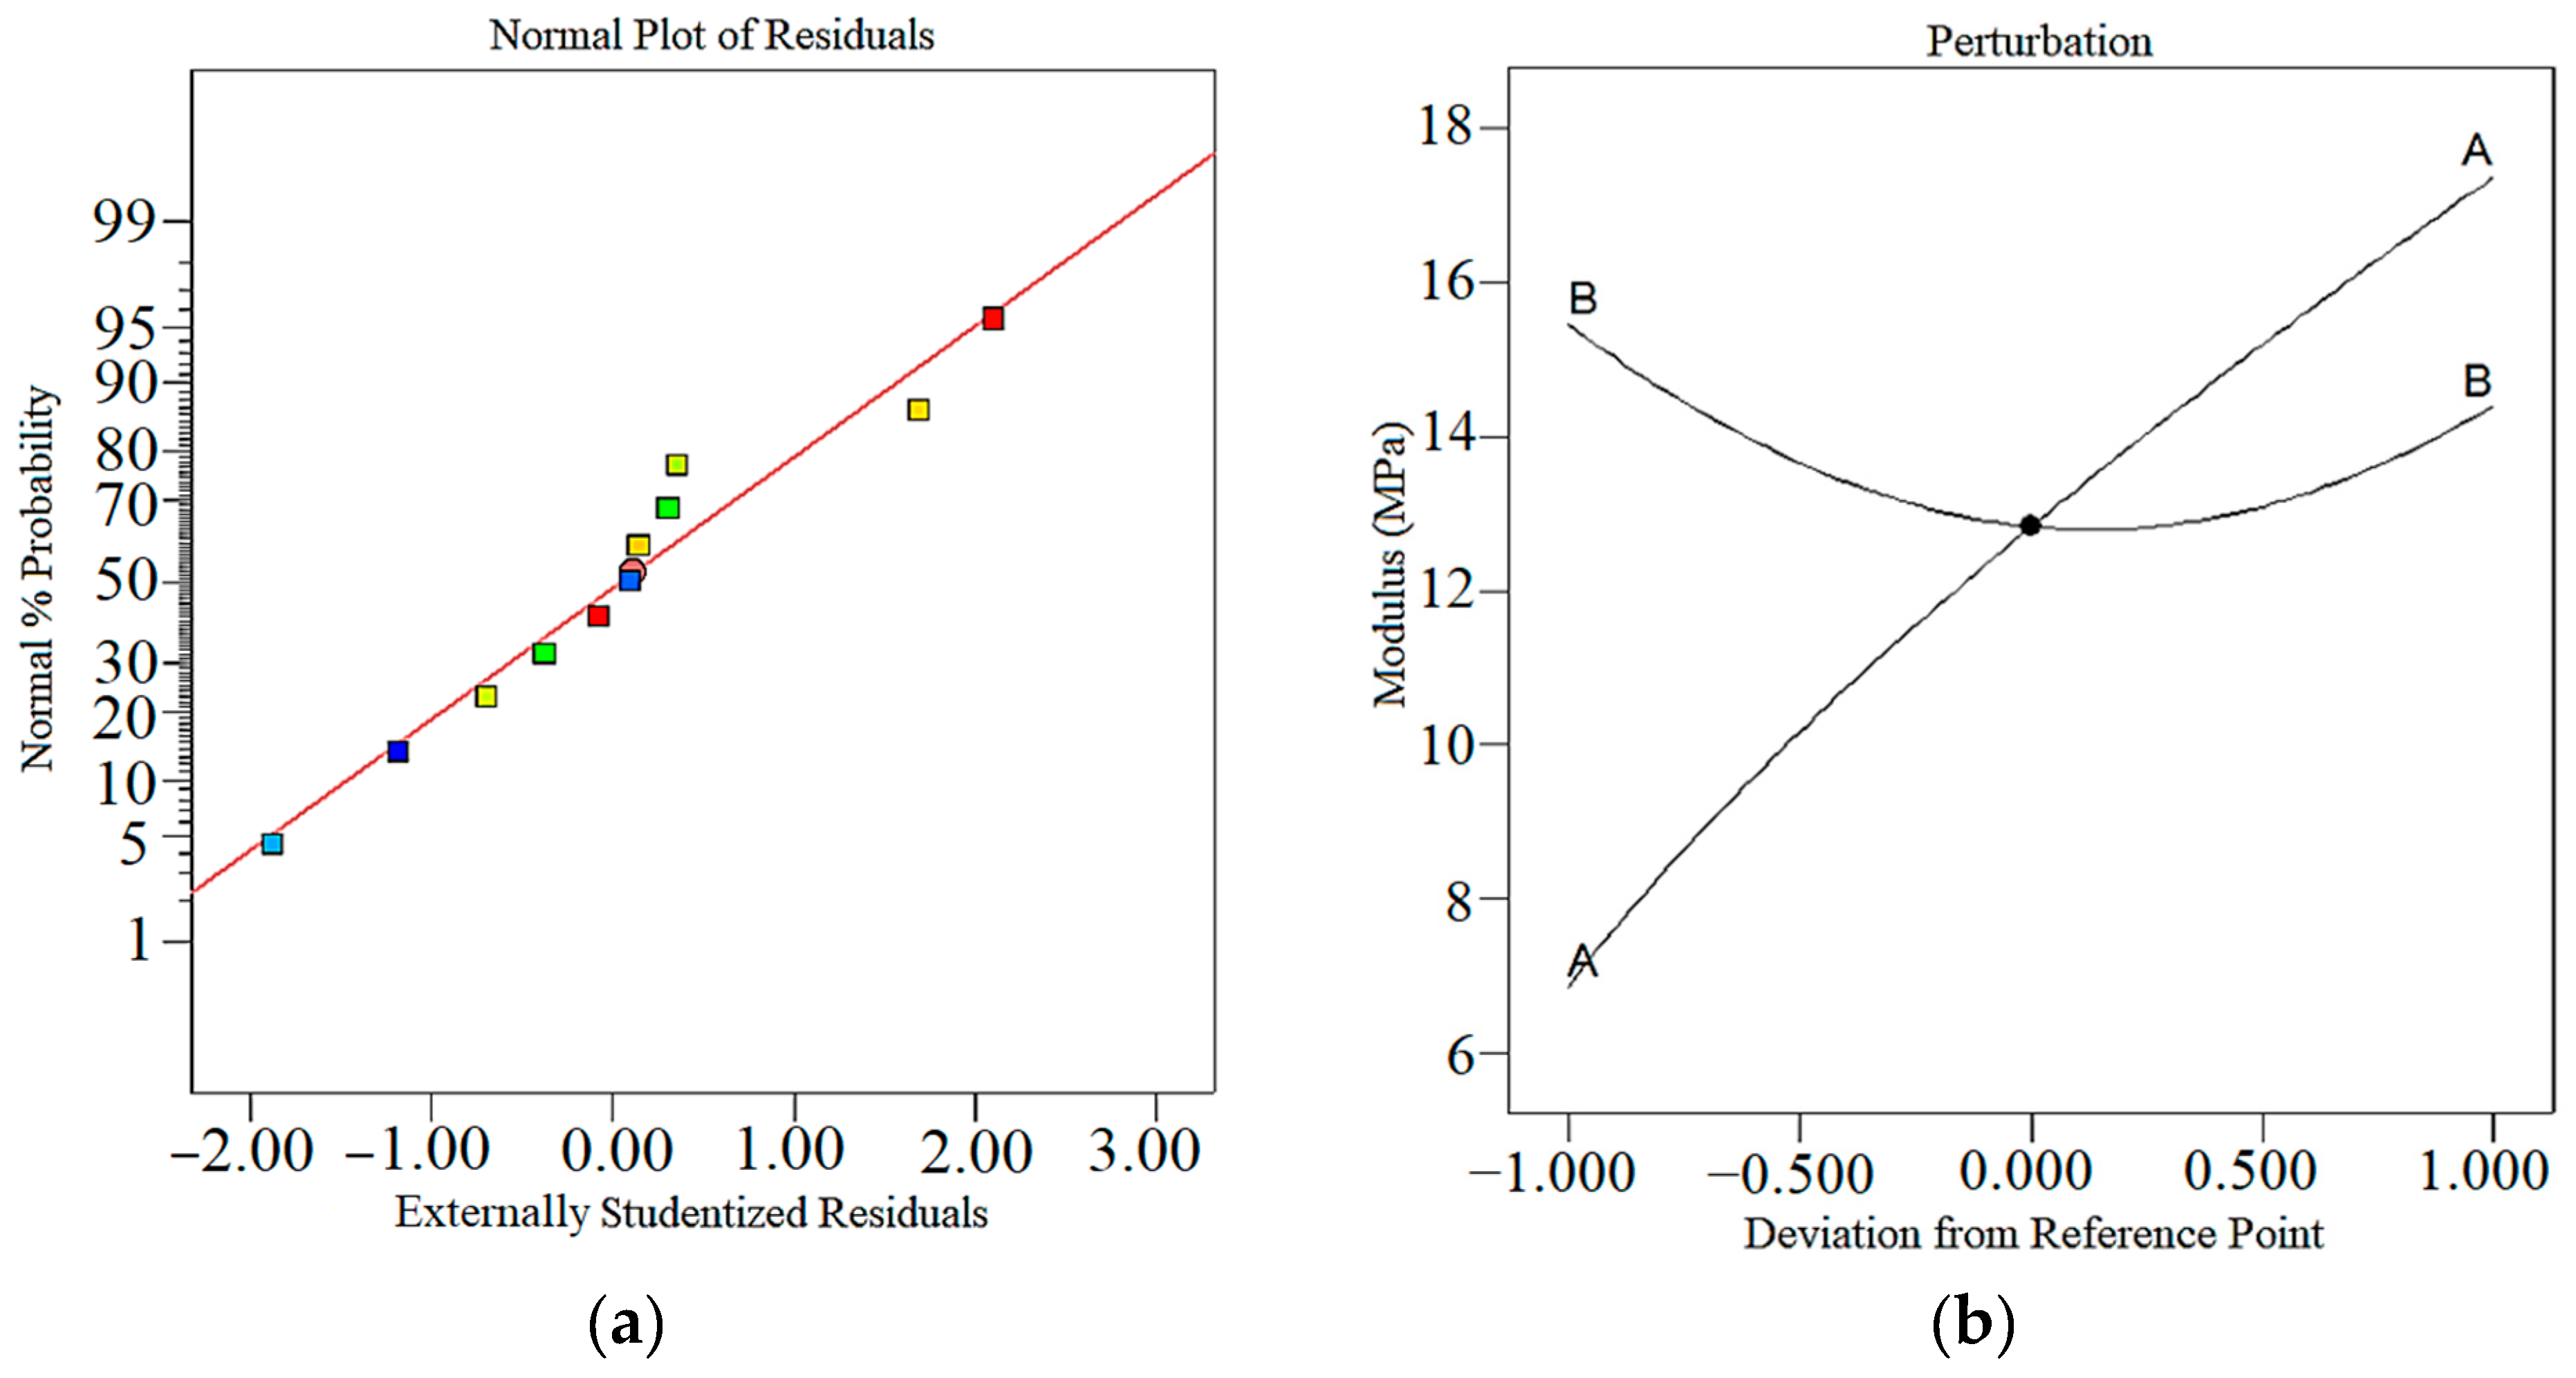
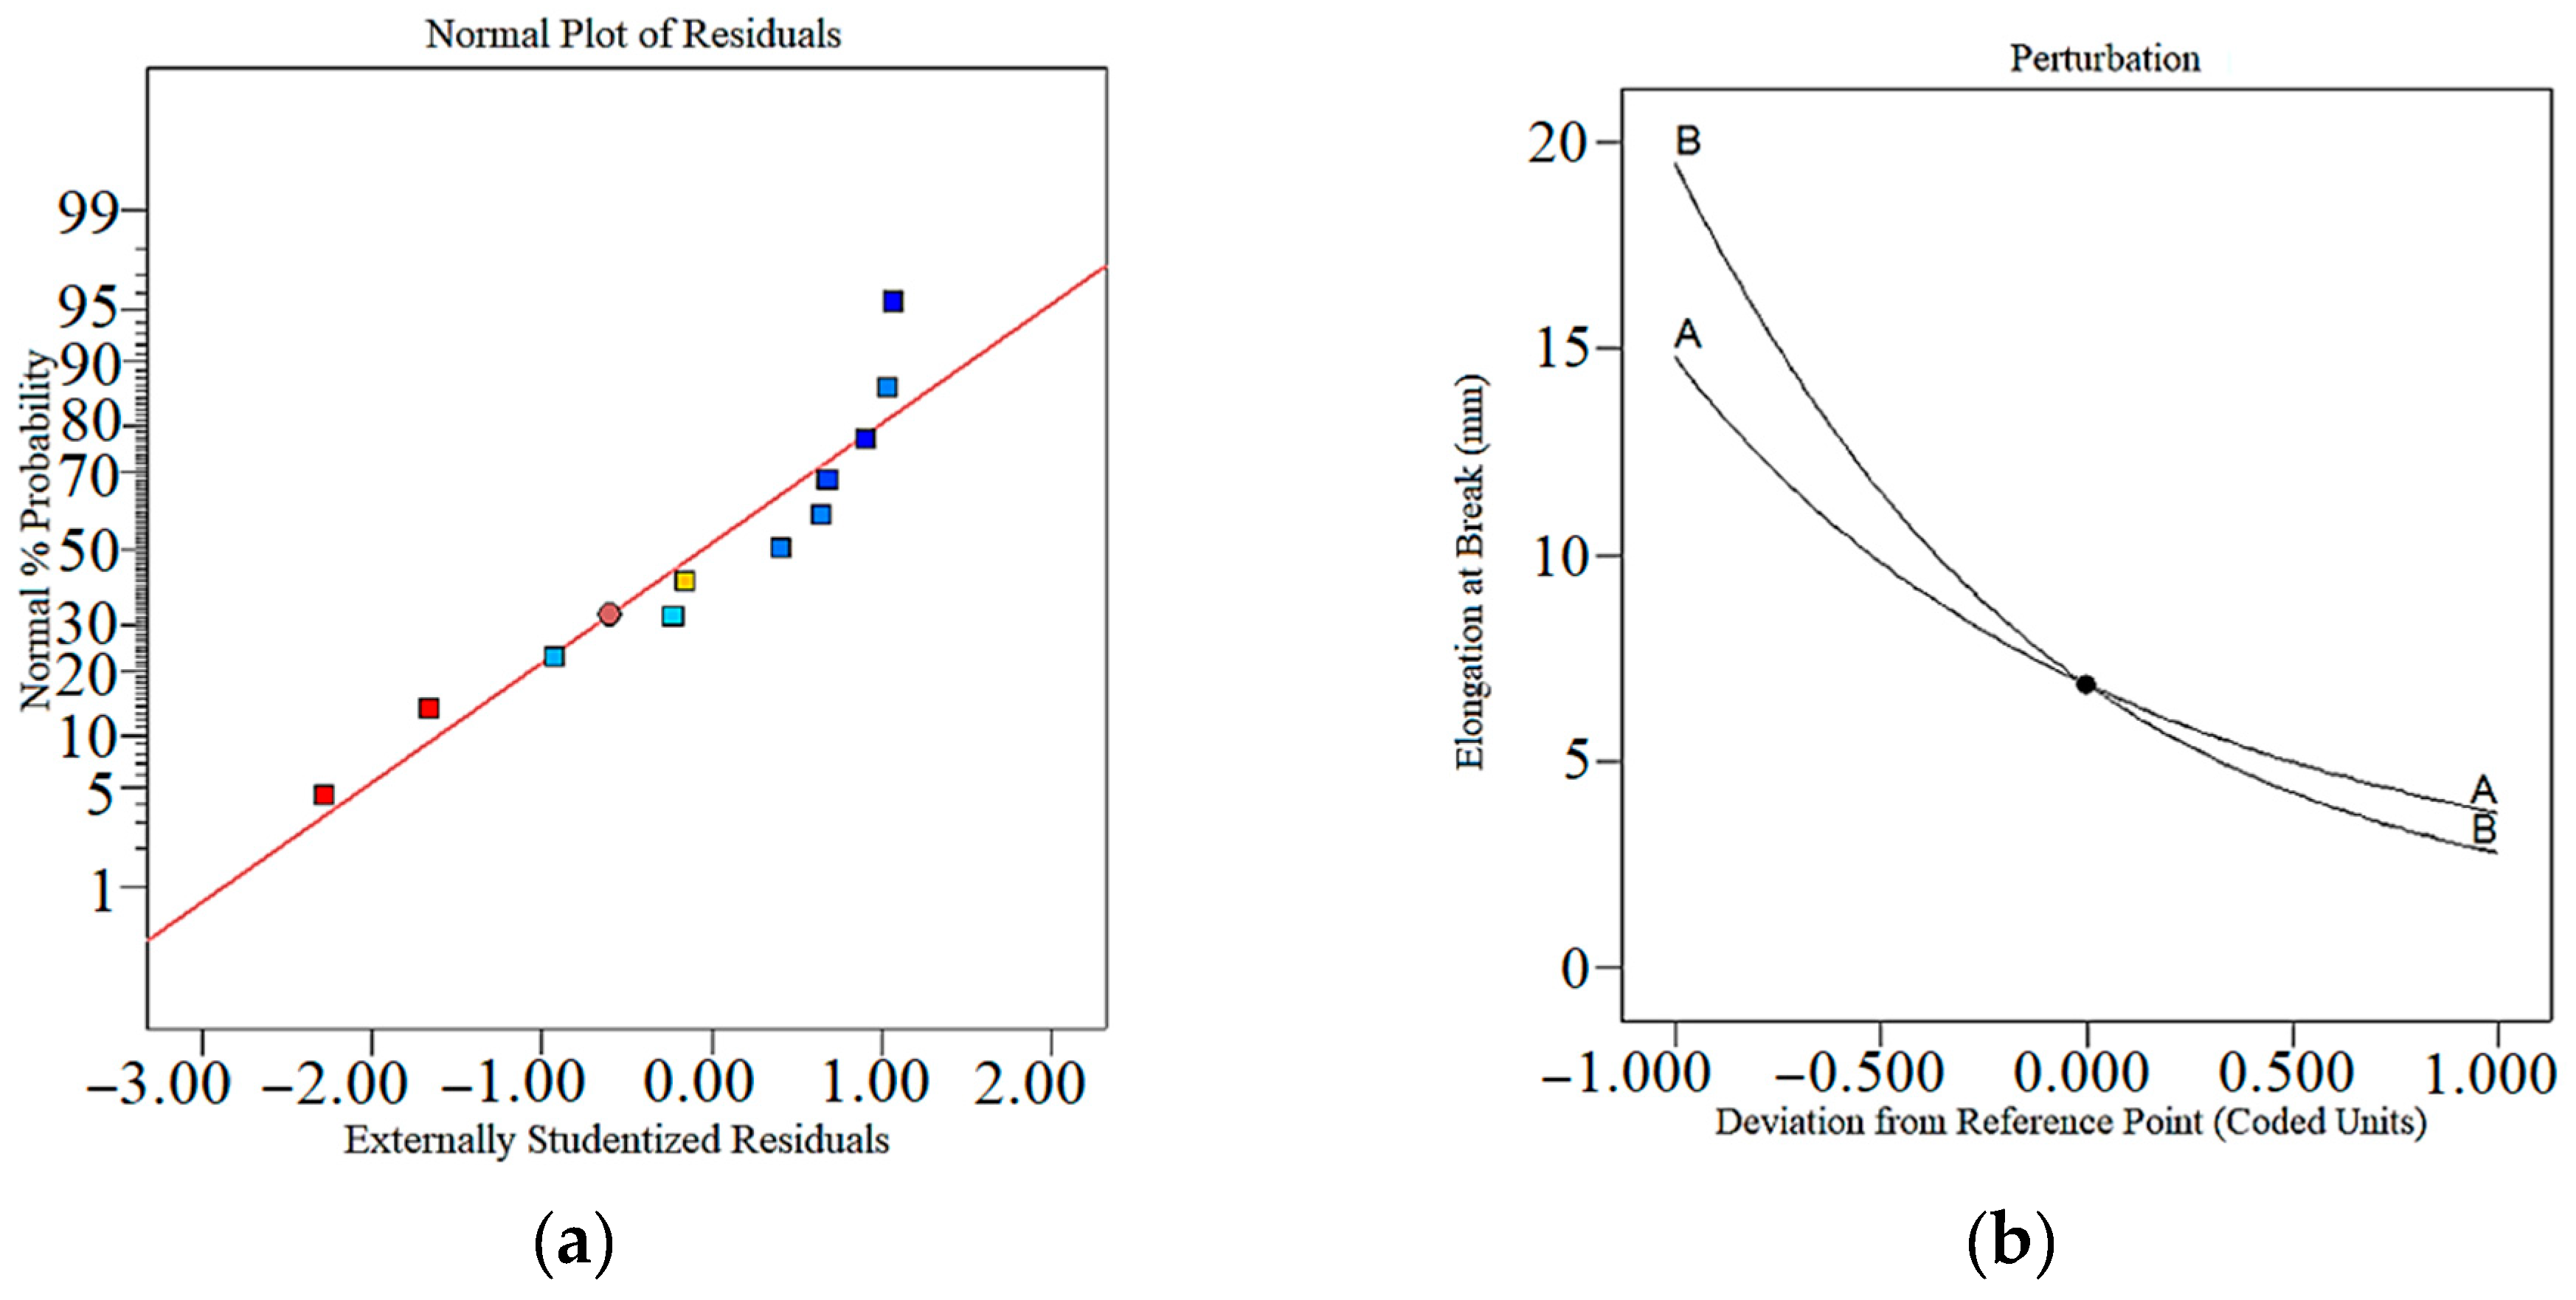
In Figure 5a, the normal plot of residuals shows that the residuals closely align with the red line, suggesting a normal distribution of the data. Additionally, Figure 5b illustrates the perturbation diagram for modulus. As the IP increases, the response value also increases. This can be attributed to the higher density and cohesion of the printed samples, requiring more force to separate them.
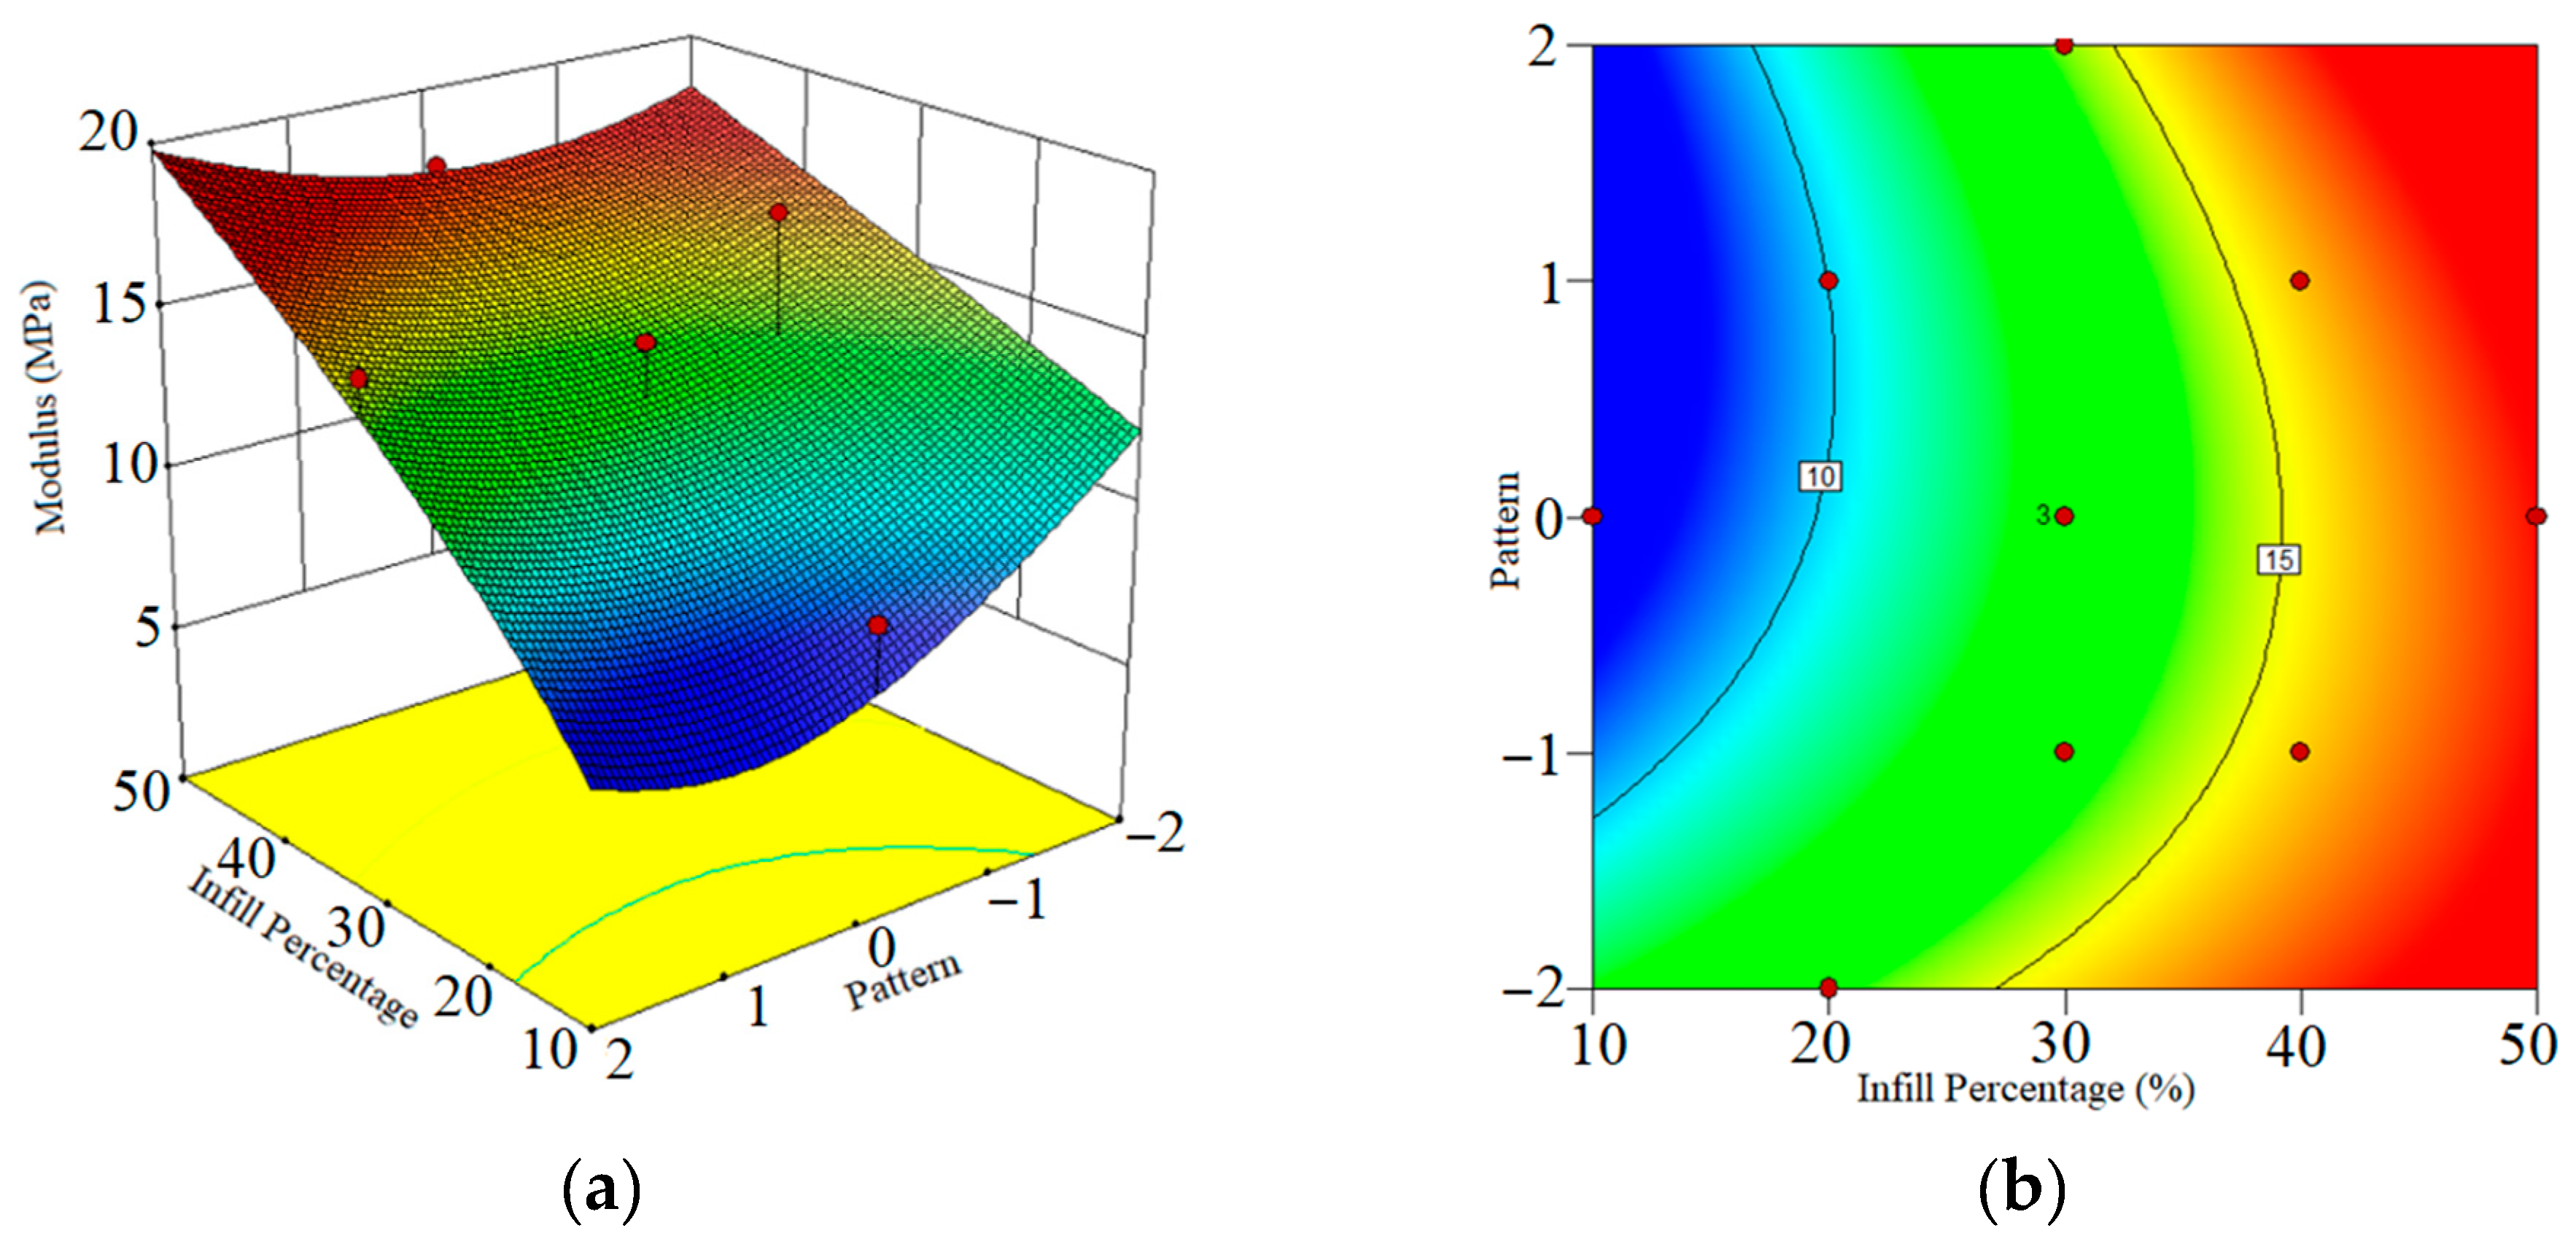
Figure 6a,b shows modulus’s response surface and contour plot. In Figure 6a, the effects of the pattern for modulus are not linear, and each type of pattern has a different impact on this response. Moreover, in Figure 6b, the red areas are the areas where the effects of the input parameters in those areas are maximum, and the green areas have fewer effects.

3.2. Elongation at Break

The evaluation of elongation at break is a crucial response in the analysis of 3D-printed samples, as it allows for the examination of the elongation capability of the samples before failure occurs. In this research, the analysis of variance (ANOVA) was performed, and Table 4 presents the results, indicating the significant parameters in the 3D-printing process. To further explore the relationship between the input parameters and the response variable, Equation (2) provides the coefficients associated with each input parameter, as well as the interaction coefficients between different parameters. These coefficients play a crucial role in forming the regression model, which aims to predict the response variable based on the input parameters. By considering the coefficients, the regression model can provide valuable insights into the impact of individual input parameters and their interactions on the elongation at break. This allows for a deeper understanding of how different factors influence the mechanical properties of the 3D-printed samples. Furthermore, the coefficients can be utilized to identify the optimal values of the input parameters that would result in the maximum elongation at break. By analyzing the regression model and performing optimization techniques, such as those employed in the Design Experts V11 program, it becomes possible to search for the optimum values that maximize the desired response while considering the limitations and constraints of the printing process. This iterative approach ensures the production of high-quality 3D-printed samples with improved mechanical properties.
(Elongation at Break)−0.64 = + 0.23652 + 4.26314 × 10⁻³ × IP −0.044551 × Pattern + 4.33220 × 10⁻³ × IP × Pattern + 2.45463 × 10⁻⁵ × IP2 + 9.49324 × 10⁻³ × Pattern2
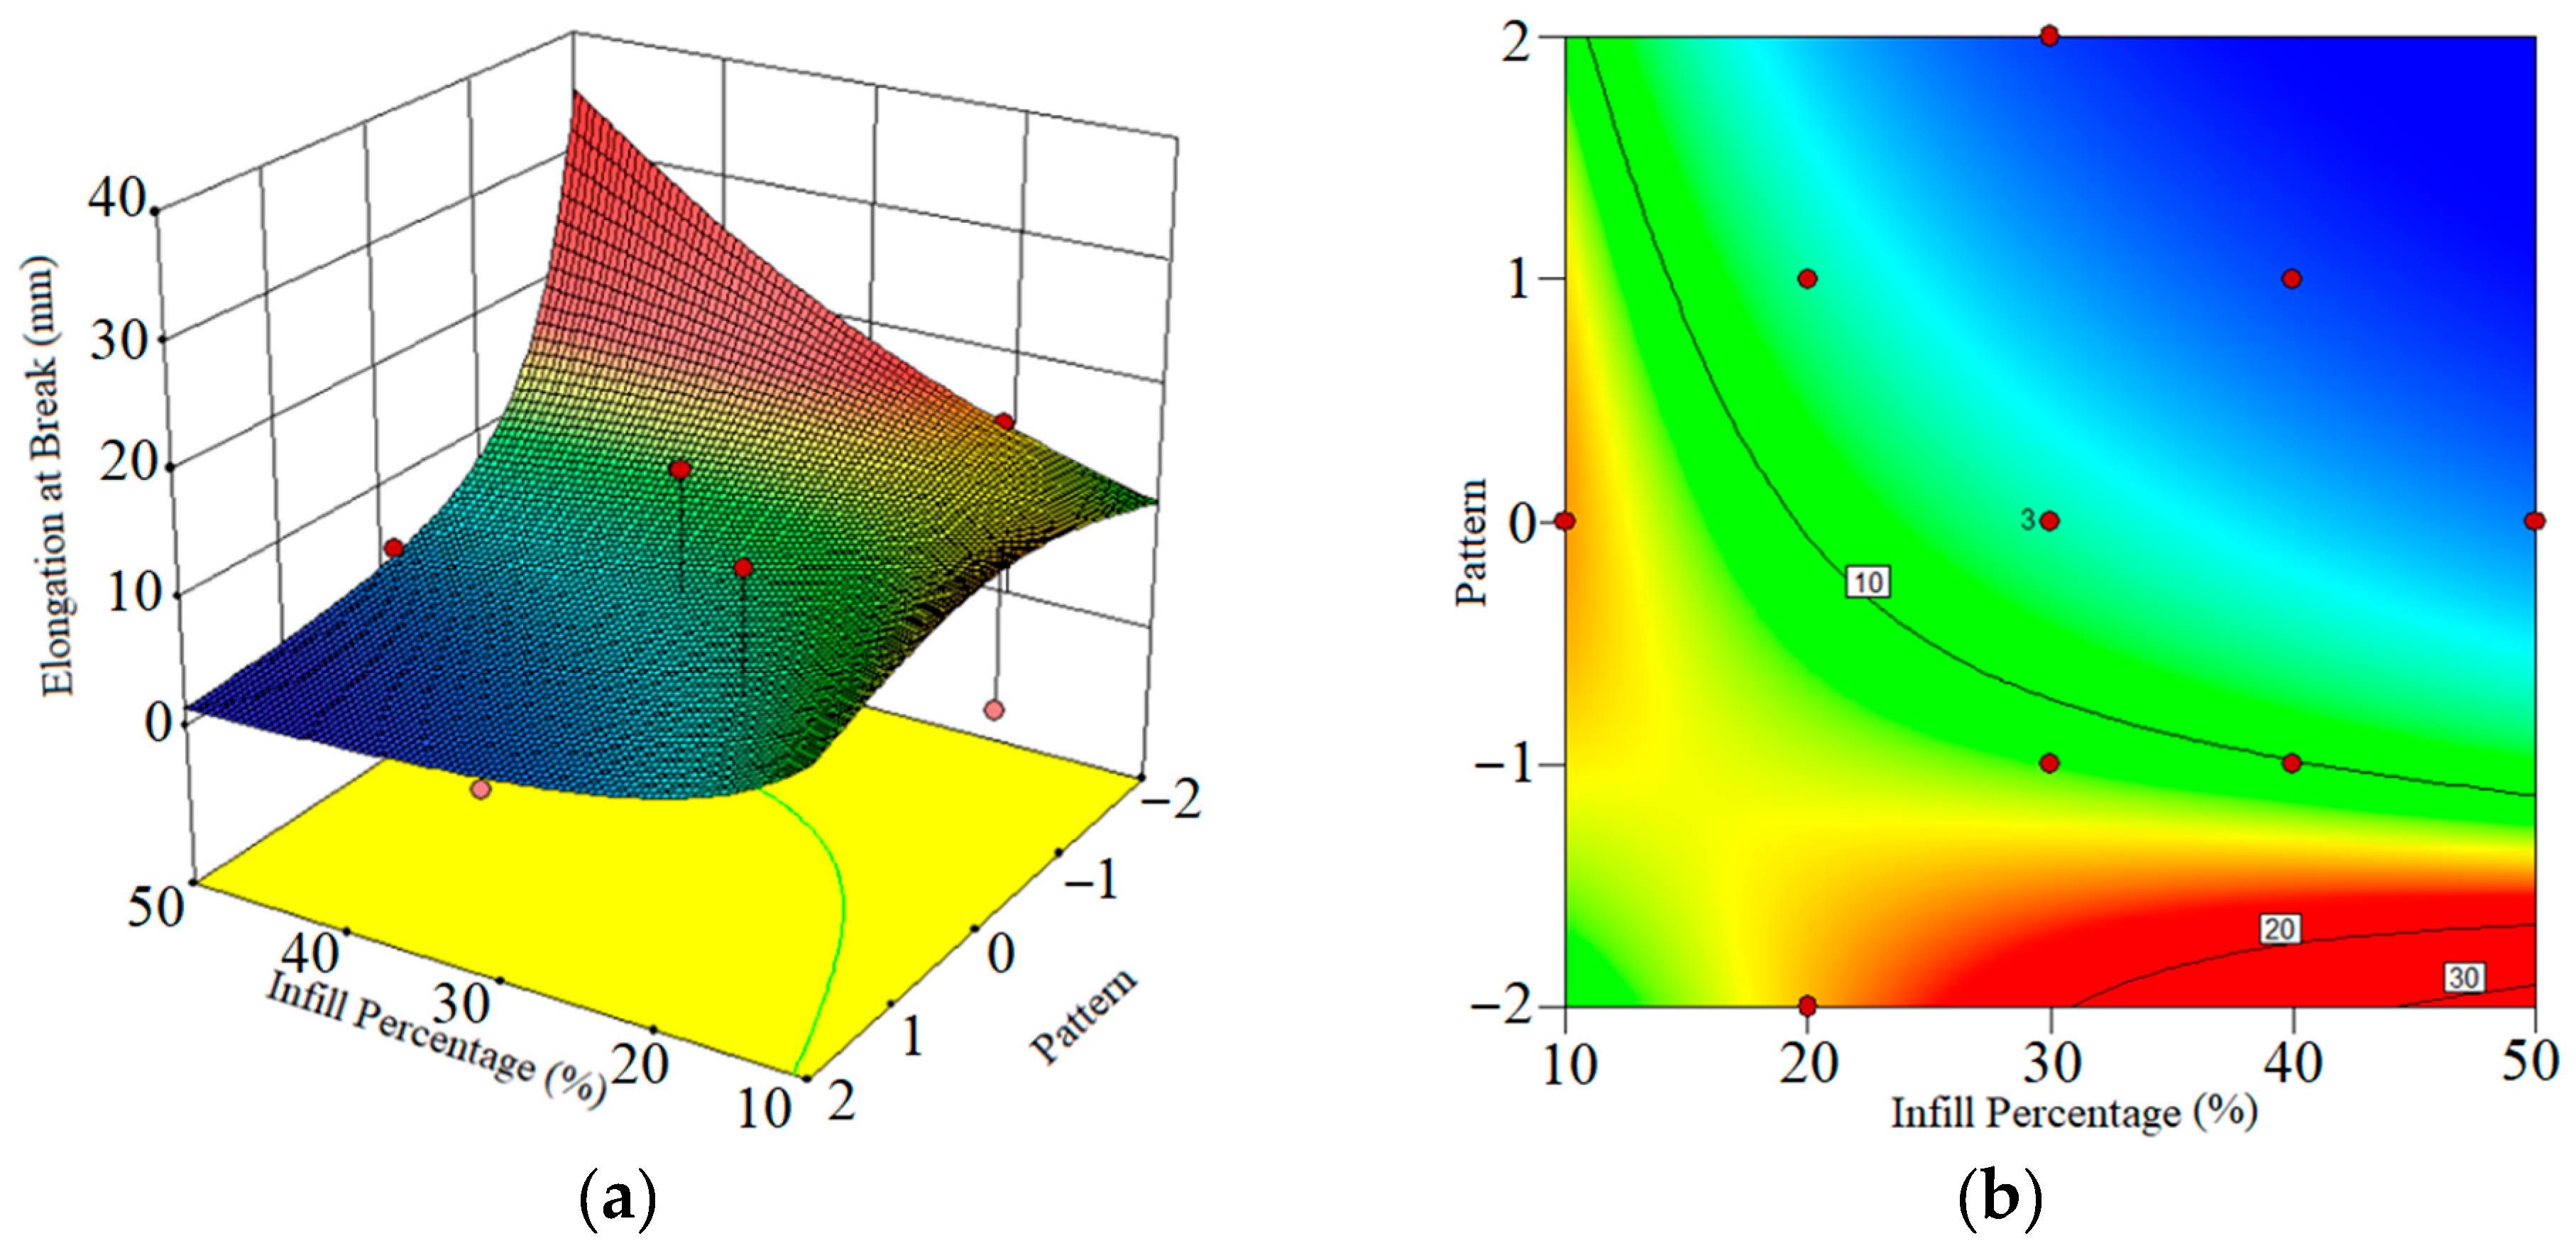
According to Equation (2), the normal plot of residuals (Figure 7a) and perturbation diagrams (Figure 7b) were generated to assess the adequacy of the regression model and the accuracy of the predicted values for the elongation at break. The normal plot of residuals provides insights into the distribution of the residuals and helps verify if the assumptions of the regression model are met. Deviations from normality in the plot may suggest areas of improvement or indicate potential issues with the model. The perturbation diagrams in Figure 7b illustrate the effect of each input parameter on the elongation at break. These diagrams enable the identification of the main factors that significantly influence the response variable. By observing the magnitude and direction of the perturbation, the impact of each parameter on the elongation at break can be determined. This information is valuable for understanding the relationship between the input parameters and the response variable and can aid in optimizing the printing process to achieve desired elongation properties. In Figure 8a,b, the influence of the IP on the elongation at break is demonstrated. As the value of the IP increases, more PVA is printed, resulting in a higher elongation value. This relationship can be attributed to the increased length of the printed structure as more material is deposited. It suggests that controlling the input parameter, such as adjusting the printing speed or extrusion rate, can have a significant impact on the elongation properties of the printed samples. Understanding the relationship between the input parameters and the elongation at break is essential for achieving desired mechanical properties in 3D-printed samples. By leveraging this knowledge, researchers and engineers can optimize the printing process by carefully adjusting the input parameters to achieve the desired elongation values while maintaining other quality characteristics. This deeper understanding facilitates the fine-tuning of the printing process and enhances the overall quality and performance of the printed samples.

3.3. Weight

The ANOVA in Table 5 checks the input parameters of 3D printing for weight. According to Equation (2), IP and Pattern coefficients are shown in weight.
(Weight)−2.35 = + 9.29504 × 10⁻³ −1.39631 × 10⁻⁴ × IP + 2.61945 × 10⁻⁴ × Pattern −7.71139 × 10⁻⁶ × IP × Pattern + 9.78546 × 10⁻⁷ × IP2 + 2.56665 × 10⁻⁵ × Pattern2
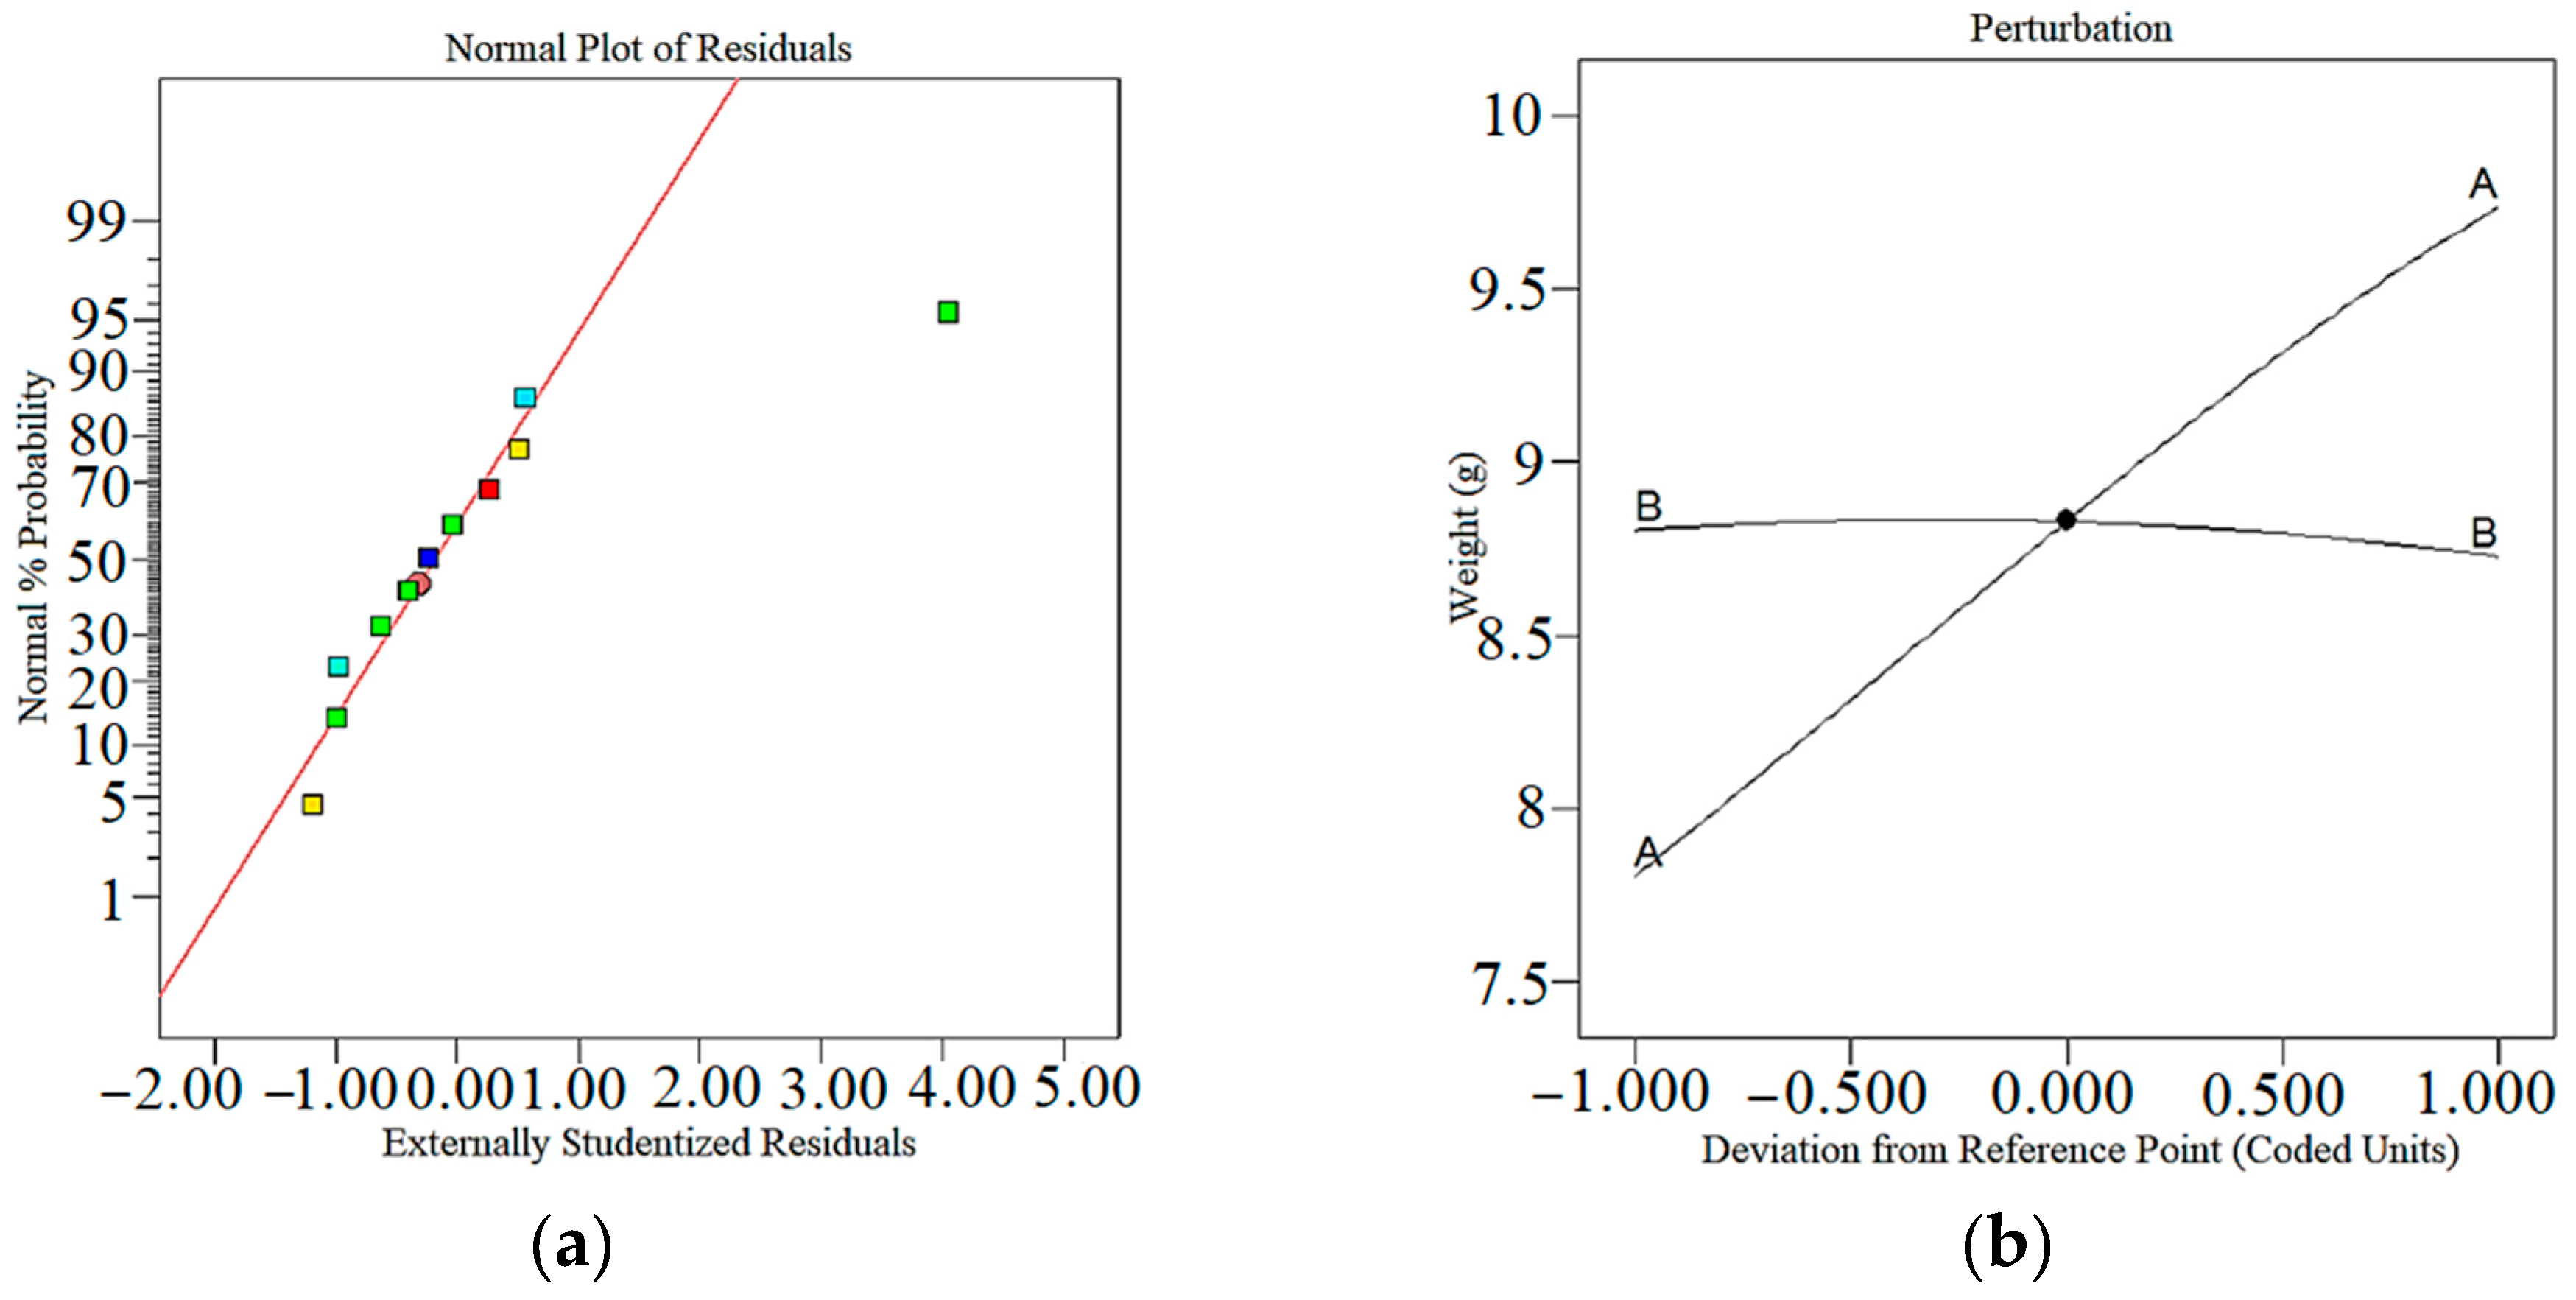
In Figure 9a, the normal plot of residuals is presented, where the residuals closely align with the red line. This indicates that the residuals follow a normal distribution, validating the assumptions of the regression model. A normal distribution of residuals suggests that the model captures the underlying variability in the data effectively and provides reliable predictions for the weight of the samples. The point in Figure 9a that deviates significantly from the trend is an outlier. It indicates an error derived from an extreme response value that is not representative of the measurement data. This outlier implies that the predictive model for weight is not capable of estimating the outlier. Figure 9b displays the perturbation diagram of the 3D-printer parameters on the samples’ weight. By examining the magnitude and direction of the perturbation lines, we can assess the impact of these parameters on the weight. The diagram reveals that as the value of the input parameter increases, the weight of the samples also increases. This relationship indicates that increasing the IP results in the deposition of more PVA material, leading to an overall increase in the weight of the printed samples. Understanding the influence of input parameters on the weight of the samples is crucial for achieving the desired weight characteristics in 3D-printed objects. By carefully adjusting the input parameters, such as the extrusion rate or IP, it is possible to control and regulate the weight of the printed samples. The insights gained from the normal plot of residuals and perturbation diagram contribute to a deeper understanding of the relationship between the printer input parameters and the weight of the samples. This knowledge facilitates informed decision-making in the optimization of the printing process, ensuring the production of samples with the desired weight characteristics for specific applications.
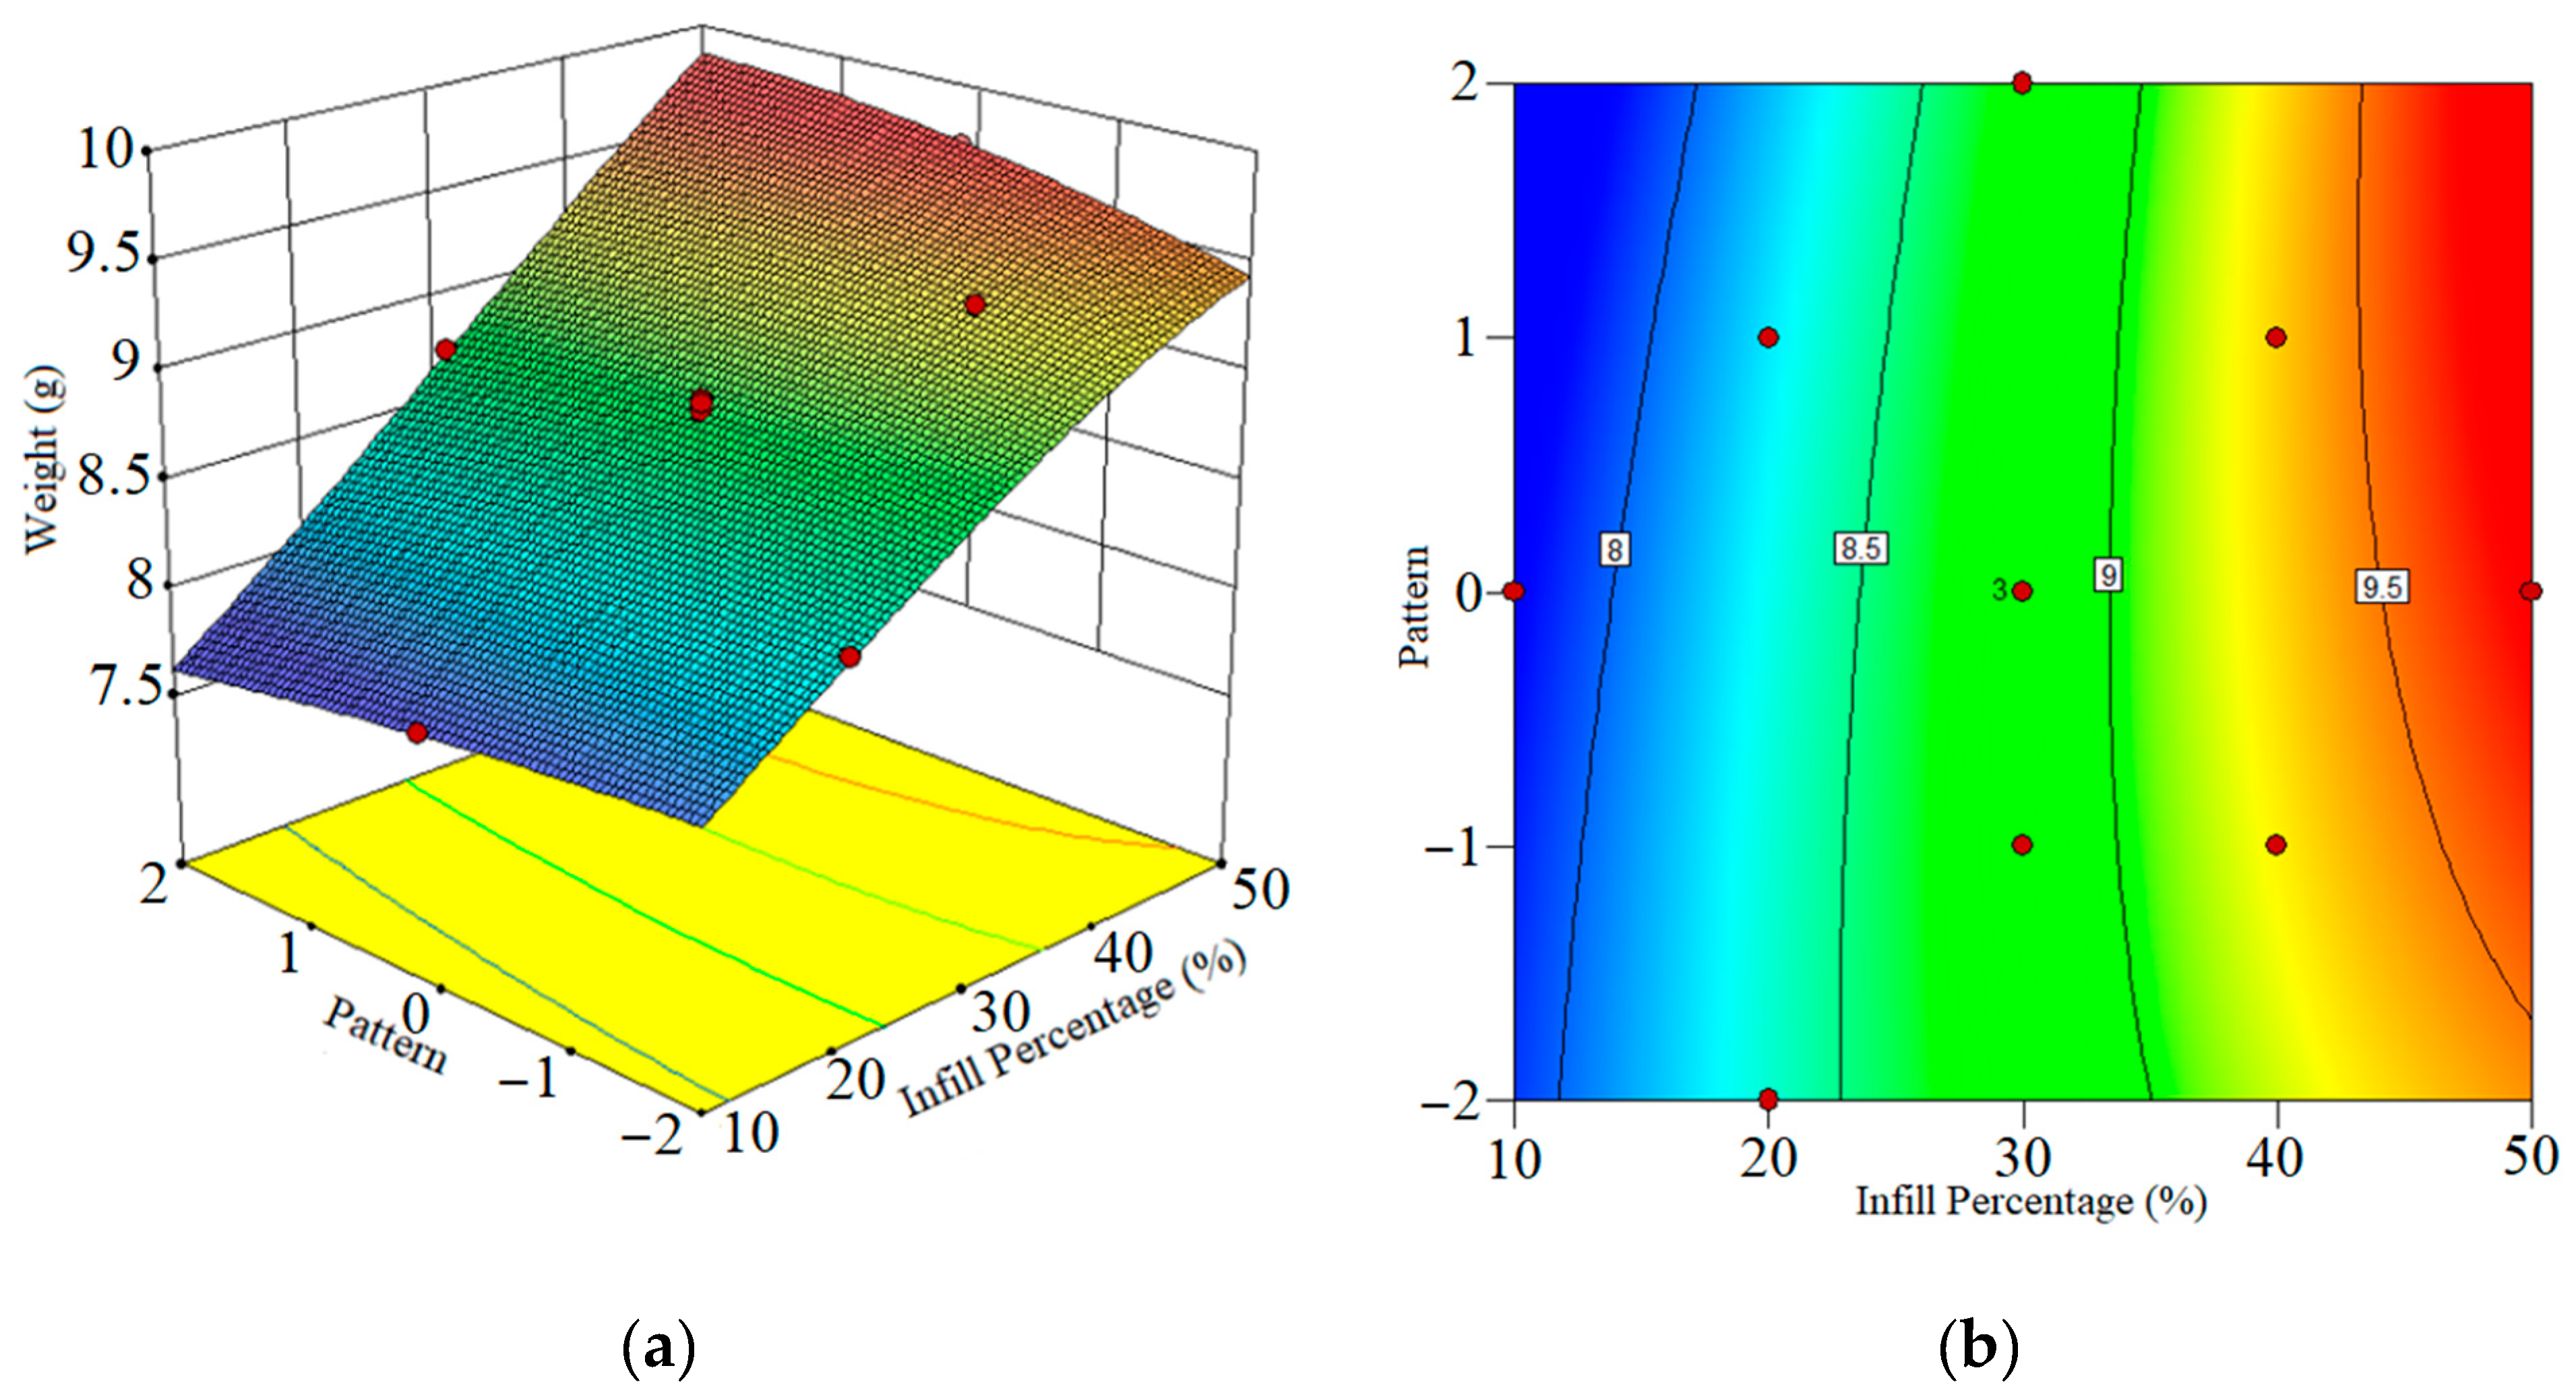
In Figure 10a,b, according to the effect of IP in the print of PVA samples, with the decrease in IP, the weight of the samples also decreases because the samples do not have high density, and as a result, their weight decreases. The output contains a graph, which has an Extension on the x-axis and load on the y-axis. The extension starts from 0 mm with the load being applied on the specimen; the elongation value increases until it breaks. The elongation behaves linearly to a certain value of load and then the elongation goes on increasing without change in the value of the load. The load suddenly drops when the specimen breaks.

4. Optimization

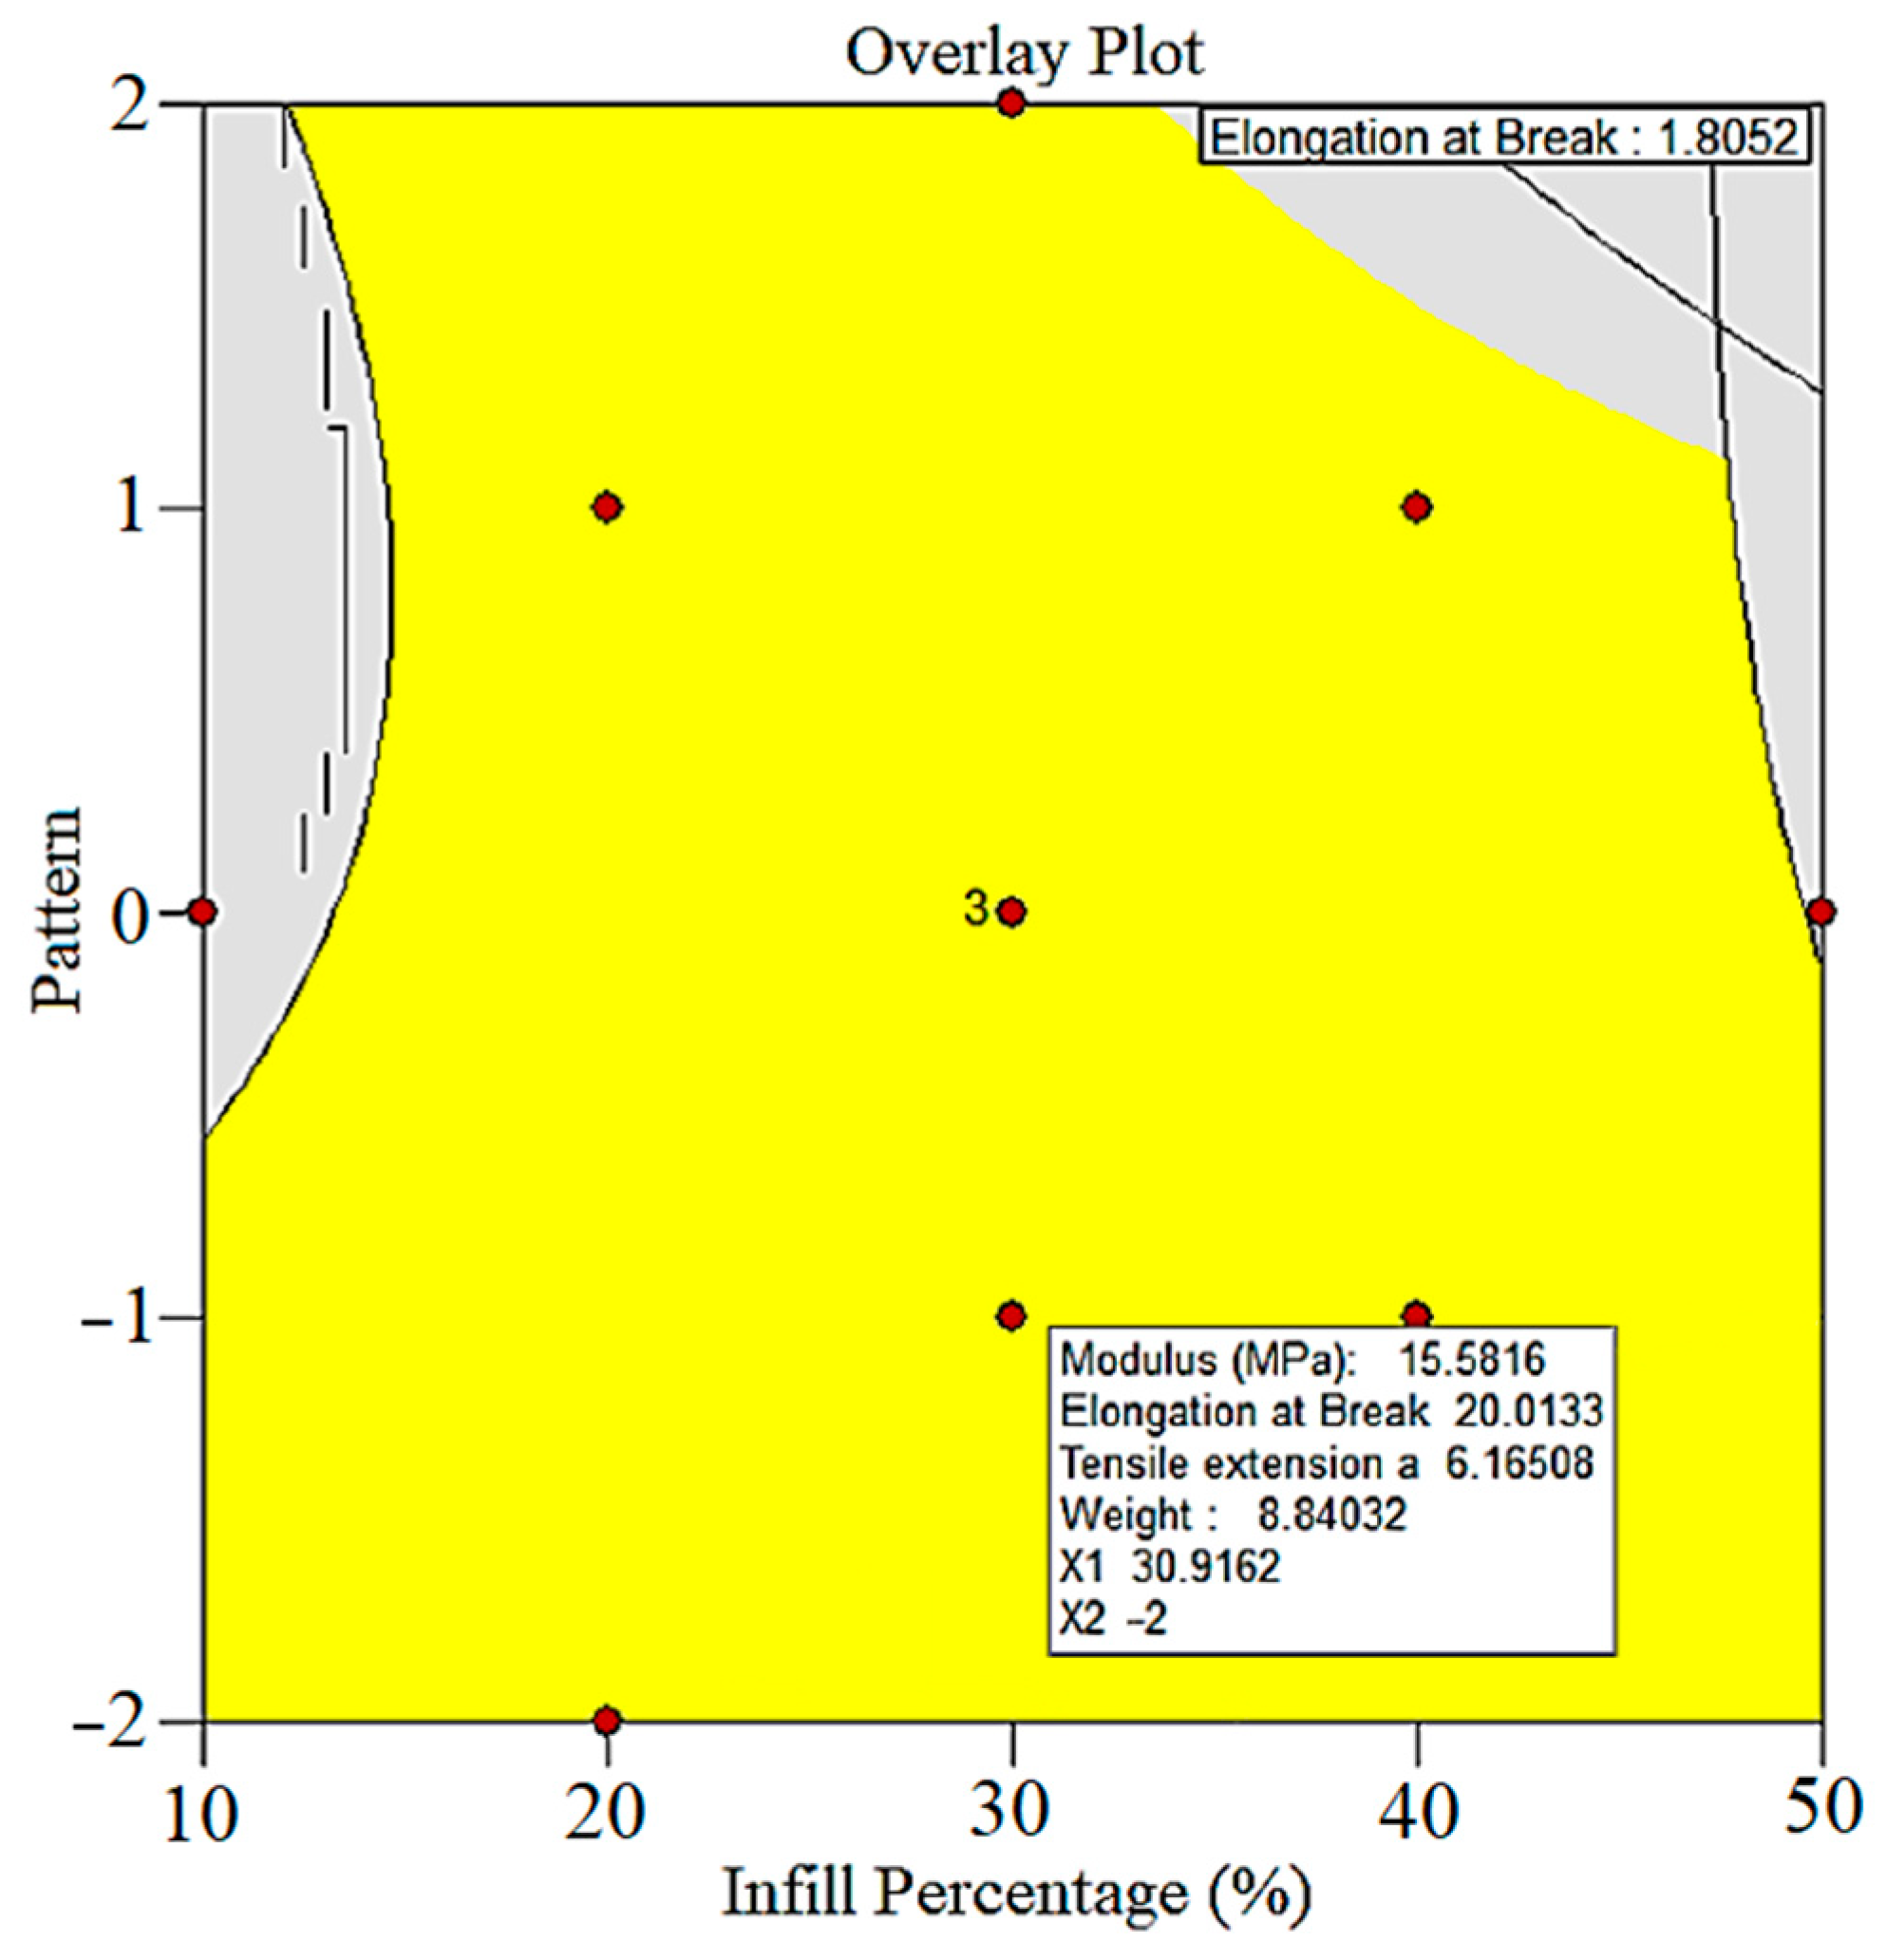
In this section, a detailed discussion is provided regarding the formation of the regression model and the search for the optimum values using the Design Experts V11 program. The analysis involved considering the minimum and maximum ranges of each input parameter, as indicated in Table 6. The objective, based on the statistical analysis, was to simultaneously increase the maximum modulus and elongation at break while reducing the weight of the samples. Table 7 presents the results of the statistical analysis conducted on the data from Table 2. Based on this analysis, the software suggested three samples that meet the specified conditions outlined in Table 6. Furthermore, Figure 11 illustrates an overlay plot, highlighting the samples with optimal input parameters in the yellow areas. This approach of utilizing the Design Experts V11 program allowed for the identification of key input parameter values that optimize the desired properties of the samples. By considering the statistical analysis and utilizing the suggested samples, it becomes possible to achieve the desired balance between increased modulus and elongation at break, while simultaneously reducing the weight of the samples.

5. Conclusions

The optimization of the 3D printing process for composite fabrication can be achieved by exploring alternative methods while considering the vast array of parameters and materials available. In particular, the influence of temperature control and filament melting temperature monitoring on mechanical properties, such as roughness, remains a topic of active debate and warrants further investigation in future research endeavors. In this study, the PVA filament was printed using FDM, in which two input parameters of the 3D printer, infill percentage (10–50%), and patterns (Cubic, Gyroid, Tri-hexagonal triangle, Grid) were varied, and modulus, elongation at break, and weight of samples were considered for eleven samples as responses. In the following, some output can be addressed:
(1)
The 3D printer could print the PVA filament properly by considering five different patterns.
(2)
The maximum modulus for the sample is 17.519 MPa, and this phenomenon is due to the cohesion of the melted material, which increases this parameter. So, by increasing the IP, the modulus increased.
(3)
The triangle pattern with 20% IP had a maximum elongation at break (17.026 mm). In this kind of sitting, the sample had more elongation because of the geometry and the IP percent.
(4)
Based on the statistical modeling and RSM design, the overlay plot was designed to show the optimum situations for the input parameters.

Author Contributions

Conceptualization, M.M. and M.S.; methodology, M.M., M.K., S.M., G.C., M.G., M.S. and M.R.; software, S.M.; validation, M.M., M.K., S.M. and M.S.; formal analysis, S.M; investigation, M.M., S.M. and G.C.; Experimental work and data curation, B.B., H.G., J.J., M.S.A. and P.T.; writing—original draft preparation, M.K. and S.M.; writing—review and editing, M.M., G.C., M.G., M.S., M.R., S.P. and D.K.; visualization, M.M., M.K., S.M., G.C., M.G., M.S., S.P. and D.K.; supervision, M.M., G.C. and D.K. All authors have read and agreed to the published version of the manuscript.

Funding

This research received no external funding.

Data Availability Statement

Data detail is already provided in the contents of this paper.

Conflicts of Interest

The authors declare no conflict of interest.

Abbreviations

FDMFused Deposition Modeling
RSMResponse Surface Methodology
DOEDesign of Experiment
ANOVAAnalysis of Variance
PVAPolyvinyl Alcohol
ABSAcrylonitrile Butadiene Styrene
CFRPCarbon-Fiber-Reinforced Plastic
IPInfill Percentage

References

  1. Muscolino, E.; Di Stefano, A.B.; Trapani, M.; Sabatino, M.A.; Giacomazza, D.; Alessi, S.; Cammarata, E.; Moschella, F.; Cordova, A.; Toia, F.; et al. κ-Carrageenan and PVA blends as bioinks to 3D print scaffolds for cartilage reconstruction. Int. J. Biol. Macromol. 2022, 222, 1861–1875. [Google Scholar] [CrossRef] [PubMed]
  2. Meiabadi, M.S.; Moradi, M.; Karamimoghadam, M.; Ardabili, S.; Bodaghi, M.; Shokri, M.; Mosavi, A.H. Modeling the Producibility of 3D Printing in Polylactic Acid Using Artificial Neural Networks and Fused Filament Fabrication. Polymers 2021, 13, 3219. [Google Scholar] [CrossRef] [PubMed]
  3. Liu, X.; Li, Q.; Li, J. Shrinkage and mechanical properties optimization of spray-based 3D printed concrete by PVA fiber. Mater. Lett. 2022, 319, 132253. [Google Scholar] [CrossRef]
  4. Saviano, M.; Bowles, B.J.; Penny, M.R.; Ishaq, A.; Muwaffak, Z.; Falcone, G.; Russo, P.; Hilton, S.T. Development and analysis of a novel loading technique for FDM 3D printed systems: Microwave-assisted impregnation of gastro-retentive PVA capsular devices. Int. J. Pharm. 2022, 613, 121386. [Google Scholar] [CrossRef]
  5. Shahrjerdi, A.; Karamimoghadam, M.; Bodaghi, M. Enhancing Mechanical Properties of 3D-Printed PLAs via Optimization Process and Statistical Modeling. J. Compos. Sci. 2023, 7, 151. [Google Scholar] [CrossRef]
  6. Moradi, M.; Karami Moghadam, M.; Shamsborhan, M.; Bodaghi, M.; Falavandi, H. Post-Processing of FDM 3D-Printed Polylactic Acid Parts by Laser Beam Cutting. Polymers 2020, 12, 550. [Google Scholar] [CrossRef] [Green Version]
  7. Sun, X.; Zhou, J.; Wang, Q.; Shi, J.; Wang, H. PVA fibre reinforced high-strength cementitious composite for 3D printing: Mechanical properties and durability. Addit. Manuf. 2022, 49, 102500. [Google Scholar] [CrossRef]
  8. Kim, Y.T.; Ahmadianyazdi, A.; Folch, A. A ‘print–pause–print’ protocol for 3D printing microfluidics using multimaterial stereolithography. Nat. Protoc. 2023, 18, 1243–1259. [Google Scholar] [CrossRef]
  9. Li, M.; Zhou, S.; Cheng, L.; Mo, F.; Chen, L.; Yu, S.; Wei, J. 3D Printed Supercapacitor: Techniques, Materials, Designs, and Applications. Adv. Funct. Mater. 2023, 33, 2208034. [Google Scholar] [CrossRef]
  10. Li, Q.; Chen, T.; Liang, J.; Zhang, C.; Li, J.; Zhou, Y.; Sun, X. Manufacturing of ceramic cores: From hot injection to 3D printing. J. Mater. Sci. Technol. 2023, 134, 95–105. [Google Scholar] [CrossRef]
  11. Mirkhalaf, M.; Men, Y.; Wang, R.; No, Y.; Zreiqat, H. Personalized 3D printed bone scaffolds: A review. Acta Biomater. 2023, 156, 110–124. [Google Scholar] [CrossRef]
  12. Liu, B.; Liu, X.; Li, G.; Geng, S.; Li, Z.; Weng, Y.; Qian, K. Study on anisotropy of 3D printing PVA fiber reinforced concrete using destructive and non-destructive testing methods. Case Stud. Constr. Mater. 2022, 17, e01519. [Google Scholar] [CrossRef]
  13. Moradi, M.; Karami Moghadam, M.; Shamsborhan, M.; Bodaghi, M. The Synergic Effects of FDM 3D Printing Parameters on Mechanical Behaviors of Bronze Poly Lactic Acid Composites. J. Compos. Sci. 2020, 4, 17. [Google Scholar] [CrossRef] [Green Version]
  14. Imanian, M.E.; Biglari, F.R. Modeling and prediction of surface roughness and dimensional accuracy in SLS 3D printing of PVA/CB composite using the central composite design. J. Manuf. Process. 2022, 75, 154–169. [Google Scholar] [CrossRef]
  15. Zieliński, P.S.; Gudeti, P.K.R.; Rikmanspoel, T.; Włodarczyk-Biegun, M.K. 3D printing of bio-instructive materials: Toward directing the cell. Bioact. Mater. 2023, 19, 292–327. [Google Scholar] [CrossRef] [PubMed]
  16. Wei, Q.; Zhou, J.; An, Y.; Li, M.; Zhang, J.; Yang, S. Modification, 3D printing process and application of sodium alginate based hydrogels in soft tissue engineering: A review. Int. J. Biol. Macromol. 2023, 232, 123450. [Google Scholar] [CrossRef] [PubMed]
  17. Padhi, S.K.; Sahu, R.K.; Mahapatra, S.S.; Das, H.C.; Sood, A.K.; Patro, B.; Mondal, A.K. Optimization of fused deposition modeling process parameters using a fuzzy inference system coupled with Taguchi philosophy. Adv. Manuf. 2017, 5, 231–242. [Google Scholar] [CrossRef]
  18. Gardan, J.; Makke, A.; Recho, N. Improving the fracture toughness of 3D printed thermoplastic polymers by fused deposition modeling. Int. J. Fract. 2018, 210, 1–15. [Google Scholar] [CrossRef]
  19. Peng, A.; Xiao, X.; Yue, R. Process parameter optimization for fused deposition modeling using response surface methodology combined with fuzzy inference system. Int. J. Adv. Manuf. Technol. 2014, 73, 87–100. [Google Scholar] [CrossRef]
  20. Sajan, N.; John, T.D.; Sivadasan, M.; Singh, N.K. An investigation on circularity error of components processed on Fused Deposition Modeling (FDM). Mater Today Proc. 2018, 5, 1327–1334. [Google Scholar] [CrossRef]
  21. Gautam, R.; Idapalapati, S.; Feih, S. Printing and characterisation of Kagome lattice structures by fused deposition modelling. Mater. Des. 2018, 137, 266–275. [Google Scholar] [CrossRef]
  22. Ning, F.; Cong, W.; Wei, J.; Wang, S.; Zhang, M. Additive Manufacturing of CFRP Composites Using Fused Deposition Modeling: Effects of Carbon Fiber Content and Length. In Proceedings of the ASME 2015 International Manufacturing Science and Engineering Conference, Charlotte, NC, USA, 8–12 June 2015; Volume 1. [Google Scholar]
  23. Komarasamy, M.; Wang, T.; Liu, K.; Reza-Nieto, L.; Mishra, R.S. Hierarchical multi-phase microstructural architecture for exceptional strength-ductility combination in a complex concentrated alloy via high-temperature severe plastic deformation. Scr. Mater. 2019, 162, 38–43. [Google Scholar] [CrossRef]
  24. Taherzadehboroujeni, M.; Kalhor, R.; Fahs, G.B.; Moore, R.B.; Case, S.W. Accelerated testing method to estimate the long-term hydrostatic strength of semi-crystalline plastic pipes. Polym. Eng. Sci. 2020, 60, 879–888. [Google Scholar] [CrossRef]
  25. Ghennai, W.; Boussaid, O.; Bendjama, H.; Haddag, B.; Nouari, M. Experimental and numerical study of DC04 sheet metal behaviour—Plastic anisotropy identification and application to deep drawing. Int. J. Adv. Manuf. Technol. 2019, 100, 361–371. [Google Scholar] [CrossRef]
  26. Alatefi, M.; Al-Ahmari, A.M.; AlFaify, A.Y.; Saleh, M. A Framework for Multivariate Statistical Quality Monitoring of Additive Manufacturing: Fused Filament Fabrication Process. Processes 2023, 11, 1216. [Google Scholar] [CrossRef]
  27. Turner, B.N.; Strong, R.; Gold, S.A. A review of melt extrusion additive manufacturing processes: I. Process design and modeling. Rapid Prototyp. J. 2014, 20, 192–204. [Google Scholar] [CrossRef]
  28. Qattawi, A. Investigating the effect of fused deposition modeling processing parameters using Taguchi design of experiment method. J. Manuf. Process. 2018, 36, 164–174. [Google Scholar]
  29. Idà, E.; Nanetti, F.; Mottola, G. An Alternative Parallel Mechanism for Horizontal Positioning of a Nozzle in an FDM 3D Printer. Machines 2022, 10, 542. [Google Scholar] [CrossRef]
  30. Ong, J.J.; Castro, B.M.; Gaisford, S.; Cabalar, P.; Basit, A.W.; Pérez, G.; Goyanes, A. Accelerating 3D printing of pharmaceutical products using machine learning. Int. J. Pharm. X 2022, 4, 100120. [Google Scholar] [CrossRef]
  31. Kadam, V.; Kumar, S.; Bongale, A.; Wazarkar, S.; Kamat, P.; Patil, S. Enhancing surface fault detection using machine learning for 3D printed products. Appl. Syst. Innov. 2021, 4, 34. [Google Scholar] [CrossRef]
  32. Panwar, V.; Sharma, D.K.; Kumar, K.P.; Jain, A.; Thakar, C. Experimental investigations and optimization of surface roughness in turning of en 36 alloy steel using response surface methodology and genetic algorithm. Mater. Today Proc. 2021, 46, 6474–6481. [Google Scholar] [CrossRef]
  33. Abdellatief, M.; Elemam, W.E.; Alanazi, H.; Tahwia, A.M. Production and optimization of sustainable cement brick incorporating clay brick wastes using response surface method. Ceram. Int. 2023, 49, 9395–9411. [Google Scholar] [CrossRef]
  34. Mohammed, B.S.; Adamu, M. Mechanical performance of roller compacted concrete pavement containing crumb rubber and nano silica. Constr. Build. Mater. 2018, 159, 234–251. [Google Scholar] [CrossRef]
  35. Myers, R.H.; Montgomery, D.C.; Vining, G.G.; Borror, C.M.; Kowalski, S.M. Response surface methodology: A retrospective and literature survey. J. Qual. Technol. 2004, 36, 53–77. [Google Scholar] [CrossRef]
  36. Bezerra, M.A.; Santelli, R.E.; Oliveira, E.P.; Villar, L.S.; Escaleira, L.A. Response surface methodology (RSM) as a tool for optimization in analytical chemistry. Talanta 2008, 76, 965–977. [Google Scholar] [CrossRef]
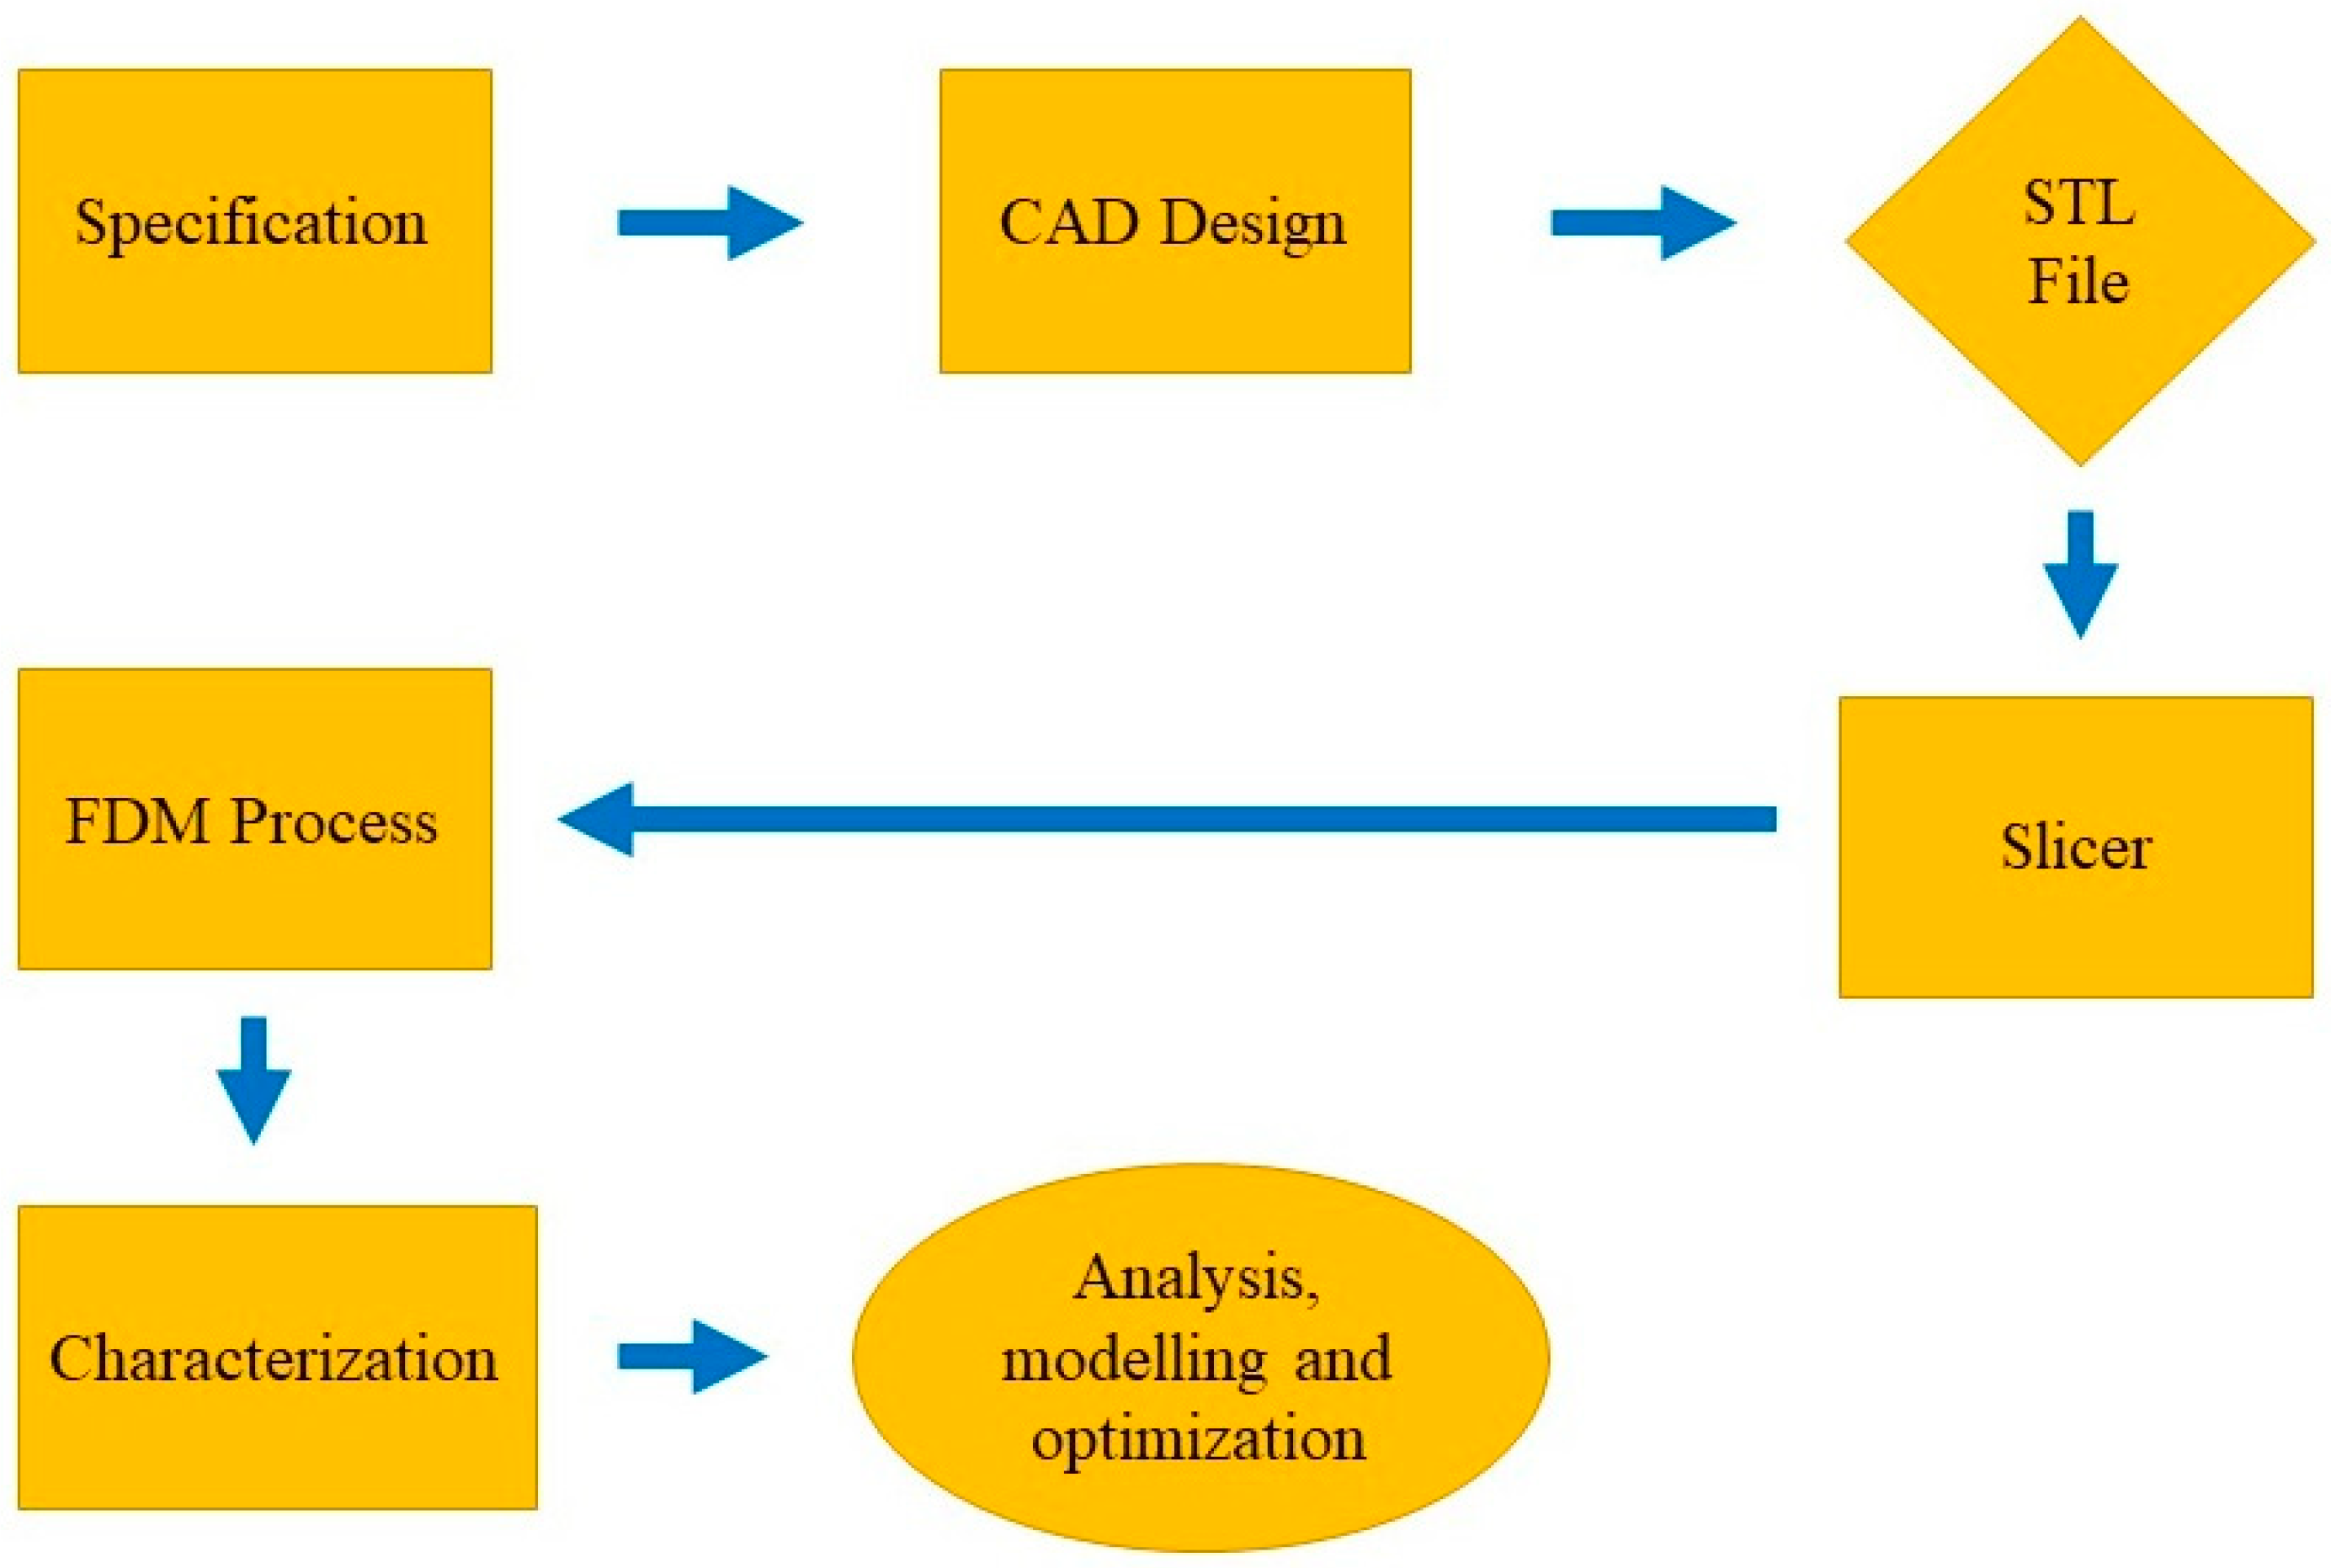
Figure 1. Flowchart of Methodology.
Mathematics 11 03022 g001
Figure 2. Ultimaker 5 s 3D printer was used in this experiment.
Mathematics 11 03022 g002
Figure 3. Specimen test. (a) Printed samples. (b) The samples after tensile test.
Mathematics 11 03022 g003
Figure 4. Specimen Tensile tests for samples (a) #1 and (b) #6.
Mathematics 11 03022 g004
Figure 5. (a) Normal plot of residuals. (b) Perturbation plot.
Mathematics 11 03022 g005
Figure 6. (a) Response surface plot of modulus output in terms of IP and pattern. (b) Contour plot IP and pattern.
Mathematics 11 03022 g006
Figure 7. (a) Normal plot of residuals for Elongation at Break (b) Perturbation plot for Elongation at Break.
Mathematics 11 03022 g007
Figure 8. (a) Response surface plot of elongation at break output in terms of IP and pattern (b). Contour plot IP and pattern.
Mathematics 11 03022 g008
Figure 9. (a) Normal plot of residuals for Weight. (b) Perturbation plot for Weight.
Mathematics 11 03022 g009
Figure 10. (a) Response surface plot of weight output in terms of IP and pattern (b) Contour plot IP and pattern.
Mathematics 11 03022 g010
Figure 11. Overlay plot of pattern and IP for the PVA 3D printing process.
Mathematics 11 03022 g011
Table 1. Independent Process Parameters with Design Levels.
VariableNotationUnit−2−1012
Infill PercentageIP%1020304050
PatternW-CubicGyroidTri-HexagonalTriangleGrid
Table 2. Input parameters and responses for PVA 3D printing.
No.Input VariablesResponses
Infill PercentagePatternModulus
(MPa)
Elongation at Break (mm)Weight
(g)
ActualRelative Error %ActualRelative Error %ActualRelative Error %
130Grid15.5617.521.871−48.128.740.22
240Triangle15.696−0.311.80−59.449.3−0.32
330Cubic17.41421.593.731−200.078.71−1.37
430Tri-Hexagon14.49213.022.80673.248.890.78
530Tri-Hexagon9.60933.544.818−144.648.830.11
610Tri-Hexagon8.93923.183.741−294.917.810.12
750Tri-Hexagon17.5190.914.35813.979.72−0.10
820Gyroid12.726−9.2714.2790.068.390.23
920Triangle8.049−24.7517.02658.988.22−0.24
1030Tri-Hexagon12.763−0.4716.85159.348.870.56
1140Cubic14.739−5.833.581−183.249.320.64
Table 3. Analysis of variance (ANOVA) for modulus.
SourceSum of
Squares
dfMean
Square
F
Value
p-Value
Prob > F
Model5664.5951132.921.870.2550
A-IP5395.1615395.168.890.0307
B-Pattern67.32167.320.110.7526
AB49.64149.640.0820.7864
A21.5511.552.547 × 10−30.9617
B2359.981359.980.590.4760
Residual3034.795606.96
Lack of Fit2143.833714.611.600.4063
Pure Error890.952445.48
Cor Total8699.3710
Table 4. Analysis of variance (ANOVA) for elongation at break.
SourceSum of
Squares
dfMean
Square
F
Value
p-Value
Prob > F
Model0.1350.0250.610.6992
A-IP0.03810.0380.920.3818
B-Pattern0.07510.0751.820.2353
AB8.564 × 10−318.564 × 10−30.210.6674
A21.255 × 10−411.255 × 10−43.050 × 10−30.9581
B21.383 × 10−311.383 × 10−30.0340.8618
Residual0.2150.041
Lack of Fit0.1430.0481.530.4193
Pure Error0.06320.031
Cor Total0.3310
Table 5. Analysis of variance (ANOVA) for Weight.
SourceSum of
Squares
dfMean
Square
F
Value
p-Value
Prob > F
Model8.050 × 10−651.610 × 10−6123.12<0.0001
A-IP7.529 × 10−617.529 × 10−6575.76<0.0001
B-Pattern9.611 × 10−919.611 × 10−90.730.4304
AB2.714 × 10−812.714 × 10−82.080.2093
A21.995 × 10−711.995 × 10−715.260.0113
B21.011 × 10−811.011 × 10−80.770.4195
Residual6.538 × 10−851.308 × 10⁻⁸
Lack of Fit6.075 × 10−832.025 × 10−88.740.1044
Pure Error4.633 × 10−922.317 × 10⁻⁹
Cor Total8.115 × 10−610
Table 6. Constraints and criteria of input parameters and responses.
Parameters/
Responses
NameGoalLower
Limit
Upper
Limit
Importance
ParametersA: IPis in range10503
B: Patternis in range−223
ResponsesModulusmaximize8.04917.5193
Elongation at Breakmaximize1.80517.0273
Weightminimize7.819.723
Table 7. Predicted optimum results.
No.IP
(%)
PatternDesirabilityModulus (MPa)Elongation at Break
(mm)
Weight
(g)
130.916−2.0000.81815.58220.0148.840
231.104−2.0000.81715.61020.1318.848
333.000−2.0000.80915.89421.3468.923
Disclaimer/Publisher’s Note: The statements, opinions and data contained in all publications are solely those of the individual author(s) and contributor(s) and not of MDPI and/or the editor(s). MDPI and/or the editor(s) disclaim responsibility for any injury to people or property resulting from any ideas, methods, instructions or products referred to in the content.