


Automatic Piston-Type Flow Standard Device Calibration System

Abstract
:1. Introduction
2. Flow Standard Devices and Their Automation Design
2.1. Design Concept
2.2. Device Design and Operation
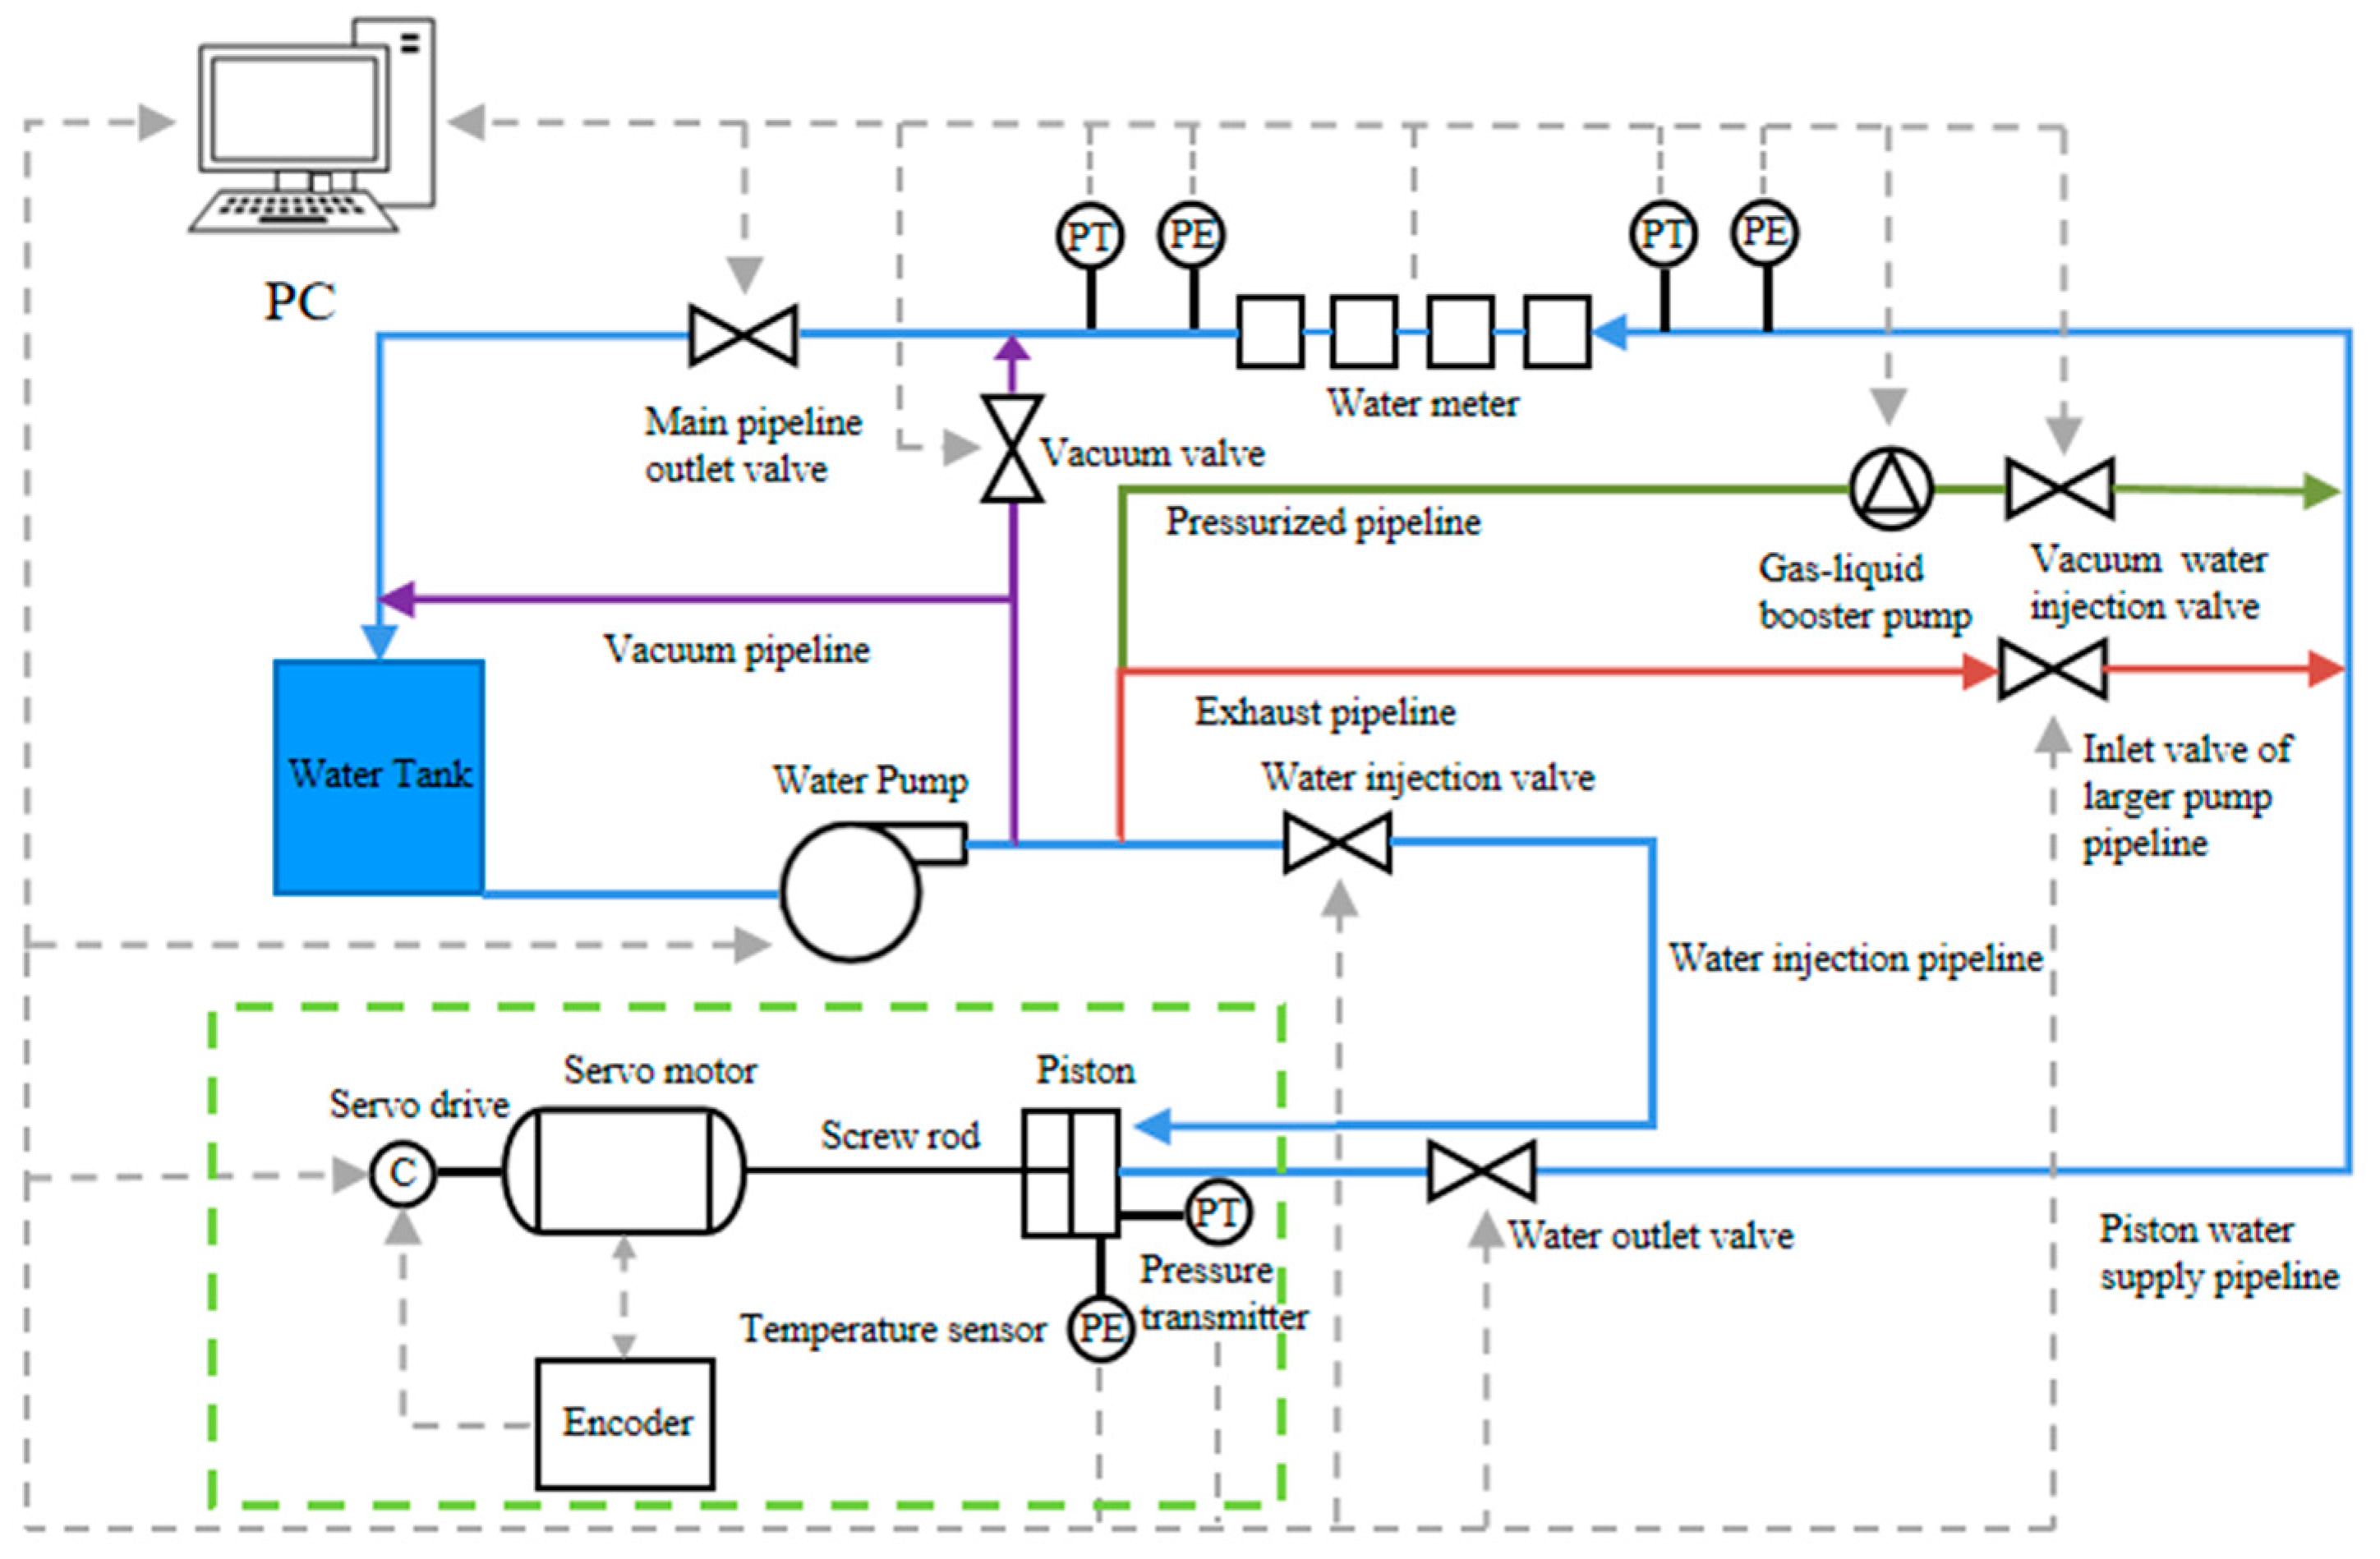
2.2.1. Overall Device Design
- To ensure the metering performance of the water meter, the automation control system sends commands to start the water pump for the water supply to exhaust the gas in the pipeline before the daily calibration of the water meter for the flow standard device. Meanwhile, vacuum operation is carried out for the tested meter [22].
- Based on the water meter’s caliber and flow points, the pulse frequency and quantity are set to control the speed and displacement of the servo motor, with real-time feedback on the servo motor’s velocity and position provided by the encoder. Once the settings are completed, the control system issues commands to the solenoid valve, servo motor, and water pump. The servo motor drives the piston device, injecting water into the piston device.
- When the injected water in the piston assembly reaches the set flow rate, the water pump stops. At the same time, the control system opens the piston outlet valve and the main pipeline outlet valve; when the water flow stabilizes, water meter calibration is accomplished through the flow calibration algorithm.
2.2.2. Design of the Piston Device
2.3. Automation Control of the Flow Calibration Device
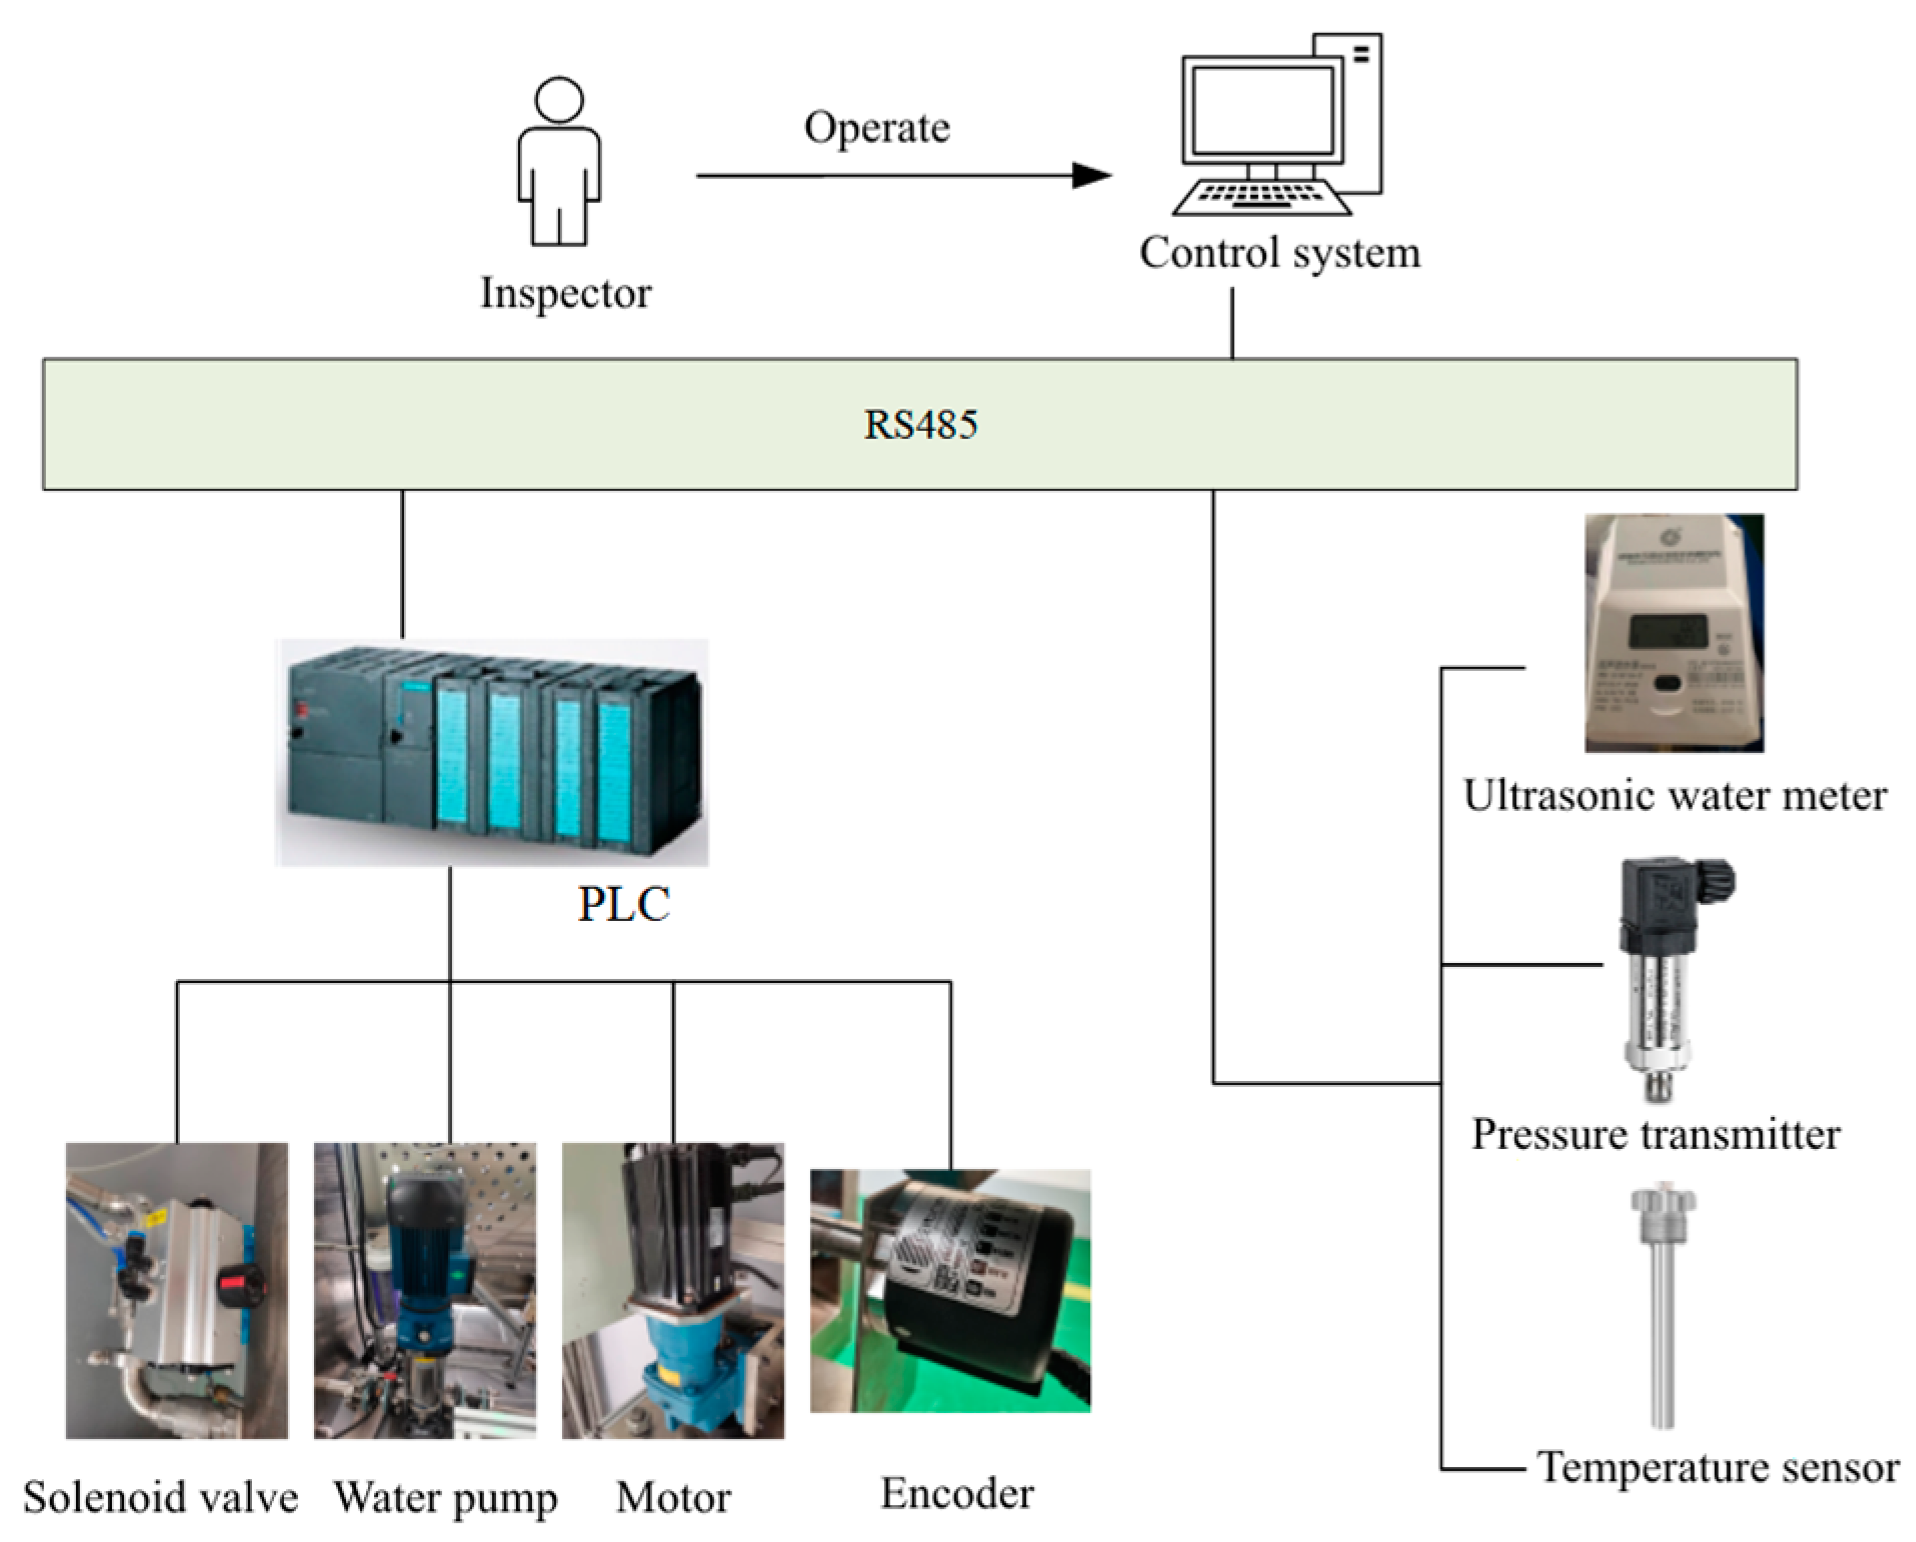
3. Design of the Automation Control System
3.1. System Functionality Design
- 1.
- Main Interface of the Automation Control System
- 2.
- Automated Testing and Manual Testing
- 3.
- Data Management
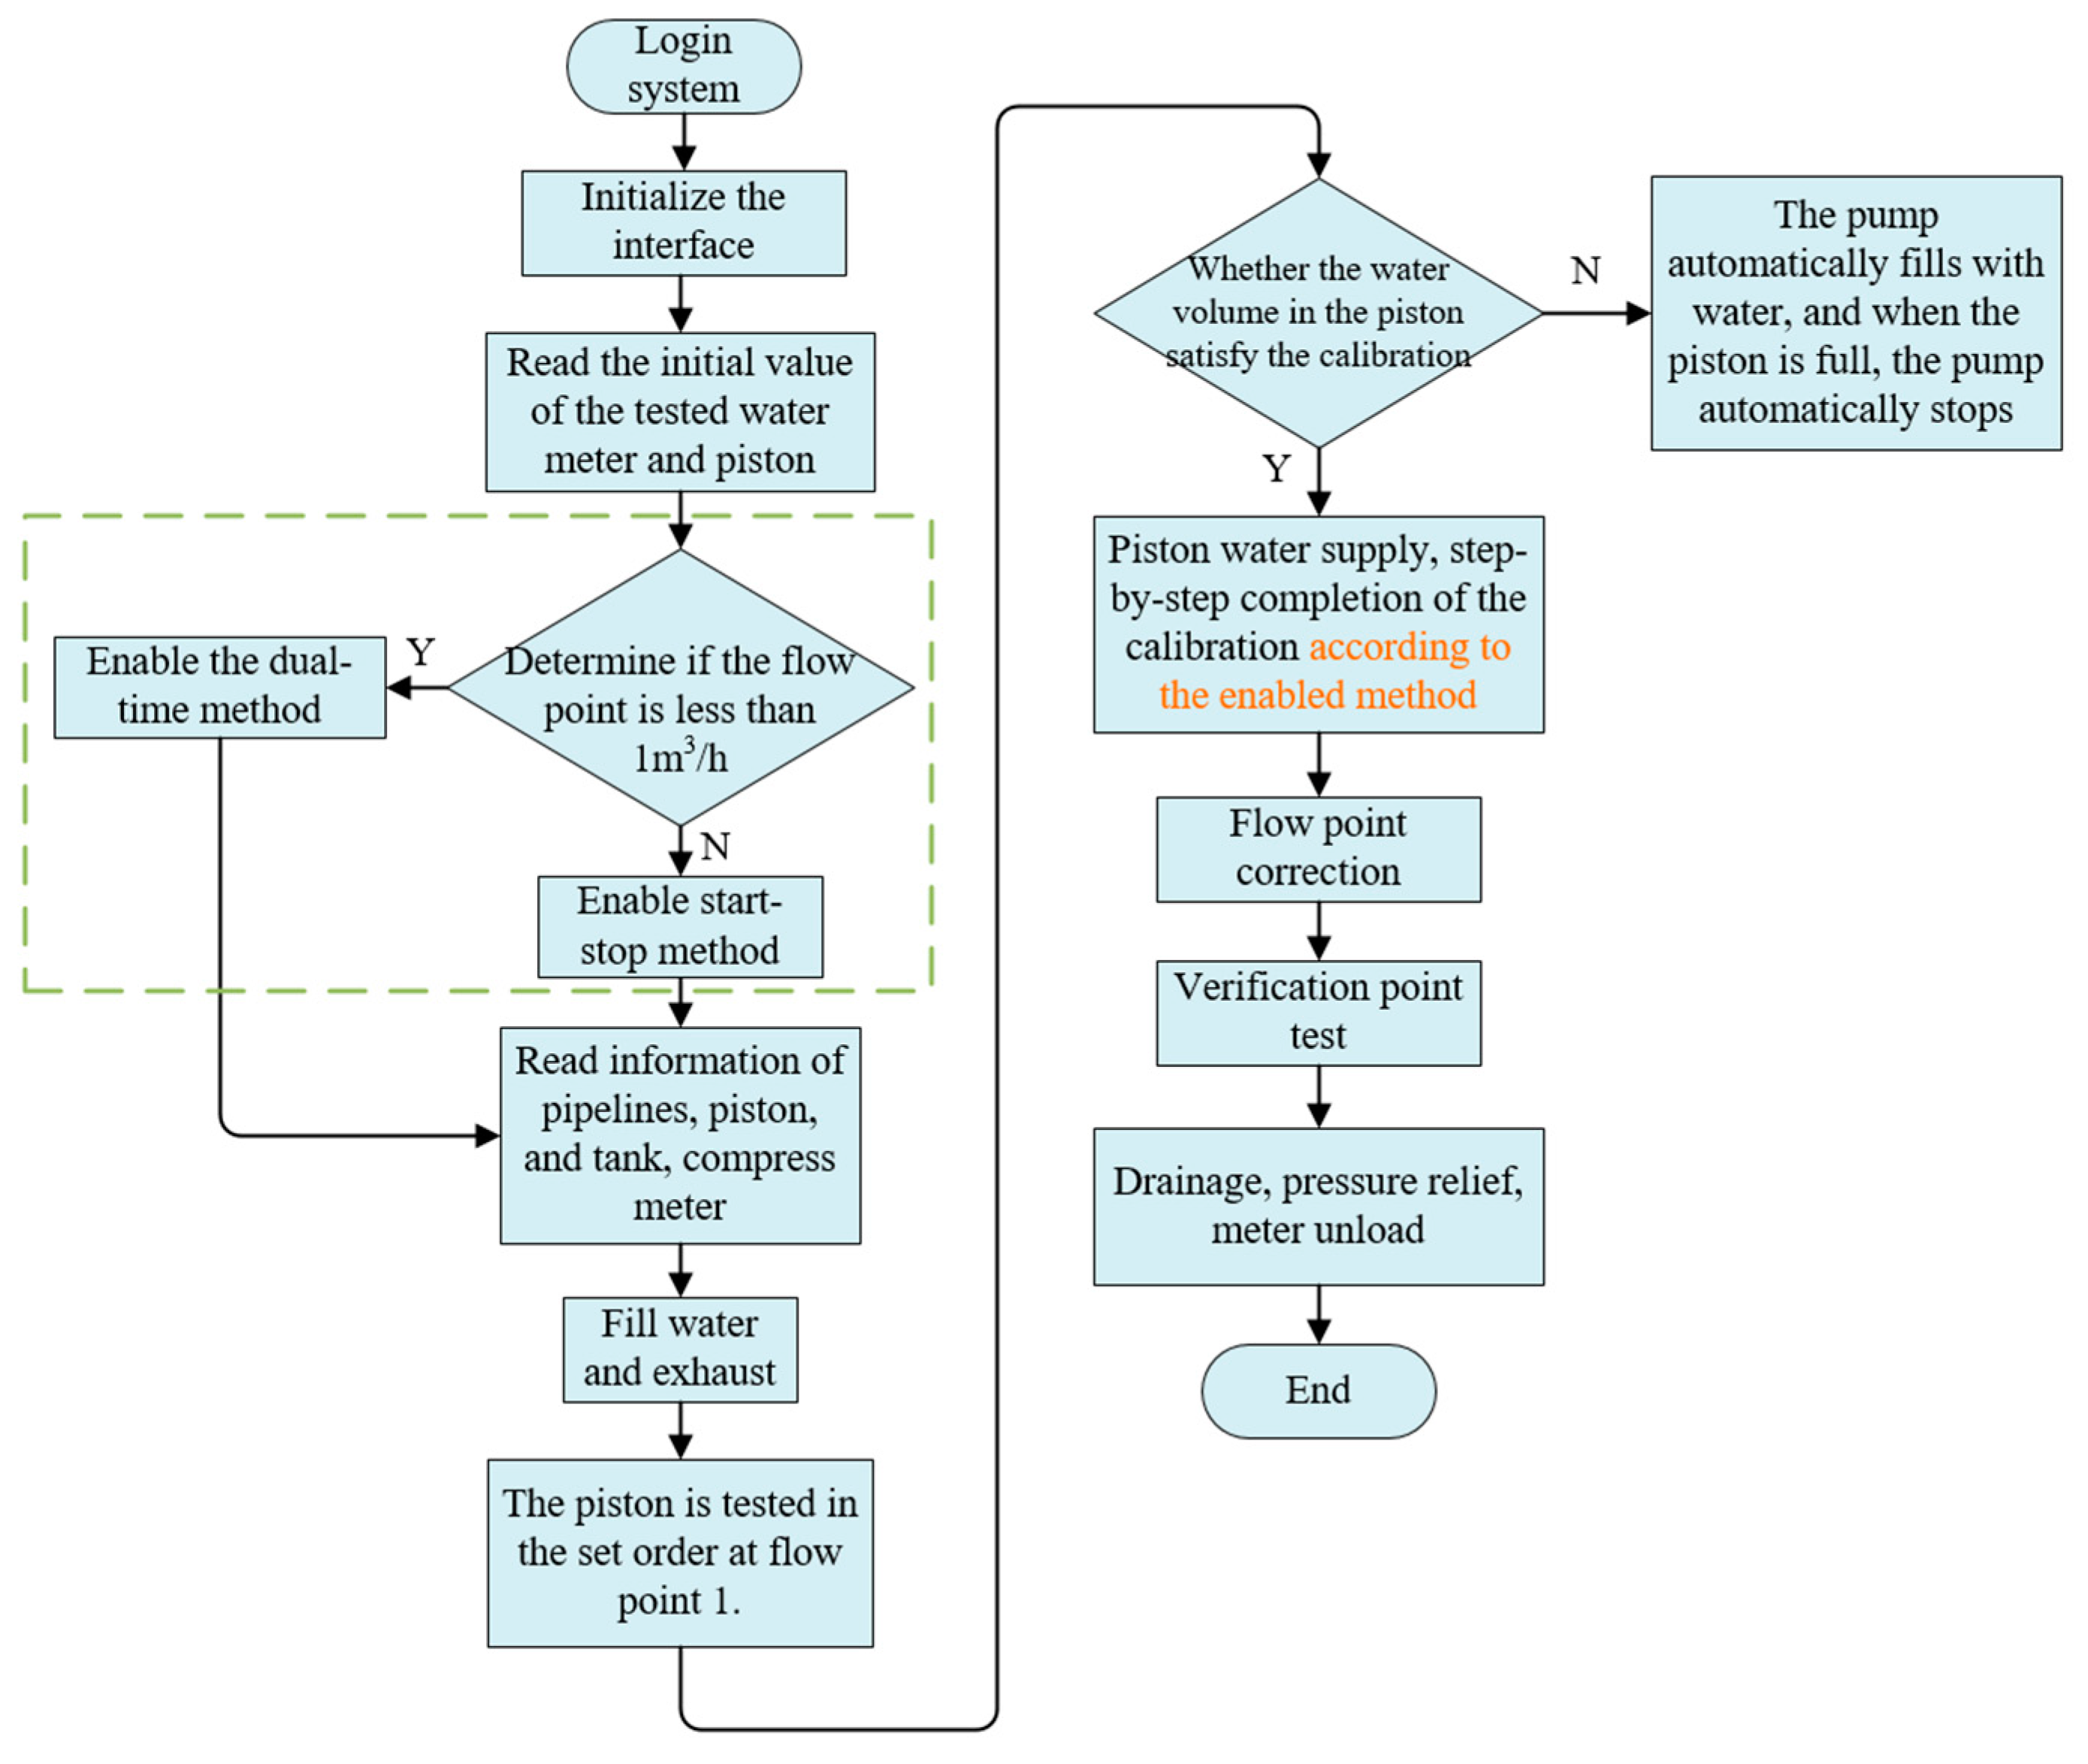
3.2. Design of the Automation Control Algorithm
3.2.1. Design of the Flow Calibration Algorithm
- 1.
- The start–stop method
- 2.
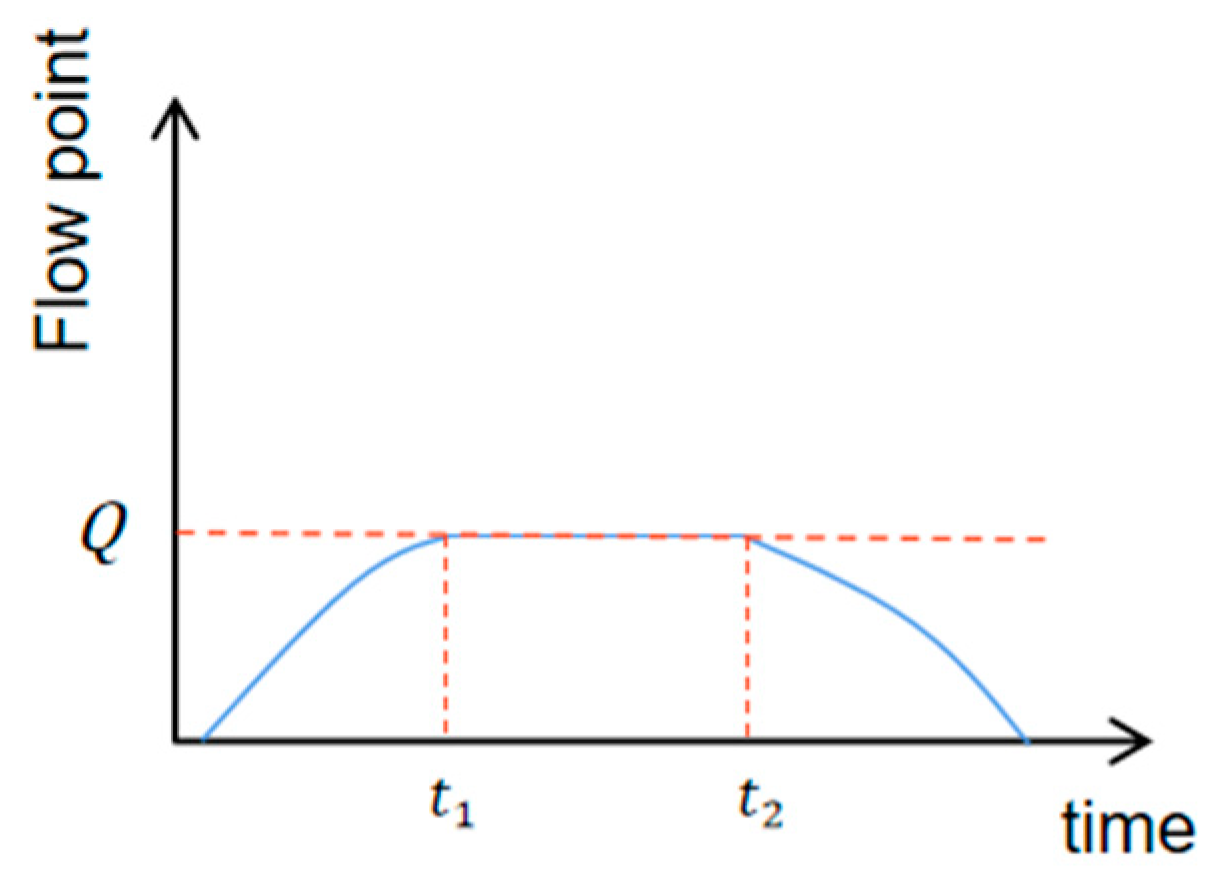
- The dual-time method
3.2.2. Design of the Flow Correction Algorithm
4. Experiment and Analytics
4.1. Assessment of Device Uncertainty
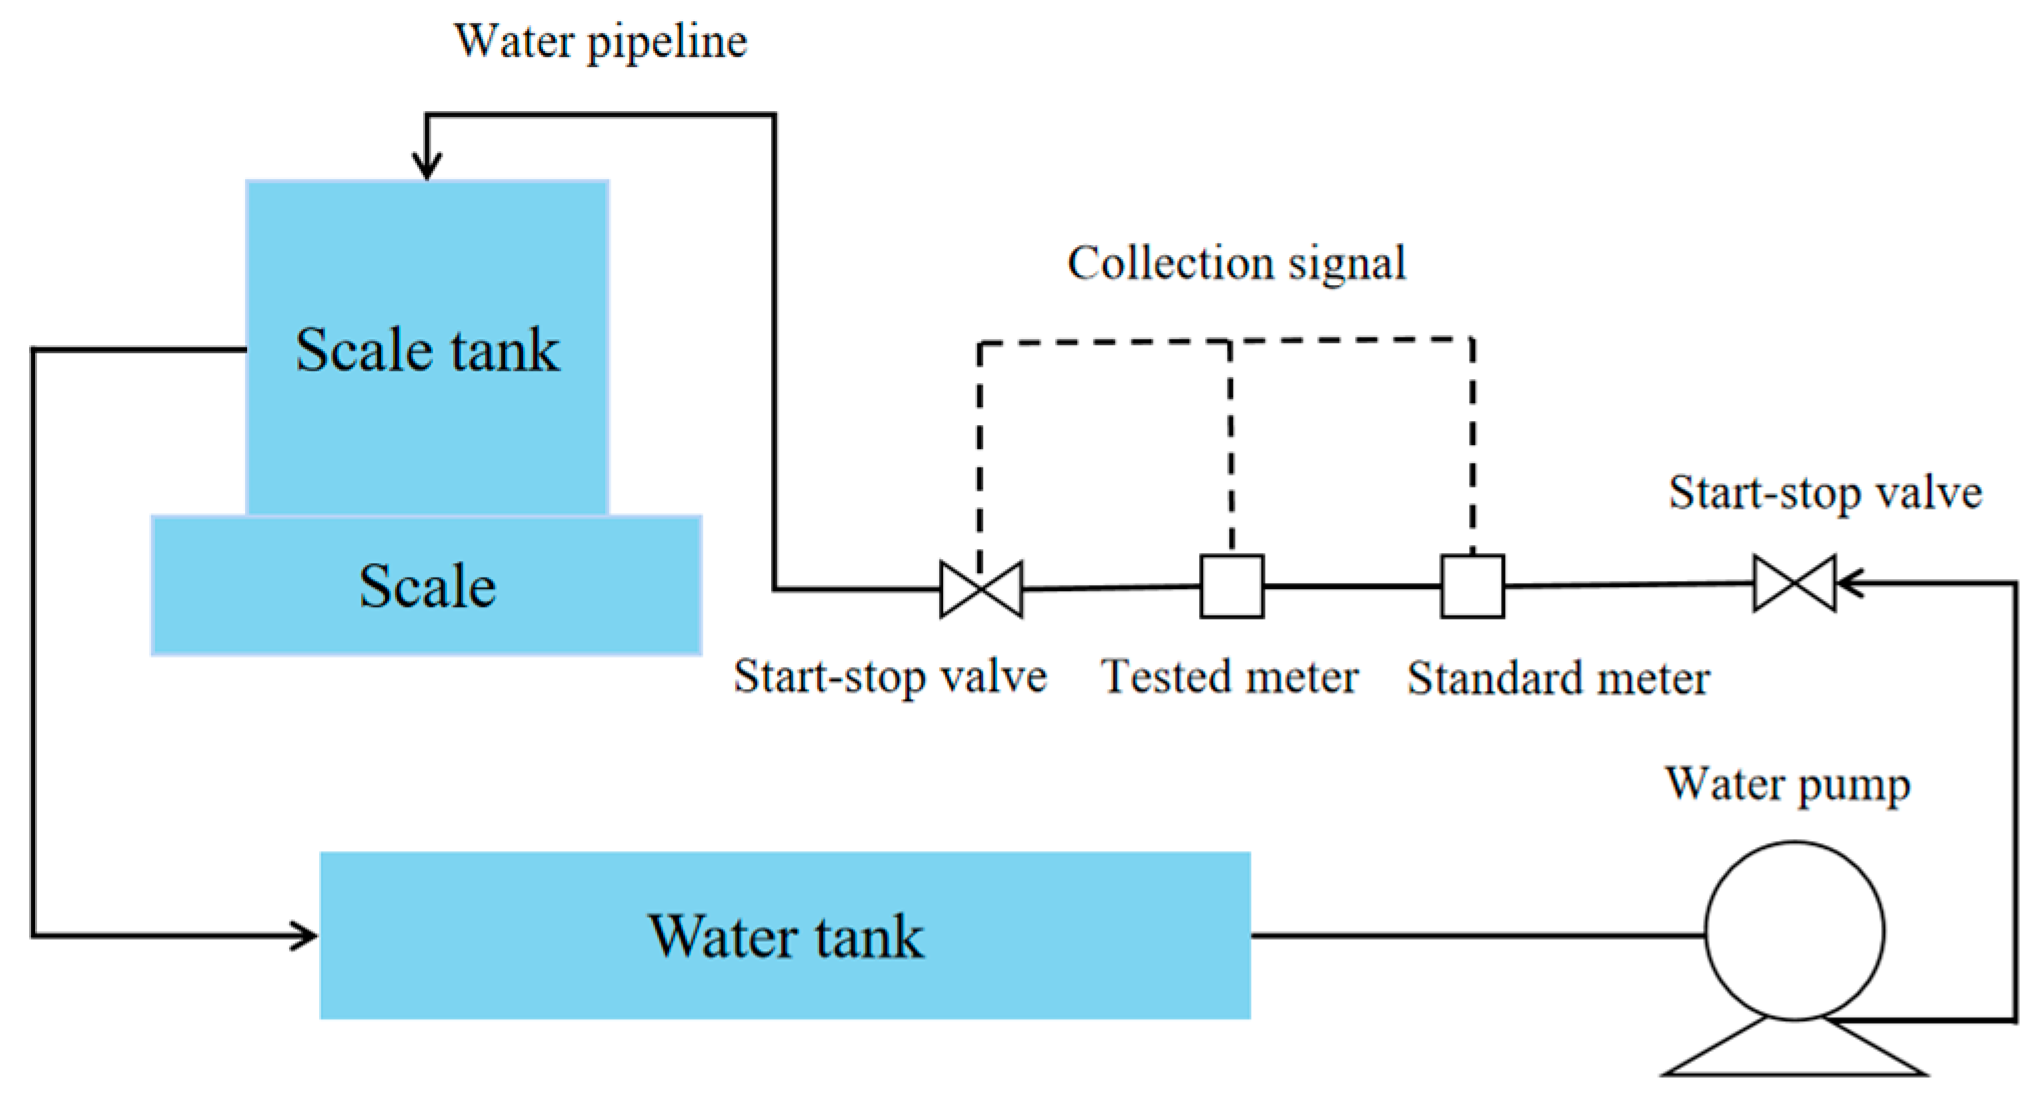
4.1.1. Uncertainty Assessment Method
4.1.2. Analysis and Results of Device Uncertainty
- 1.
- Uncertainty introduced by the piston inner diameter
- 2.
- Uncertainty introduced by screw pitch accuracy
- 3.
- Uncertainty introduced by the piston cylinder leakage factor
- 4.
- Uncertainty introduced by temperature
- 5.
- Uncertainty introduced by pressure
- 6.
- Uncertainty introduced by measurement of the calibration time
- 7.
- Uncertainty introduced by device repeatability
4.2. Water Meter Calibration Testing
4.2.1. Basis for Flow Calibration
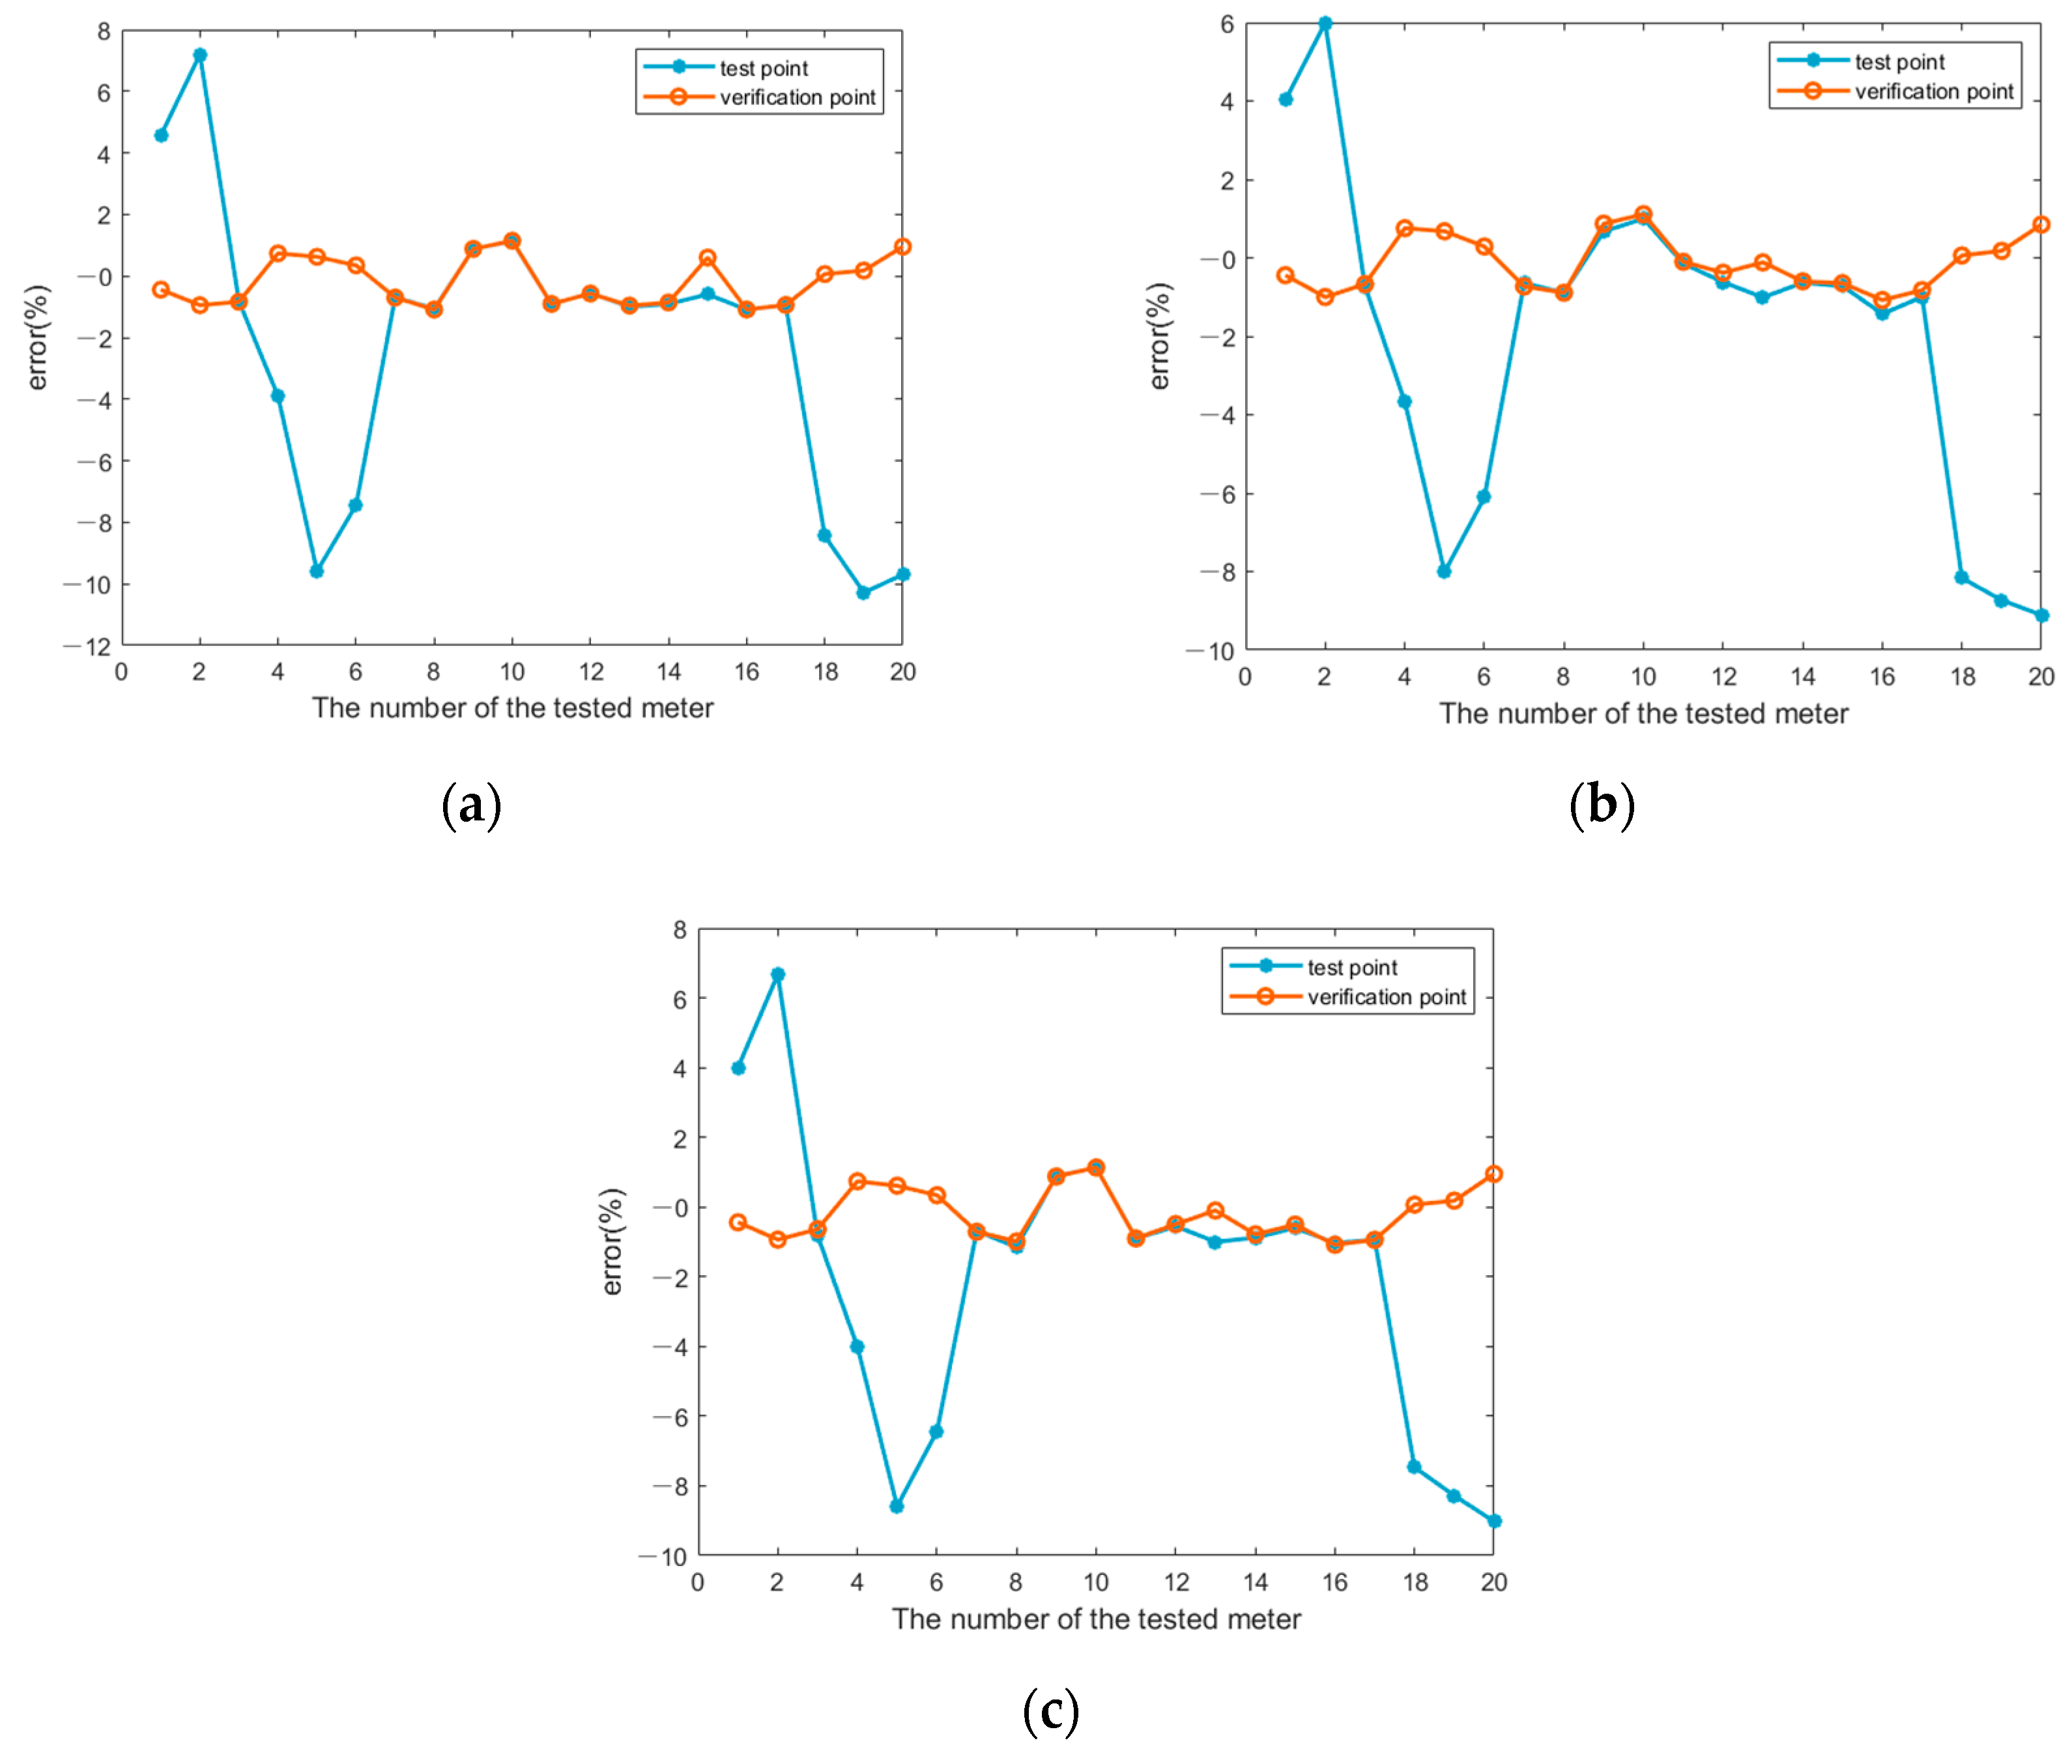
4.2.2. Analysis of Indication Error
4.2.3. Analysis of Repeatability
5. Conclusions
- This research determined the overall design plan of an automation calibration system for a piston-type flow standard device, clarified the objectives of the calibration system, and designed the overall structure of the system.
- To calibrate residential ultrasonic water meters ranging from DN15 to DN20, a piston-type flow standard device was designed and implemented. The automatic calibration of ultrasonic water meters using the piston-type flow standard device was achieved. Furthermore, the system can also be expanded to calibrate heat meters, making it applicable in a wider range of scenarios.
- The automation control system of the flow standard device was designed, and the system achieved fully automated calibration of water meters. During the calibration process for a water meter, there is no need for personnel to operate it, and automatic opening and closing of the valve, starting and stopping of the water pump and motor, calibration of various flow points for the tested water meter, and correction of flow can be completed; this significantly enhances the efficiency of the calibration process. Additionally, an algorithm combining the start–stop method and dual-time method was developed to calibrate the flow points of water meters, along with the design of a flow correction algorithm.
- Uncertainty analysis and flow calibration tests were successfully conducted. The standard uncertainty and expanded uncertainty were determined to be 0.013% and 0.026%. Water meter calibration tests were completed, and the results showed that the repeatability and indication error of the ultrasonic water meter are at relatively low levels and within the allowable error range.
Author Contributions
Funding
Data Availability Statement
Conflicts of Interest
References
- Krejčí, J.; Ježová, L.; Kučerová, R. The Measurement of Small Flow. Sens. Actuators A 2017, 266, 308–313. [Google Scholar] [CrossRef]
- Giurco, D.; Bossilkov, A.; Patterson, J. Developing Industrial Water Reuse Synergies in Port Melbourne: Cost Effectiveness, Barriers and Opportunities. J. Clean. Prod. 2011, 19, 867–876. [Google Scholar] [CrossRef]
- Pope, J.G.; Wright, J.D. Performance of Coriolis Meters in Transient Gas Flows. Flow Meas. Instrum. 2014, 37, 42–53. [Google Scholar] [CrossRef]
- Susanto, L.O.F.; Raharjo, A.B.; Haq, F. Asset Monitoring of Water Meters Using Integration of GIS and Low-Cost GNSS. IOP Conf. Ser. Earth Environ. Sci. 2023, 1127, 012005. [Google Scholar] [CrossRef]
- Lazzari, A.; Pou, J.M.; Dubois, C. Smart Metrology: The Importance of Metrology of Decisions in the Big Data Era. IEEE Instrum. Meas. Mag. 2017, 20, 22–29. [Google Scholar] [CrossRef]
- Liu, Z.; Chen, M.; Xin, Z. Research on a Dual-Mode Infrared Liquid-Crystal Device for Simultaneous Electrically Adjusted Filtering and Zooming. Micromachines 2019, 10, 137. [Google Scholar] [CrossRef] [PubMed]
- Mela, H.; Peltomaa, J.; Salo, M. Framing Smart Meter Feedback in Relation to Practice Theory. Sustainability 2018, 10, 3553. [Google Scholar] [CrossRef]
- Ruis, V.; Hernandez, N.C. Uncertainty Analysis in Piston Prover Calibration. In Proceedings of the Flomeko, Salvador, Brazil, 5–8 June 2000; pp. 619–624. [Google Scholar]
- Ziaie, B.; Baldi, A.; Lei, M.; Gu, Y.; Siegel, R.A. Hard and soft micromachining for BioMEMS: Review of techniques and examples of applications in micro-fluidics and drug delivery. Adv. Drug Deliv. Rev. 2004, 56, 145–172. [Google Scholar] [CrossRef] [PubMed]
- Yeh, T.T.; Aguilera, J.; Wright, J.D. Hydrocarbon Liquid Flow Calibration Service; NIST Special Publication 250-1039; National Institute of Standards and Technology: Gaithersburg, MD, USA, 2005.
- David, C.; Claudel, P. Water flow facility in france novel. In Proceedings of the 15th Flow Measurement Conference (FLOMECO), Taipei, Taiwan, 13–15 October 2010. [Google Scholar]
- Pope, J.G.; Wright, J.D.; Johnson, A.N. Liquid Flow Meter Calibrations with the 0.1 L/s and the 2.5 L/s Piston Provers; NIST Special Publication; National Institute of Standards and Technology: Gaithersburg, MD, USA, 2013.
- Jaiswal, S.K.; Yadav, S.; Agarwal, R. Design and development of a novel water flow measurement system. Measurement 2017, 105, 120–129. [Google Scholar] [CrossRef]
- Li, D.F.; Li, Z.X.; Liu, H.W. Research on unsteady flow measurement standard device based on active piston. Flow Meas. Instrum. 2023, 91, 102340. [Google Scholar]
- Jaiswal, S.K.; Yadav, S.; Bandyopadhyay, A.K. Global water flow measurement and calibration facilities: Review of methods and instrumentations. Mapan 2012, 27, 63–76. [Google Scholar] [CrossRef]
- Schumann, D.; Kroner, C.; Unsal, B. Measurements of water consumption for the development of new test regimes for domestic water meters. Flow Meas. Instrum. 2021, 79, 101963. [Google Scholar] [CrossRef]
- ISO/IEC GUIDE 98-3; Uncertainty of Measurement-Part 3: Guide to the Expression of Uncertainty in Measurement (GUM: 1995). International Organization for Standardization: Geneva, Switzerland, 2008.
- Yeh, T.T.; Espina, P.I.; Mattingly, G.E. An Uncertainty Analysis of a NIST Hydrocarbon Liquid Flow Calibration Facility. In Proceedings of the ASME 2004 Heat Transfer/Fluids Engineering Summer Conference, Charlotte, NC, USA, 11–15 July 2004; Volume 1, pp. 575–586. [Google Scholar]
- Lee, C.H.; Jeon, H.K.; Hong, Y.S. An Implementation of Ultrasonic Water Meter Using DToF Measurement. Cogent Eng. 2017, 4, 1371577. [Google Scholar] [CrossRef]
- Bellinga, H.; Delhez, F.J. Experience with a High-Capacity Piston Prover as a Primary Standard for High-Pressure Gas Flow Measurement. Flow Meas. Instrum. 1993, 4, 85–89. [Google Scholar] [CrossRef]
- Cheng, J.M.; Zeng, X.J.; Liu, Z. Research on Dynamic Modeling and Electromagnetic Force Centering of Piston/Piston Rod System for Labyrinth Piston Compressor. Proc. Inst. Mech. Eng. 2016, 230, 786–798. [Google Scholar] [CrossRef]
- Duan, J.M.; Liu, H.S.; Tao, J.L. Experimental Study on Gas–Liquid Interface Evolution during Liquid Displaced by Gas of Mobile Pipeline. Energies 2022, 15, 2489. [Google Scholar] [CrossRef]
- Sakama, S.; Tanaka, Y.; Kamimura, A. Characteristics of Hydraulic and Electric Servo Motors. Actuators 2022, 11, 11. [Google Scholar] [CrossRef]
- Asvadi-Kermani, O.; Felegari, B.; Momeni, H. Adaptive constrained generalized predictive controller for the PMSM speed servo system to reduce the effect of different load torques. e-Prime Adv. Electr. Eng. Electron. Energy 2022, 2, 100032. [Google Scholar] [CrossRef]
- Zhao, J.L. Development of Watermeter Automatic Test Device and Measuring Uncertainty Analysis Based on Double-time Method. CN ZL200910302993.7, 22 December 2009. [Google Scholar]
- Wang, J.; Deng, H.X.; Wu, Y.M. A Self-Adaptive Method for the Assessment of Dynamic Measurement Uncertainty. Measurement 2022, 196, 111116. [Google Scholar] [CrossRef]
- EFSA Scientific Committee; Benford, D.; Halldorsson, T. Guidance on Uncertainty Analysis in Scientific Assessments. EFSA J. 2018, 16, e05123. [Google Scholar] [PubMed]
- Kramer, R.; Mickan, B.; Dopheide, D. Double Piston Prover Usable as Flowrate Comparator for Various Gases. In Proceedings of the IMEKO World Congress, Brazilian Congress of Metrology, Rio de Janeiro, Brazil, 17–22 September 2006. [Google Scholar]
- JJG 162-2019; Verification Regulation of Cold Water Meter. The State Bureau of Quality and Technical Supervision: Beijing, China, 2019.
- JJF 1033-2016; Rule for the Examination of Measurement Standard. The State Bureau of Quality and Technical Supervision: Beijing, China, 2016.


| DN/mm | Common Flow/m3/h | Boundary Flow/m3/h |
|---|---|---|
| 15 | 2.5 | 0.016 |
| 20 | 4 | 0.025 |
| Number | Adjustment Segment/mL | Average Volume/mL | Standard Deviation/mL | Repeatability/% |
|---|---|---|---|---|
| 1 | 0–5560 | 5560.158 | 0.110 | 0.005 |
| 2 | 5560–11,120 | 5560.266 | 0.123 | 0.005 |
| 3 | 11,120–16,680 | 5560.403 | 0.157 | 0.007 |
| 4 | 16,680–22,240 | 5560.372 | 0.205 | 0.009 |
| 5 | 22,240–27,800 | 5560.283 | 0.238 | 0.011 |
| DN15 Test Flow Points/m3/h | DN15 Corresponding Detection Required Flow/L | DN20 Test Flow Points/m3/h | DN20 Corresponding Detection Required Flow/L |
|---|---|---|---|
| 2.5 | 30 | 4 | 30 |
| 0.16 | 7.8 | 0.25 | 12.5 |
| 0.04 | 4 | 0.064 | 6.4 |
| 0.016 | 1.6 | 0.025 | 2.5 |
| DN15 Test Flow Points/m3/h | DN15 Corresponding Detection Required Flow/L | DN20 Test Flow Points/m3/h | DN20 Corresponding Detection Required Flow/L |
|---|---|---|---|
| 2.5 | 30 | 4 | 30 |
| 0.016 | 1.6 | 0.025 | 2.5 |
| 0.01 | 1 | 0.016 | 1.6 |
| Flow Point/m3/h | Number | Water Indication Value/L | Piston Indication/L | Indication Error/% | Repeatability/% |
|---|---|---|---|---|---|
| 2.5 | 1 | 30.037 | 29.96 | 0.256 | 0.019 |
| 2 | 30.087 | 30.005 | 0.273 | ||
| 3 | 30.058 | 29.97 | 0.295 | ||
| 0.04 | 1 | 1.998 | 2.002 | 0.193 | 0.048 |
| 2 | 1.998 | 2.004 | 0.92 | ||
| 3 | 1.998 | 2.003 | 0.251 | ||
| 0.016 | 1 | 0.992 | 0.994 | −0.192 | 0.032 |
| 2 | 0.992 | 0.994 | −0.193 | ||
| 3 | 0.992 | 0.994 | −0.198 | ||
| 0.01 | 1 | 0.993 | 0.994 | −0.093 | 0.007 |
| 2 | 0.993 | 0.994 | −0.099 | ||
| 3 | 0.994 | 0.995 | −0.107 |
| Flow Point/m3/h | Number | Water Indication Value/L | Piston Indication/L | Indication Error/% | Repeatability/% |
|---|---|---|---|---|---|
| 4 | 1 | 20.93 | 21.07 | −0.646 | 0.032 |
| 2 | 22.02 | 22.17 | −0.698 | ||
| 3 | 20.92 | 21.05 | −0.637 | ||
| 0.25 | 1 | 12.31 | 12.45 | −0.656 | 0.034 |
| 2 | 12.31 | 12.43 | 0.613 | ||
| 3 | 12.32 | 12.45 | 0.632 | ||
| 0.064 | 1 | 6.36 | 6.39 | −0.276 | 0.037 |
| 2 | 6.37 | 6.39 | −0.233 | ||
| 3 | 6.37 | 6.39 | −0.228 | ||
| 0.025 | 1 | 2.51 | 2.5 | 0.424 | 0.021 |
| 2 | 2.51 | 2.5 | 0.384 | ||
| 3 | 2.51 | 2.5 | 0.414 | ||
| 0.016 | 1 | 1.6 | 1.6 | 0.393 | 0.181 |
| 2 | 1.61 | 1.6 | 0.706 | ||
| 3 | 1.61 | 1.6 | 0.832 |
Disclaimer/Publisher’s Note: The statements, opinions and data contained in all publications are solely those of the individual author(s) and contributor(s) and not of MDPI and/or the editor(s). MDPI and/or the editor(s) disclaim responsibility for any injury to people or property resulting from any ideas, methods, instructions or products referred to in the content. |
© 2023 by the authors. Licensee MDPI, Basel, Switzerland. This article is an open access article distributed under the terms and conditions of the Creative Commons Attribution (CC BY) license (https://creativecommons.org/licenses/by/4.0/).
Share and Cite
Song, X.; Wang, X.; Ma, M. Automatic Piston-Type Flow Standard Device Calibration System. Mathematics 2023, 11, 3802. https://doi.org/10.3390/math11183802
Song X, Wang X, Ma M. Automatic Piston-Type Flow Standard Device Calibration System. Mathematics. 2023; 11(18):3802. https://doi.org/10.3390/math11183802
Chicago/Turabian StyleSong, Xinming, Xiaoli Wang, and Min Ma. 2023. "Automatic Piston-Type Flow Standard Device Calibration System" Mathematics 11, no. 18: 3802. https://doi.org/10.3390/math11183802
APA StyleSong, X., Wang, X., & Ma, M. (2023). Automatic Piston-Type Flow Standard Device Calibration System. Mathematics, 11(18), 3802. https://doi.org/10.3390/math11183802