Article

Stochastic Finite Element Analysis of Plate Structures Considering Spatial Parameter Random Fields

1
College of Civil Engineering, Fuzhou University, Fuzhou 350118, China
2
Department of Civil Engineering, Fuzhou University Zhicheng College, Fuzhou 350001, China
3
College of Civil Engineering, Fujian University of Technology, Fuzhou 350118, China
*
Author to whom correspondence should be addressed.
Mathematics 2023, 11(11), 2535; https://doi.org/10.3390/math11112535
Submission received: 1 May 2023 / Revised: 25 May 2023 / Accepted: 29 May 2023 / Published: 31 May 2023

Abstract

:
For plate structures, their random parameters can be regarded as a two-dimensional random field in the plane. To solve the plate theory considering a two-dimensional random field, an efficient strategy for the stochastic finite element method was adopted. Firstly, the stochastic finite element method was used to establish the plate structural model, in which the random field characteristics of the parameter were considered, and the mathematical expression of its random field was obtained through the Karhunen–Loève expansion; secondly, the point estimate method was applied to calculate the statistics of random structures. The computational efficiency can be significantly improved through the reference point selection strategy. The accuracy and efficiency of the calculation strategy were verified, and the influences of correlation length and coefficient of variation of the parameter on the random response of plate structures under different plate types (including Kirchhoff plate and Mindlin plate) and boundary conditions (including simply supported and clamped supported) were discussed. The proposed method can provide some help in solving static problems of plate structures.

1. Introduction

Engineering structures have random material properties and geometric parameters due to their construction, materials, and other factors. These parameters have spatial characteristics, for example, the randomness of material properties in mass concrete structures, the randomness of geometric irregularities in track structures [1,2,3], and the randomness of soil layer properties in geotechnical and slope engineering [4]. Random fields are the common name for these random features. The influence of random fields on the reliability of some engineering structures cannot be ignored. The stochastic finite element method (SFEM) has been proposed in order to completely account for the spatial characteristics of parameters in the reliability study [5].
On the random field problem of structures, numerous scholars have conducted a variety of investigations. Du et al. [6] analyzed the structural dynamic analysis considering discrete random parameters and the finite element method (FEM), and used a multi-dimensional kernel density estimation approach to estimate the probability density function (PDF) of random natural frequency, and this strategy can solve the robust nondeterministic free vibration problem. For predicting the structural horizontal strength of composite laminates, Nastos et al. [7] developed a deep learning algorithm based on convolutional neural networks and trained it using the datasets from probabilistic failure analysis generated by SFEM. The fibers in CFRP have great randomness in spatial distribution; to explore the influence of spatial randomness on its structural mechanical behavior, Nastos and Zarouchas [8] proposed an advanced numerical tool that can perform random FEM of composite structures considering material uncertainty by distributing random mechanical properties along the domain. The output of the analysis is the PDF of the deformation, strain, stress, and failure field. This tool utilized Karhunen–Loève (KL) expansion and Latin hypercube sampling methods to determine the distribution of random mechanical properties, and used mature first-order shear deformation theory and random variable methods to calculate the random stiffness matrix, and also applied Puck failure criteria for different failure modes in composite structural probability analysis. Usually, in the process of solving random responses, it is considered that the various random responses in the solution are coupled, while, Zheng et al. [9,10] used a new weak-intrusion SFEM to calculate the random displacement of the structure at all spatial positions; the random displacements were decoupled into a series of combinations of deterministic displacements with random variable coefficients. Then, an iterative algorithm for solving deterministic displacements and corresponding random variables was presented. The proposed method could be applied to high-dimensional stochastic problems without any modifications. The convergence and accuracy of nonlinear stochastic finite element solutions of solid mechanics were always a thorny problem. Pokusiński and Kamiński [11] proposed an algorithm for determining the basic probability characteristics using the iterative generalized random higher-order perturbation method near symmetric truncated Gaussian random variables. It has been confirmed that the use of sufficiently high-order truncated iterative random perturbation techniques allows for arbitrary desired accuracy in determining up to fourth-order probabilistic characteristics of static structural responses.
Slab or plate structure is an important component of engineering structures, such as floor slabs in building structures, bridge decks in bridge engineering, track slabs in railway engineering, etc. Similarly, there are spatial variabilities in plate structure. Therefore, many scholars pay attention to the SFEM problem of plate structure. Sepahvand [12] regarded the parameters as random variables and used generalized polynomial chaos expansion to capture the uncertainty of damping and frequency response functions of composite plate structures. The damped vibration of laminated plates was analyzed by the spectral stochastic finite element formula. Daneshvar et al. [13] compiled a simple and practical macro-FEM, including a concrete damage model, reinforcement diameter reduction, and corrosion volume change, and a large number of parametric and random simulations, in which the concrete non-uniformity was simulated using random field theory. In order to analyze the plate structure considering the parametric random field, an efficient calculation method was proposed by Huo et al. [14], in which the random fields were represented by KL expansion, and the PDFs of the response were obtained by probability direct integration method, and then its statistical characteristics could be obtained.
The computational efficiency of SFEM has always been the focus of scholars [14,15]. It mainly includes two aspects, one is the expression of a random field [16,17], and the other is the solution of a random response [15].
The purpose of this paper is to explore an efficient and accurate stochastic finite element analysis method considering a multi-dimensional random field for solving the problems of plate structures. In order to obtain the mathematical expression of the random field, the multi-dimensional random field was represented by KL expansion; based on the idea of multivariate reduction, and the statistics of the plate structural responses were calculated by the point estimate method (PEM), and with the optimal point selection strategy, the computational efficiency can be greatly improved. The logical structure of the following section is as follows: in Section 2, the finite element method for modeling plate structures considering multi-dimensional spatial random fields is presented. In Section 3, the SFEM calculation strategy based on the KLE-PEM (Karhunen–Loève expansion–point estimate method) is presented. In Section 4, the calculation strategy KLE-PEM-based SFEM is validated, and then the stochastic response for different boundary conditions and different plate types with different parameters is discussed.

2. FEM of Plate Considering Spatial Parameters

2.1. FEM of Plate Structure

Plate structure is a common component in engineering structures. In engineering structural analysis, it is usually classified into two types based on the width-to-thickness ratio of the plate including thin plate and thick plate. The thin plate is usually based on Kirchhoff plate theory, while the thick plate is based on Mindlin plate theory. For Kirchhoff plates, each element has four nodes, and each node has three degrees of freedom, namely, transverse x, longitudinal y, and vertical z. The node displacement can be expressed as
u = z w x , v = z w y , w = w x , y ,
where w is the out-of-plane displacement of the plate, and u and v are the in-plane displacements of the plate, respectively.
The stress in the plane is
ε x = z 2 w x 2 , ε y = z 2 w y 2 , γ x y = 2 z 2 w x y   ,
where ε x and ε y are the strains in the x and y directions, respectively, and γ x y is the shear strain.
Therefore, the constitutive equation is
σ x σ y τ x y = Q 1 Q 2 0 Q 2 Q 1 0 0 0 G ε x ε y γ x y ,
with
Q 1 = E 1 ν 2 , Q 2 = ν E 1 ν 2 , G = E 2 1 + ν ,
where E denotes the elastic modulus and ν denotes the Posson’s ratio.
Combining Equations (1)–(4), the elastic strain energy U of the element be written as the following equation,
U = 1 2 d e T Ω B T D B d Ω d e ,
with
B = B 1 B 2 B 3 T ,  
B 1 = ξ x 2 N ξ ξ + η x 2 N η η + 2 ξ x η x N ξ η + ξ x x N ξ + η x x N η ,  
B 2 = ξ y 2 N ξ ξ + η y 2 N η η + 2 ξ y η y N ξ η + ξ y y N ξ + η y y N η ,  
B 3 = 2 ξ x ξ y N ξ ξ + η x η y N η η + ξ x η y + ξ y η x N ξ η + ξ x y N ξ + η x y N η ,  
where N ξ ξ , N η η , N ξ η , N ξ , and N η are the shape functions, and ξ x and ξ y represent the relative coordinates of a point on the corresponding horizontal axes. More details can be found in Ferreira and Fantuzzi [18].
According to Equation (5), the stiffness matrix of Kirchhoff plate can be written as
K e = 1 1 1 1 B b T E x , Θ h 3 12 1 ν 2 B b det J d ξ d η ,
where ξ and η denote the relative coordinates of a point to its starting node; B b is the strain–displacement matrix considering bending deformation; and J is the Jacobi Matrix. E x , Θ represents the elastic modulus value at different positions and under random conditions, and x is the space point in the bounded space Ωs, and Θ denotes a group of uncorrelated random variables, and when E x , Θ is a Gaussian random field, it follows the standard normal distribution.
Similarly, for thick plates, i.e., Mindlin plates, the element stiffness matrix can be written as
K e = 1 1 1 1 B b T E x , Θ h 3 12 1 v 2 B b det J d ξ d η + 1 1 1 1 B s T κ E x , Θ t 2 1 + v B s det J d ξ d η ,
where B s is the strain–displacement matrix considering shear deformation; κ denotes the shear correction factor, and it equals 5/6 [19].
The content of this sub-section is the traditional plate finite element theory, it will not be repeated, more details can be found in the work of Ferreira and Fantuzzi [18].

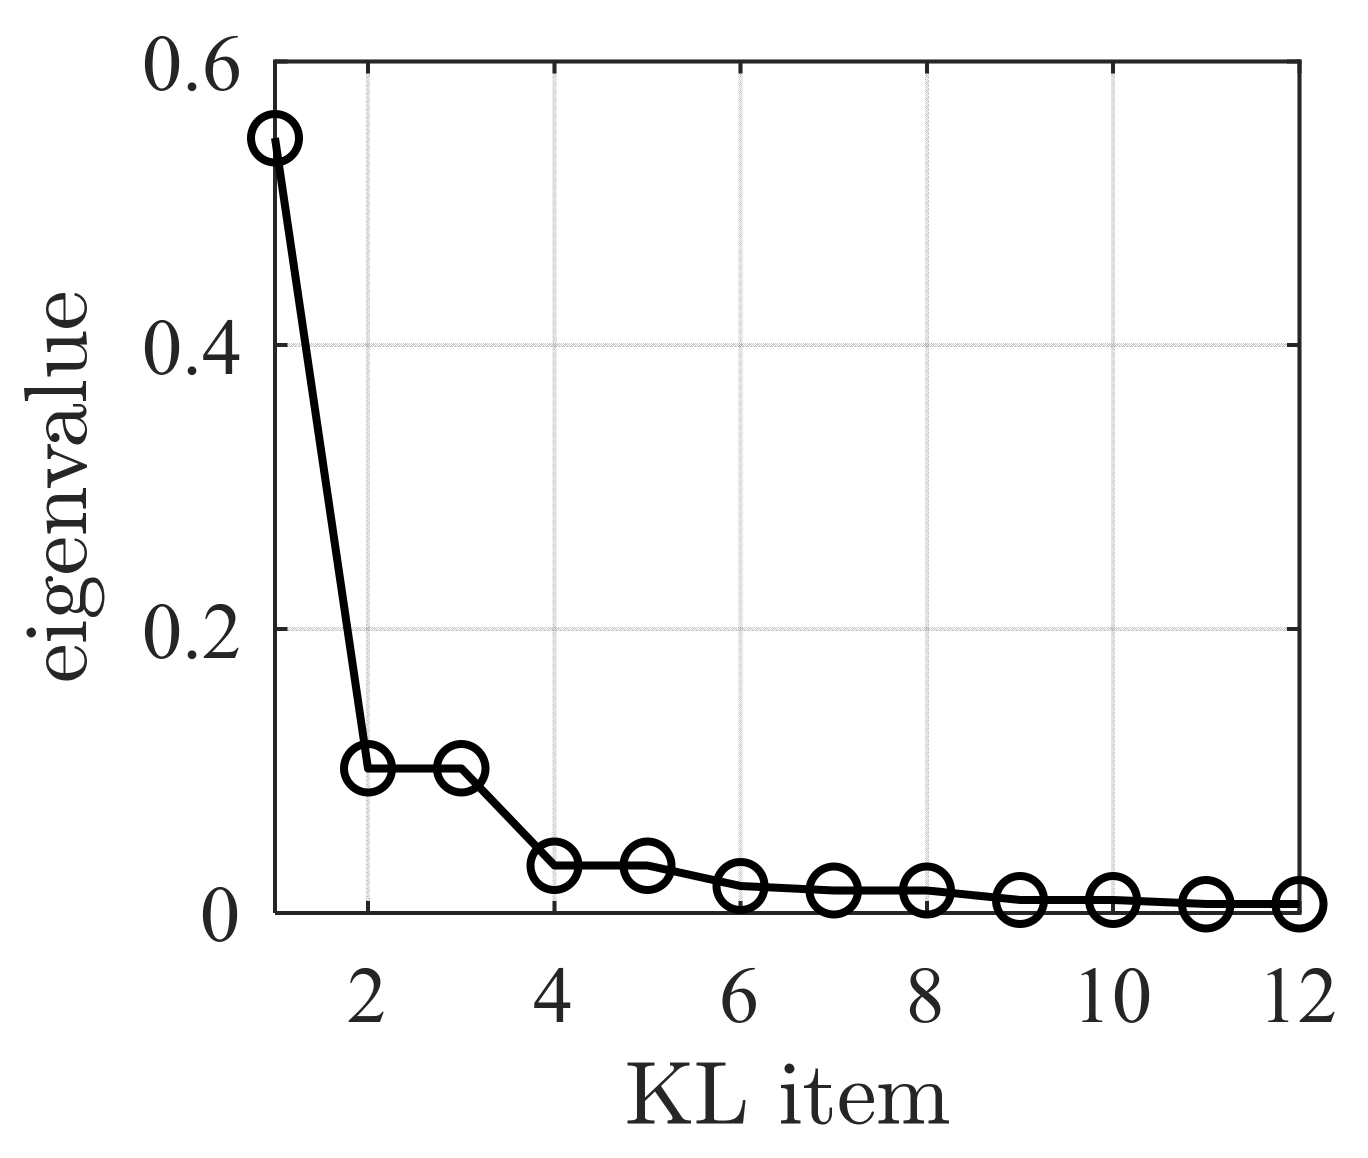
2.2. Mathematical Expression of a Random Field

The random field E x , Θ can be mathematically represented in various ways [20], in which KL expansion is currently the most popular method due to its excellent computational efficiency and convergence, and the basis expression can be written as follows:
E x , Θ = E ¯ x , Θ + i = 1 λ i Θ i f i x ,
where E ¯ x , Θ denotes the mean value of field; λ i and f i denote the eigenvalue and eigenfunction of autocovariance function C x 1 , x 2 of the random field, respectively, and the C x 1 , x 2 can be expressed as
C x 1 , x 2 = i = 1 λ i f i x 1 f i x 2 ,
where λ i and f i can be solved by the second Fredholm integral equation, which can be written as
D C x 1 , x 2 f i x 1 d x = λ i f i x 2 ,
where D denotes the random space.
To solve Equation (14), the analytical or numerical methods can be used, more details can be found in Ghanem and Spanos [5]. Usually, the expansion term can be truncated to obtain an approximate solution close to the exact solution of KL expansion, and Equation (12) can be re-written as the following formula,
E x , Θ = E ¯ x , Θ + E ˜ x , Θ = E ¯ x , Θ + i = 1 M λ i Θ i f i x ,
where M denotes the truncated item.
Substituting Equation (15) into Equation (12), the following formulas can be obtained,
K e = K ¯ e + K ˜ e ,
with
K ¯ e = 1 1 1 1 B T E ¯ x , Θ h 3 12 1 v 2 B det J d ξ d η ,
K ˜ e = 1 1 1 1 B T E ¯ x , Θ h 3 12 1 v 2 B det J d ξ d η = i = 1 M Θ i K ˜ i e ,
with
K ˜ i e = 1 1 1 1 B T λ i f i x , y h 3 12 1 v 2 B det J d ξ d η ,
The global stiffness matrix can be obtained by assembling the element stiffness matrices and setting the corresponding boundary conditions.

3. Solution Strategy of SFEM

In Section 2, the FEM of plate structure considering a spatial random field was constructed. To obtain the statistics of structural response, the point estimate method (PEM) can be applied, and the strategy called KLE-PEM-based SFEM. Assuming a function G X containing random variables with the PDF, p X , according to the knowledge of probability theory, the mean value μ and variance v a r can be calculated by the following formulas,
μ = E G X = G X p X d X ,  
v a r = [ G X μ ] 2 p X d X ,
where E   ·   denotes the expectation.
Since the random field discussed in this paper is the Gaussian random field, and according to the reduced-dimensional Gaussian integral, Equations (20) and (21) can be transformed as the following formulas,
μ = E i = 1 n G i X i n 1 G c i = 1 n E G i X i n 1 G c ,
v a r = i = 1 n E G i X i μ 2 n 1 [ G c μ ] 2 ,
with Gaussian–Hermite quadrature as follows,
E G i X i = i = 1 r w GH , l π G i 2 x GH , l ,
E G X i μ 2 = i = 1 r w GH , l π G i 2 x GH , l μ 2 ,
where n denotes the number of random variables; c denotes the value corresponding to the reference point; w GH , l and x GH , l denote the abscissa and weight, and the details of them are shown in Table 1.
When using the strategy that sets zero as the reference point, Equation (18) can be simplified as
K l , i e = K ¯ e + 2 x G H , l K ˜ i e ,  
Substituting the matrices K l , i e   corresponding to different random variables and integration points into Equation (27) to solve the corresponding plate structure response X (i.e., G i · ), and then substituting all X (i.e., G i · ) into Equations (22)–(25), the statistics of response including mean value and variance can be obtained.
F = K X ,  
where F dentoes the vector of force, and X denotes the vector of displacement.

4. Discussions

Combining the theories introduced in Section 2 and Section 3, the corresponding numerical model can be established using the scientific computing environment MATLAB.

4.1. Validation

In order to verify the effectiveness of the method, a case was adopted for explanation, where the length a and width b of the plate were 2 m and 1 m, respectively, the thickness t of the plate was 0.01 m, the elastic modulus was a Gaussian random field, and the mean value was 2.184 × 10¹¹ Pa, with a coefficient of variation (COV) of 0.1, which means that the standard deviation was 2.184 × 10¹⁰ Pa. The plate was subjected to a uniformly distributed load of 100 Pa. The boundary conditions of the board adopted two forms: four-sided simply supported (SSSS) and four-sided fixed clamped supported (CCCC), respectively, as shown in Figure 1. The covariance function of the random field of plate material properties could be written as
C x 1 , x 2 ; y 1 , y 2 = e x 1 y 1 / b 1 x 2 y 2 / b 2 ,  
The correlation lengths were 0.2 m, 0.6 m, 1.0 m, 1.4 m, and 1.8 m, respectively. According to Huo et al. [14], the number M of the truncated item was eight. The KLE-PEM-based SFEM used three Gaussian quadrature points for calculation, which means that the KLE-PEM-based SFEM needs to call the model 8 × 2 + 1 = 17 times, the Monte Carlo Simulation (MCS)-based SFEM was calculated by using 10,000 samples. Compared the calculated results with the results of the MCS and Huo et al. [14], the standard deviation and COV of the vertical displacement of the midpoint of the plate structure are shown in Table 2 and Table 3. It can be seen that under different correlation lengths and boundary conditions, the calculation results of KLE-PEM-based SFEM were very close to MCS-based SFEM, and also very close to the results of Huo et al. [14]. This not only proved the effectiveness of the SFEM model, but also demonstrated that the calculation of KLE-PEM-based SFEM has high accuracy, and its computational efficiency is improved by two orders of magnitude compared to MCS.

4.2. Parameter Analysis

In order to discuss the influence of different parameters on the SFEM calculation of plate structures, the plates with size 1 m × 1 m were used to be analyzed. The elastic modulus was considered as a random field, and the mean value of the random field of elastic modulus was 3.00 × 10¹⁰ Pa, and the Kirchhoff plate with a thickness of 0.01 m and the Mindlin plate with a thickness of 0.10 m were discussed, respectively. The KLE-PEM-based SFEM was applied to calculate the response statistics with different standard deviations, correlation lengths, and boundary conditions.
The covariance function of the random field of plate material properties was the same as in Equation (28). The first 12-order eigenvalues of KL expansion, when the correlation length was 1.0 m, are shown in Figure 2. It can be seen that the first four-order eigenvalues rapidly decrease, and the eigenvalues tend to be stable and small enough above the sixth order. Based on the error, M = 8 was selected as the number of truncation terms. The eigenfunctions of the first eight orders are shown in Figure 3. By combining the eigenvalues in Figure 2 and the corresponding eigenfunctions in Figure 3, the mathematical expressions of the random field KL expansion of the plate material parameters could be obtained.

4.2.1. Example 1

Figure 4 shows the statistics of the vertical displacement response at the midpoint of the plate for the Kirchhoff plate under SSSS boundary conditions. From Figure 4a, it can be seen that the mean value of displacement response increases with the increase in correlation length, but not linearly, and the increase decreases after the correlation length is greater than 0.5 m. In addition, the mean value of displacement response increases as the coefficient of variation increases. In general, although the correlation length influences the mean value of the response, its effect is small; for example, when the correlation length increases from 0.1 to 1.9 m with the condition of COV = 0.20, the mean value of the response increases by only about 3.1%. Figure 4b shows the standard deviation of the displacement response. Similarly, the standard deviation increases with the increase in correlation length and COV, and its increase decreases with the increase in correlation length. It can be seen that the standard deviation of the response increases with the increase in the COV under the same correlation length condition, and the response standard deviation is more sensitive to the change in the COV compared to the mean value of the response. In the case of the largest increase (COV = 0.20), for example, the correlation length increased from 0.1 to 1.9 m, and the standard deviation of the response increased by about 400%, much larger than the increase in the mean value. Figure 4c shows the COV of the displacement response; the COV is a dimensionless index used to measure the dispersion of the data, which is the ratio of the standard deviation to the mean value. It can be seen that the COV increases with the increase in the correlation length, but it does not increase linearly, and the COV of the response increases with the increase in the COV of the elastic modulus under the same correlation length condition. Moreover, it can be seen that the COV of the response is not equal to the COV of the elastic modulus; for example, when the COV of the elastic modulus is 0.20, the COV of the response is in the range of 0.05 to 0.20.

4.2.2. Example 2

Figure 5 shows the statistics of the vertical displacement response at the midpoint of the plate for the Kirchhoff plate under the CCCC boundary conditions. Figure 5a shows the mean value of displacements for different correlation lengths and COVs of elastic moduli, and the comparison with Figure 5a shows that the mean value of displacement under CCCC boundary conditions is significantly smaller than that under SSSS boundary conditions. In addition, the variation pattern of the mean value of displacement is similar to that for the SSSS boundary condition, and again, the displacement mean is not sensitive to the variation in the COV and the correlation length of the elastic modulus. For example, for the case of the COV = 0.20, the correlation length increased from 0.1 to 1.9 m and the mean value of response increased by about 4%; and for the case of the correlation length of 1.9 m and the COV increase from 0.05 to 0.20, there is an increase in the response mean of about 3.9%. Figure 5b shows the standard deviation of displacement responses, and again, the standard deviation increases with the increase in both correlation length and coefficient of variation. Compared to the mean value of the response, the standard deviation of the response is more sensitive to the change in the COV. Taking the largest increase (COV = 0.20) as an example, the correlation length increased from 0.1 to 1.9 m, and the standard deviation of the response increased by about 325%; for the correlation length 1.9 m, the COV of the elastic modulus increased from 0.05 to 0.20, and the standard deviation of the response increased by about 125%, both of which are much larger than the mean value of the response. Figure 5c shows the variation in the COV of response with the elastic modulus COV and the correlation length, and it can be seen that the trend and value are similar to Figure 4c.

4.2.3. Example 3

Figure 6 shows the statistics of the vertical displacement response at the midpoint of the plate for the Mindlin plate under the SSSS boundary conditions. From Figure 6a, it can be seen that the changes in correlation length and COV of elastic modulus have little effect on the mean value of displacement response; in addition, compared with the Kirchhoff plate (see Figure 4a), the displacement response of the thick plate under the same load is much smaller than that of the thin plate. Figure 6b shows the standard deviation of the displacement response at the midpoint of the plate, which causes the standard deviation to be small due to its small response, and similarly, the sensitivity of the standard deviation to the parameter change is greater than the sensitivity of the mean to the parameter change. For example, when the COV = 0.2 and the correlation length increased from 0.10 to 1.9 m, the standard deviation increased by 392%; and when the correlation length equaled 1.9 m and the COV increased from 0.05 to 0.20, the standard deviation increased by 490%. Figure 6c shows the COV of the response, and it can be seen that the trends and values are similar compared with Figure 4c and Figure 5c.

4.2.4. Example 4

Figure 7 shows the statistics of the vertical displacement response at the midpoint of the plate for the Mindlin plate under CCCC boundary conditions. Comparing Figure 5a, Figure 6a, and Figure 7a, it can be seen that both the boundary conditions and the plate thickness have a great influence on the mean value of the response at the midpoint of the plate; i.e., increasing the plate thickness and changing the boundary conditions to fixed constraints can reduce the deflection in the plate. Similarly, the mean value of response is insensitive to the changes in the correlation length and the COV of elasticity modulus. When the COV of elasticity modulus increased from 0.05 to 0.20 and the correlation length increased from 0.1 m to 1.9 m, the mean value of response increased by only 2%. The standard deviation (see Figure 7b) shows the same pattern as other cases. Figure 7c shows the COV of the displacement response, and the results are almost consistent with the other cases. Overall, the boundary conditions and plate type have little effect on the COV of the response.

5. Conclusions

A computational strategy of the stochastic finite element method for calculating the statistics of the response of plate structures was proposed in this paper. Firstly, the finite element theory of plate structure considering a random field was derived briefly; secondly, the strategy of the KLE-PEM-based stochastic finite element method was introduced; finally, the feasibility of the calculation strategy and the impact of a series of conditions and parameters were analyzed. Some conclusions can be drawn:
(1)
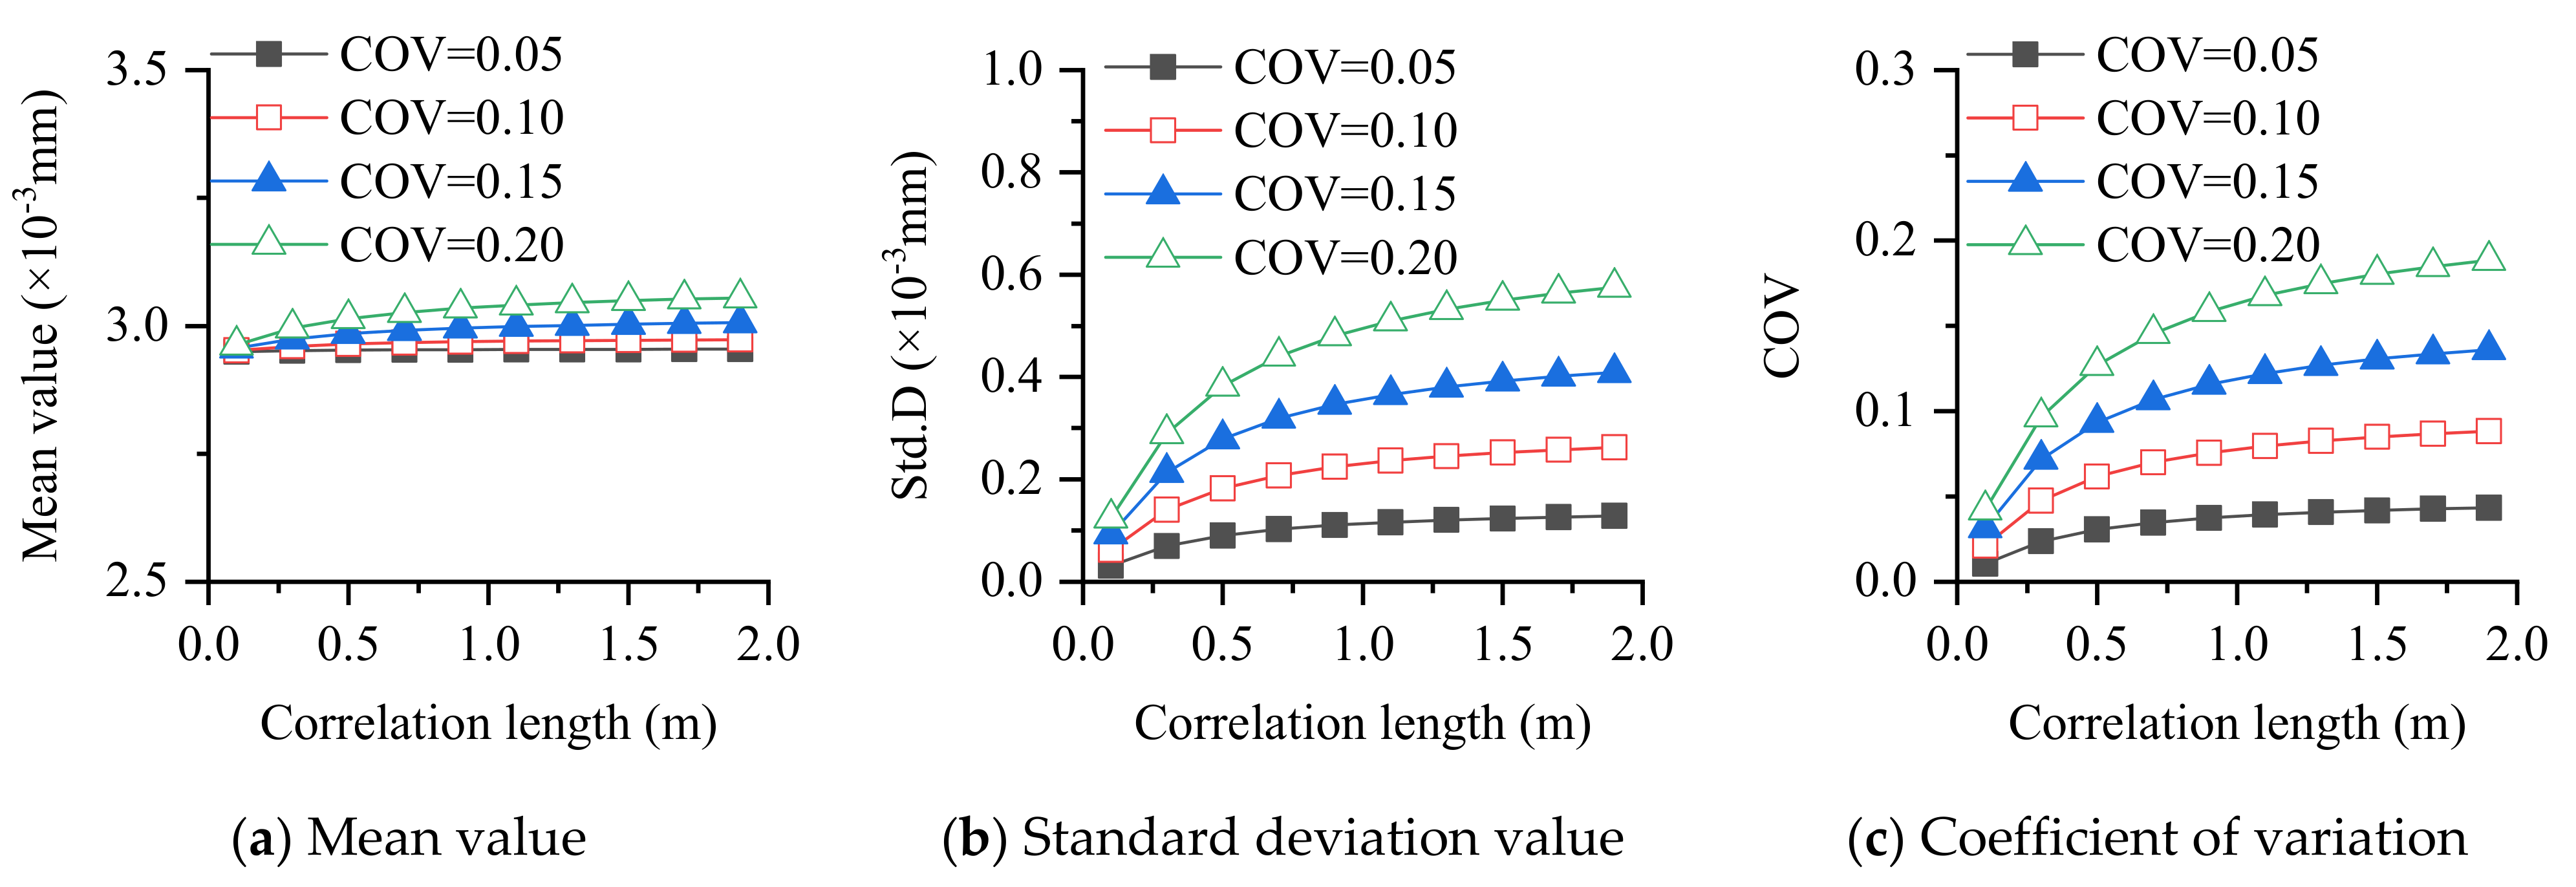
The calculation strategy of setting the reference point to zero can greatly improve computational efficiency. Compared with the Monte Carlo simulation and the results from other literature, the KLE-PEM-based stochastic finite element method has been shown to have extremely high computational efficiency and accuracy.
(2)
The boundary conditions and types of the plate have a significant impact on the mean and standard deviation of the plate responses; however, the impact on the coefficient of variation of the response is minimal.
(3)
For different boundary conditions and plate types, the mean value of response is not sensitive to parameter changes, while the sensitivity of the standard deviation and coefficient of variation, in response to parameter changes, is much greater than that of the mean value.
(4)
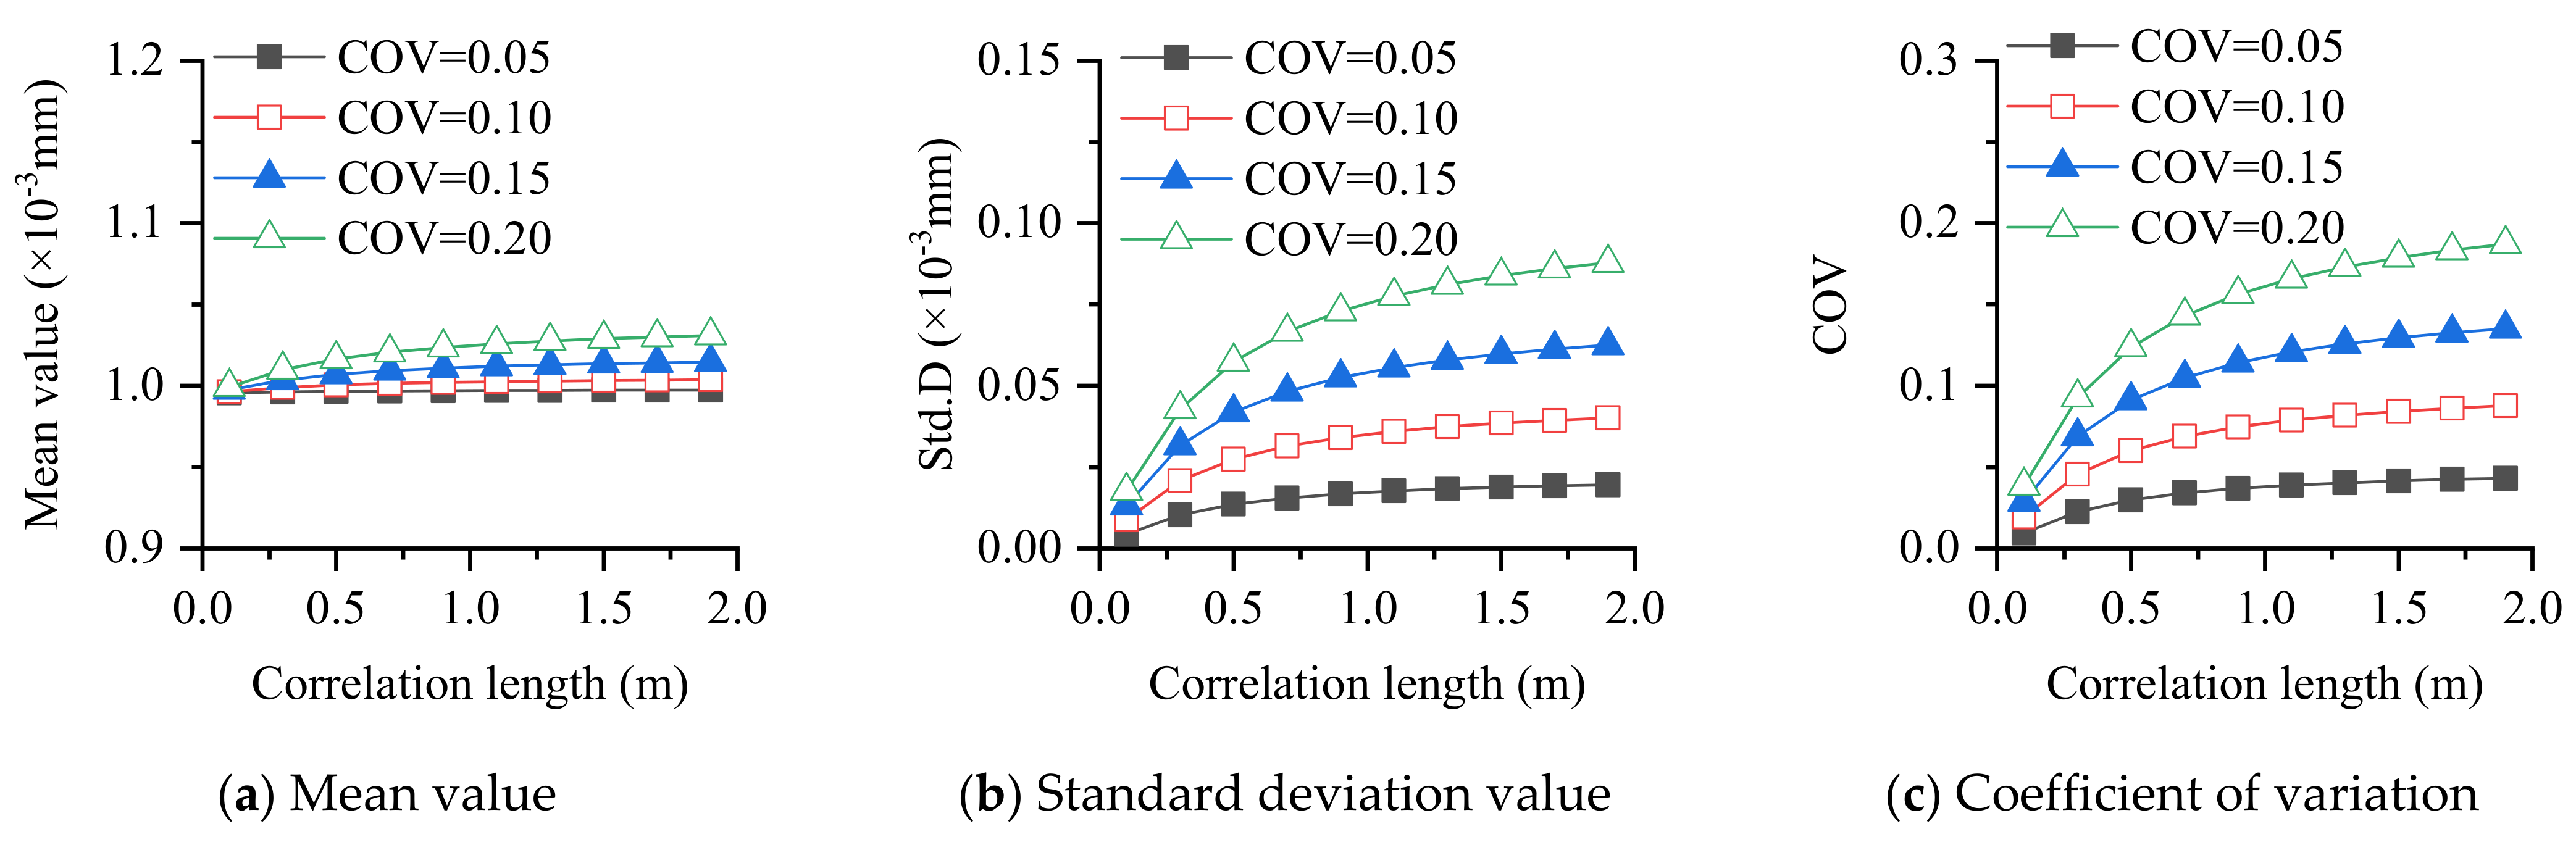
The larger the coefficient of variation of the parameter, the larger the statistical response, which is in line with common sense. The larger the correlation length, the larger the standard deviation and coefficient of variation of the response, which indicates that the correlation length of the random field should be properly considered in the analysis of plate structures.
(5)
This study provides a new approach for the SFEM solution of plate structures. Because of its efficiency and accuracy, it can be used to solve some plate structure problems considering spatial random fields, such as track slab deformation, floor slab deformation, etc. However, the plate structure problems considering the spatial random field include not only static behaviors, but also dynamic behaviors, nonlinear behaviors, and temperature transmission behaviors, which are the directions that can be considered in future work.

Author Contributions

Conceptualization, X.L. and F.-W.G.; methodology, X.L.; software, X.L.; validation, F.-W.G. and Y.Y.; formal analysis, Y.Y.; investigation, X.L.; resources, Y.Y.; data curation, Y.Y.; writing—original draft preparation, Y.Y.; writing—review and editing, Y.Y.; visualization, F.-W.G.; supervision, F.-W.G.; project administration, X.L.; funding acquisition, X.L. All authors have read and agreed to the published version of the manuscript.

Funding

This research was funded by the Fujian Natural Science Foundation, grant number 2022J05184, and Fujian University of Technology, grant numbers GY-Z21181 and GY-Z220229. The APC was funded by the Fujian Natural Science Foundation, grant number 2022J05184.

Data Availability Statement

Not applicable.

Conflicts of Interest

The authors declare no conflict of interest.

References

  1. Liu, X.; Jiang, L.; Xiang, P.; Lai, Z.; Liu, L.; Cao, S.; Zhou, W. Probability Analysis of Train-Bridge Coupled System Considering Track Irregularities and Parameter Uncertainty. Mech. Based Des. Struct. Mach. 2021, 51, 2918–2935. [Google Scholar] [CrossRef]
  2. Liu, X.; Jiang, L.; Lai, Z.; Xiang, P.; Chen, Y. Sensitivity and Dynamic Analysis of Train-Bridge Coupled System with Multiple Random Factors. Eng. Struct. 2020, 221, 111083. [Google Scholar] [CrossRef]
  3. Liu, X.; Jiang, L.; Xiang, P.; Jiang, L.; Lai, Z. Safety and Comfort Assessment of a Train Passing over an Earthquake-Damaged Bridge Based on a Probability Model. Struct. Infrastruct. Eng. 2021, 19, 525–536. [Google Scholar] [CrossRef]
  4. Wang, F.; Sett, K. Time Domain Stochastic Finite Element Simulation towards Probabilistic Seismic Soil-Structure Interaction Analysis. Soil Dyn. Earthq. Eng. 2019, 116, 460–475. [Google Scholar] [CrossRef]
  5. Ghanem, R.G.; Spanos, P.D. Stochastic Finite Elements: A Spectral Approach; Dover Publications Inc.: Mineola, NY, USA, 2012. [Google Scholar]
  6. Du, W.; Ma, J.; Zhou, C.; Yan, Y.; Wriggers, P. Uncertain Dynamic Characteristic Analysis for Structures with Spatially Dependent Random System Parameters. Materials 2023, 16, 1188. [Google Scholar] [CrossRef] [PubMed]
  7. Nastos, C.; Komninos, P.; Zarouchas, D. Non-Destructive Strength Prediction of Composite Laminates Utilizing Deep Learning and the Stochastic Finite Element Methods. Compos. Struct. 2023, 311, 116815. [Google Scholar] [CrossRef]
  8. Nastos, C.; Zarouchas, D. Probabilistic Failure Analysis of Quasi-Isotropic CFRP Structures Utilizing the Stochastic Finite Element and the Karhunen–Loève Expansion Methods. Compos. Part B Eng. 2022, 235, 109742. [Google Scholar] [CrossRef]
  9. Zheng, Z.; Dai, H.; Beer, M. Efficient Structural Reliability Analysis via a Weak-Intrusive Stochastic Finite Element Method. Probabilistic Eng. Mech. 2023, 71, 103414. [Google Scholar] [CrossRef]
  10. Zheng, Z.; Beer, M.; Dai, H.; Nackenhorst, U. A Weak-Intrusive Stochastic Finite Element Method for Stochastic Structural Dynamics Analysis. Comput. Methods Appl. Mech. Eng. 2022, 399, 115360. [Google Scholar] [CrossRef]
  11. Pokusiński, B.; Kamiński, M. Numerical Convergence and Error Analysis for the Truncated Iterative Generalized Stochastic Perturbation-Based Finite Element Method. Comput. Methods Appl. Mech. Eng. 2023, 410, 115993. [Google Scholar] [CrossRef]
  12. Sepahvand, K. Stochastic Finite Element Method for Random Harmonic Analysis of Composite Plates with Uncertain Modal Damping Parameters. J. Sound Vib. 2017, 400, 1–12. [Google Scholar] [CrossRef]
  13. Daneshvar, K.; Moradi, M.J.; Ahmadi, K.; Mahdavi, G.; Hariri-Ardebili, M.A. Dynamic Behavior of Corroded RC Slabs with Macro-Level Stochastic Finite Element Simulations. Eng. Struct. 2021, 239, 112056. [Google Scholar] [CrossRef]
  14. Huo, H.; Xu, W.; Wang, W.; Chen, G.; Yang, D. New Non-Intrusive Stochastic Finite Element Method for Plate Structures. Comput. Struct. 2022, 268, 106812. [Google Scholar] [CrossRef]
  15. Liu, X.; Jiang, L.; Xiang, P.; Zhou, W.; Lai, Z.; Feng, Y. Stochastic Finite Element Method Based on Point Estimate and Karhunen–Loéve Expansion. Arch. Appl. Mech. 2021, 91, 1257–1271. [Google Scholar] [CrossRef]
  16. Fan, W.; Tian, Y.; Sheng, X. Simulation of a Non-Gaussian Stochastic Process Based on a Combined Distribution of the UHPM and the GBD. Probabilistic Eng. Mech. 2023, 72, 103438. [Google Scholar] [CrossRef]
  17. Liu, Z.; Liu, Z.; Peng, Y. Dimension Reduction of Karhunen-Loeve Expansion for Simulation of Stochastic Processes. J. Sound Vib. 2017, 408, 168–189. [Google Scholar] [CrossRef]
  18. Ferreira, A.J.M.; Fantuzzi, N. MATLAB Codes for Finite Element Analysis: Solids and Structures; Solid Mechanics and Its Applications; Springer International Publishing: Cham, Switzerland, 2020; Volume 157, ISBN 978-3-030-47951-0. [Google Scholar]
  19. Noh, H.-C. A Formulation for Stochastic Finite Element Analysis of Plate Structures with Uncertain Poisson’s Ratio. Comput. Methods Appl. Mech. Eng. 2004, 193, 4857–4873. [Google Scholar] [CrossRef]
  20. Sudret, B. Stochastic Finite Element Methods and Reliability a State-of-the-Art Report. 190; Department of Civil and Environmental Engineering, University of California: Berkeley, CA, USA, 2000. [Google Scholar]
Figure 1. Boundary conditions of plates.
Mathematics 11 02535 g001
Figure 2. Eigenvalues of KL item.
Mathematics 11 02535 g002
Figure 3. Eigenfunctions of KL item.
Mathematics 11 02535 g003
Figure 4. Stochastic response of deflection of SSSS Kirchhoff plate.
Mathematics 11 02535 g004
Figure 5. Stochastic response of deflection of CCCC Kirchhoff plate.
Mathematics 11 02535 g005
Figure 6. Stochastic response of deflection of SSSS Mindlin plate.
Mathematics 11 02535 g006
Figure 7. Stochastic response of deflection of CCCC Mindlin plate.
Mathematics 11 02535 g007
Table 1. Abscissas and weights of Gaussian–Hermite quadrature.
x GH , l 0±1.224740±0.958572±2.020180±0.816288±1.67355±2.65196
w GH , l 1.181640.2954090.9453090.3936190.0199530.8102650.4256070.0545169.72 × 10−4
Table 2. Deflections at the center of SSSS plate structure under uniform load.
MethodCorrelation Lengths (m)0.20.61.01.41.8
MCS-basedMean (10−5 m)5.05365.06825.07645.08755.0844
Std.D (10−6 m)1.61613.07453.75744.07704.2780
COV0.03200.06070.07400.08010.0841
KLE-PEM-basedMean (10−5 m)5.05455.06935.07725.08185.0849
Std.D (10−6 m)1.61163.07483.71744.07434.3012
COV0.03190.06070.07320.08020.0846
Ref. [14]Mean (10−5 m)5.06785.08325.09145.09555.0957
Std.D (10−6 m)1.59573.06493.75914.10634.3332
COV0.03150.06030.07380.08060.0850
Table 3. Deflections at the center of CCCC plate structure under uniform load.
MethodCorrelation Lengths (m)0.20.61.01.41.8
MCSMean (10−5 m)1.26981.27351.27461.27691.2786
Std.D (10−6 m)0.38630.76640.93991.02101.0774
COV0.03040.06020.07370.08000.0843
KLE-PEMMean (10−5 m)1.26981.27361.27571.27681.2776
Std.D (10−6 m)0.38560.76460.92821.01791.0744
COV0.03040.06000.07280.07970.0841
Ref. [14]Mean (10−5 m)1.27031.27431.27651.27761.2780
Std.D (10−6 m)0.38290.76970.94911.03781.0778
COV0.03010.03010.07440.08120.0843
Disclaimer/Publisher’s Note: The statements, opinions and data contained in all publications are solely those of the individual author(s) and contributor(s) and not of MDPI and/or the editor(s). MDPI and/or the editor(s) disclaim responsibility for any injury to people or property resulting from any ideas, methods, instructions or products referred to in the content.

