Article

Robust Data Augmentation for Neural Machine Translation through EVALNET

1
Department of Radio and Information Communications Engineering, ChungNam National University, 99 Daehak-ro, Yuseong-gu, Daejeon 34134, Republic of Korea
2
Artificial Intelligence Research Laboratory, Electronics and Telecommunications Research Institute (ETRI), 218 Gajeong-ro, Yuseong-gu, Daejeon 34129, Republic of Korea
*
Author to whom correspondence should be addressed.
Mathematics 2023, 11(1), 123; https://doi.org/10.3390/math11010123
Submission received: 14 November 2022 / Revised: 7 December 2022 / Accepted: 21 December 2022 / Published: 27 December 2022

Abstract

:
Since building Neural Machine Translation (NMT) systems requires a large parallel corpus, various data augmentation techniques have been adopted, especially for low-resource languages. In order to achieve the best performance through data augmentation, the NMT systems should be able to evaluate the quality of augmented data. Several studies have addressed data weighting techniques to assess data quality. The basic idea of data weighting adopted in previous studies is the loss value that a system calculates when learning from training data. The weight derived from the loss value of the data, through simple heuristic rules or neural models, can adjust the loss used in the next step of the learning process. In this study, we propose EvalNet, a data evaluation network, to assess parallel data of NMT. EvalNet exploits a loss value, a cross-attention map, and a semantic similarity between parallel data as its features. The cross-attention map is an encoded representation of cross-attention layers of Transformer, which is a base architecture of an NMT system. The semantic similarity is a cosine distance between two semantic embeddings of a source sentence and a target sentence. Owing to the parallelism of data, the combination of the cross-attention map and the semantic similarity proved to be effective features for data quality evaluation, besides the loss value. EvalNet is the first NMT data evaluator network that introduces the cross-attention map and the semantic similarity as its features. Through various experiments, we conclude that EvalNet is simple yet beneficial for robust training of an NMT system and outperforms the previous studies as a data evaluator.

1. Introduction

Since the performance of deep learning models often crucially depends on the quantity and quality of data used for training, collecting a large reliable training corpus is an essential precondition to building a successful system. However, a semi-automatically collected training corpus may frequently contain noisy data.
Neural Machine Translation (NMT) is an approach to machine translation based on deep neural models with an end-to-end style, trained using a large parallel corpus. Since NMT systems have the common problem of collecting a large training corpus, various data augmentation approaches, such as EDA [1], back-translation [2], and generative models, have been proposed for low-resource languages. However, neither the quality of augmented data nor its effect on training NMT systems are considered in these data augmentation techniques. Automatically augmented data can even hurt the system’s performance. Therefore, data weighting or data filtering techniques should be incorporated into an application of data augmentation so that NMT systems can achieve the best performance when learning augmented data.
Several previous studies have explored data weighting techniques to implement robust deep learning [3,4,5]. Deep learning models are generally trained by a gradient descent method, which updates the model’s parameters according to loss values that represent discrepancies between the data’s correct labels and the model’s expected labels. It is usually accepted that the loss values of noisy data are greater than those of clean data. Therefore, a data weighting module using simple heuristics or a manually built function can estimate data weights based on the loss values. Then, as the weights readjust loss values in a gradient descent step, deep learning models can learn more from high-weighted data and less from low-weighted data. By doing so, deep learning models can move towards robust learning.
In this study, we augment parallel data for NMT by using a back-translation technique. To make high-quality back-translated data, the accuracy of a reverse-direction NMT system should be high. However, in most cases, the NMT system may perform poorly due to insufficient training data. As a result, augmented data generated using the back-translation method may contain noise and corruption.
In this study, we propose EvalNet, a data evaluator implemented based on simple neural networks. As in the previous studies, EvalNet can assign weights to training and augmented data, where the weights can be used to tune loss values in a gradient descent step. EvalNet is trained to assign higher weights to real training data rather than to augmented data, and higher weights to augmented data rather than to noisy data. As a result, EvalNet can make data augmentation safe and reliable without degrading NMT’s performance.
EvalNet exploits three features to evaluate the quality of parallel data. The first one is the loss value, which is commonly used in previous studies. The second one is the semantic similarity between a source and a target sentence. The two sentences are parallel for translation, so their meaning should be as similar as possible. The third one is the cross-attention map between an encoder and a decoder of Transformer, which is the de facto standard architecture of NMT models. The cross-attention map indirectly specifies the alignment between a source and a target sentence in machine translation [6]. Therefore, noisy parallel sentences may have different cross attention from clean parallel sentences.

Contributions of This Study

EvalNet is a novel approach in that it is a learnable network applied to NMT domains for parallel data evaluation. EvalNet takes the loss value, semantic similarity, and cross-attention map as inputs and predicts the weights of the data as an output. EvalNet helps NMT systems to learn efficiently and effectively from noisy and clean data by providing their evaluation weights. In this study, we apply EvalNet to building an English–Korean NMT system and an English–Myanmar NMT system. Through several experiments, we show that EvalNet outperforms the previous studies as a data evaluator and prove that the combined features of the cross-attention map and the semantic similarity are the best for parallel data evaluation. To the best of our knowledge, EvalNet is the first data evaluator that utilizes the cross-attention map as a feature to assess parallel data. The contributions of this study are listed as follows:
  • We propose a new simple data evaluator—EvalNet—to score parallel data for NMT;
  • We show that the cross attention between an encoder and a decoder of an NMT system can be an effective factor to recognize a word-order corruption;
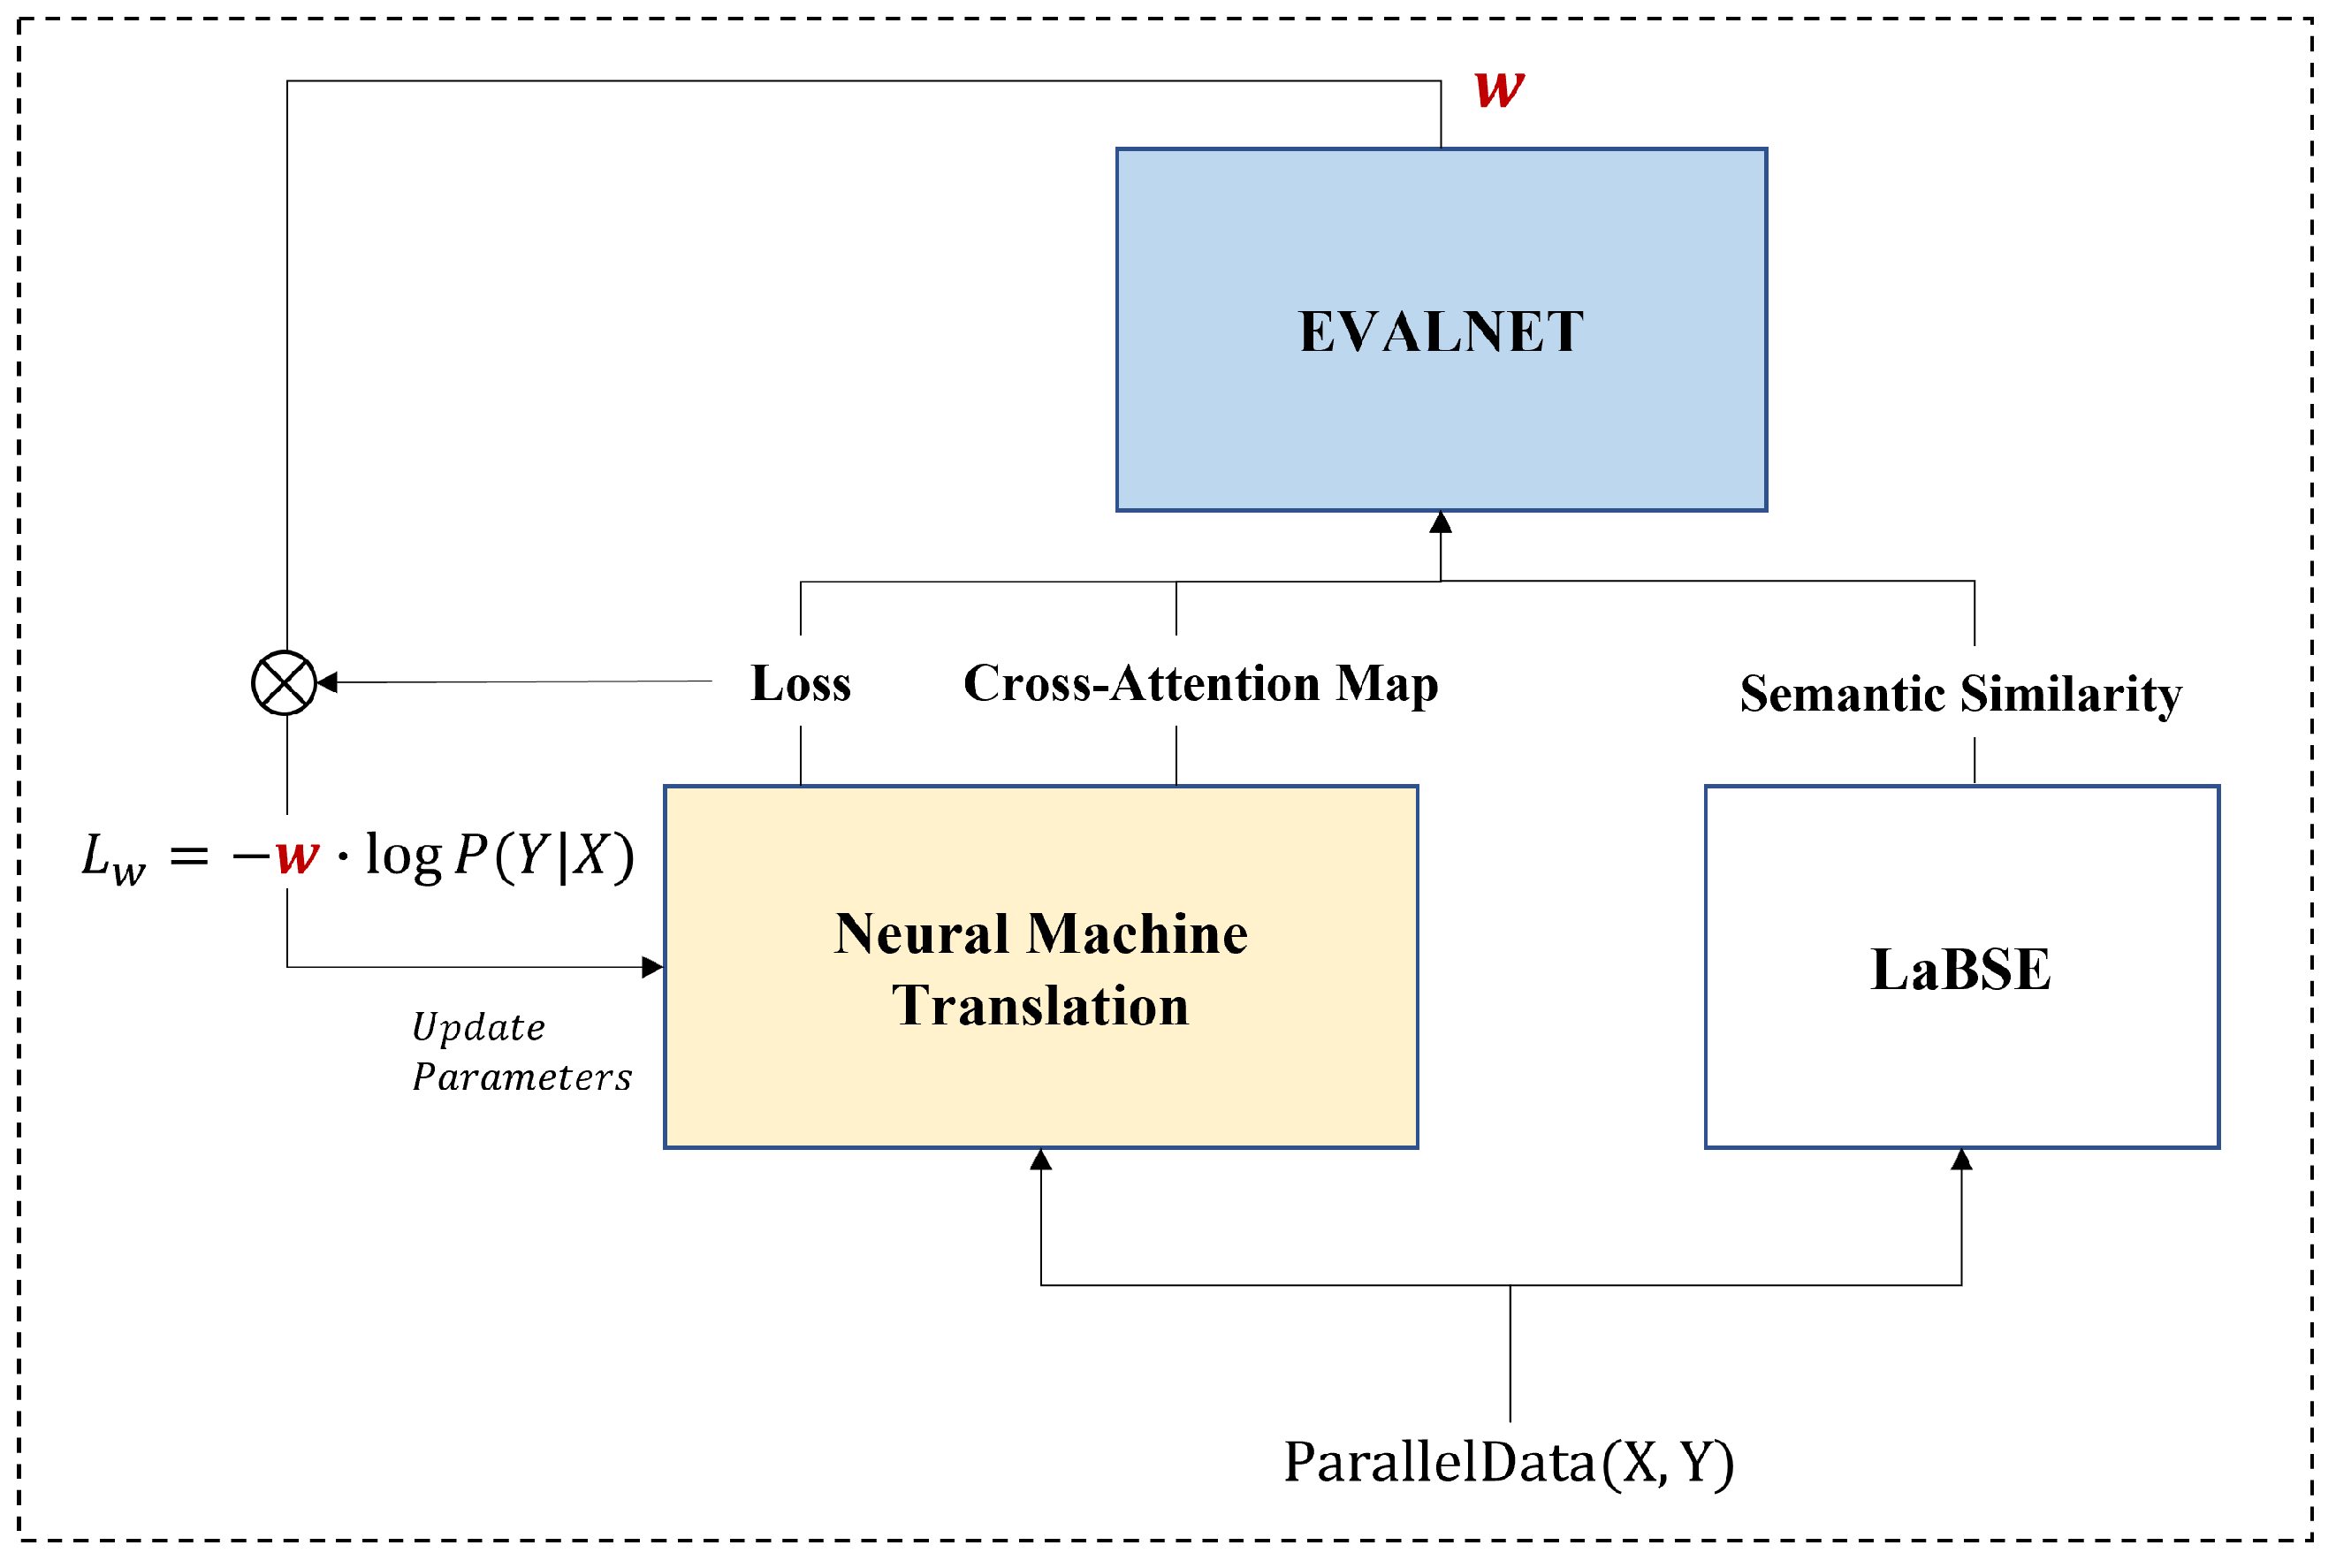
  • We show that the cross-attention map and the semantic similarity can be an effective combination to evaluate parallel data;
  • We show that EvalNet can outperform other data evaluation models and help NMT systems to learn effectively and reliably from augmented data.

2. Related Studies

2.1. Data Weighting

Deep neural networks may perform poorly when trained on corrupted data. Data weighting is a commonly used approach for robust training. Therefore, several studies dealing with data weighting have been proposed to efficiently and effectively train a target system.
Jiang et al. [4] introduced MentorNet, which plays a role in data weighting to supervise a target system called StudentNet. StudentNet is a CNN-based network trained on image data to classify an image’s label. MentorNet is a simple neural network that takes the loss values of the data, loss differences, data labels, and epoch percentage as input features and outputs their corresponding weights. It is trained to output 1 for correct data and output 0 for corrupted data. MentorNet and StudentNet are jointly trained in turn. After MentorNet learns a data weighting strategy from the data features provided by StudentNet, StudentNet uses the weights provided by MentorNet to update its parameters. In an experimental setup, MentorNet was updated twice at 20% and 75% of the total number of epochs, and StudentNet began to apply weights to update the parameters at 20% of the total number of epochs. The dataset of CIFAR-10 and CIFAR-100 were used, and ResNet-101 and Inception were adopted as StudentNet. Experimental results showed that StudentNet, guided by MentorNet, achieved better performance than when employing other data weighting techniques.
The research in Ref. [3] proposed Meta-Weight-Net to enhance the robustness of deep learning of a target system. Meta-Weight-Net is a simple MLP network, whose main role is mapping from a data loss to a data weight. The objective of Meta-Weight-Net is to reduce losses of the target system for a validation dataset, while that of the target system is to reduce its losses adjusted by weights provided by Meta-Weight-Net for a training dataset. Meta-Weight-Net and the target system are jointly trained in turn. Unlike MentorNet, Meta-Weight-Net is applied to the target system from the beginning; parameters of Meta-Weight-Net and the target system are updated iteratively one at a time. Experiments were performed on the dataset of CIFAR-10 and CIFAR-100 with random noises. Meta-Weight-Net was compared with other robust learning approaches including MentorNet and achieved better accuracies than the other compared models in the case of general corrupted data.
Cai et al. [7] proposed a learnable data manipulation framework and applied it to a dialogue generation system, which was the target system. Unlike the previous studies, this approach does not build a separate network. Instead, data manipulation is parameterized and incorporated into the target system. Dialogue generation is a typical task that suffers from the problem of noisy training data. As the name suggests, the data manipulation model integrates data filtering, data augmentation, and data weighting into a single framework. A simple sigmoid gate function performs data filtering. Two methods of data augmentation are adopted by the framework. The first one is to substitute words in a sentence through a pre-trained language model, BERT [8]. The second one involves sentence-level augmentation using a back-translation. An MLP layer assigns weights to training data. Since the data manipulation framework is a sub-part of the target system with an end-to-end style architecture, it is trained jointly with the target system to optimize losses of the target system. In an experimental setup, two kinds of English conversation datasets were used and three architectures of the target system—an RNN-based sequence-to-sequence model, conditional variational auto-encoder, and Transformer—were compared. Compared with other data augmentation and weighting methods, the data manipulation framework improved the performance of existing dialogue systems.

2.2. Data Filtering for Back Translation

Back-translation is one of the most widely used approaches to build NMT systems of low-resource language pairs. However, back-translation requires a high-quality reverse-direction translation model. Since pseudo parallel data augmented using back-translation vary in quality, several filtering or weighting techniques of back-translated data have been proposed.
Khatri and Bhattacharyya [9] proposed a round-trip BLEU score to evaluate parallel data. The round-trip BLEU score is the BLEU score between an original sentence and the backward translation of the original sentence’s forward translation. The BLUE score is normalized batch-wise to keep a steady progress in training. When training an NMT model, they used the round-trip BLEU scores as weights of the cross-entropy loss function. There are two limitations to this approach. This approach requires high-quality both-direction NMT models and the BLEU score they adopted is different from an objective function of an NMT model from the point of view of parameter optimization.
Ramnath et al. [10] introduced a HintedBT, which assigned quality tags to back-translated data. The quality score of the back-translated data is evaluated by the semantic similarity between a source and a target sentence. Back-translated data are grouped into k clusters according to the quality score, and the identification numbers of the clusters are used as the quality tag. An NMT system can recognize the back-translated data by the quality tags, which are prepended to a source sentence, so the system can learn effectively even from noisy back-translated data. Their approach differs from ours in that it uses a static quality score independent of NMT model training. As our work utilizes learnable networks to evaluate data quality, data weights can change according to the progress of NMT model training.

3. EVALNET

Figure 1 depicts the overall training process of an NMT system using EvalNet. The NMT system we used in this study is built based on Transformer, which is the de facto standard architecture of NMT systems. The transformer consists of an encoder that generates semantic representations of an input sequence and a decoder that generates an output sequence one at a time by attending to the input representations generated by the encoder. In general, the cross-entropy loss function to update parameters of NMT models is given by
L = l o g P ( Y | X )
where (X, Y) is a pair of sentences.
EvalNet takes the loss, cross-attention map, and semantic similarity for a pair of sentences (X, Y) as inputs. The former two are acquired from the NMT system, and the latter is calculated by using the distance between the meaning of two sentences. EvalNet outputs a weight w that indicates the importance of a pair of sentences for NMT, after which the weight w can adjust the loss when updating the parameters of the NMT system.
We use the weighted cross-entropy loss function to apply EvalNet to NMT model training. The weighted cross-entropy loss function can be calculated by
L w = w · l o g P ( Y | X )
where w is an output weight of EvalNet.
The larger the weight value of a data sample is, the greater the impact the data sample has on the NMT system. Conversely, noisy data has a limited impact on the NMT system because of its small weight value. The following sections describe the architecture of EvalNet and the training process of NMT using EvalNet.

3.1. Architecture of EVALNET

The network architecture of EvalNet is shown in Figure 2.
The semantic similarity and the loss value are converted to feature vectors F S i m and F L o s s through fully connected layers, respectively. Cross-attention maps are converted to a feature vector F A t t n through LSTM layers. The three feature vectors F S i m , F L o s s , and F A t t n are concatenated and fed into the following two fully connected layers. Because the activation function of the second layer is a sigmoid function, the output weight w of EvalNet ranges from 0 to 1, where
w = σ ( W 2 ( W 1 ( [ F L o s s ; F S i m ; F A t t n ] ) ) )

3.1.1. Loss

Training a model involves two different perspectives on the loss values of data. The first one is to consider data with larger loss values to be noisy and unreliable; thus, they should be removed from a training dataset or be restrictively used in a training process. This view is adopted in the study of data corruption problems and self-paced learning [11]. In self-paced learning, which is a type of curriculum learning, a model is first trained easily and quickly using only data samples whose loss values are less than a predefined threshold. Then, as the model is trained, it raises the threshold to use more difficult data samples in the training process. The other perspective is that a model is required to learn more from data with larger loss values. Such data samples have larger loss values due to their rarity in a training dataset; therefore, they should be used more intensively or frequently during a training process. This perspective is generally supported in the study of data imbalance problems.
We adopt the former perspective on loss values. A data sample with a smaller loss value is considered a highly reliable sample with less noise [3].
A pair of parallel sentences (X, Y) is entered into an NMT system as input, after which the system can calculate its loss value. Then, the loss value is entered into EvalNet, and it is embedded into a feature vector F L o s s through a fully connected layer.

3.1.2. Semantic Similarity

In this study, the semantic similarity of parallel sentences is a measurement of how well the two sentences retain their meaning despite using different languages. Augmented parallel sentences, regardless of how they are collected or generated, should have a meaning as similar as possible for usage in training NMT systems. Therefore, the semantic similarities of the pair of sentences can be a primary feature of EvalNet.
For the semantic similarity measurement of a sentence pair, a sentence should be first represented as an embedding vector. In this study, we utilize Language-agnostic BERT Sentence Embedding (LaBSE) [12] to gain a sentence’s embedding. LaBSE is a publicly available multilingual sentence embedding model based on BERT. Since LaBSE can generate sentence embeddings for multiple (109+) languages, a semantic similarity between two sentences can be calculated by the cosine distance between two embeddings of the two sentences.
Given a pair of sentences, the semantic similarity value of the pair of sentences is converted into a feature vector F S i m through a fully connected layer.

3.1.3. Cross-Attention Map

The decoder of Transformer generates an output sequence one by one, attending to the encoded input sequence that an encoder produces. The cross-attention mechanism of Transformer allows the decoder to know which parts of the encoded input it should pay more attention to when generating output.
Therefore, we hypothesize that the cross-attention mechanism denotes alignment information between an input and an output sequence. In addition, since the alignment between two sequences indirectly implies whether they are parallel or not, we incorporate cross attention as a feature of EvalNet. Figure 3 depicts how to encode a cross-attention map as an input feature of EvalNet.
Figure 3a shows an example of a cross-attention map between a source sentence consisting of 6 tokens and a target consisting of 5 tokens. The sum of all cell values in each row is 1.0, where a gray cell indicates the most attended source token when a target token is generated. For instance, in Figure 3a, the decoder attends to the 4th source token the most when generating the 3rd target token.
To encode a cross-attention map as a feature vector of EvalNet, we adopt bidirectional LSTMs. As shown in Figure 3b, the input to each LSTM cell is the index of the most attended source token for each row in the cross-attention map. The first and the last hidden states of the bidirectional LSTMs form the feature vector E A t t n of the cross-attention map.
Transformer consists of multiple layers, and each layer consists of multi-head attentions. This means that the decoder has multiple cross-attention maps. Because every layer in the decoder is known to represent different information, the cross-attention maps of each layer can also play a different role in the decoding phase.
Figure 4 shows a few examples of the cross-attention maps for a pair of sentences. In this figure, ‘La-Hb’ denotes a cross-attention map of the b-th head in a-th layer. Almost all target tokens attend to the same source token in the L1-H8 map of Figure 4a, while each target token attends to almost all source tokens in the L4-H3 map of Figure 4b. Most of the target tokens attend to only a single source token in the L4-H2 map of Figure 4c. L4-H2 seems more likely to become a cross-attention map of parallel sentences than L1-H8.
In this example, the cross-attention map L4-H2 has the best alignment information, in terms of being considered as a feature of EvalNet.
For simplicity, instead of using all cross-attention maps in all layers, we choose the best layer with the best aligned cross-attention maps between a pair of sentences.
To measure each cross-attention map, we adopt Shannon entropy, which outputs a maximum value when probabilities of all source tokens attended by a target token are the same. Shannon entropy outputs the lowest value when a target token attends to only one single-source token.
For a pair comprising of source x and target y, the average length-normalized Shannon entropy [13] can be calculated by
H ˜ ( x , y ) = 1 | y | i = 1 | y | 1 log | x | j = 1 | x | a i j log ( a i j )
where | · | is the length of a sentence, and a i j is the attention score for the i-th target token over the j-th source token.
In order to choose the best layer out of all layers of the decoder, we calculate Equation (4) for each layer and choose the layer with the lowest value, as in Equation (5). L is the number of layers in the decoder, and N is the number of heads in a layer. H ˜ l , n is the Shannon entropy of the n-th head in the l-th layer.
l = argmax 1 l L 1 N n = 1 N H ˜ l , n
All heads of the selected layer are encoded by LSTM networks, as shown in Figure 2, and each embedding E A t t n n is multiplied by the weight of (1 − H ˜ l , n ) before being summed into F A t t n , as in Equation (6).
F A t t n = n = 1 N E A t t n n · ( 1 H ˜ l , n )

3.2. Training EVALNET

The main goal of EvalNet is to output a higher weight for high-confidence data and a lower weight for low-confidence data. Therefore, we use Margin Ranking Loss as an objective function to train EvalNet. The training data of EvalNet includes real parallel data, augmented data that is back-translated by an NMT system, and noisy data that is a randomly selected pair of sentences. Equation (7) is the objective function of EvalNet, in which w p a r a , w a u g m e n t , and w n o i s e are the weights of the parallel, augmented, and noisy data, respectively, and m is the margin value.
L E V A L N E T = max ( 0 , m ( w p a r a w a u g m e n t ) ) + max ( 0 , m ( w a u g m e n t w n o i s e ) ) + max ( 0 , 2 m ( w p a r a w n o i s e ) )

4. Experimental Results

4.1. Training Datasets

The NMT systems for English–Korean and English–Myanmar were implemented in this study. The training data was AIHUB (https://www.aihub.or.kr/aihubdata/data/view.do?currMenu=115&topMenu=100&aihubDataSe=realm&dataSetSn=126 (accessed on 26 October 2022)) and IWSLT 2017 TED for English–Korean NMT and WAT [14] for English–Myanmar NMT. CC-100 [15] monolingual corpus was used for data augmentation. For the AIHUB dataset, it has not been separated into Train, Validation, and Test subsets. Therefore, in this study, we randomly partitioned AIHUB dataset into Train, Validation, and Test subsets, each having the same number of samples as IWSLT.
The training dataset of EvalNet consisted of real parallel data, augmented data, and noisy data. The real parallel data was partly from the validation set of NMT training data and partly from the parallel data of AIHUB, which was unused in training the NMT system. The augmented data was back-translation data, and the noisy data was randomly selected pairs of sentences. Table 1 summarizes the training data information for the NMT systems and EvalNet.

4.2. Experimental Environments

The hyper-parameters to train the NMT systems and EvalNet are summarized in Table 2 and Table 3. The hyper-parameters of the NMT model are the same as those used in mBART model [16], which is a widely used multilingual pre-trained model for NMT systems. Since EvalNet consists of simple fully connected layers and LSTM networks, we determined the hyper-parameters of EvalNet through several experiments on the validation set. The feature of cross-attention maps was extracted from the 4th layer of the decoder of Transformer. When training the NMT systems, we did not apply EvalNet until 20% of the entire training epochs for training stabilization.
At 20% of the entire training epochs, EvalNet was first trained using the features extracted from the NMT system and LaSBE. Since then, EvalNet was applied for training of the NMT system. At 75%, EvalNet was newly trained again and applied for the training of the NMT system for the rest of the training epochs. This training procedure is the same as that in MentorNet. The NMT systems were evaluated as the BLEU score using sacrebleu (https://github.com/mjpost/sacreBLEU (accessed on 26 October 2022)) library.

4.3. Experimental Results

4.3.1. Performance of the NMT Systems According to the Features of EvalNet

Table 4 shows the performance of the NMT systems for English–Korean and English–Myanmar. All numbers in Table 4 are BLEU scores. The results in Table 4(a) are the baseline models’ performance and Table 4(b) is the performance of NMT systems trained on back-translated augmented data as well as real training data.
Although the AIHUB and IWSLT data collections had the same training data size, the benefits of back-translation were quite different. Because the performance of the baseline model of the NMT system trained on AIHUB was better than that on IWSLT, the quality of back-translated data generated by the former seemed to be better than that by the latter. Consequently, the NMT system trained on higher-quality back-translated data had better performance than that trained on lower-quality back-translated data.
The performances from Table 4(c)–(i) were the results of the NMT models trained on parallel and back-translated data weighted by EvalNet. The NMT systems for English–Korean and English–Myanmar, built with the guidance of EvalNet, achieved 0.1∼0.9 gains in BLEU scores compared to the results of Table 4(b). On the whole, the cross-attention map and the semantic similarity are the best combination for EvalNet to improve the performance of the NMT models.

4.3.2. Comparisons of Weight Values of EvalNet According to the Feature Sets

EvalNet provides the NMT system with a weight value that represents the confidence level of a training sample. The weight value ranges from 0 to 1. EvalNet is supposed to assign a weight of 0 to noisy data, a weight of 1 to reliable data, and a weight between 0 to 1 to augmented data.
Figure 5 depicts the distributions of weight values according to the features of EvalNet. Red denotes noisy data, green denotes augmented data, and blue denotes parallel data. EvalNet is trained to assign higher weights to parallel data than to augmented data and assign higher weights to augmented data than to noisy data.
EvalNet, using only the loss value in Figure 5a, could discriminate between parallel and noisy data well. However, it assigned weights greater than 0.5 to some noisy data. Using only the semantic similarity, EvalNet could clearly identify noisy data, as shown in Figure 5b. The semantic similarity feature seemed to separate noisy data from parallel data well, whether the parallel data was back-translated or manually translated. In the case of EvalNet, using only the cross-attention maps in Figure 5c, it assigned a wide range of weight values from 0 to 1.0 to augmented data and even 1.0 to some noisy data.
The graphs from Figure 5d–g are the results of combining the features of EvalNet. Among them, Figure 5d displaying EvalNet using the loss and similarity, and Figure 5f, displaying EvalNet using the similarity and cross-attention maps, seemed to have the most desirable weight distributions. In Figure 5d,f, most noisy data have weights of zero and most parallel data have weights of one, while most augmented data have weights of 0.5 or greater depending on their qualities. However, comparing Figure 5d,f, we realized that the combination of Loss + Sim is slightly less capable of discriminating the quality of the augmented data than the combination of Sim + Attn. These figures can also explain why the combination of the cross-attention maps and the semantic similarity has worked best in the results of Table 4.
In order to examine the characteristics of EvalNet’s features in-depth, we intentionally messed up a source sentence and measured the change of the weights of the distorted sentence according to the features of EvalNet. Table 5 shows the weight values of noisy variations of a source sentence according to the features of EvalNet. For a parallel pair of Korean and English sentences, an English source sentence was contaminated via the operations proposed by EDA [1], which were random deletion (RD), random swap (RS), random insertion (RI), and reverse (RR).
Surprisingly, EvalNet, using only the semantic similarity, assigned almost the same weights to a completely reversed sentence as an original sentence. This result demonstrates that the semantic similarity is insensitive to the change in the word order of an input sentence. Conversely, EvalNet, using only the cross-attention map, detected corrupted sentences better than that using other features. The cross-attention maps seemed to be easily affected by changes in word order. This result proves that the cross-attention map can imply alignment information between a source and a target sentence.
From the results in Table 5, we found that the cross-attention maps could detect corruptions such as insertion, deletion, swap, and reverse order relatively better than other features. On the other hand, the semantic similarity ignores these corruptions to a certain extent as long as they do not impair the meaning of a sentence.
From the results in Figure 5, we found that the semantic similarity assigns solid zero weights to noisy data, while the cross-attention maps assign weights from zero to one to noisy data.
From both the results in Figure 5 and Table 5, we can conclude that the features of cross-attention map and semantic similarity are the best combination to evaluate the quality of parallel data. In other words, both the cross-attention maps and semantic similarity can be supplementary features to enhance parallel data evaluation.

4.3.3. Performance Comparison with Previous Approaches

We conducted a comparative experiment using previous studies. The compared models include Meta-Weight-Net [3] and MentorNet [4]. These are all learnable networks to evaluate the quality of data. Table 6 summarizes the characteristics of the comparison models. The column ‘Original Dataset’ is the dataset used in their original paper, while ’Dataset for NMT’ is the dataset used in this study to apply the models to NMT domains. Meta-Weight-Net is trained to reduce the loss values of validation data, and MentorNet is trained to be a binary classifier that can classify validation data from noisy data. Both models use only the loss value as an input feature.
For a fair comparison, all models were re-implemented and trained in the same environment as that of EvalNet. The number of epochs to train the comparison models was the same.
We report the BLEU scores of the NMT systems with different weighting models in Table 7. It can be observed that EvalNet using only the cross-attention maps and EvalNet using the cross-attention maps and the semantic similarity outperform the comparison models. Consequently, EvalNet using the cross-attention maps and the semantic similarity can serve as a better data evaluator than other models, especially for NMT domains.

5. Discussion and Conclusions

In this study, we propose EvalNet to assign weights to parallel training data. Since building an NMT system requires a large parallel data, data augmentation using back-translation is commonly used, especially for low-resource languages. However, noisy or corrupted data are frequently encountered in an augmented dataset. Therefore, a data evaluation mechanism such as EvalNet helps NMT systems utilize augmented parallel data efficiently and effectively. EvalNet encourages NMT systems to learn more from high-weighted reliable data and less from low-weighted unreliable data.
While most previous studies dealing with data weighting employ loss values of data provided by a target system, EvalNet utilizes the loss values, the semantic similarity, and the cross-attention maps as input features to evaluate parallel data. Because the target is an NMT system, the cross-attention maps and semantic similarity have proven to be the best combination features to train EvalNet in this study. Through various experiments, we conclude that EvalNet is simple but beneficial for the robust training of an NMT system.
The current version of this study has two limitations. The first is that it is not easy to decide when to update EvalNet. Therefore, in the current study, EvalNet was updated in the same way as in the previous research. The second is that the current study has adopted a simplified representation to encode cross-attention information. For each token in the decoder, only a single scalar value has been used to encode the most attending token in the encoder.
To mitigate these limitations, there are two future research topics. One is to design a new architecture that can simultaneously train how to update and when to update EvalNet. The other is to exploit a vectorized representation to encode cross-attention information. This new representation can indicate more specific alignment information inherent in cross attention.

Author Contributions

Conceptualization, Y.-S.C., S.Y., S.-H.K. and K.-J.L.; methodology, Y.-H.P. and Y.-S.C.; software, Y.-H.P.; validation, Y.-H.P.; writing—original draft preparation, K.-J.L. and Y.-H.P.; writing—review and editing, K.-J.L. and Y.-H.P. All authors have read and agreed to the published version of the manuscript.

Funding

This work was supported by Electronics and Telecommunications Research Institute (ETRI) grant funded by the Korean government. [22ZS1100, Core Technology Research for Self-Improving Integrated Artificial Intelligence System].

Institutional Review Board Statement

Not applicable.

Informed Consent Statement

Not applicable.

Data Availability Statement

All data generated or analysed during this study are included in this published article.

Conflicts of Interest

The authors declare no conflict of interest.

Abbreviations

The following abbreviations are used in this manuscript:
AttnCross Attention Map
BLEUBilingual Evaluation Understudy
CIFARCanadian Institute for Advanced Research
CNNConvolutional Neural Network
EDAEasy Data Augmentation
EvalNetEvaluation Network
IWSLTThe International Conference on Spoken Language Translation
LSTMLong Short-Term Memory
LaBSELanguage-agnostic BERT Sentence Embedding
NMTNeural Machine Translation
RNNRecurrent Neural Network
SimSemantic Similarity
WATThe Workshop on Asian Translation

References

  1. Wei, J.; Zou, K. EDA: Easy Data Augmentation Techniques for Boosting Performance on Text Classification Tasks. In Proceedings of the 2019 Conference on Empirical Methods in Natural Language Processing and the 9th International Joint Conference on Natural Language Processing (EMNLP-IJCNLP), Hong Kong, China, 3–7 November 2019; pp. 6382–6388. [Google Scholar] [CrossRef] [Green Version]
  2. Sennrich, R.; Haddow, B.; Birch, A. Improving Neural Machine Translation Models with Monolingual Data. In Proceedings of the 54th Annual Meeting of the Association for Computational Linguistics, Berlin, Germany, 7–12 August 2016; pp. 86–96. [Google Scholar] [CrossRef]
  3. Shu, J.; Xie, Q.; Yi, L.; Zhao, Q.; Zhou, S.; Xu, Z.; Meng, D. Meta-weight-net: Learning an explicit mapping for sample weighting. In Proceedings of the Advances in Neural Information Processing Systems, Vancouver, BC, Canada, 8–14 December 2019; Volume 32. [Google Scholar]
  4. Jiang, L.; Zhou, Z.; Leung, T.; Li, L.J.; Fei-Fei, L. MentorNet: Learning Data-Driven Curriculum for Very Deep Neural Networks on Corrupted Labels. In Proceedings of the 35th International Conference on Machine Learning (PMLR), Stockholm, Sweden, 10–15 July 2018; Dy, J., Krause, A., Eds.; Volume 80, pp. 2304–2313. [Google Scholar]
  5. Ren, M.; Zeng, W.; Yang, B.; Urtasun, R. Learning to Reweight Examples for Robust Deep Learning. In Proceedings of the 35th International Conference on Machine Learning (PMLR), Stockholm, Sweden, 10–15 July 2018; Dy, J., Krause, A., Eds.; Volume 80, pp. 4334–4343. [Google Scholar]
  6. Ghader, H.; Monz, C. What does Attention in Neural Machine Translation Pay Attention to? In Proceedings of the Eighth International Joint Conference on Natural Language Processing, Taipei, Taiwan, 27 November–1 December 2017; pp. 30–39. [Google Scholar]
  7. Hu, Z.; Tan, B.; Salakhutdinov, R.; Mitchell, T.; Xing, E.P. Learning Data Manipulation for Augmentation and Weighting. arXiv 2019, arXiv:cs.LG/1910.12795. [Google Scholar]
  8. Devlin, J.; Chang, M.W.; Lee, K.; Toutanova, K.N. BERT: Pre-training of Deep Bidirectional Transformers for Language Understanding. arXiv 2018, arXiv:1810.04805. [Google Scholar]
  9. Khatri, J.; Bhattacharyya, P. Filtering back-translated data in unsupervised neural machine translation. In Proceedings of the 28th International Conference on Computational Linguistics, Barcelona, Spain, 8–13 December 2020; pp. 4334–4339. [Google Scholar]
  10. Ramnath, S.; Johnson, M.; Gupta, A.; Raghuveer, A. HintedBT: Augmenting Back-Translation with Quality and Transliteration Hints. In Proceedings of the 2021 Conference on Empirical Methods in Natural Language Processing, Online, 7–11 November 2021; pp. 1717–1733. [Google Scholar]
  11. Kumar, M.; Packer, B.; Koller, D. Self-paced learning for latent variable models. Adv. Neural Inf. Process. Syst. 2010, 23, 1189–1197. [Google Scholar]
  12. Feng, F.; Yang, Y.; Cer, D.; Arivazhagan, N.; Wang, W. Language-agnostic BERT Sentence Embedding. In Proceedings of the 60th Annual Meeting of the Association for Computational Linguistics, Dublin, Ireland, 22–27 May 2022; pp. 878–891. [Google Scholar] [CrossRef]
  13. Caswell, I.; Chelba, C.; Grangier, D. Tagged Back-Translation. arXiv 2019, arXiv:1906.06442. [Google Scholar]
  14. Chen, P.J.; Shen, J.; Le, M.; Chaudhary, V.; El-Kishky, A.; Wenzek, G.; Ott, M.; Ranzato, M. Facebook AI’s WAT19 Myanmar-English Translation Task Submission. In Proceedings of the 6th Workshop on Asian Translation, Hong Kong, China, 3–4 November 2019; pp. 112–122. [Google Scholar]
  15. Conneau, A.; Khandelwal, K.; Goyal, N.; Chaudhary, V.; Wenzek, G.; Guzmán, F.; Grave, É.; Ott, M.; Zettlemoyer, L.; Stoyanov, V. Unsupervised Cross-lingual Representation Learning at Scale. In Proceedings of the 58th Annual Meeting of the Association for Computational Linguistics, Online, 5–10 July 2020; pp. 8440–8451. [Google Scholar]
  16. Liu, Y.; Gu, J.; Goyal, N.; Li, X.; Edunov, S.; Ghazvininejad, M.; Lewis, M.; Zettlemoyer, L. Multilingual Denoising Pre-training for Neural Machine Translation. Trans. Assoc. Comput. Linguist. 2020, 8, 726–742. [Google Scholar] [CrossRef]
  17. Cui, Y.; Jia, M.; Lin, T.; Song, Y.; Belongie, S.J. Class-Balanced Loss Based on Effective Number of Samples. In Proceedings of the IEEE Conference on Computer Vision and Pattern Recognition, Long Beach, CA, USA, 15–20 June 2019; pp. 9268–9277. [Google Scholar]
  18. Xiao, T.; Xia, T.; Yang, Y.; Huang, C.; Wang, X. Learning from massive noisy labeled data for image classification. In Proceedings of the 2015 IEEE Conference on Computer Vision and Pattern Recognition (CVPR), Boston, MA, USA, 7–12 June 2015; pp. 2691–2699. [Google Scholar] [CrossRef]
Figure 1. The overall training process of NMT using EVALNET.
Mathematics 11 00123 g001
Figure 2. The architecture of EVALNET.
Mathematics 11 00123 g002
Figure 3. Process of how to encode a cross-attention map in EvalNet.
Mathematics 11 00123 g003
Figure 4. Examples of cross-attention maps.
Mathematics 11 00123 g004
Figure 5. Distribution of weights according to the features of EvalNet.
Mathematics 11 00123 g005
Table 1. Statistics of the training data of the NMT systems and EvalNet.
DatasetModelTypeTrainValidTest
AIHUBNMTParallel234,08093932572
Back-translation2,340,800--
EVALNETReal23,40820002000
Augment23,40820002000
Noise23,40820002000
IWSLTNMTParallel234,08093932572
Back-translation2,340,800--
EVALNETReal23,40820002000
Augment23,40820002000
Noise23,40820002000
WATNMTParallel256,10010001018
Back-translation531,69710001018
EVALNETReal800100100
Augment800100100
Noise800100100
Table 2. Hyper-parameters of the NMT systems.
Hyper-ParametersValues
Transformer-baseEmbedding dimension768
Feed-forward dimension3027
Encoder / Decoder layers6
Attention heads8
Activation FunctionRelu
CriterionLabel smoothed cross entropy0.2
Learning parametersOptimizerAdam
eps 10 6
Betas(0.9, 0.98)
Learning rate schedulerpolynomial decay
Learning rate0.001
Warmup updates40,000 (only parallel data)
100,000 (+augmented data)
Total updates120,000 (only parallel data)
300,000 (+augmented data)
Max tokens1024
Dropout0.3
Attention dropout0.1
Table 3. Hyper-parameters of EVALNET.
Hyper-ParametersValues
EvalNet parametersLoss vector dimension16
Similarity vector dimension16
Attention RNNBi-LSTM
Attention RNN layers2
Attention RNN dimension16
Attention dimension16
MLP dimension16
Learning parametersmargin0.35
batch size128
OptimizerAdam
learning rate0.001
dropout0.3
Table 4. Performance comparisons of EVALNET according to the features. The numbers in gray indicate performance degradation compared to the results of (b).
Language PairEn-KoEn-My
DatasetAIHUBIWSLTWAT
MODELEn→KoKo→EnEn→KoKo→EnEn→MyMy→En
(a)BASELINE23.325.417.316.330.819.8
(b)(a) + Back-translation27.028.818.617.432.723.0
(c)(b)
+ EvalNet
Loss27.528.918.617.132.323.0
(d)Sim27.329.018.817.433.322.9
(e)Attn27.929.318.817.133.122.4
(f)Loss + Sim27.729.018.717.333.223.5
(g)Loss + Attn27.729.418.517.232.823.3
(h)Sim + Attn27.429.418.717.633.523.1
(i)Loss + Sim + Attn27.928.918.817.332.223.6
Table 5. Examples of noisy variations and weights according to the features of EvalNet.
SentencesWeights According to
Features of EvalNet
LossSimAttn
(a)OriWhat limits should be set for agencies to use funds for people and facilities?0.9750.9590.899
RDWhat limits should be set for agencies to use funds for people and facilities?0.8360.9540.571
RSWhat limits should be set agencies for to use funds for people and facilities?0.9260.960.808
RIWhat limits should be set for agencies to use determine funds for people and facilities?0.9370.9580.888
RRWhat limits should be set for agencies to use funds for people and facilities?0.7170.9190.58
(b)OriI want to stay at a nearby hotel for a day on the 2nd when I arrive in Paris and stay in
your apartment from the 3rd when I can be made.
0.9960.960.65
RDI want to stay at a nearby hotel for a day on the 2nd when I arrive in Paris and stay in
your apartment from the 3rd when I can be made.
0.7140.8430.48
RSI want to stay at a nearby hotel for a day on the made. when I arrive in Paris and stay in
your apartment from the 3rd when I can be 2nd
0.9830.9480.479
RII want to stay at a nearby hotel for a day on the 2nd when I arrive in Paris and stay in
your apartment from the 3rd nd when I can be made.
0.9960.9590.604
RRmade. be can I when 3rd the from apartment your in stay and Paris in arrive I when
2nd the on day a for hotel nearby a at stay to want I
0.7150.9330
(c)OriThe dryer has a washer and a low capacity and takes a long time, so I usually use a
manual dryer as shown in the picture.
0.9350.9610.974
RDThe dryer has a washer and a low capacity and takes a long time, so I usually use a
manual dryer as shown in the picture.
0.7110.9150.687
RSThe dryer low a washer and a has capacity and takes a long time, so I usually use a
manual dryer as shown in the picture.
0.9240.9630.992
RIThe dryer has a washer and a low capacity and takes a present long time, so I usually
use a manual dryer as shown in the picture.
0.9080.9610.938
RRpicture. the in shown as dryer manual a use usually I so time, long a takes and capacity
low a and washer a has dryer The
0.5340.9520.565
Table 6. Model comparisons with previous weighting models.
ModelInput FeatureLoss FunctionOriginal DatasetDataset for NMT
Meta-Weight-Netlosscross entropyCIFAR [17],
Clothing1M [18]
validation data
MentorNetlossbinary cross entropyCIFAR [17]validation data,
noisy data
EvalNetloss,
semantic similarity,
cross-attention map
margin ranking lossAIHUB,
IWSLT,
WAT
validation data,
back-translation data,
noisy data
Table 7. Performance comparison with previous weighting models.
Weighting ModelEn → KoKo → En
Meta-Weight-Net26.628.0
MentorNet27.329.3
EvalNet (loss)27.528.9
EvalNet (cross-attention map)27.929.3
EvalNet (cross-attention map + semantic similarity)27.429.4
Disclaimer/Publisher’s Note: The statements, opinions and data contained in all publications are solely those of the individual author(s) and contributor(s) and not of MDPI and/or the editor(s). MDPI and/or the editor(s) disclaim responsibility for any injury to people or property resulting from any ideas, methods, instructions or products referred to in the content.

