Article

Error Probability of a Coherent M-ary PSK FSO System Influenced by Phase Noise

by
Milica Petković
1,*,
Goran T. Đorđević
2,*,
Jarosław Makal
3,
Zvezdan Marjanović
2 and
Gradimir V. Milovanović
4,*
1
Faculty of Technical Sciences, University of Novi Sad, 21000 Novi Sad, Serbia
2
Faculty of Electronic Engineering, University of Niš, 18000 Niš, Serbia
3
Faculty of Electrical Engineering, Bialystok University of Technology, 15-351 Bialystok, Poland
4
Mathematical Institute, Serbian Academy of Sciences and Arts, 11000 Belgrade, Serbia
*
Authors to whom correspondence should be addressed.
Mathematics 2023, 11(1), 121; https://doi.org/10.3390/math11010121
Submission received: 28 October 2022 / Revised: 9 December 2022 / Accepted: 21 December 2022 / Published: 27 December 2022
(This article belongs to the Special Issue Novel Mathematical Methods in Signal Processing and Its Applications)

Abstract

:
In this paper, we aim to develop an analytical framework for design and analysis of new generation mobile networks fronthaul/backhaul links based on the application of free-space optical (FSO) technology. Taking the receiver hardware imperfections into account, we present an efficient analytical approach in analyzing average symbol error probability (SEP) of the coherent FSO system employing M-ary phase-shift keying (PSK). Optical signal transmission is influenced by pointing errors and atmospheric turbulence. The signal intensity fluctuations caused by atmospheric turbulence are modeled by general Málaga ( M ) distribution, which takes into account the effect of multiple scattered components. We estimate the range of the signal-to-noise ratio at which the SEP floor appears, as well as the value of this non-removable error floor. The results illustrate that the effect of imperfect phase error compensation on the SEP is more critical under weaker turbulence conditions and for higher order modulation formats. Based on the analytical tools presented here, it is possible to estimate tolerable value of standard deviation of phase noise for the given value of SEP. This value of standard deviation is an important parameter in designing the phase-locked loop filter in the receiver.

1. Introduction

1.1. Background and Related Work

Mobile network data traffic grew 40 percent between the first quarters of 2021 and 2022, respectively. According to [1], at the end of 2021, there were around 8.2 billion mobile subscriptions, and this number is expected to increase to around 9.1 billion by the end of 2027. During the same time, the share of mobile broadband subscriptions will increase from 84 to 93 percent. Implementation of the fifth generation (5G) mobile systems has been enabling broadband data transmission. These systems should support high user data rates (up to 10 Gbps) and high reliability (about 99.999), low energy consumption and low latency (less than 1 ms), as well as high security levels and density of user terminals. These demands will be achieved by using a small-cell concept with a combination of millimeter wave (mmWave) technology. Besides designing antenna systems for mmWave 5G wireless communication services [2], special attention should also be paid to designing links between core network and access nodes (backhaul), as well as links between central unit and multiple remote distributed units (fronthaul). The designing of backhaul and fronthaul parts of 5G and beyond networks becomes an important challenge [3,4]. Besides optical fiber and millimeter waves, free-space optics (FSO) technology has been recognized to be able to fulfill the requirements of 5G and beyond backhaul and fronthaul networks. Generally, FSO is a promising technology for first-mile and last-mile links because of larger bandwidth, greater immunity to electromagnetic interference, better security and greater flexibility compared with traditional radio-frequency systems [5].
The signal propagation over an FSO link is influenced by several impairments. The intensity of optical signal propagating over an FSO channel is a random process due to turbulence-induced scintillation. Actually, inhomogeneity in atmospheric temperature and pressure cause variations of refractive index along the optical beam propagation path. The resulting atmospheric turbulence influences the signal phase and intensity fluctuations [6]. The stochastic variations of optical signal irradiance can be statistically characterized by different distributions, such as K, Gamma–Gamma, Fisher–Snedecor and exponential Weibull distribution [5,6,7,8]. In addition, Málaga ( M ) distribution was proposed for modeling the atmospheric turbulence channel when there is a light line-of-sight component (LOS), as well as scattered components by the eddies on the propagation axis and off-axis eddies. Some other distributions are particular cases of Málaga ( M ) distribution for specific numerical values of its parameters [9,10]. In [11], the authors used the so-called mixture Gamma distribution to study the outage and error performance of FSO systems. The mixture Gamma distribution was initially proposed in [12] with the aim to approximate more complex Málaga ( M ) distributions in estimating FSO system performance.
Besides turbulence-induced scintillation, misalignment fading (also known as pointing errors) has the strong influence on FSO system performance as well. Pointing errors are caused by building sway, thermal expansion and wind. This phenomenon consists of boresight and jitter. Boresight exists when there is the fixed displacement between transmitter laser and receiver detector. Jitter corresponds to random offset of received beam center at the detector surface. Both effects were considered in [12], while the effect of jitter was emphasized in [13,14].
Nowadays, FSO systems are mostly based on intensity modulation with direct detection (IM/DD) and on-off keying [5]. To achieve the best performance of these systems, it is necessary to adapt the decision threshold under varying turbulence conditions. In order to avoid adapting a threshold, subcarrier intensity modulation (SIM) technology was proposed for FSO links and has been extensively studied [5]. In the receiver of SIM-based systems, the optical signal is firstly converted to an electrical one. After that, the demodulation and detection are performed in the electrical domain. It is necessary to estimate the received signal phase variation in the process of demodulation. This estimation is often performed by the phase-locked loop (PLL). The received signal phase recovery is not perfect. Actually, there is a difference between received signal phase and estimated phase. This difference is a random process, and it is known under the name of phase noise. The effect of phase noise on SIM-based systems was considered in [15,16,17,18,19,20]. In [15], we studied the deleterious effect of imperfect reference signal recovery on detection of SIM-based multilevel phase-shift keying (MPSK) signals over strong turbulence conditions. Song et al. [16] studied the effect of phase noise on detection of SIM-based binary PSK and quaternary PSK signals over the FSO channel with lognormal scintillation, while this analysis is extended to M-ary PSK signal detection in [17]. In [18], a similar analysis was performed for the case of Gamma–Gamma turbulence induced scintillation together with pointing errors, where the approximate expressions for error probability were derived. In [19], the authors derived approximate formulas for error probability during diversity reception of SIM-based MPSK signals transmitted over an FSO channel in the presence of phase noise. Varotsos et al. [20] analyzed the effect of phase noise on error performance of the SIM-based PSK system over the FSO channel with Málaga ( M ) turbulence induced scintillation. They derived approximate expressions for SEP for single-hop and multi-hop FSO decode-and-forward relaying configurations. In our previous work [21], we analyzed the performance of the SIM-based M-ary differential PSK FSO system over Gamma–Gamma turbulence channel and pointing errors. In that case, our aim was to estimate the effect of phase noise generated by the local oscillator used for down-conversion in the differential PSK receiver. In [22], we gave a review of papers considering the effect of phase noise on the performance of SIM-based FSO systems. Based on the results of those contributions, it is evident that phase noise has a strong effect on error performance of SIM-based PSK FSO systems.

1.2. Motivation

Results from [23] proved that coherent FSO systems have improvements of 24–30 dB compared with SIM-based FSO systems over different turbulence conditions. Such high-performance FSO systems can be used in backhaul as an integral part of 5G beyond networks to provide a seamless connection with fiber optic counterparts [24,25]. Recently, with the advent in coherent detection technology that allows for background noise rejection, high sensitivity, and improved spectral efficiency, there has been a resurgence of interest in coherent FSO communications with coherent homodyne/heterodyne receivers [26], and references therein. Some deep tech companies have been developing 100 Gbs coherent FSO systems capable of transmitting data over distances up to 10 km [27]. It is obvious that coherent FSO systems, regardless of the fact that they are more complex to implement compared with IM/DD FSO systems, will play a significant role in development of modern mobile networks in the near future. This research is exactly along this line and aims to provide a theoretical basis not only for evaluating the performance of these systems, but also for their design.
At the transmitter of a coherent FSO system, an information bearing signal modulates a lightwave signal by applying amplitude, frequency or phase modulation. At the receiver, a received optical signal is combined with a signal of local oscillator (LO), and the resulting signal is converted by a photodetector to electrical signal. The difference between a received optical signal phase and an LO output signal phase is known as a phase error. This phase error is compensated by PLL in an electrical part of the receiver. In the case when the frequency of LO differs for several gigahertzes from the frequency of the received optical signal, heterodyne detection is performed [28,29,30]. The imperfect phase error compensation in the electrical part of the coherent receiver is a significant deleterious effect in coherent FSO systems. This imperfect phase error compensation is also known as phase noise. The error probability degradation caused by the phase noise in coherent FSO systems was examined in [28,29]. The analysis related with the effect of phase noise in both works was carried out for binary phase-shift keying (BPSK) modulation format, and the results showed that the standard deviation of the phase noise larger than 20 degrees causes undesirable error probability degradations. The error rate analysis of FSO communication system with coherent detection in the presence of phase noise was further analyzed in [30] where pre-detection and post-detection equal-gain receivers of BPSK signals were considered.
Higher order modulation formats are implemented in order to increase the spectral efficiency. In that case, the effect of phase noise on the error probability is expected to be stronger because the decision areas become narrower as the modulation order increases. There is a practical need to develop an efficient analytical method for estimating the effect of phase noise on the coherent FSO system performance when higher order modulated signals are transmitted over a turbulence channel.

1.3. Contribution

Motivated by the possibility of implementing coherent FSO technology into 5G beyond backhaul and fronthaul networks, in this work, we study the effect of imperfect phase error compensation on SEP performance of the coherent FSO system. The primary aim of this work is to present the analytical framework for analyzing the error probability degradation caused by the phase noise for higher order modulation formats. In addition, in contrast to [28,29], where strong turbulence conditions were examined, and in contrast to [30], where the Gamma–Gamma model was utilized for turbulence modeling, we consider the case when atmospheric turbulence channel is modeled by Málaga ( M ) distribution [9,10,31]. In addition, the random misalignment exists between the transmitter laser and receiver photodetector, which is modeled such as in [13,14].
In [28,29,30], in order to estimate the influence of phase noise on FSO system performance when binary PSK signals are transmitted, the authors applied the method using the characteristic function. In order to obtain the numerical values of the error probability, it is necessary to perform a two-fold numerical integration, whereby the sub-integral function contains the Gaussian hypergeometric function (see, for example, [26,27,28]). In contrast to these works, we provide a procedure for determining the error probability in detecting multilevel PSK signals, in the case when turbulence induced scintillation is modeled by a more general distribution. In doing so, we use the Fourier Series Method (FSM), which is suitable for asymptotic analysis that will be illustrated in the following text.
In our analysis, we use FSM for representing the probability density function (PDF) describing the received composite signal phase statistic [32]. Firstly, we derive the novel analytical expressions for coefficients in Fourier series expansion. Secondly, under assumption that phase error compensation is performed by PLL in a coherent receiver, such as in [28,29,30], we present the analytical expressions for symbol error probability (SEP) in the form of convergent series. In order to evaluate the numerical value of error probability, it is necessary to truncate the series. In order to estimate system performance as quickly as possible, it is necessary to sum the least number of terms that ensure the fixed value of the truncation error. Because of that, our analysis contains a strong mathematical background. The convergence of this series is proved, and the upper bound for truncation error is estimated. This analytical expression for SEP enables us to determine the numerical value of the error floor appearing in the system, and to identify the signal-to-noise ratio (SNR) range when this error floor appears. These two magnitudes are very important system parameters from the point of view of energy efficiency. The analytical results are verified by Monte Carlo simulations.

1.4. Structure

Section 2 presents the system, channel, and receiver model. Section 3 contains four subsections. In the first part of Section 3, we derive novel expressions for Fourier coefficients in representing the PDF of the received signal phase. These coefficients are further incorporated into the formula for SEP presented in the second part of Section 3. The third part of Section 3 presents convergence analysis of the formula for SEP. In the fourth part of Section 3, we illustrate that our approach is convenient for asymptotic analysis and derives a simple formula for estimating the SEP floor. Numerical results with appropriate comments are presented in Section 4, while some concluding remarks are given in Section 5.

2. System and Channel Model

After optical signal transmission over an FSO channel influenced by atmospheric turbulence and pointing errors, coherent detection is performed by mixing received optical signals with the LO beam. Next, the PIN photodetector (PD) is used to converting an optical signal into an electrical one, which is further recovered by the PSK demodulator in the electrical domain. The block-scheme of the system considered here is presented in Figure 1. Based on the quite similar analysis presented in [28,29], the electrical signal at the MPSK receiver input can be presented as
i ( t ) = 2 R ( P s P LO ) cos ( ω IF t + ϕ m + ϕ ) + n ( t ) ,
where R denotes the PD responsivity, optical signal power is equal to P s = A r I , where A r is detector area, and I represents the optical signal irradiance. The LO signal power is denoted by P LO , and ω IF = ω OS ω LO is the difference between the optical and LO signal frequencies, respectively. The encoded signal phase information is denoted by ϕ m , and ϕ is the random signal phase generated due to transmission over an FSO channel. The system is affected by zero-mean additive white Gaussian noise (AWGN) with variance σ n 2 = q R P LO T / 2 , where q is an electronic charge, and T is symbol interval [28]. The instantaneous SNR per symbol is defined as [28]
γ = 4 R 2 P s P LO 2 σ n 2 = R P s T q = R A r T q I = η e A r T h ν I = C c I .
The responsivity is equal to R = η e q / ( h ν ) , where η e is the detector quantum efficiency, h is Planck’s constant, and ν is the frequency of the received optical signal. The multiplicative constant for coherent FSO system is defined as C c = η e A r T / ( h ν ) .
The optical signal transmission via free space is affected by M -distributed atmospheric turbulence and pointing errors. Since it takes into account the effect of multiple scattered components, the M distribution represents a more general model compared to mostly adopted Gamma–Gamma distribution [9,10]. Besides the component C L occurring due to LOS contribution, there is the component C C S scattered by the eddies on the propagation axis, and it is coupled to the component C L . The M distribution also joins the component C G S scattered to the receiver by the off-axis eddies. This component is statistically independent from both components C L and C C S [10]. The PDF of irradiance I accounted for both M -distributed atmospheric turbulence and pointing errors is ([10], (21))
f I I = ξ 2 A 2 I 1 k = 1 β a k G 1 , 3 3 , 0 ( α β I ( g β + Ω ) A 0 | ξ 2 + 1 ξ 2 , α , k ) ,
where G p , q m , n · is Meijer’s G-function ([33], (9.301)), while constants A and a k are defined as ([10], (8))
A = Δ 2 α α 2 g 1 + α 2 Γ α g β g β + Ω β + α 2 , a k = Δ β 1 k 1 g β + Ω 1 k 2 k 1 ! Ω g k 1 α β k 2 .
The natural number β defines the amount of fading parameter, while a positive parameter α is related to the effective number of large-scale cells of the scattering process. Furthermore, the parameter g represents the average power of the component C G S scattered by off-axis eddies, defined as g = E C G S 2 = 2 b 0 1 ρ , where 2 b 0 = E C C S 2 + C G S 2 is the average total power of the scatter components. The parameter ρ ( 0 ρ 1 ) represents the contribution of C G S into the total power of scattered components. Next, Ω = Ω + 2 b 0 ρ + 2 2 b 0 ρ Ω cos ϕ A ϕ B is the average power from the coherent contributions, with the average power of the LOS defined as Ω = E C L 2 . The deterministic phases of the LOS and the coupled to LOS scatter term are represented as ϕ A and ϕ B , respectively [10].
Related to the pointing errors, the parameter ξ is defined as ξ = a e / ( 2 σ s ) , where a e is the equivalent beam radius at the receiver, and σ s is jitter standard deviation. Parameter a e is related to the parameter a L being the optical beam radius at the distance L, as a e 2 = a L 2 π erf ( v ) / 2 v exp v 2 , with A 0 = erf 2 ( v ) , v = π a / 2 a d , where a denotes the radius of circular detector [13,14] and erf ( · ) is the error function ([33], (8.250.1)). The parameter a L is related with the beam radius at the waist, a 0 , and the radius of curvature, F 0 , by a L = a 0 ( ( Θ 0 + Λ 0 ) ( 1 + 1.63 σ R 12 / 5 Λ 1 ) ) 1 / 2 , where Θ 0 = 1 L / F 0 , Λ 0 = 2 L / ( k a 0 2 ) , Λ 1 = Λ 0 / ( Θ 0 2 + Λ 0 2 ) [13,14]. The Rytov variance is defined as σ R 2 = 1.23 C n 2 2 π / λ 7 / 6 d 11 / 6 , The Rytov variance determines intensity of atmospheric turbulence being defined as σ R 2 = 1.23 C n 2 2 π / λ 7 / 6 L 11 / 6 , where λ is the wavelength, and C n 2 is the refractive index structure parameter.
Based on the instantaneous SNR definition in (2) and the PDF in (3), the PDF of γ is derived as [31]
f γ γ = ξ 2 A 2 γ k = 1 β a k G 1 , 3 3 , 0 ( α β κ g + Ω γ g β + Ω γ ¯ | ξ 2 + 1 ξ 2 , α , k ) ,
where κ = ξ 2 ξ 2 ξ 2 + 1 ξ 2 + 1 , and the average SNR per symbol for the coherent detection is γ ¯ = E γ = E I C c [31]. The average SNR per bit, μ b , is defined as μ b = γ ¯ / log 2 M .
At the receiver, coherent detection is performed by combining received optical signal with the LO beam. There is a difference between received signal random phase ( ϕ OS ) and LO output signal random phase ( ϕ LO ). This difference, denoted by ϕ = ϕ OS ϕ LO , is also a random process. This random process is compensated by PLL in the receiver in the electrical domain. However, the compensation is not perfect, i.e., there is a difference between phase ϕ and voltage-controlled local oscillator output signal phase ϕ ^ . This difference, φ = ϕ ϕ ^ , is a random process fluctuating over time, and it is known as a phase noise. The phase noise is described by a Tikhonov PDF given by [21]
f φ φ = exp b cos φ 2 π I 0 b , φ π ,
where I 0 ( · ) is the zero order modified Bessel function of the first kind, while the n-th order modified Bessel function of the first kind is defied by ([33], (8.431)), b = 1 / σ φ 2 , and σ φ 2 is the variance of the phase noise. Furthermore, the Tikhonov PDF can be expressed in the Fourier series as [21]
f φ φ = 1 2 π + n = 1 c n cos ( n φ ) , φ π ,
where
c n = I n b π I 0 b .

3. Error Rate Analysis

In this section, we present the PDF of the composite received signal phase in Fourier series form and derive the novel expression for Fourier coefficients. After that, by applying FSM, we present the formula for SEP in convergent series form, and give the proof of convergence of this series, as well as the estimation of the upper bound for truncation error. In addition, we present asymptotic analysis when average SNR tends to infinity.

3.1. Representation of PDF of Signal Phase in Fourier Series Form

In order to evaluate the SEP performance of the coherent FSO system, the PDF of the composite received signal phase ψ is represented in the Fourier series form as it was suggested in [32].
The conditional PDF of the composite signal phase in a Fourier series form due to additive noise can be presented as [32]
f ψ γ = 1 2 π + n = 1 a n ( γ ) cos ( n ψ ) , ψ < π ,
where a n ( γ ) is the Fourier coefficient for the AWGN channel defined as [32]
a n ( γ ) = Γ n 2 + 1 n ! π γ n 2 exp ( γ ) 1 F 1 n 2 + 1 ; n + 1 ; γ ,
where 1 F 1 · ; · ; · denotes the confluent hypergeometric function ([33], (9.21)).
The average PDF of the resulting received signal phase can be determined as
f ψ ψ = 0 f ψ γ f γ γ d γ ,
where f γ ( γ ) is the PDF of the instantaneous SNR given by (5).
After substituting (5), (9) and (10) into (11), the PDF of phase ψ is given as
f ψ ψ = 1 2 π + ξ 2 A 2 π n = 1 k = 1 β a k Γ n 2 + 1 n ! cos n ψ × 0 γ n 2 1 exp γ 1 F 1 n 2 + 1 ; n + 1 ; γ G 1 , 3 3 , 0 ( α β κ g + Ω γ g β + Ω γ ¯ | ξ 2 + 1 ξ 2 , α , k ) d γ .
The product of exponential and confluent hypergeometric functions in (12) is represented in terms of Meijer’s G-function based on ([34], (07.20.26.0015.01)) as
exp γ 1 F 1 n 2 + 1 ; n + 1 ; γ = Γ n + 1 Γ n 2 G 1 , 2 1 , 1 ( γ | 1 n 2 0 , n ) .
Furthermore, by inserting (13) into (12), and after applying ([34], (06.05.16.0002.01) and (06.05.03. 0001.01)), the PDF of phase ψ is re-written as
f ψ ψ = 1 2 π + ξ 2 A 4 π n = 1 k = 1 β a k n cos n ψ × 0 γ n 2 1 G 1 , 2 1 , 1 ( γ | 1 n 2 0 , n ) G 1 , 3 3 , 0 ( α β κ g + Ω γ g β + Ω γ ¯ | ξ 2 + 1 ξ 2 , α , k ) d γ .
The integral in (14) is solved by utilizing ([34], (07.34.21.0013.01)) as
0 γ n 2 1 G 1 , 2 1 , 1 ( γ | 1 n 2 0 , n ) G 1 , 3 3 , 0 ( α β κ g + Ω γ g β + Ω γ ¯ | ξ 2 + 1 ξ 2 , α , k ) d γ = G 3 , 4 4 , 1 ( α β κ g + Ω g β + Ω γ ¯ | 1 n 2 , 1 + n 2 , ξ 2 + 1 ξ 2 , α , k , 0 ) .
The final PDF of phase ψ is derived as
f ψ ψ = 1 2 π + ξ 2 A 4 π n = 1 k = 1 β a k n G 3 , 4 4 , 1 ( α β κ g + Ω g β + Ω γ ¯ | 1 n 2 , 1 + n 2 , ξ 2 + 1 ξ 2 , α , k , 0 ) cos n ψ .
The PDF of phase ψ of the composite received signal is represented in the Fourier series form as
f ψ ( ψ ) = 1 2 π + n = 1 b n cos ( n ψ ) , | ψ | π ,
where the Fourier coefficient b n depends on specific channel conditions. In our case, based on previous derivation, for the FSO channel influenced by the M distributed atmospheric turbulence and pointing errors, the Fourier coefficient b n is derived as
b n = ξ 2 A n 4 π k = 1 β a k G 3 , 4 4 , 1 ( α β κ g + Ω g β + Ω γ ¯ | 1 n 2 , 1 + n 2 , ξ 2 + 1 ξ 2 , α , k , 0 ) .
For channel propagation conditions observed in [28,29,30], by applying quite the similar procedure, these Fourier series coefficients can be derived in the form
b n GG = n 2 π Γ ( α ) Γ ( β ) G 2 , 3 3 , 1 ( α β γ ¯ | 1 n 2 , 1 + n 2 α , β , 0 ) .

3.2. Symbol Error Probability

Based on FSM, the average SEP of the coherent M-ary PSK FSO system with ideal coherent detection (the phase noise is absent) is
P s φ = 0 = 1 π / M π / M f ψ ψ d ψ = 1 1 M n = 1 2 b n n sin n π M .
In the case of the coherent FSO system in the presence of the phase noise, a conditional SEP is found as
P s φ = 1 φ π / M φ + π / M f ψ ψ d ψ = 1 1 M n = 1 2 b n n sin n π M cos n φ ,
After averaging (21) over the PDF of the phase noise given in (7), the SEP of the coherent PSK FSO system is derived as
P s = π π P s φ f φ φ d φ = 1 1 M n = 1 2 π b n c n n sin n π M ,
where the Fourier coefficients b n and c n are previously defined in (18) and (8), respectively. The expression for the Fourier coefficients in (18) was derived for the first time in this paper. This expression allows us to evaluate the numerical value of SEP for any values of the channel parameters after application in (22).
Those numerical results related to the effect of imperfect compensation of phase error on error probability presented in [28,29] can be checked by using Fourier coefficients given by (19) in combination with formula for SEP (22).
If symbols are mapped into bits by Gray rule, then the bit error rate (BER) can be simply approximated as BER SEP / log 2 M ([35], p. 271).
The proof of convergence of the series in (22) is presented in the following subsection, where estimation of the truncation error in summation (22) is also given.

3.3. Convergence Analysis

The SEP expression in (22) is re-written as
P S = 1 1 M 2 π B ,
where B = n = 1 D n sin ( n π / M ) and D n = b n c n / n . It holds b n > b n + 1 > 0 and c n > c n + 1 > 0 , thus
D n = b n c n n > b n + 1 c n + 1 n + 1 = D n + 1 .
In addition, it is true that
lim n D n = lim n b n c n n = 0 .
Furthermore, according to ([33], (1.342.1)), it holds that
k = 1 n sin k π M = sin n π 2 M sin n + 1 π 2 M sin π 2 M 1 sin π 2 M = const .
Based on (23), (24) and (25), by applying Dirichlet criterion ([33], (0.228.2) and (0.229)), it is proved that a series B in (23) is convergent.
In order to estimate the truncation error in evaluating SEP, (22), i.e., (23), is presented in the form
P S = 1 1 M 2 π n = 1 D n sin n π M ,
where D n is a decreasing zero-sequence defined before. Replacing n by M ( n 1 ) + ν , ν = 1 , , M , and using the fact that
sin π M [ ( M ( n 1 ) + ν ] = ( 1 ) n 1 sin ν π M , ν = 1 , , M ,
the previous formula for P S becomes
P S = 1 1 M + 2 π n = 1 ν = 1 M 1 D M ( n 1 ) + ν ( 1 ) n sin ν π M ,
because the last term in the inner sum vanishes (for ν = M ). We point out here that we do not change the order of the series terms, but only group them so that they are first negative, then positive, etc.
Thus, P S reduces to
P S = 1 1 M + n = 1 ( 1 ) n q n ,
where
q n = 2 π ν = 1 M 1 D M ( n 1 ) + ν sin ν π M > 0
and it is easy to see that lim n q n = 0 .
With this procedure, we obtain an alternative series for which we have a remainder estimate if the series is approximated by a partial sum
P S = 1 1 M + n = 1 N ( 1 ) n q n + E N ,
where | E N | q N + 1 .
The convergence acceleration can be achieved by applying the Euler–Abel transformation ([36], §1.3.2) as it was used in the recent article [37] (see also ([36], §1.3.2)).

3.4. Asymptotic Analysis

For finding a limit when γ ¯ + , we need to re-examine the derivation of (17). Namely, to obtain this equation, it is necessary to perform an integration step in (14), or more precisely, in (11), under the assumption that the average SNR tends to infinity. Strictly mathematically speaking, the integral (11) itself is an improper integral of the first kind that is in Riemann sense defined as the limit of proper integral when the upper bound tends to infinity. This in turn presents a problem, as we need to find a double limit
f ψ ( ψ ) = lim h , γ ¯ + 0 h f ( ψ | γ ) f γ ( γ , γ ¯ ) d γ .
In the previous equation, instead of f γ ( γ ) , we use notation f γ ( γ , γ ¯ ) in order to emphasize that PDF depends on average SNR. On the other hand, when average SNR tends to infinity, according to (5), the probability of any other value being realized becomes infinitesimally small, as
lim γ ¯ + G 1 , 3 3 , 0 ( α β κ · g + Ω g β + Ω · γ γ ¯ | ξ 2 + 1 ξ 2 , α , k ) = 0 , 0 γ < + ,
while, for γ + , it is indeterminate. Therefore, probability density function f ( γ , γ ¯ ) has the property of
lim γ ¯ + f ( γ , γ ¯ ) = 0 , γ < + Φ , γ + ,
where Φ + , in order to satisfy a probability normalization condition. A specified value for Φ stems from the indeterminate nature of a corresponding limit in (34), which permits this value to be arbitrary, including an infinite value. The property is equivalent to the following statement:
lim γ ¯ + f γ ( γ , γ ¯ ) = lim γ ¯ + δ ( γ γ ¯ ) ,
where δ ( · ) represents Dirac’s delta function. Then, we can write (33) as
f ψ ( ψ ) = lim γ ¯ + 0 + f ( ψ | γ ) δ ( γ γ ¯ ) d γ = lim γ ¯ + f ( ψ | γ ¯ )
Therefore, when γ ¯ + , Equation (11) tends to
f ψ ( ψ ) = 1 2 π + n = 1 + cos ( n ψ ) lim γ + a n ( γ )
According to definition in (10), and ([34], (07.20.06.0007.01)), we have
b n = lim γ + a n ( γ ) = 1 π ,
which proves the proposition when SNR tends to infinity. Then, f ψ ( ψ ) = δ ( ψ ) . In that case, when SNR tends to infinity, based on (22), SEP can be estimated as
P s floor = 1 1 M n = 1 2 c n n sin n π M .

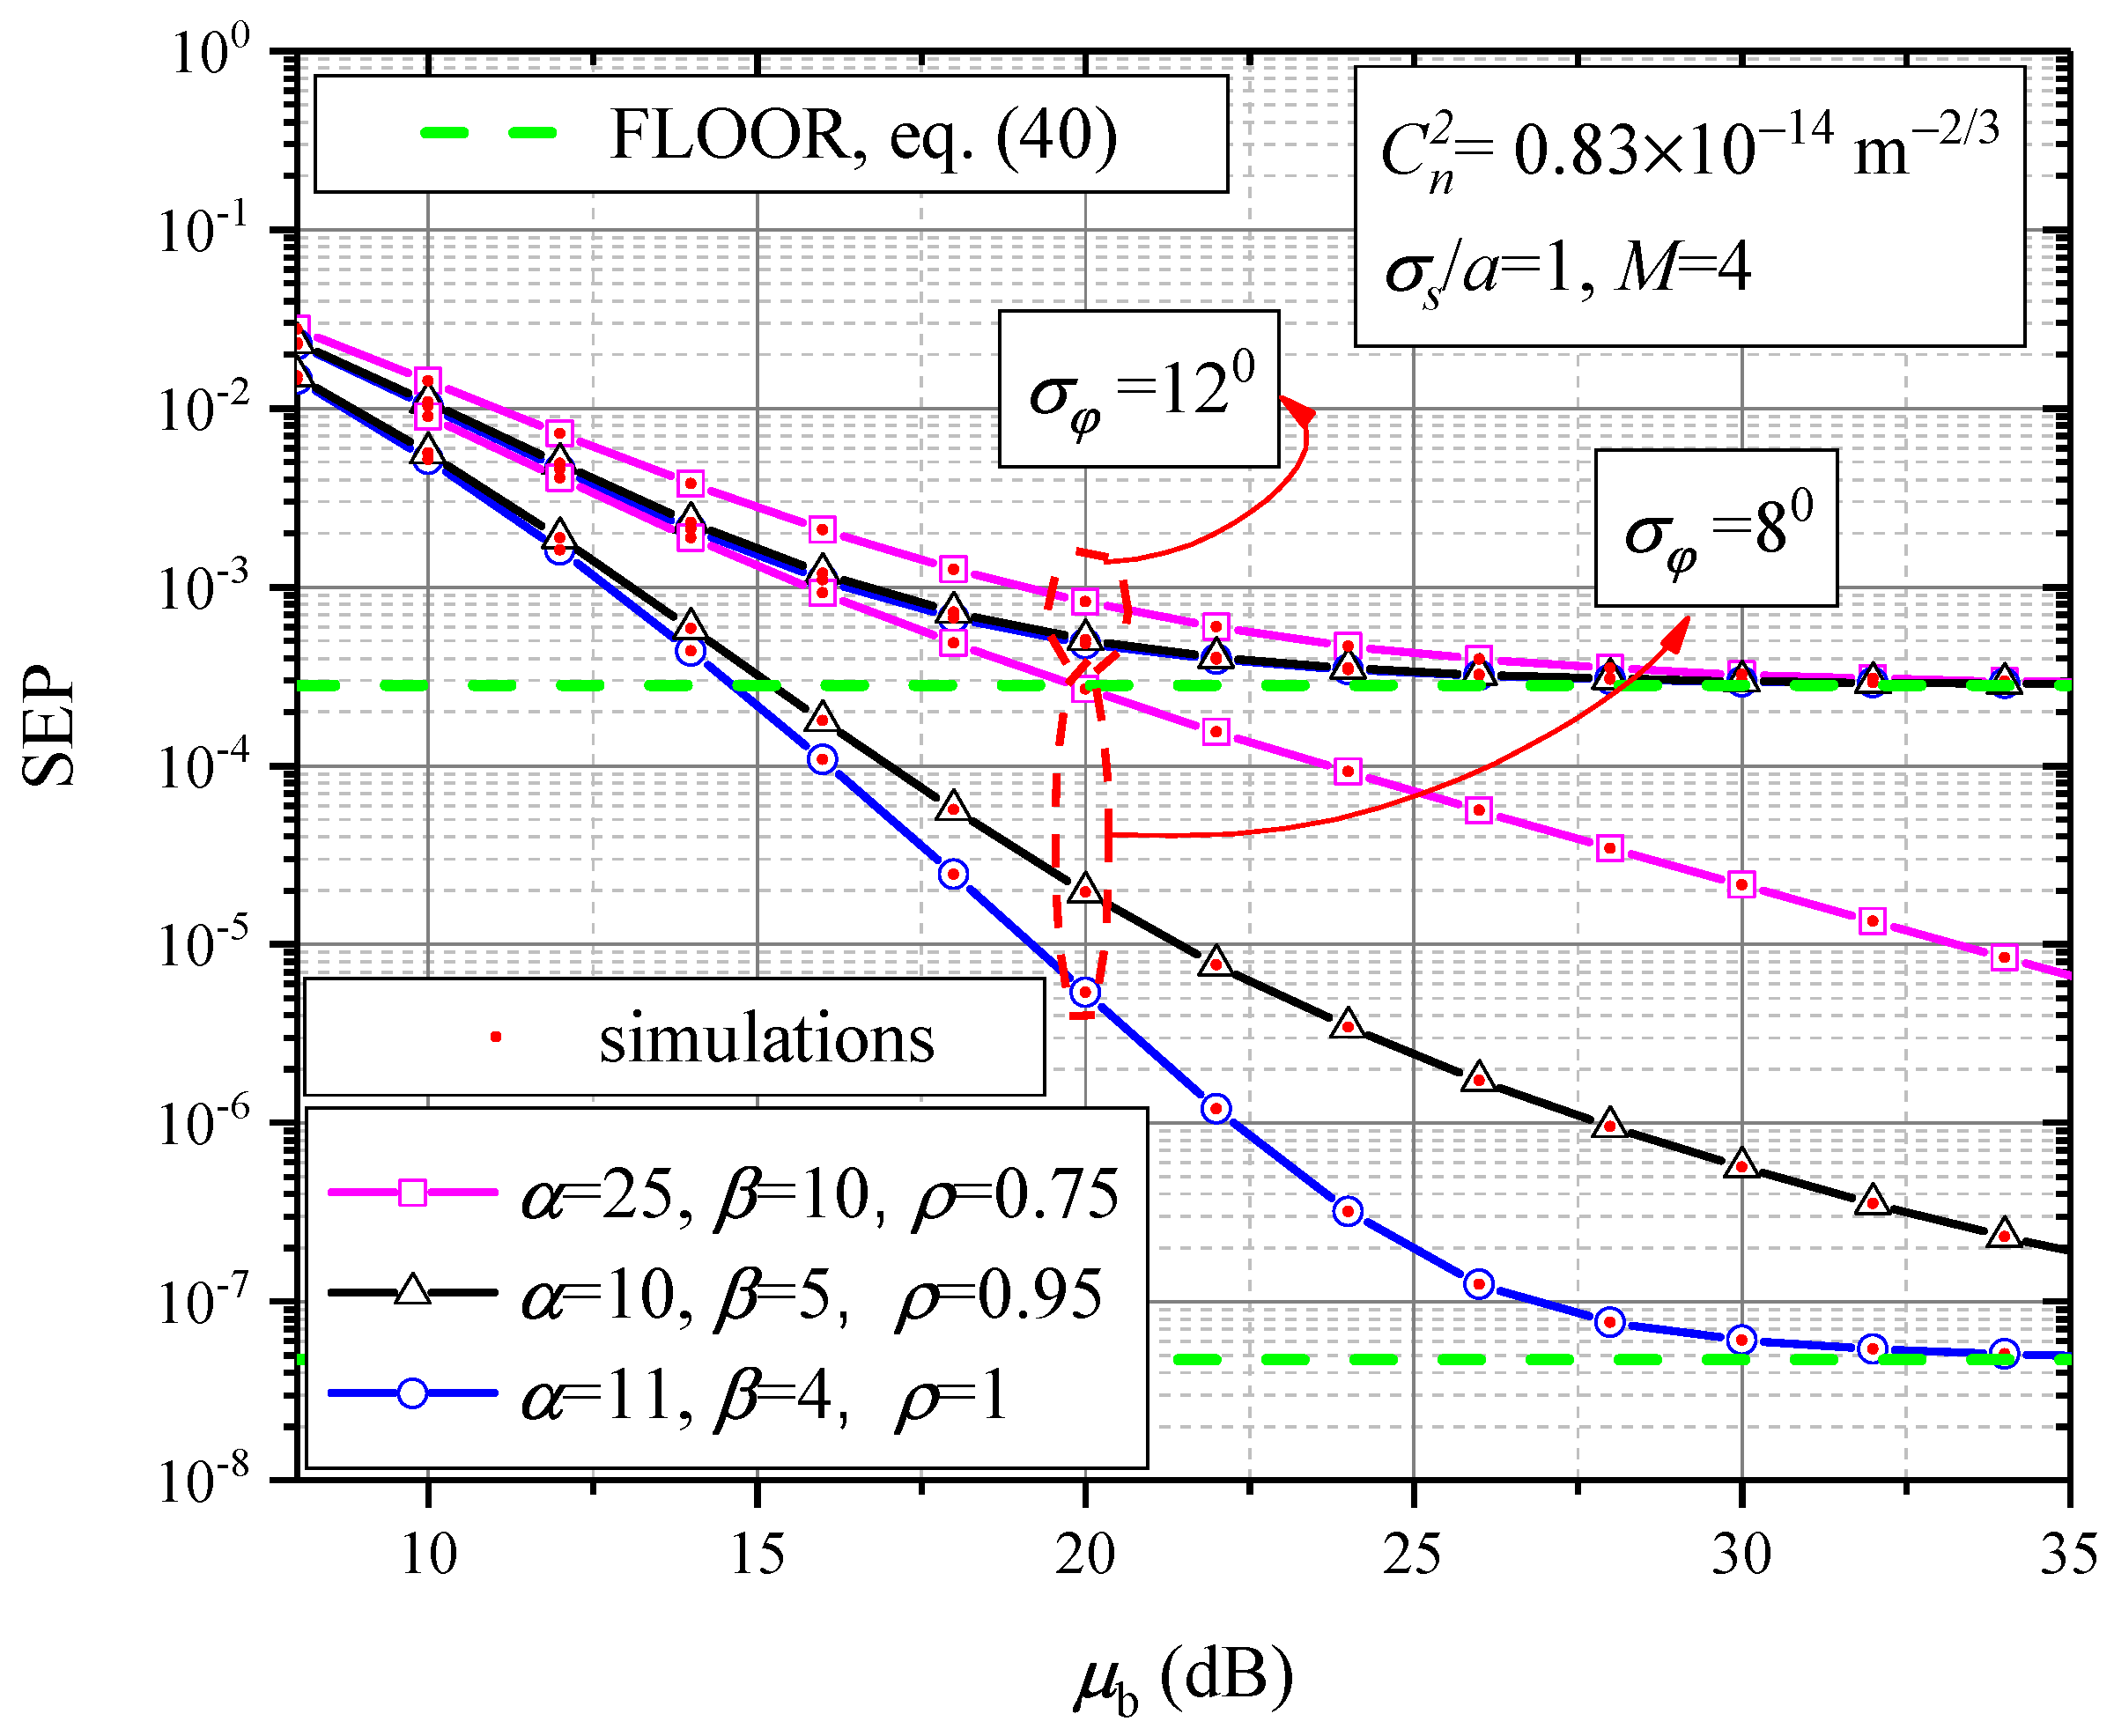
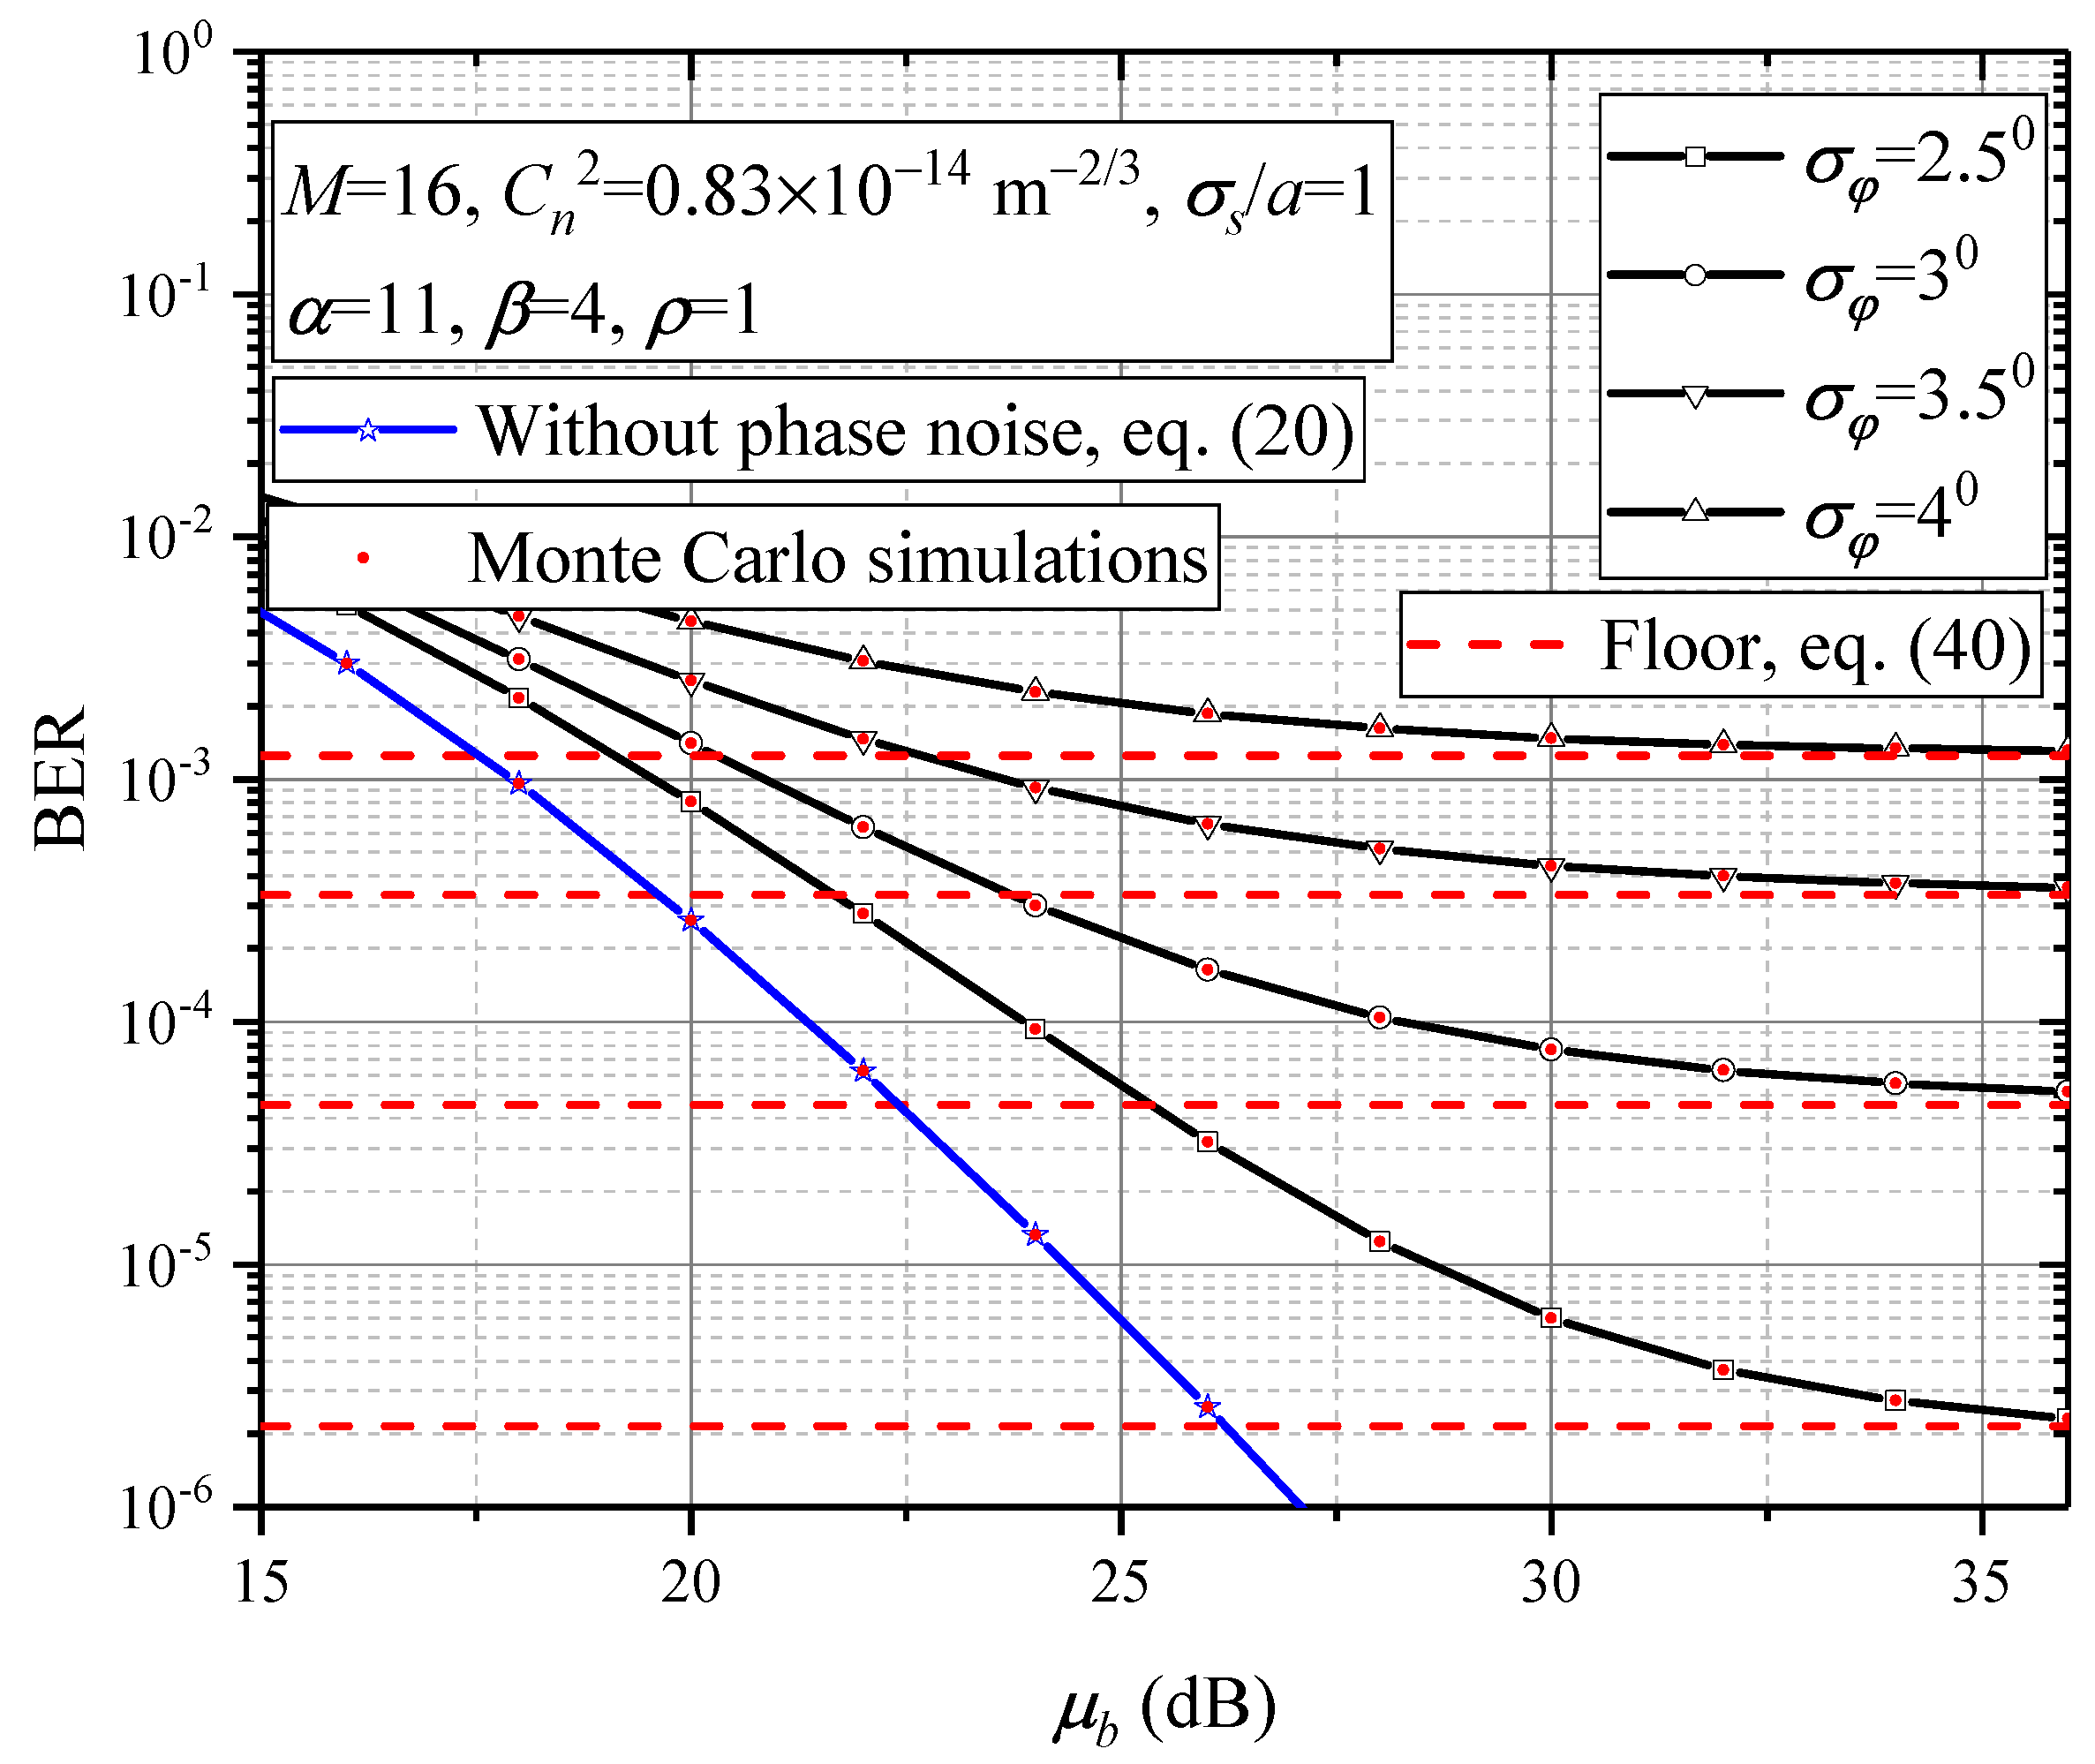
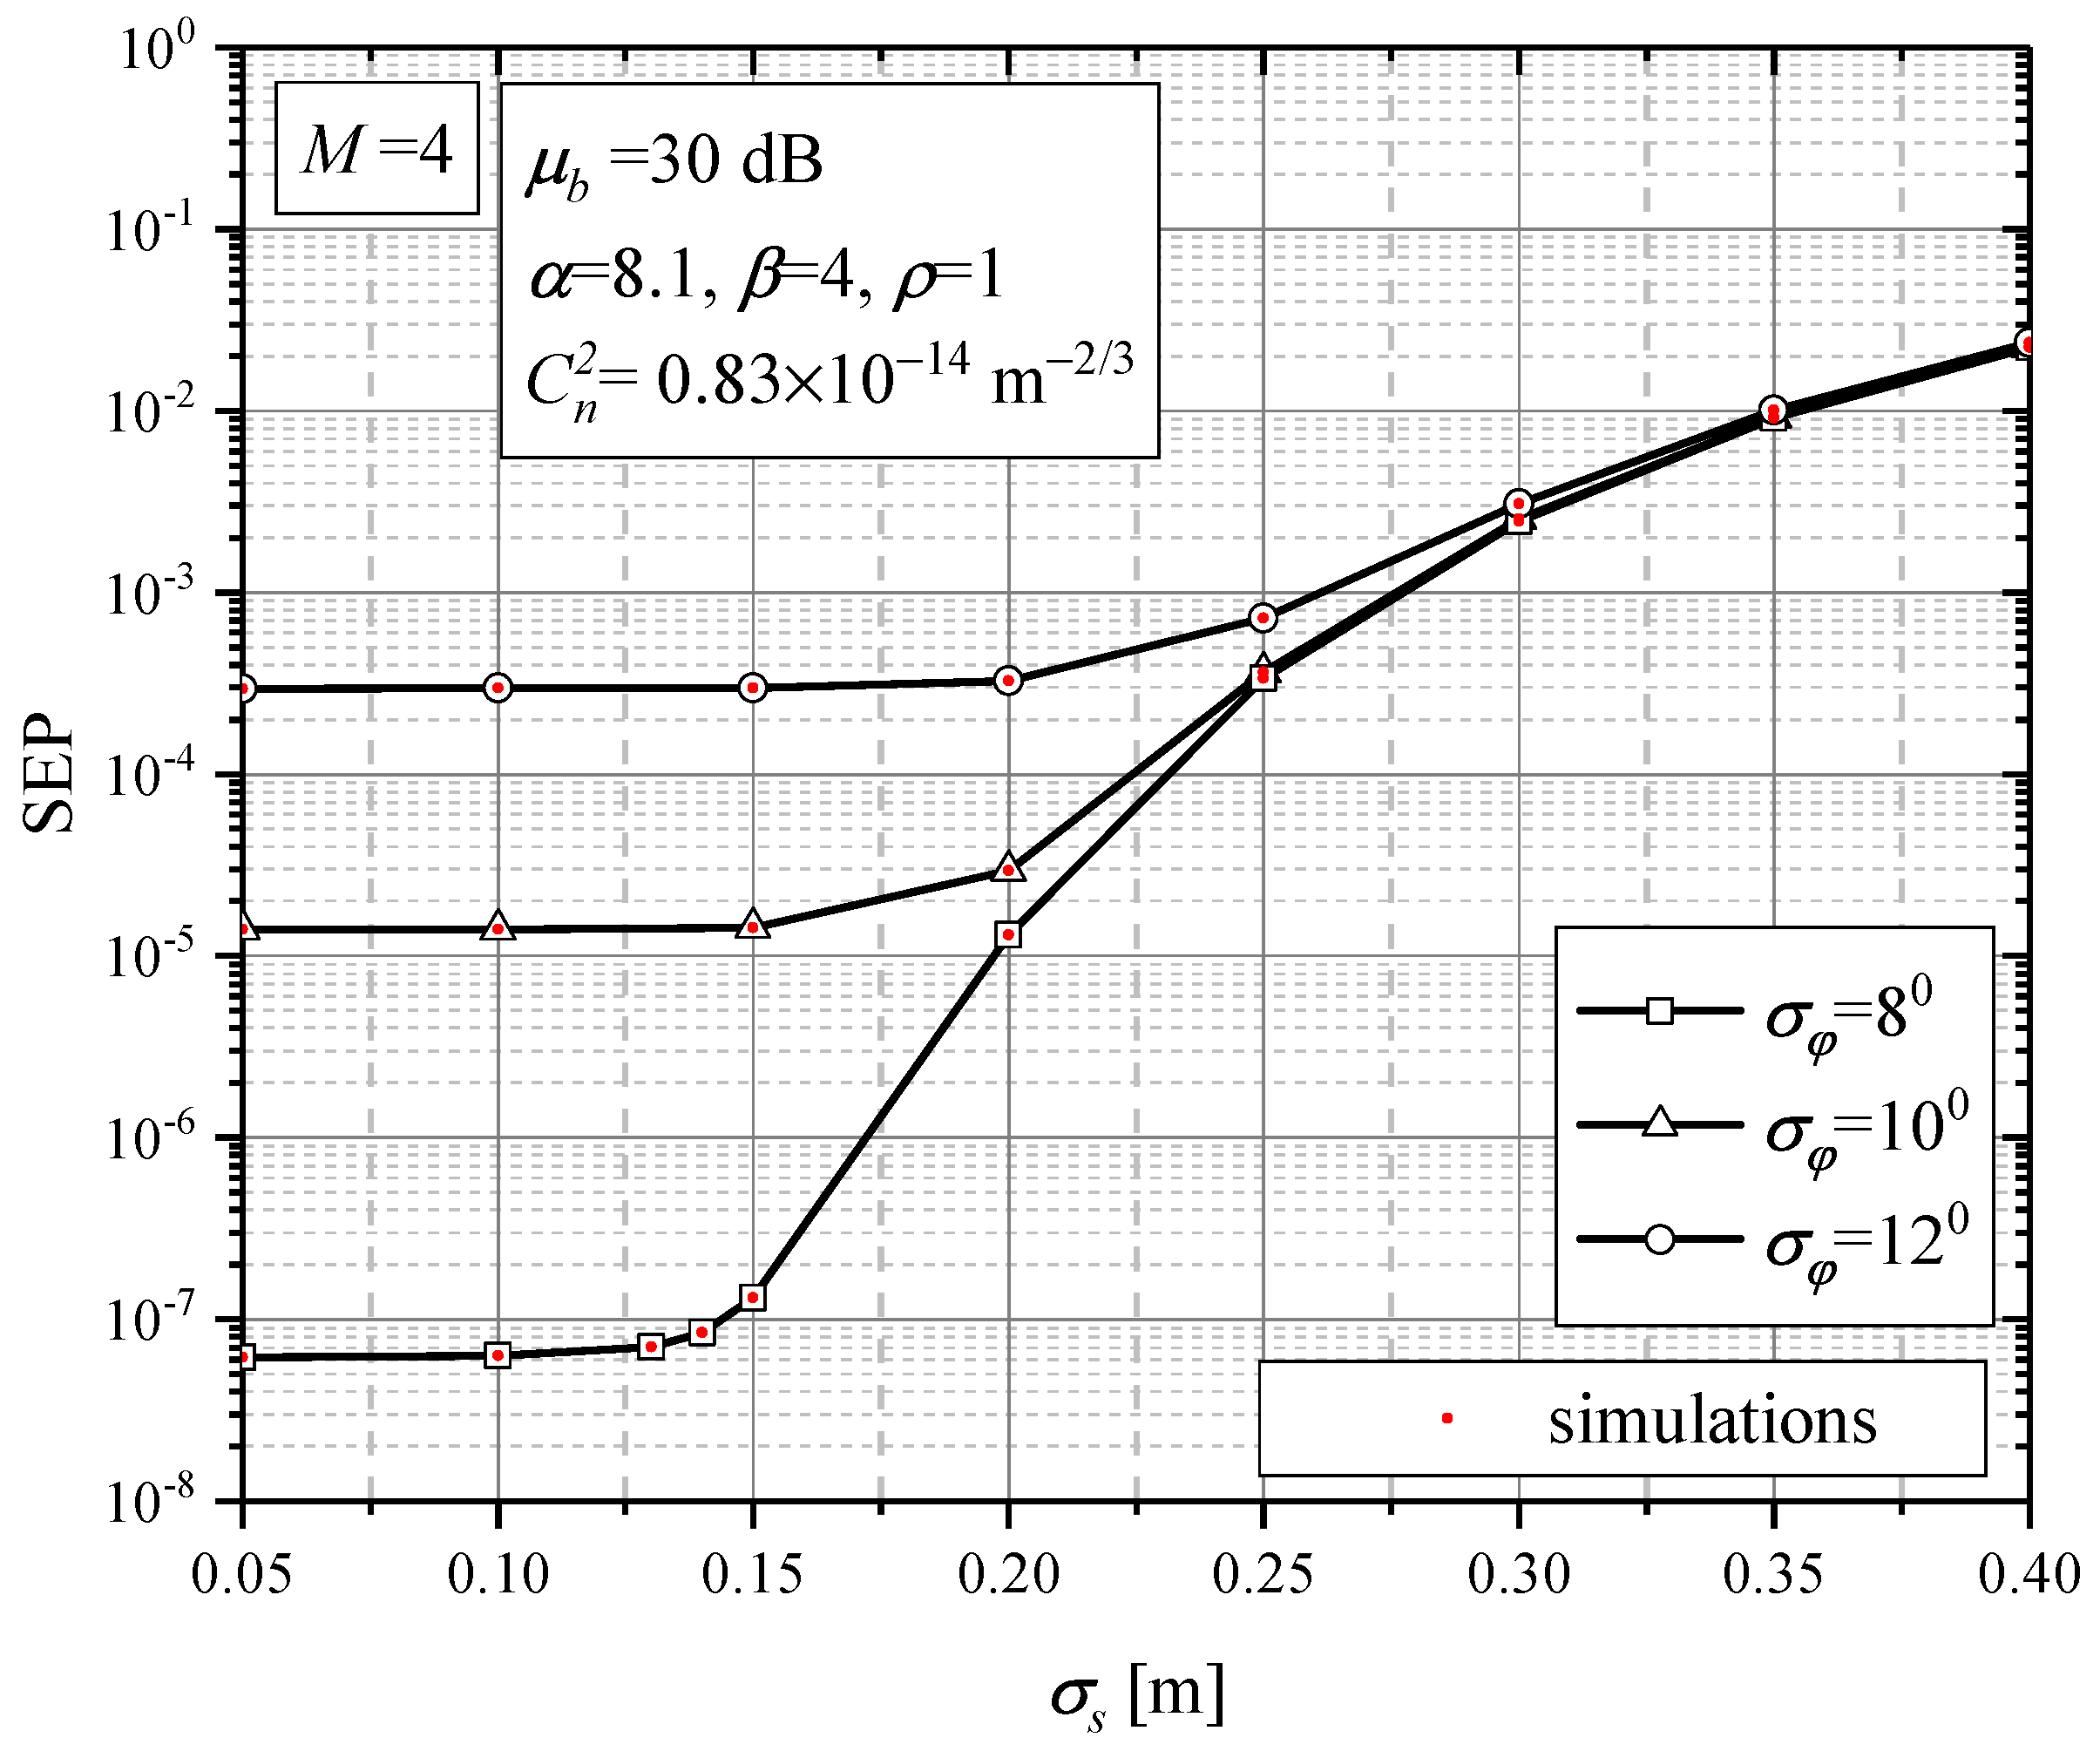
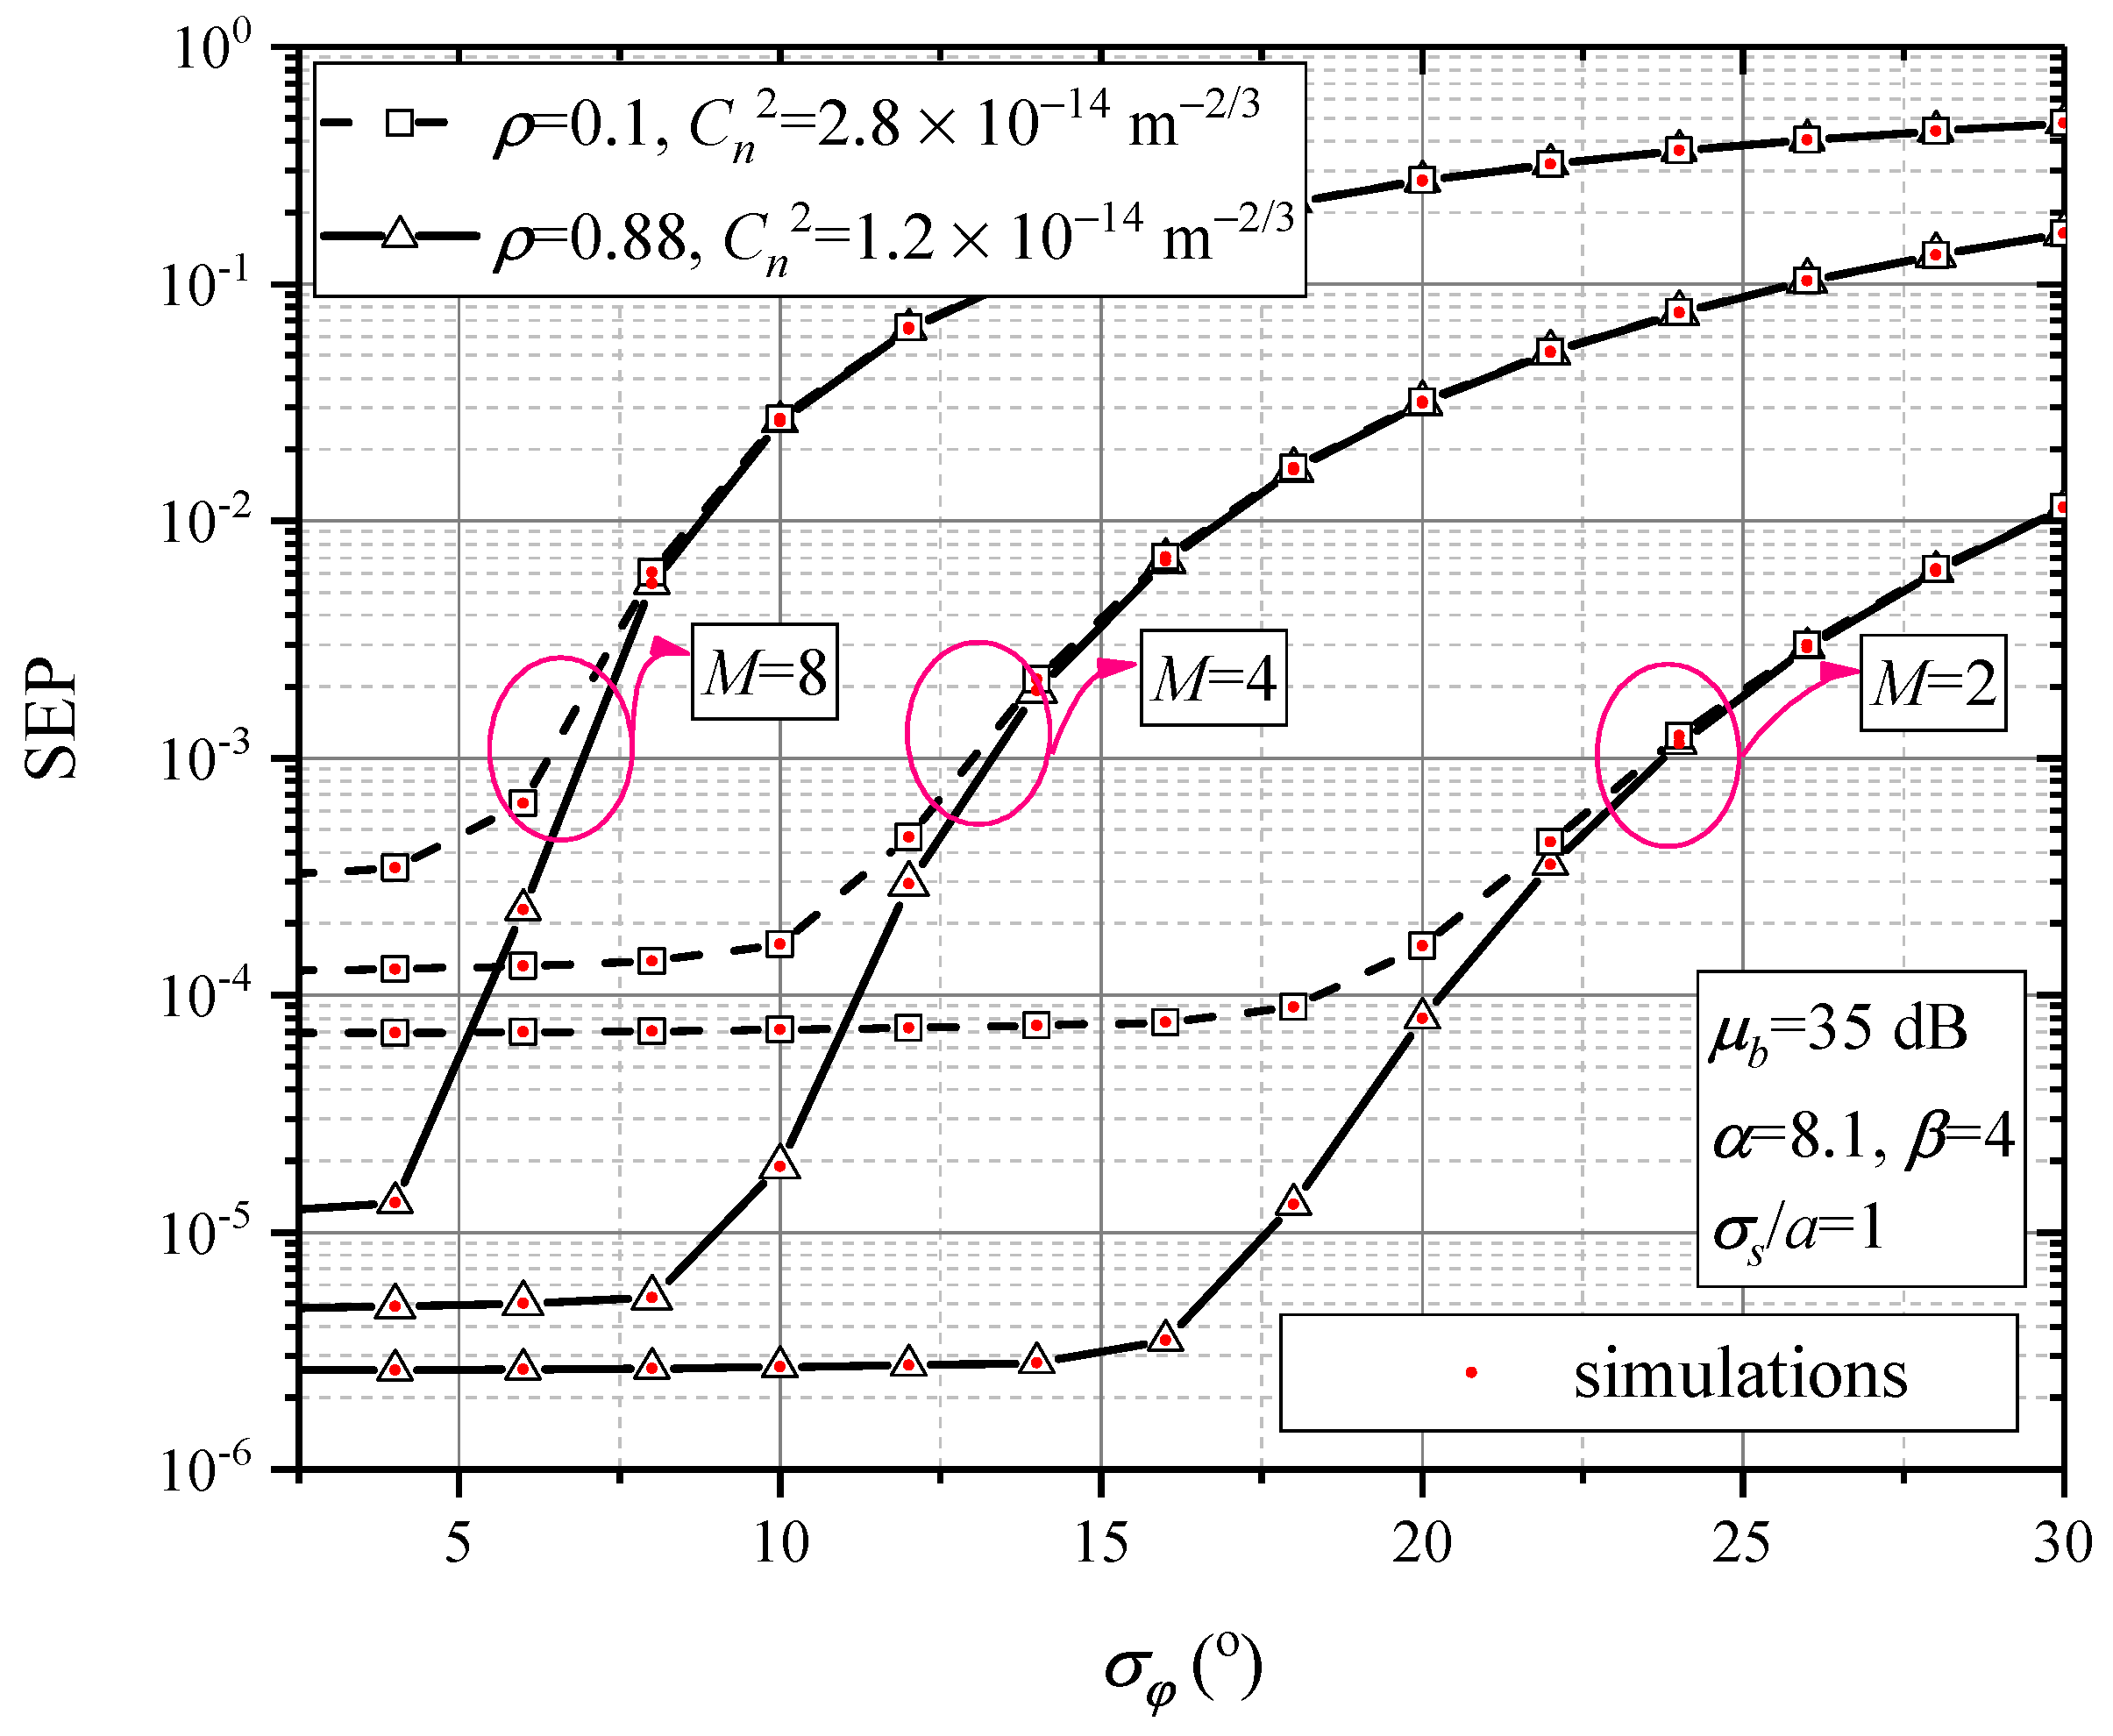
4. Numerical Results

Based on the convergence analysis presented in Section 3.3 ((31) and (32)) for a given value of the upper limit of the truncation error, we determine the number of terms N ( | E N | q N + 1 ) in the sum for the symbol error probability given by (22) (or (20) in the case of perfect compensation of phase error). Furthermore, the value of SEP is estimated by using (22), i.e., (20), in combination with (18), i.e., (8). The basic parameters influencing the error rate system performance are: turbulence strength parameters ( C n 2 , α , β , ρ ) and standard deviation ( σ s ) of pointing error (related to misalignment between transmitter laser and receiver photodiode), signal-to-noise ratio per bit ( μ b ), wavelength of light ( λ ) and modulation order (M), as well as the standard deviation of phase noise ( σ φ ). For obtaining numerical results, we use values of parameters from experimental measurements [9]. The Rytov variance determines the intensity of atmospheric turbulence, with the wavelength λ = 785 nm and the FSO link distance L = 1 km. The pointing errors effect is described by the jitter standard deviation, σ s . The radius of a circular detector aperture is a = 5 cm, the beam radius at the waist is a 0 = 5 cm, and the radius of curvature takes a value F 0 = 10 . Normalized average optical power of the FSO hop is Ω + 2 b 0 = 1 . All numerical results are confirmed by independent Monte Carlo simulations.
Figure 2 represents the average SEP dependence on the average SNR per bit assuming different values of phase noise standard deviation. SEP decreases with increasing μ b , but only in the range of medium values of μ b . In the region of large values of μ b , SEP tends to a constant value called the SEP floor. This SEP floor cannot be reduced by neither increasing the signal power, nor by improving the channel conditions, but depends only on the phase noise standard deviation. Furthermore, we observe the SEP dependence on a different amount of scattering power coupled to the LOS. A higher value of ρ means that the power of scattered component by off-axis eddies is smaller. Since the presented results are obtained for the same value of the Rytov variance [9], the scattering component by off-axis eddies will have a crucial impact on the system performance. The results show that a larger value of the parameter ρ improves the system performance. It is expected because, when the value of parameter ρ tends to one, the whole amount of scattering components power belongs to that scattering component coupled to an LOS component, and there is not a component scattered by offline eddies. In the case of ρ = 1 , the SEP performance is the best possible, since the power of C G S equals zero (the total received optical power is equal to the sum of the power of an LOS component and power of a scattered component coupled to an LOS component, while the component C G S scattered by the off-axis does not exist). Additionally, it can be observed that the amount of the scattering components has a stronger impact on the average SEP when the FSO receiver is affected by weaker phase noise, i.e., for lower values of σ φ . When hardware imperfections are more pronounced, the effect of the FSO channel conditions on the SEP is minor.
Figure 3 shows the dependence of the bit error probability on the signal-to-noise ratio per bit when detecting 16PSK signals. It should be noted that BER decreases with increasing SNR in the area of low and medium SNR values. However, for high SNR values, i.e., when the signal power is higher, the BER dependencies enter saturation. When BER curve reaches saturation, i.e., when the floor is reached, it no longer makes sense to increase the signal power because the performance is not improved. The value of this floor is affected only by the standard deviation of the phase noise. The higher it is, the lower the value of the floor. It should be noted that even very small changes in the standard deviation can significantly change the value of the floor. For example, if the standard deviation is increased from 2.5 degrees to 3 degrees, the floor increases by more than one order of magnitude. It is very important to notice the SNR area when the floor is reached, and it is even more important to estimate this floor. The red lines show the floor values, which are estimated based on the derived formula (40). The same figure also shows the dependence of BER on SNR when there is no phase noise, i.e., when the phase error compensation in the receiver is perfect. This dependence is shown in blue. It should be noted that this dependence is essentially different compared with a case when there is a phase noise in the receiver. Namely, in this case, BER decreases monotonically for all SNR values, i.e., there is no occurrence of floor. Based on this, it can be concluded that the influence of the phase noise is of essential importance in coherent FSO systems and that this phenomenon should be given special attention when designing the receiver.
Figure 4 aims to show the influence of the pointing errors on the SEP for different degrees of hardware imperfections. The influence of the phase noise is actually defined by the value of the standard deviation ( σ φ ) of the phase noise. The higher this value is, the stronger is the influence of the phase noise. Similarly, the impact of misalignment is defined by the value of the standard deviation ( σ s ) of pointing errors. The higher its value is, the more pronounced is the misalignment. When σ φ = 8 0 , then the SEP is insensitive to the increase in the σ s up to 0.125 m. In the case when σ φ = 12 0 , the SEP is insensitive to pointing errors as long as the σ s is less than 0.2 m. Therefore, the influence of pointing errors is stronger in conditions when the phase noise is weaker.
The average SEP dependence on the phase noise standard deviation for different values of modulation order is shown in Figure 5. Numerical results are obtained for different atmospheric turbulence conditions based on the values of the parameters given in ([9], Table I). The results show that the BPSK format is insensitive to the phase noise as long as the σ φ is less than 16 degrees, while the QPSK becomes sensitive already when the σ φ is 8 degrees, while in the case of applying the 8PSK format, the SEP begins to increase significantly already for a σ φ value of 2.5 degrees. In addition, the effect of phase noise on SEP values is stronger when atmospheric turbulence is weaker ( C n 2 is lower). In other words, when C n 2 is lower, the SEP begins increasing at a lower value of σ φ .
The numerical results illustrate that developed mathematical framework allows us to connect the required error rate performance of the system with the modulation order and parameters of the receiver under given channel conditions. Our work should not be understood only as performance analysis, but we also contribute to the design of such systems. For given conditions over the FSO channel, from the condition that a certain SEP value should be reached, it is possible to estimate the maximum value of the standard deviation of the phase noise for which this will be achieved. This value of the standard deviation of the phase noise plays a very important role in receiver design. More precisely, this information is important in the design of the phase-locked loop circuit whose role is to compensate the phase error that occurs in the coherent receiver when the incoming optical signal and the local laser signal are mixed.

5. Conclusions

We have analyzed the performance of a coherent FSO system when turbulence is modeled by general Málaga ( M ) distribution including misalignment fading. Taking into account the imperfect compensation of the phase error that occurs in the coherent receiver when mixing the optical signal and the signal of the local laser, we have derived an analytical expression for the error probability in detecting multilevel PSK signals.
The results have shown that turbulence conditions significantly affect the SEP in the range of mean SNR values. The influence of pointing errors is stronger when the phase noise is weaker, i.e., when the standard deviation of the phase noise is smaller. In the case of applying higher-order modulation, the receiver becomes significantly less tolerant to the influence of the phase noise. For example, in the case of 8PSK, there is already a significant deterioration of the SEP when standard deviation of phase noise is around 2.5 degrees, while BPSK modulation format is insensitive for values of phase noise standard deviation even up to 16 degrees. The results have also illustrated that the effect of phase noise on SEP values is stronger when atmospheric turbulence is weaker.
The results show that the phase noise causes the appearance of a floor, which only depends on the standard deviation of the phase noise, and not on the signal power and turbulence conditions over the channel. The higher the standard deviation of phase noise is, the lower the value of the floor. For example, in the case of 16PSK transmission, increasing of standard deviation of phase noise from 2.5 degrees to 3 degrees will cause the BER floor to increase by more than one order of magnitude.
The results presented here show that SEP floor cannot be decreased by increasing the signal power. In our further work, we will design quasi-cyclic low-density parity-check codes to downscale this SEP floor. Our aim will be to examine if those powerful error correction codes have error floors under given scenarios.

Author Contributions

Conceptualization, G.T.Đ.; methodology, G.T.Đ., M.P., G.V.M., Z.M., J.M.; software, M.P., G.T.Đ.; validation, G.T.Đ., M.P., G.V.M., Z.M., J.M.; formal analysis, M.P., G.T.Đ., G.V.M.; investigation, G.T.Đ., M.P., G.V.M., Z.M., J.M.; resources, G.T.Đ, M.P.; data curation, G.T.Đ.; writing—original draft preparation, G.T.Đ., M.P., G.V.M.; writing—review and editing, G.T.Đ., G.V.M.; visualization, M.P., G.T.Đ.; supervision, G.T.Đ., G.V.M.; project administration, G.T.Đ.; funding acquisition, Z.M. All authors have read and agreed to the published version of the manuscript.

Funding

The work of M. I. Petkovic has received funding from the European Union Horizon 2020 research and innovation program under Grant No. 856967. The work of G. T. Đorđević and J. Makal are supported by the Polish National Agency for Academic Exchange (NAWA) under Grant No. PPN/ULM/2020/1/00256. A part of paper was also supported by the Science Fund of the Republic of Serbia under grant no. 7750284 (hi-STAR), and by the Ministry of Education, Science and Technological Development of the Republic of Serbia. This publication was based upon work from COST Action NEWFOCUS CA19111, supported by COST (European Cooperation in Science and Technology).

Institutional Review Board Statement

Not applicable.

Informed Consent Statement

Not applicable.

Data Availability Statement

Not applicable.

Acknowledgments

The authors would like to thank five reviewers for their helpful comments that significantly improved the initial version of the paper. G. T. Đorđević would like to thank D. Milić. for discussions during the preparation of the second version of the manuscript.

Conflicts of Interest

The authors declare no conflict of interest.

Abbreviations

The following abbreviations are used in this manuscript:
5GFifth generation
BERBit error rate
FSOFree-space optics
FSMFourier series method
IM/DDIntensity modulation with direct detection
LOLocal oscillator
LOSLine-of-sight
mmWaveMillimeter wave
MPSKMultilevel phase-shift keying
PDFProbability density function
PLLPhase-locked loop
SEPSymbol error probability
SIMSubcarrier intensity modulation

References

  1. Ericson Mobility Report. Available online: https://www.ericsson.com/en/reports-and-papers/mobility-report/reports/june-2022 (accessed on 5 October 2022).
  2. Iffat Naqvi, S.; Hussain, N.; Iqbal, A.; Rahman, M.; Forsat, M.; Mirjavadi, S.S.; Amin, Y. Integrated LTE and millimeter-wave 5G MIMO antenna system for 4G/5G wireless terminals. Sensors 2020, 20, 3926. [Google Scholar] [CrossRef]
  3. Trigui, I.; Diamantoulakis, P.D.; Affes, S.; Karagiannidis, G.K. Shadowed FSO/mmWave systems with interference. IEEE Trans. Commun. 2019, 67, 6256–6267. [Google Scholar] [CrossRef] [Green Version]
  4. Borges, R.M.; de Souza Lopes, C.H.; Lima, E.S.; de Oliveira, M.A.; Cunha, M.S.B.; Alexandre, L.C.; da Silva, L.G.; Pereira, L.A.M.; Spadoti, D.H.; Romero, M.A.; et al. Integrating optical and wireless techniques towards novel fronthaul and access architectures in a 5G NR framework. Appl. Sci. 2021, 11, 5048. [Google Scholar] [CrossRef]
  5. Ghassemlooy, Z.; Popoola, W.; Rajbhandari, S. Optical Wireless Communications: System and Channel Modelling with MATLAB, 2nd ed.; CRC Press: Boca Raton, FL, USA, 2018. [Google Scholar]
  6. Khalighi, M.A.; Uysal, M. Survey on free space optical communication: A communication theory perspective. IEEE Trans. Commun. 2014, 16, 2231–2258. [Google Scholar] [CrossRef]
  7. Andrews, L.; Philips, L. Laser Beam Propagation through Random Media; SPIE: Bellingham, WA, USA, 2005. [Google Scholar]
  8. Stefanovic, C.; Morales-Céspedes, M.; Armada, A.G. Performance analysis of RIS-assisted FSO communications over Fisher-Snedecor F turbulence channels. Appl. Sci. 2021, 11, 10149. [Google Scholar] [CrossRef]
  9. López-González, F.J.; Garrido-Balsells, J.M.; Jurado-Navas, A.; Castillo-Vázquez, M.; Puerta-Notario, A. Performance evaluation of atmospheric optical communications links by generalized Málaga turbulence model. Wirel. Pers. Commun. 2017, 95, 557–567. [Google Scholar] [CrossRef]
  10. Jurado-Navas, A.; Garrido-Balsells, J.M.; Paris, J.F.; Castilo-Vazquez, M.; Puerta-Notario, A.A. Impact of pointing errors on the performance of generalized atmospheric optical channels. Opt. Express. 2012, 20, 12550–12562. [Google Scholar] [CrossRef]
  11. Androutsos, N.A.; Nistazakis, H.E.; Stassinakis, A.N.; Sandalidis, H.G.; Tombras, G.S. Performance of SIMO FSO links over Mixture composite irradiance channels. Appl. Sci. 2019, 9, 2072. [Google Scholar] [CrossRef] [Green Version]
  12. Sandalidis, H.G.; Chatzidiamantis, N.D.; Karagianidis, G.K. A tractable model for turbulence and misalignement-induced fading in optical wireless systems. IEEE Comm. Lett. 2016, 20, 1904–1907. [Google Scholar]
  13. Farid, A.A.; Hranilovic, S. Outage capacity optimization for free space optical links with pointing errors. J. Light. Technol. 2007, 25, 1702–1710. [Google Scholar] [CrossRef] [Green Version]
  14. Farid, A.A.; Hranilovic, S. Outage capacity for MISO intensity modulated free-space optical links with misalignment. IEEE/OSA J. Opt. Commun. Netw. 2011, 3, 780–789. [Google Scholar] [CrossRef]
  15. Petkovic, M.I.; Djordjevic, G.T. SEP analysis of FSO system employing SIM-MPSK with noisy phase reference. In Proceedings of the 2015 4th International Workshop on Optical Wireless Communications (IWOW), Istanbul, Turkey, 7–8 September 2015; pp. 46–50. [Google Scholar]
  16. Song, X.; Yang, F.; Cheng, J.; Al-Dhahir, N. Asymptotic noisy reference Losses of subcarrier BPSK and QPSK systems in lognormal fading. In Proceedings of the 2015 International Conference on Computing. Networking and Communications (ICNC), Workshop on Computing, Networking and Communications (CNC), Garden Grove, CA, USA, 16–19 February 2015; pp. 352–356. [Google Scholar]
  17. Song, X.; Yang, F.; Cheng, J.; Al-Dhahir, N.; Xu, Z. Subcarrier phase-shift keying systems with phase errors in lognormal turbulence channels. J. Light. Techn. 2015, 33, 1896–1904. [Google Scholar] [CrossRef]
  18. Gappmair, W.; Nistazakis, H.E. Subcarrier PSK performance in terrestrial FSO links impaired by Gamma–Gamma fading, pointing errors, and phase noise. J. Light. Technol. 2017, 35, 1624–1632. [Google Scholar] [CrossRef]
  19. Varrotsos, G.K.; Nistazakis, H.E.; Gappmair, W.; Sandalidis, H.G.; Tombras, G.S. SIMO subcarrier PSK FSO links with phase noise and non-zero boresight pointing errors over turbulence channels. IET Commun. 2019, 13, 831–836. [Google Scholar] [CrossRef]
  20. Varotsos, G.K.; Nistazakis, H.E.; Gappmair, W.; Sandalidis, H.G.; Tombras, G.S. DF relayed subcarrier FSO links over Malaga turbulence channels with phase noise and non-zero boresight pointing errors. Appl. Sci. 2018, 8, 664. [Google Scholar] [CrossRef] [Green Version]
  21. Petkovic, M.I.; Djordjevic, G.T.; Karagiannidis, G.K.; Milovanović, G.V. Performance of SIM-MDPSK FSO systems with hardware imperfections. IEEE Trans. Wirel. Commun. 2017, 16, 5442–5451. [Google Scholar] [CrossRef]
  22. Djordjevic, G.T.; Milic, D.M.; Radojkovic, I.D. Performance of free-space optical systems in the presence of receiver imperfections. Iop Conf. Ser. Mater. Sci. Eng. 2021, 1032, 012002. [Google Scholar] [CrossRef]
  23. Niu, M.; Cheng, J.; Holzman, J.F. Error rate performance comparison of coherent and subcarrier intensity modulated optical wireless communications. J. Opt. Commun. Netw. 2013, 5, 554–564. [Google Scholar] [CrossRef]
  24. Aboelala, O.; Lee, I.E.; Chung, G.C. A Survey of hybrid free space optics (FSO) communication. Entropy. 2022, 24, 1573. [Google Scholar] [CrossRef]
  25. Gu, Z.; Zhang, J.; Ji, Y.; Bai, L.; Sun, X. Network topology reconfiguration for FSO-based fronthaul/backhaul in 5G+ wireless networks. IEEE Access 2018, 6, 69426–69437. [Google Scholar] [CrossRef]
  26. Zhou, H.; Xie, W.; Zhang, L.; Bai, Y.; Wei, W.; Dong, Y. Performance analysis of FSO coherent BPSK systems over Rician turbulence channel with pointing errors. Optics Express 2019, 27, 27062–27075. [Google Scholar] [CrossRef] [PubMed]
  27. Networks to Achieve 5G Connectivity for Backhauling Coherent Free Space Optics for Ground and Space Applications. 20 October 2022. Available online: https://effectphotonics.com/points-of-view/coherent-free-space-optics-for-ground-and-space-applications/ (accessed on 5 October 2022).
  28. Niu, M.; Cheng, J.; Holzman, J.F. Error rate analysis of M-ary coherent free-space optical communication systems with K-Distributed turbulence. IEEE Trans. Commun. 2011, 59, 664–668. [Google Scholar] [CrossRef]
  29. Niu, M.; Cheng, J.; Holzman, J.F. Terrestrial Coherent Free-Space Optical Communication Systems; Das, N., Ed.; IntechOpen: London, UK, 2012; Available online: https://www.intechopen.com/books/optical-communication/terrestrial-coherent-free-space-optical-communication-systems (accessed on 3 October 2012). [CrossRef] [Green Version]
  30. Niu, M.; Schlenker, J.; Cheng, J.; Holzman, J.F.; Schober, R. Coherent wireless optical communications with predetection and postdetection EGC over Gamma–Gamma atmospheric turbulence channels. J. Opt. Commun. Netrw. 2011, 3, 860–869. [Google Scholar] [CrossRef]
  31. Ansari, I.S.; Yilmaz, F.; Alouini, M.S. Performance analysis of freespace /optical links Over Málaga (M) turbulence channels with pointing errors. IEEE Trans. Wireless Commun. 2016, 15, 91–102. [Google Scholar] [CrossRef] [Green Version]
  32. Kostic, I. Average SEP for M-ary CPSK with noisy phase reference in Nakagami fading and Gaussian noise. Eur. Trans. Telecommun. 2007, 18, 109–113. [Google Scholar] [CrossRef]
  33. Gradshteyn, I.S.; Ryzhik, I.M. Table of Integrals, Series, and Products, 6th ed.; Academic Press: New York, NY, USA, 2000. [Google Scholar]
  34. The Wolfrarm Functions Site. 2008. Available online: http://functions.wolfram.com (accessed on 5 October 2022).
  35. Proakis, J. Digital Communications, 4th ed.; McGraw- Hill, Inc.: New York, NY, USA, 2001. [Google Scholar]
  36. Milovanović, G.V. Numerical Analysis, Part I; University of Niš: Niš, Serbia, 1979. [Google Scholar]
  37. Parmer, R.K.; Milovanović, G.V.; Pogány, T.K. Extension of Mathieu series and alternating Matheieu series involving the Neumann function Yn. Period. Math. Hung. 2022, 1–19. [Google Scholar] [CrossRef]
Figure 1. Model of the system.
Mathematics 11 00121 g001
Figure 2. Average SEP vs. average SNR per bit.
Mathematics 11 00121 g002
Figure 3. Average BER vs. average SNR per bit.
Mathematics 11 00121 g003
Figure 4. Average SEP vs. standard deviation of the pointing errors.
Mathematics 11 00121 g004
Figure 5. Average SEP vs. standard deviation of the phase noise.
Mathematics 11 00121 g005
Disclaimer/Publisher’s Note: The statements, opinions and data contained in all publications are solely those of the individual author(s) and contributor(s) and not of MDPI and/or the editor(s). MDPI and/or the editor(s) disclaim responsibility for any injury to people or property resulting from any ideas, methods, instructions or products referred to in the content.

