1. Introduction
Humanitarian organizations devote their best efforts to helping vulnerable people improve their situation, fighting against poverty, inequality, and discrimination [
1]. Access to water, food, medical supplies, and other products are among the immediate needs of vulnerable communities, constituting the primary goal of foodbanks. Food banking systems obtain surplus food and distribute it to the people in need, involving all society sectors such as civil, governments, and businesses in the process. Foodbanks acquire donated food that in most of the cases would otherwise be spoiled, usually from farms, manufacturers, distributors, retail stores, consumers, and other sources, to make it available to people in need [
2].
Foodbank networks offer adequate logistics to provide food sources to people in need on a day-to-day basis through a network of community agencies such as school feeding programs, homeless shelters, soup kitchens, after-school programs, and other non-profit programs that support people in need. Furthermore, one of the most important goals of a foodbank is to provide an acceptable nutritional status to the population in need [
3]. Indeed, having “something to eat” is not sustainable or sufficient to prevent malnutrition [
4]. The ability to offer people a balanced proportion of macronutrients and micronutrients has been shown to have a major impact on the vulnerability of individuals and entire populations facing diseases and health risks [
5]. Foodbanks must, therefore, manage the diversity of surplus food provided by donors to achieve “balanced” deliveries to the population, in order to align with the Sustainable Development Goals for 2030 identified by the United Nations [
6].
Conceived to mitigate the continuous needs of a given population, these networks must be reconfigured upon the arrival of sudden events, such as natural or man-made disasters, that provoke sudden variations, both in the demand (for example, the number and the needs of the affected population) and the supply (for example, the number of donors and the quantities they supply). This inbound part of the supply chain, which has received limited attention in the humanitarian logistics literature, is the key to improving effectiveness in the case of foodbanks, therefore increasing their ability to better satisfy the needs of the affected population, as well as to do so in a timely manner.
In this context where food banks must quickly reorganize their logistics—which are designed for day-to-day operations—to cope with the humanitarian consequences of a natural disaster, the contributions of this paper are twofold. First, it proposes a mathematical formulation that spans the entire supply chain (from donors to communities) to solve the logistic planning problem. Then, it empirically compares multiple network reconfiguration strategies to shed some light on how the food banks should reorganize their responsibilities with respect to the day-to-day model, and to identify specific decisions that should be prioritized to achieve the highest performance in terms of satisfaction of the affected people’s demand and balance of delivered food. To ground the analysis on a real-world logistic network configuration and its requirements, we consider the case of Bancos de Alimentos de México (BAMX), a foodbank network in Mexico.
The remainder of this paper is structured as follows:
Section 2 discusses relevant studies in the recent literature devoted to humanitarian aid distribution with emphasis on papers related to food bank operations.
Section 3 presents BAMX, describes its day-to-day operations, and details how these operations would be challenged in the case of a sudden humanitarian crisis.
Section 4 proposes a mathematical model for BAMX’s logistics.
Section 5 describes the experimental design used to compare the different network configurations.
Section 6 presents the results, where the impacts of the distinct reconfiguration decisions are assessed.
Section 7 discusses the managerial insights obtained from the results. Finally,
Section 8 presents the conclusions, as well as some future research.
2. Literature Review
The food distribution modeling literature is extensive [
7,
8], although most of it is dominated by studies focused on for-profit organizations; comparatively, little work has considered non-profit food distribution networks [
9]. Contrarily to the profit case, where networks are optimized with respect to cost or food travel time, non-profit operations seek objectives such as equity [
10]. This section contains two parts. The first part reviews the notion of fairness in distribution, whereas the second part focuses on food banks operations and the alternative distribution structures proposed in the literature.
Equity or fairness is one of the major decision-making issues in humanitarian operations. The theoretical notion of fairness in humanitarian aid distribution has recently been discussed, and there is still no universal agreement on a definition or metric. Sengul Orgut et al. [
11] have stated that equity has two dimensions in the food distribution network context: quantity received per person and quality (or type) of the food received.
Quantity seems to be the prime aspect when addressing relief distribution and its success. Review papers have claimed that most studies tackle the problems of equity in distribution using fairness constraints [
12,
13,
14,
15]. Anaya-Arenas et al. [
16] have discussed the importance of fairness in relief distribution and how it can be defined. Sengul Orgut et al. [
17] have presented two robust optimization models focused on the equitable and effective distribution of donated food over a foodbank’s service area, considering only the bank-to-community section of the network. The first model allowed the demand point capacities to vary over given ranges, to control the tradeoff between the total amount of food distributed and the robustness of the solution concerning the capacity variations. The second model controlled the overall equity in the system while seeking to maximize the total amount of food shipped. Their results showed that by sacrificing equity at certain locations that may generate a bottleneck in the network, they can considerably increase the total distribution, while most demand points continue to receive food equitably.
Papers dealing with the quality of the distributed food must incorporate multiple types of products and their characteristics [
18,
19,
20]. Ross, Campbell, and Webb [
21] have conducted a survey of 137 foodbanks and concluded that the quality of the distributed food (such as the nutritious value) needs to be improved, which justifies food banks efforts to limit the donation of unhealthy food while minimizing the negative effects on the quantity of the total donated foods [
22,
23]. For instance, Gómez-Pantoja et al. [
20] have proposed a model for the foodbank resource allocation problem which considers inventory management, product–beneficiary compatibilities, and balanced nutrition in terms of calorie consumption. In summary, food banks are more and more concerned by the attributes of the food they deliver, stressing the need for models able to separate products into categories according to their respective contributions to the individual needs.
If we focus now on the transportation facet of aid distribution, many optimization models have been suggested to improve transportation planning in humanitarian logistics, especially during the last 20 years. Leiras [
24], Anaya-Arenas et al. [
13], and Yáñez-Sandivari et al. [
25] have reviewed 228, 500, and 178 articles related to relief distribution networks, respectively. These studies pointed out that most of the proposed models remain theoretical, with less than 15% of them being tested on real data [
24]. These reviews show that most studies have focused on two areas: network design (see, for example, [
26,
27,
28]) and delivery routing problems (see, for example, [
29,
30]). They also indicated that limited research had been devoted to the upstream part of the humanitarian supply chains, an area that is central to our work. The material convergence problem becomes even more challenging in the case of a decentralized organization such as BAMX, where each bank in the network operates with a high level of autonomy and, in practice, decides the resources it is willing to engage to support other banks in the network. Whereas the literature from the cooperation perspective of vertical logistics is quite extensive [
31,
32,
33,
34], academic research on horizontal cooperation in logistics remains limited, especially in terms of humanitarian logistics [
25].
As is the case in humanitarian logistics, most of the research concerning food banks has focused on their operations, proposing various models that reflect alternative distribution structures. A recent review on decision support models for managing food aid supply chains (Mahmoudi et al. [
35]) has concluded that most studies only consider the resource allocation or transportation between two tiers of the food aid supply chain (for example, between donors and food banks), whereas very few of them have explored this problem as a whole, as it is the case of our paper. In addition, none of the works studied contemplates transshipment between the banks. In the next paragraphs, we have grouped relevant papers into four categories according to the structure of the distribution network they propose.
Resource allocation problems (RAP). The aim is to plan the allocation of supplies among communities or charities over a period or a set of periods. In most of the cases, the problem seeks to maximize the utility of the delivered food. Sengul Orgut et al. [
11] considered the allocation of available donations to charities over one month as a single period problem. Sengul et al. [
17] extended the previous problem to incorporate variability on the charity capacities. These works do not handle donations that are assumed to be available at banks and consider food as a single commodity. Gómez-Pantoja et al. [
20] also dealt with a resource allocation problem, but they modeled food demand in a more detailed manner. Indeed, they considered product-beneficiary compatibilities, balanced nutrition, and priority of beneficiaries to decide who will be served, what kind of products, and how many of them will be supplied. Alkaabneh et al. [
19] addressed a similar food allocation model where supply is uncertain, so the models’ objective is to maximize the expected utility of charities. However, all of the resource allocation problems adopt a rather strategic perspective and they do not consider the transportation of the food.
Location-routing problems (LRP). They seek to simultaneously determine (1) the location of intermediate food distribution points (FDP) where charities or people in need travel to grab the food, and (2) the routes that, starting at the bank’s warehouse, visit food collection points (donors) and FDP’s. Naji-Azimi et al. [
36] and Boostani et al. [
37] proposed Location-Routing problems seeking to locate satellite distribution centers in the context of humanitarian logistics. Concerning food banks, Davis et al. [
38] studied a version of the Location-Routing problem where the objective is to minimize the number of FDPs and transportation costs. Similar situations were presented in Solak et al. [
39] and in Reihaneh et al. [
40], but they proposed different solution approaches. All of the mentioned location-routing works consider food as a single commodity.
Sequential Resource Allocation (SAR) problems. This family of problems also aims to build routes mixing collection and distribution of food in such a way that it is required to set the quantity of food to collect (usually at the first or the firsts stops) and the quantity to deliver at the charities or communities. Gunes et al. [
41] studied a deterministic version of this problem and proposed various approaches to model it. Lien et al. [
9] and Balcik et al. [
42] addressed versions of a SAR where the demand at each delivery point is not known in advance, the challenge of the problem is therefore to decide the amount of food to be left at each delivery stop in order to minimize the wasted (unused) food at the time that equity is maximized. A similar context is presented in Eisenhandler and Tzur [
43] and Eisenhandler and Tzur [
44], where the food bank decides which charities to visit, in what order, and how much to pick up or distribute to each donor or charity. The SAR has been extended to multiple periods in the so-called food rescue problem (FRP). The FRP is a multi-period problem where food suppliers and charities are chosen in order to form routes that meet the required service levels in such a way that the total transportation cost is minimized and operational constraints are satisfied [
45,
46]. The routes depart from a depot, collect food from suppliers, and deliver it to charities before returning to the depot.
Location-routing and SAR problems are based on mixed-routes that visit donors and distribution points or charities. Therefore, they are appropriate for modelling situations where donors and charities are geographically close. To cope with situations where the geographical scope of the problem covers a whole region or even a country, food banks often adopt structures inspired by two-stage distribution networks, the first stage encompassing collection and transportation of food to banks, and the second stage the distribution of food to charities or communities.
Two-stage Supply Chain problems. Horne and Downs [
26] proposed a 2-echelon relief distribution network where aid travels from a warehouse to points of distribution (POD) or break-of-bulk points (BOB) to which people in need (or agencies) travel to grab the aid. Martins et al. [
47] is probably the closest work to ours. They considered a multi-period, multi-echelon food bank supply chain network for the collection of food donations and their distribution to charitable agencies. Contrarily to our problem, Martins et al. [
47] did not consider transportation of food to communities. Indeed, charities travel and collect food at their designated food bank on specific days. Moreover, in Martins et al. [
47], the donors to banks assignments are given and cannot be modified. Furthermore, although they considered several families of products to distribute, they are handled independently because transportation and storage capacities at banks are dedicated to each family of products. From a transportation standpoint, that means that a donor offering products of two families should be visited for collection two times or by different means.
Table 1 reports the main attributes of the reviewed works, including the type of distribution network they propose, the manner in which they model food (single or multiple commodity), the constraints they consider concerning the execution time, and lastly, the nature of the objective to optimize (F = equity, E = efficiency, T = transportation cost, A = access cost for charities to deliver, U = utility of the food delivered, W = waste, S = a multicriteria function encompassing the three aspects of sustainability).
Table 1 shows that, to the best of our knowledge, no previous work simultaneously encompasses decisions on both stages of the food banks supply chain, including food transshipments between banks. Furthermore, Horne and Downs [
26] consider a single donor (the warehouse) and a single commodity, for which there is no limitation on the supply. Therefore, food transshipment between PODs or BOBs is not necessary. As Martins et al. [
47], our paper considers multiple nutritional products but, as will be shown later, we intend to achieve this by imposing a restriction limiting the proportion of each type of product in the delivered food. This restriction is used by BAMX to deliver a balanced proportion of macronutrients and micronutrients to prevent malnutrition. Finally, it is worth mentioning that our problem is different from all of the papers reviewed in at least 1 of the following aspects: (1) we consider an urgent situation where operations must be achieved within a target deadline or makespan, and (2) we do not only seek a solution to a problem, but to assess the impact that the decisions taken at each stage of the supply chain (for example, assignment of donors to banks, food transshipment between banks, and assignment of communities to banks) have on the total performance of the network.
3. Problem Description
Bancos de Alimentos de México (BAMX) is a Mexican non-profit civil organization, member, and co-founder of the Global FoodBanking Network (GFN). BAMX is the only foodbank network in México and the second largest in the world, federating more than 50 foodbanks distributed across the country. BAMX is focused on rescuing food that would otherwise be spoiled at manufacturing plants, farms, supermarkets, restaurants, and hotels, with the aim of fighting hunger. Over 25,000 people staff the network, 90% of whom are volunteers. BAMX supported more than 1.137 million Mexicans in 2018 [
48].
On a day-to-day basis, BAMX works in a decentralized manner. Donors, the start of the BAMX supply chain, are assigned to specific banks, and each bank covers the needs of a geographical region. Donor-to-bank assignments are made according to their distance, the demand for the donor’s products within the area covered by the bank, and the bank’s logistic capabilities. The bank processes the donor’s products by validating them and returning reports and acknowledgments of the goods they have received to the donor. Each bank, which is responsible for a demand region, organizes and coordinates deliveries to individuals in need in relevant communities. Additionally, it produces forecasts of its region’s needs and receives a budget from the headquarters to ensure its operations. As manpower is mostly provided by volunteers, the budget is basically devoted to logistics expenses (for example, warehouses, truck hire, fuel). However, as the volume and the nature of the products supplied by each donor vary greatly, it is almost impossible to achieve a donor-to-bank assignment that perfectly matches the supply and demand. Moreover, as BAMX seeks to deliver a balanced proportion of macronutrients and micronutrients to prevent malnutrition, lateral transshipments between banks may need to be organized to achieve the right quantity and mixture of products required by each community. The receiving bank bears the cost of such transshipments within their operating budget.
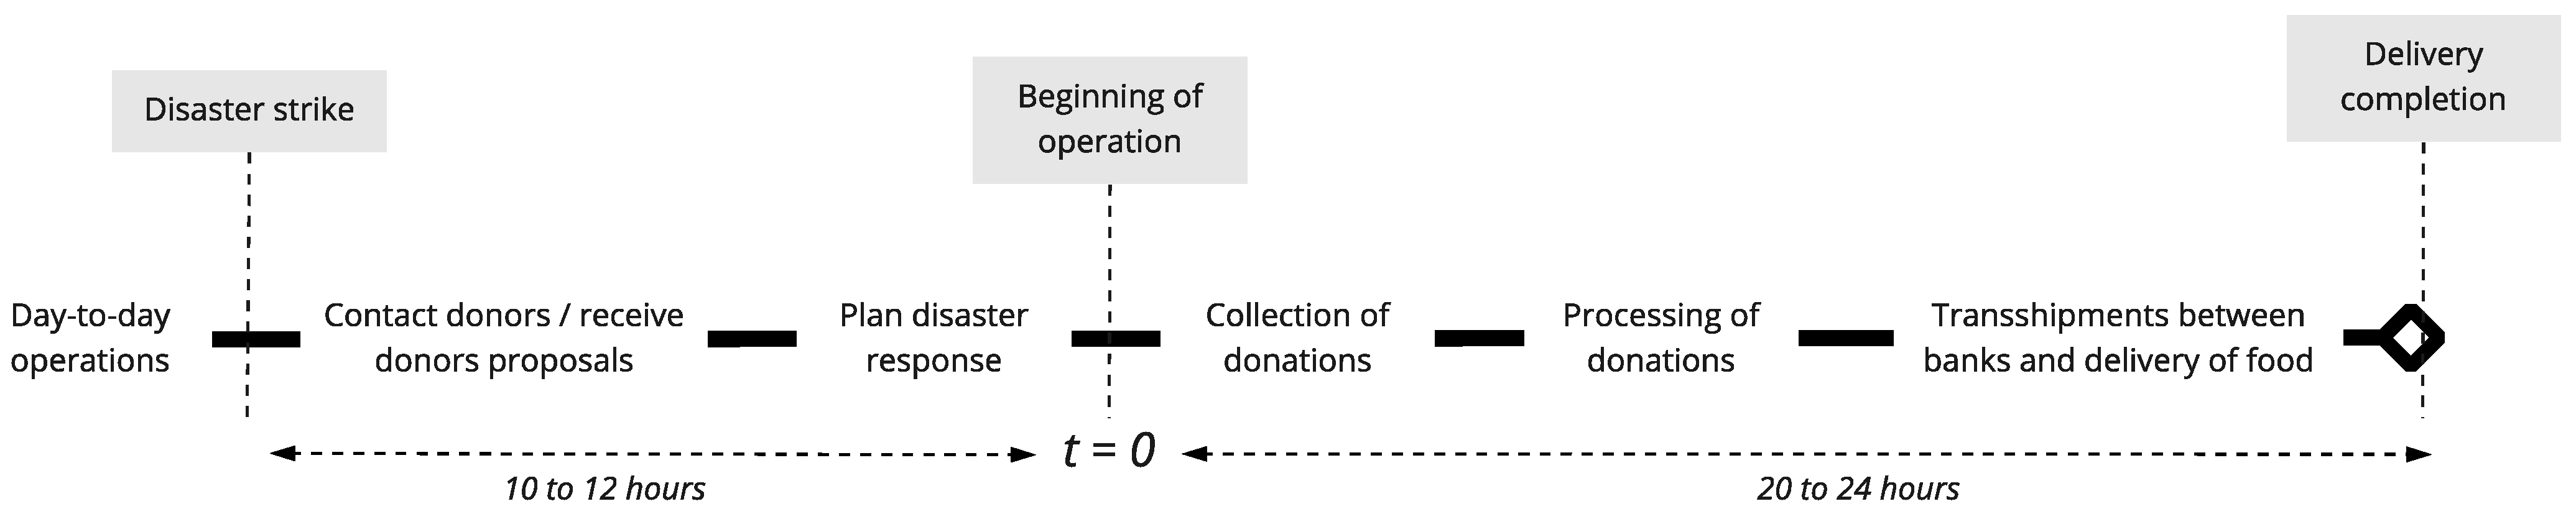
However, on the arrival of a sudden man-made or natural disaster such as floods provoked by a hurricane strike or an earthquake, food banks must adapt their day-to-day operations to cope with the event’s consequences, which can last from several days up to a few weeks. During that period, the needs in the affected region rapidly increase so that the capacity of the local bank in charge of the area exceeds. On the other end of the supply chain, solidarity and generosity typically cause the number and volume of donations to grow very quickly, which leads to several managerial challenges, as (1) the donors may be outside of the affected region and scattered across the whole country; (2) new donors that have never collaborated with BAMX need to be assigned to a specific bank; (3) the growing number of donations may exceed the bank’s capacities, in terms of transportation, storage, or handling resources; and (4) products donated by new donors to a bank, or the extra quantities from regular donors, may or may not fit the nutritional restrictions targeted by BAMX. To put it mildly, the rather decentralized logistic plans designed to cope with the day-to-day operations by BAMX are not adequate for the extraordinary requirements of sudden humanitarian situations.
In such situations, BAMX’s central logistics management (CLM) office must make quick decisions to adapt the network to the surging supply and demand. However, according to the managers of the organization, specialized protocols for these kinds of situations do not exist. Indeed, although each bank is willing to cooperate, the arrival of a disaster triggers a rather unstructured process, where some more proactive banks contact other banks or make available part of their resources, while other rather reactive banks wait to see how their help is specifically requested. The timeframe (see
Figure 1) for BAMX to draw up a collection plan, collect donations at donor locations and move them to the selected banks, process items at banks, and deliver food to communities is indeed very short, with the goal being to provide first relief to the people in need as soon as possible after the event. In this context, the lack of formal collaborative processes and the urgency of the matter may result in a poorly organized cooperative logistic plan, where most of the decisions are made after the collection of donations has started (or, in some cases, even finished), thus reducing the effectiveness and the aid that the network can bring to people.
4. A Mixed-Integer Linear Programming Formulation
The BAMX supply chain can be modeled as a two-echelon distribution network, composed of three sets of nodes—donors, foodbanks, and the communities to which aid must be delivered, denoted as
,
and
, respectively—and three sets of oriented arcs, representing the transitable roads connecting donors to foodbanks (set
), banks to banks (set
), and banks and communities to communities (set
). As is the case in most works devoted to two-echelon relief distribution networks [
17,
49], the goal is to decide the assignments of donors to banks and banks to communities, as well as the quantities of products transported from donors to banks, between banks, and from banks to communities, in order to satisfy the demand of the communities as much as possible, while respecting the desired proportion of nutrients in the products delivered to communities and some additional operational restrictions. However, our aim is not only to find the optimal solution, but to also consider the extent to which different organizational strategies (such as levels of decision centralization) impact the network performance. Therefore, it is necessary to elaborate a formulation that captures the assumptions and practices observed at BAMX, and which can model more flexible configurations, as is detailed in the Numerical Experiments section.
A donor can supply only one bank and each bank can receive goods from several donors in the regular (day-to day) plan. Donations must be processed by the original recipient bank, which is responsible for delivering reports to the donor institutions, and transshipments between banks are allowed. Two operational phases are considered: (1) donation collection and processing, and (2) donation re-allocation, and donation delivery. We assume that each bank must complete phase (1) before to begin phase (2). Moreover, if one bank receives food from other banks during phase (2), deliveries cannot start until all the receptions have been completed. Food needs to be processed only when it is directly received from a donor. As per the assignments of communities to banks, BAMX follows a single sourcing strategy, meaning that each community receives food from a single bank. This method has been also reported in the literature. Sengul Orgut et al. [
11,
49] and Martins et al. [
47], among others, describe food bank networks having the same structure as BAMX, and the single sourcing strategy is used by their partner organizations. In our case, BAMX justified the use of this strategy because it allows better contact with the communities, and better knowledge and control on the communities’ needs. Even more importantly, it helps in developing a trustful relationship with the communities. BAMX considers that a single source is easier to manage and overall, the advantage of single source outweighs the fact that it is not optimal from a transportation perspective.
Indeed, several communities can be visited into a single route starting from a given bank. Each bank’s official team plans the delivery to a list of communities, which will be visited in succession by a convoy of vehicles. However, schedules for vehicles and the assignment of vehicles to routes are beyond the scope of the proposed work.
BAMX needs to plan food collection and transportation to banks, processing at banks, and deliveries to communities, in such a way that the latest delivery is performed within a maximum time . The model considers various types of transport vehicles, defined in a set , including owned vehicles and those of third-party companies (3PL), mostly Less-Than-TruckLoad partners. Each type of available vehicle has a given capacity. Notice also that the distance to be traveled by a vehicle depends on the vehicle’s type. 3PL companies only consider the distance from the pickup location (the donor) to the destination (the bank) whereas owned vehicles must travel from the bank to the donor and back. Costs are computed according to the travelled distances, but since 3PL’s rates per kilometer are much higher than the owned vehicles’ cost per kilometer, in most of the cases using 3PL is more expensive. The acquisition of additional vehicles is not considered in the short span of the problem’s planning horizon. Therefore, only variable transportation costs are considered. Multiple trips are not allowed. Indeed, as our goal is not to find the optimal distribution plan, but to discuss the impact of reconfiguration tactics on the network performance, this is an assumption that we deem acceptable. Furthermore, this assumption is also in alignment with the BAMX’s objective of a fast response. Nonetheless, this assumption may be relaxed when the actual distribution plans are executed.
As per the quality of the distributed food, the model considers a set of the various types or families of food and restricts their mixture to provide a balanced diet. This is achieved by ensuring that the quantity of each type of food (for example, sugary drinks) delivered to each community does not exceed the proportion given by parameter , which is set by BAMX. The units of food that do not meet these proportions may not be delivered. Notice that these restrictions ensure a minimum level of quality, whereas the demand at each community is expressed as kilograms of food, independently of its type.
Banks must complete the collection of donations, donation processing, and reception of all of the food coming from other banks before shipping food to the communities. Finally, each bank has a limited budget. When food is transported between banks, the one receiving the food assumes the expenses.
Table 2 lists the sets and indices used in the model formulation.
Several sets of variables are used to formulate the model. Sets of continuous variables
,
, and
decide the quantities of each food type
shipped using vehicles of type
from donors to banks, between banks, and from banks and communities to communities, respectively. Binary variables
represent the assignment of banks to communities. Auxiliary variables
,
, and
, which, similarly to the assignment ones, are set to one only if food is transported between the referred nodes. Integer variables (
,
, and
) determine the number of trucks of each type allocated by each bank to perform food transportation from donors, to or from other donors, and to communities, respectively. Auxiliary continuous variables
,
, and
represent the latest arrival time of food shipped from donors to banks, from a bank to another bank, and from banks to communities, respectively. Finally, the continuous variable
computes the percentage of unmet demand at each community. Sets of variables are defined in
Table 3.
Finally, the parameters and constants reported in
Table 4 are used in the formulation.
The model’s objective is to minimize the average fraction of unmet demand computed as
. However, to avoid the case where the average shortage is minimized by sending more supplies to small or low-demand communities, we also minimize the largest unmet demand,
. The formulation is expressed as follows:
subject to:
| | (2) |
| | (3) |
| | (4) |
| | (5) |
| | (6) |
| | (7) |
| | (8) |
| | (9) |
| | (10) |
| | (11) |
| | (12) |
| | (13) |
| | (14) |
| | (15) |
| | (16) |
| | (17) |
| | (18) |
| | (19) |
| | (20) |
| | (21) |
| | (22) |
| | (23) |
| | (24) |
| | (25) |
| | (26) |
| | (27) |
| | (28) |
| | (29) |
| | (30) |
| | (31) |
| | (32) |
| | (33) |
Constraints (2) ensure that the flow of each type of food from each donor to banks is not greater than the donor’s offer . Constraints (3) enforce that the food flow received at each bank is not greater than its capacity for processing donations. As the food only needs to be processed once by the network, food shipped between banks does not impact the recipient bank´s capacity .
Constraints (4) require that the number of vehicles of every type assigned by a bank . to collect food from all of its donors is not greater than the number of vehicles available for each vehicle’s type. As mentioned before, multiple trips are not allowed; however, once all of the food collected from donors is received—in the first transportation phase of the supply chain—and processed by the banks, the vehicles can be used to transport the donations to other banks or communities (in the second transportation phase). Constraint (5) limits the usage of vehicles in the second transportation phase. Since banks can simultaneously send food to other banks and communities, both usages are considered together for the transportation capacity of the second transportation phase. Constraints (6)–(8) limit the flow of food across the different stages of the network, considering the number of vehicles assigned and their capacity .
The quality of the food delivered to communities is handled by Constraints (9) and (10). Constraints (9) ensure that the food sent by each bank to the communities it serves respects the proportions set by the parameter by computing the total amount of food delivered at the community and setting an upper bound for the proportion allowed of each food type. However, as it is possible that the available quantity of a given type is lower than its bound, all of the available food would most probably not be delivered. For this reason, Constraints (10) compute the actual quantity of each food type that can be delivered at each community, setting another upper bound on .
Constraints (11) establish the flow balance between banks and communities, whereas Constraints (12) establish the balance of the flows between banks, and Constraints (13) concern the flow balance between communities. Constraints (14) and (15) limit a single arc in set to be used to reach and leave each community , respectively. Constraints (16) limit each donor to supply at most one bank , and Constraints (17) identify which of these assignments are made, using the bank capacity as a flow upper bound. Constraints (18) require that each community be assigned to, at most, one bank through the binary variable . Constraints (19) ensure that a bank can deliver food to a community only if is assigned to bank by the variable . The first and second terms in equation (19) compute the community’s food inflow and outflow, respectively. The right-hand side of the equation bounds their difference by the community-to-bank assignment variable multiplied by a “Big quantity”, which is set to the sum of the donations available. Therefore, if the community is not assigned to the bank (), the food coming to the community cannot be greater than the food leaving the community. Otherwise, the difference between the inflow and the outflow provides the quantity delivered at the community. Notice that it might be helpful for a bank to use a route that visits a community which is not assigned to it in order to reach other communities, particularly these within the disaster zone. Therefore, Constraints (19) do not forbid the flow through the communities when . In such cases, Constraints (19) ensure that the community’s outflow is not lower than the inflow, meaning that no food can be delivered. Therefore, Constraints (19) and (13) work together to ensure flow continuity, thus allowing banks to use communities that are not assigned to them as passthrough nodes.
Constraints (20)–(22) help to track which arcs are being used to transport food by setting the associated auxiliary variables , , and to 1, respectively. Constraints (19)–(22) use the total donation supply or bank´s capacity as flow upper limits. Together, Constraints (23)–(27) ensure that all the activities of collection, processing, and delivering to communities are completed within a maximum timespan . Constraints (23) track the latest arrival times . of each food type transported from donors to each bank , which includes the travel time and processing time at banks, . The latest times can be interpreted as the time at which shipments to a bank are consolidated for shipment to another node. Constraints (24) track the latest arrival times of food type transported from banks to banks with the addition of the previous arrival times . This represents the time at which the delivery to the communities can start for every bank . Similarly, Constraints (25) track the time in which food arrives from a bank to a community , and Constraints (26) track the time for the cases in which the transportation is between communities. Constraints (27) limit the arrival time to every community to , ensuring that food arrives to the communities on time, thus limiting the length of the distribution routes.
Constraints (28) limit the expenditures of each bank to their budget . Constraints (29) track the fraction of unmet demand at each community , and Constraints (30) calculate the largest proportion of unmet demand among banks in the network. Notice that measures only the total quantity of food delivered at the community since the quality is ensured by Constraints (9) and (10). Finally, Constraints (31) and (32), and (33) define the domains of variables.
5. Numerical Experiments
The objective of this section is to empirically assess the extent to which network design decisions at different stages of the supply chain may contribute to achieving better performance under a disaster scenario, assuming that the current structure of the supply chain will need to be modified in response to a disaster. By doing so, we intend to identify the decisions having the highest impact on the network effectiveness, such that managers can focus their efforts on them. First, the instances designed to reproduce the distribution process of an organization such as BAMX are described. Then, different network reconfigurations focusing on specific types of decisions are proposed and their impact on both system effectiveness and efficiency are assessed by solving a testbed of random instances.
5.1. Instances
To generate a comprehensive testbed, we followed a two-step process. First, instances representing the regular (such as day-to-day) operations of an organization such as BAMX were generated. Then, for each instance, the effect of a random disaster was applied, such that regular supply and demand, as well as the state of the transit arcs, is affected. The instances were designed to emulate common scenarios discussed and validated with the logistics managers of BAMX. However, they do not correspond to a particular event faced by BAMX in the past.
Let us start by describing the regular instances. A regular instance consists of a set with
banks,
donors, and
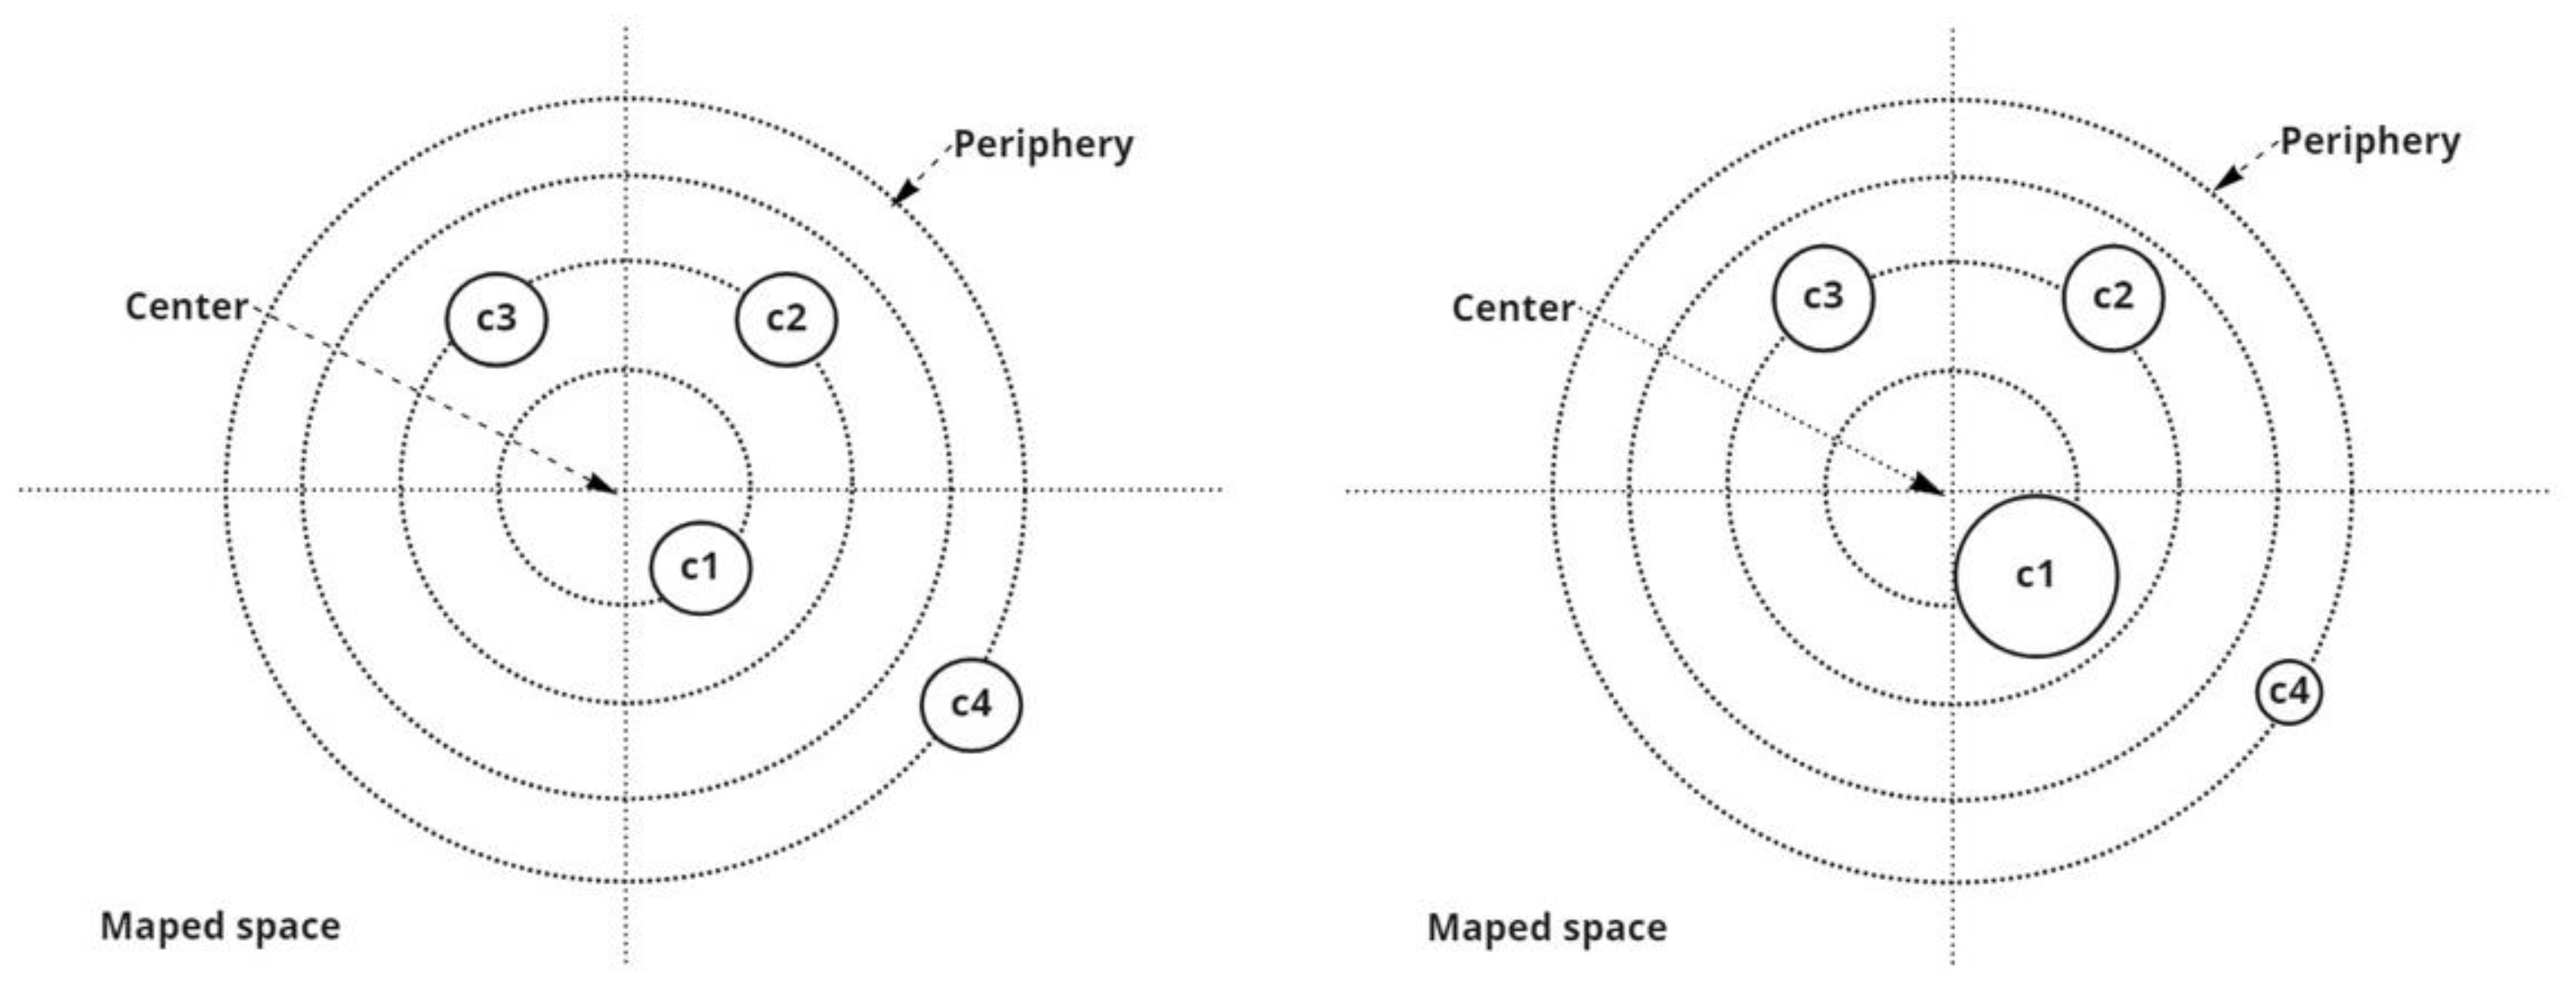
communities uniformly located in a 1000 km × 1000 km territory. To each community, we associate a random demand that represents the needs of the surrounding population. To this end, two kinds of demand distributions are used: a uniform distribution where each community’s demand is drawn from a
U(
,
) distribution, and a distribution where the demand assigned to communities is inversely proportional to the square of their distance to the territory’s center. We refer to the latter as a “dense” distribution as it concentrates demand near the center of the territory (see
Figure 2).
The total demand of the network is computed as the sum over all of the communities and, to emulate the historical performance of the bank network, the total network supply is set to satisfy only 90% of the total demand. For this supply, 3 types () of food are considered. A total of 2 possible profiles of supply mixes are considered: a “good” mix, where the proportions of the three food types supplied by the donor match those targeted by the parameter (70%, 20%, and 10%), and a “bad” mix (50%, 30%, and 20%), which has a higher proportion of products of types 2 and 3 than desired. The total quantity offered by each donor is drawn from a probabilistic distribution. Again, two profiles of distribution (uniform and dense) are considered. In the latter, supplies available for each donor are inversely proportional to the square of their distance to the territory’s center. We assume the bank’s capacity, budget, and quantity of owned vehicles to be tied together as a single factor of network resources, in order to represent the size of each bank. The distribution of these network resources can be uniform or dense. In addition to the owned vehicles, rented vehicles with the same speed but different travel costs are available.
Then, to simulate the effect of a disaster, a point is selected as the disaster’s epicenter. Two cases are considered: a “centered” case, where the disaster is on the center of the territory, and a peripheral case, where it strikes on the edge of the mapped territory. In both cases, the affected area is generated by drawing a circular area around the disaster’s epicenter, which contains at least 10% of the communities. Within the affected zone, we define a critical zone around the same epicenter but with half the radius of the affected area. To model the fact that traveling an arc in the disaster zone is more difficult, we decided to increase the arc’s length and keep the vehicle speed constant. Hence, the length of arcs connected to any node located within the affected zone is increased by 20%. However, if the arc connects to at least one node in the critical zone, the length of the arc is increased by 50%, instead of 20%.
Once the disaster zone is created, the disaster demand—which refers to the increase in demand of the affected communities—is generated. To this end, the demand of the communities inside the affected and critical zones is multiplied by a disaster factor, the value of which is set to 2. The total donations to the network are increased accordingly and, to simulate the existence of an emergency budget, the monetary resources of the banks are increased by 20%.
As described above, several instance features, such as the demand distribution, might use two alternative distributions or parameters. Adopting the design of experiment terminology, we refer to these features as factors, and to the available choices as levels. Since each of the five factors has two possible levels (which are arbitrarily denoted as low and high), up to 32 combinations of levels of the five factors are possible. Each combination is referred to as a scenario. The five factors, their corresponding model parameters, and their levels are reported in
Table 5. Finally, a Monte Carlo approach was used to sample the chosen random distributions in each scenario, in order to generate the desired number of regular and disaster replicates.
All of the computations were performed on a 64-bit Windows computer with a Ryzen 5600 @ 4.6 GHz CPU and 16 GB RAM. The Gurobi v9.0 software was used to solve the formulation. Computational times depended strongly on the network configuration, ranging from an average time of s. up to 82 s. All of the instances were solved to optimality. These computational times were deemed as short and, therefore, acceptable by the BAMX manager, in the context of planning the response to a natural disaster.
5.2. Experiments
As our objective was to shed some light on how the foodbanks in the network should re-organize their operations, with respect to the day-to-day model, we first solved each regular or day-to-day instance. These solutions provide the donor-to-bank assignments, the community-to-bank assignments, and the food quantities that flow through the network, constituting our baseline. We then solved the corresponding disaster versions of the instances. Three types of network reconfigurations were proposed. Each configuration allowed for the reviewing of specific decisions with respect to the day-to-day solution. To this end, the problem formulation was solved, but only variables related to the decisions allowed by the reconfiguration were free; the remainder were set to the values produced in the day-to-day solution. The motivation for this strategy is that, in a decentralized network such as that of BAMX, each change or modification implies a series of calls and negotiations between bank managers. Considering the limited time available to redesign and implement the changes in the network, it is of utmost importance to identify the modifications or aspects to negotiate that maximize the outcome and the potential added value that longer discussions may achieve.
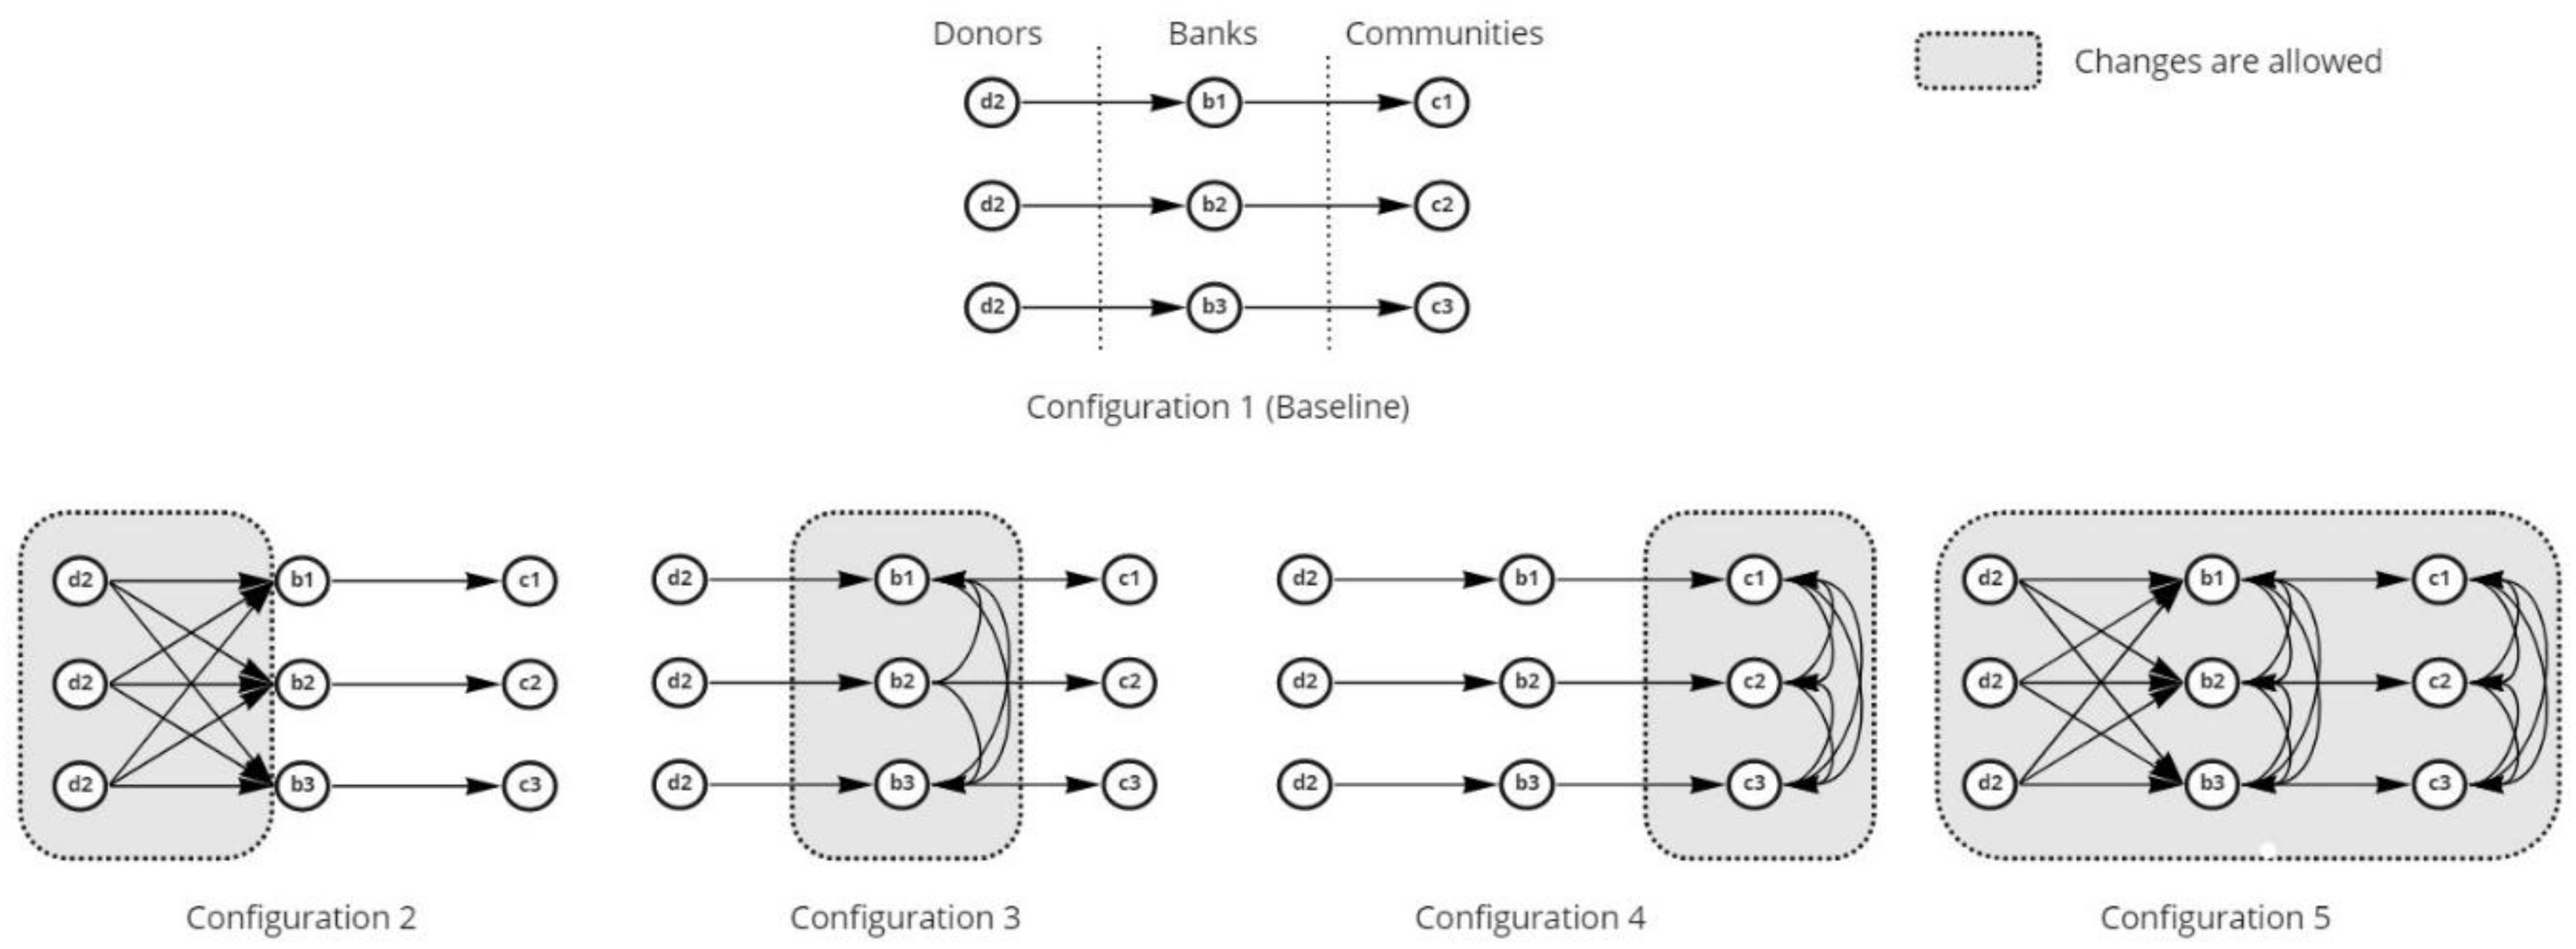
From a practical standpoint, considering network changes based on the supply chain levels is a straightforward way to segment network reconfigurations. Therefore, three possible reconfigurations (low, mid, and high level) are proposed with respect to the day-to-day solution (referred to as configuration 1). A low-level reconfiguration (configuration 4) corresponds to the case where only distribution decisions (banks to communities) are modified. Furthermore, the single-source assumption is relaxed, such that several banks are allowed to send food to the same community. The implementation of such modifications in practice is rather easy, as they involve coordination between two or among a low number of banks. In a mid-level reconfiguration (configuration 3), shipments of products between banks can be modified, but distribution decisions remain the same as in the day-to-day case. In a high-level reconfiguration (configuration 2), assignments of donors to banks can be modified. It is worth noting that banks are generally reluctant to allow others to interact with “their” suppliers. A bank would only be open to such a possibility if doing so would result in an important improvement in network performance. Finally, we also propose a full reconfiguration alternative (configuration 5), where all of the previous modifications are allowed.
Figure 3 illustrates the reconfiguration alternatives.
6. Numerical Results
We first analyzed how the network performance metrics were impacted by the factors characterizing the different scenarios. To this end,
Table 6 reports the average unmet demand
and the maximum unmet demand
, as well as the half of their confidence intervals at 95% (HW), when each factor was set to its low and high levels. We also report
and
, which are the changes in
and
, respectively, when a given factor changes from its low to high level while keeping all other factors constant. Note that only the results for which
and
show a statistically significant difference are reported.
Table 6 shows that all of the factors similarly impacted the network performance, with two exceptions. Firstly, QDM did not seem to affect the metric
. Secondly, DNR and DL had a much greater impact than other factors on the metric
. This larger effect can be explained, at least partially, by the fact that disasters increase the demand and transportation costs in the affected zone. Therefore, banks with relatively low resources exhaust their budget rapidly when they are within the disaster zone; hence, a network where resources are unevenly distributed is more susceptible to bottlenecks caused by banks with limited capacity, and banks with low availability of resources have a greater impact on the performance of the network than the location of the disaster.
Regarding the remaining factors, a poor food mix quality provided by the donors reduced the aid distributed by the network. If one type of product is less available, it limits the quantity of the other types that can be delivered, even if the banks have plenty of them. Although the model tries to correct unbalance on the mix of the donations by reassigning donors to banks or by transferring food between banks, these activities incur logistic costs that in some cases exceed the available budget or the amount of food that a bank can process. On average, instances having a “bad” composition of food mix increased by 3.62% but had no significant increase in . Furthermore, the factors DDE and DDO showed similar impacts on and , which means that the performance of the network is sensitive to the location of the demand and the location of the supply. These effects were diminished when the demand was equally distributed among the communities. Finally, it is worth mentioning that analysis of variance of the full factorial experimental design indicated that the disaster scenarios only explained 12.3% of the variation of and 18.7% of the variation of , while the configurations explained 80% and 64%, respectively.
Next, we analyzed how the different reconfigurations affected the effectiveness and the efficiency of the network.
Table 7 reports, for each configuration, the average computational time
in seconds to solve each instance to optimality, effectiveness metrics
and
and the metrics related to efficiency
, the ratio between quantities actually delivered to communities and the available donations, and
, the average usage of each bank’s budget. These are relevant metrics for the banks, as spending their entire budget on a single response operation will leave them vulnerable to future disasters. Higher values of
indicate that more resources of the network are spent, but not necessarily that the cost is translated to higher performance. Therefore, we also report an efficiency metric,
, based on the percentage of met demand and the percentage of budget spent among banks. Additionally, we measured the usage of the flexibility granted by each network reconfiguration, in order to quantify its potential. In the case of the first stage (donation collection), we report
, which is computed as the percentage of donors whose assignment has changed with respect to the day-to-day operations. Regarding the second level (transshipment),
reports the percentage of donations received by each bank that is transferred to another bank. Finally,
provides the ratio between the number of goods delivered from each bank to communities that it does not serve in the regular operations and its total output flow.
Before starting the performance analysis, let us briefly discuss the reported computational times. As it was mentioned earlier, times depend strongly on the configuration applied, varying from a fraction of a second for configurations 1 and 3 up to 82 s. in the case of configuration 5.
Table 7 shows that, compared to the day-to-day performance (configuration 0), the levels of unmet demand were significantly higher in disaster scenarios when the baseline configuration used (configuration 1). Indeed, the results obtained for the day-to-day scenarios are uniquely presented as an upper bound for reference on how much the performance of the network could be diminished in a disaster setting—even if the ratio of total available donations to total demand remained basically the same—and to identify differences in the use of the network.
Table 7 also shows that the best performance, in terms of
and
, was achieved by the most flexible configuration (configuration 5), although the results in
produced by configuration 2 were close. The better performance of configurations 2 and 5 can be explained, as shown by metric
, by their ability to perform the re-assignment of donors to banks.
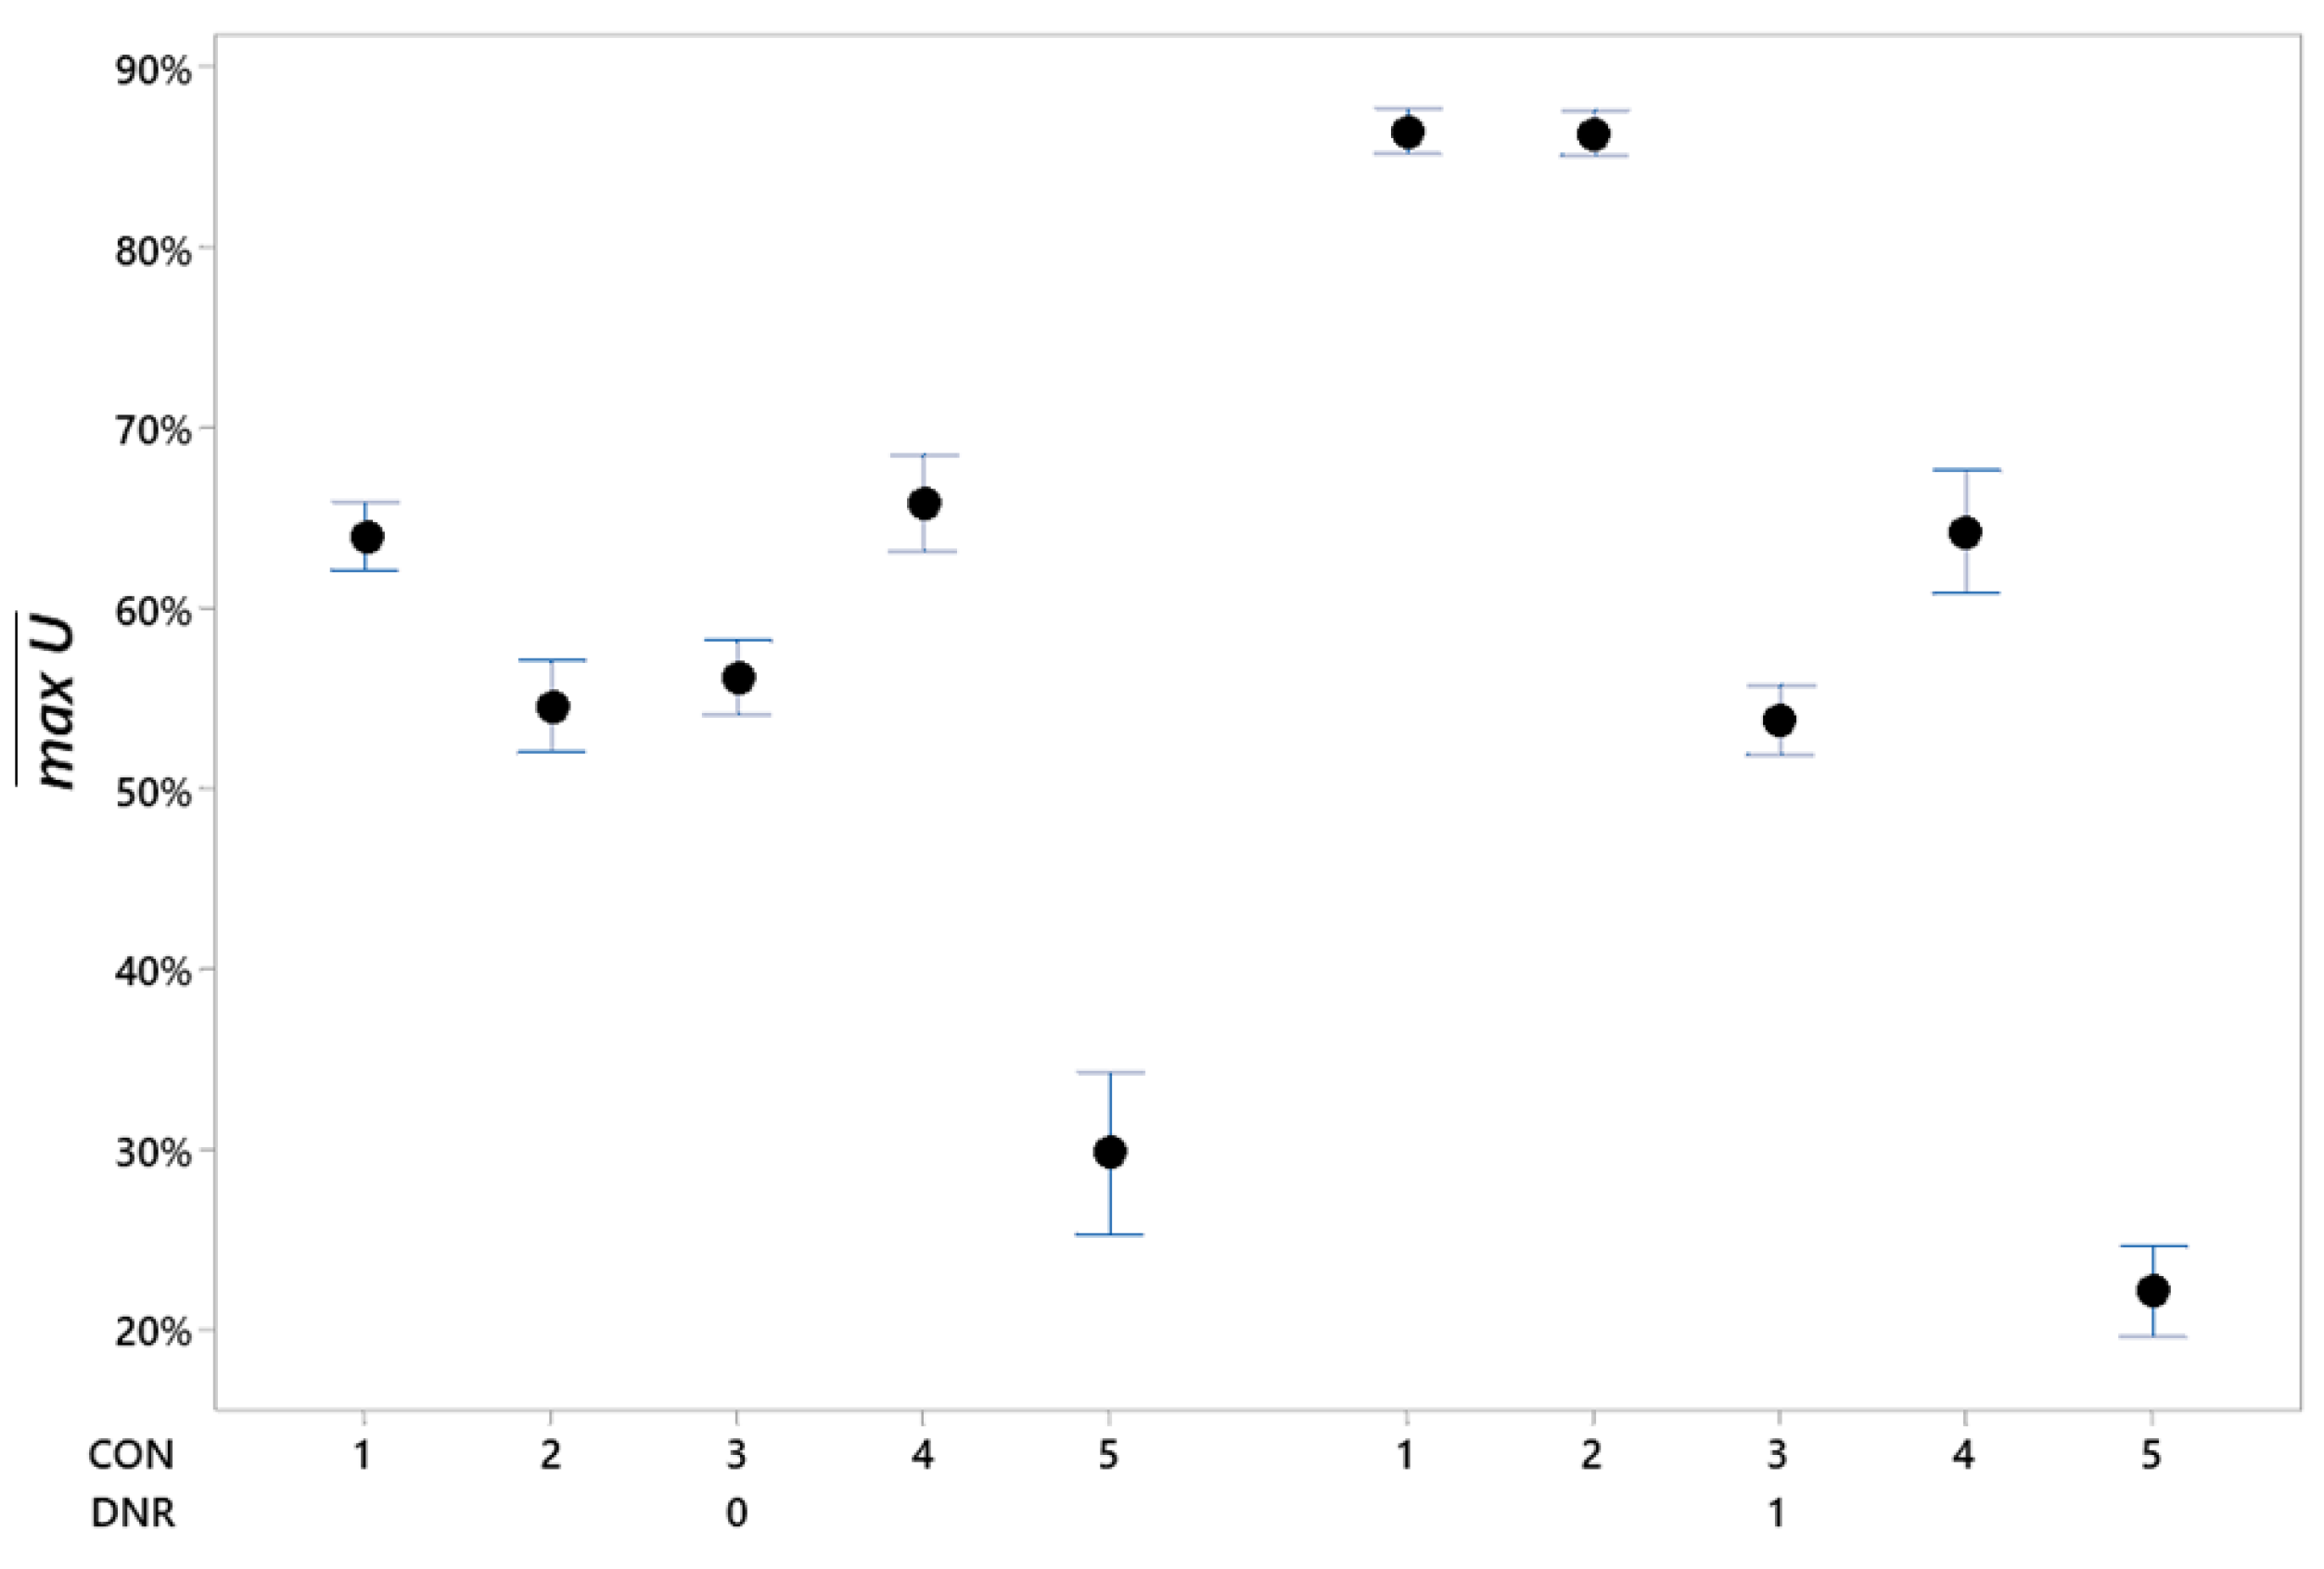
Figure 4 shows, for both levels of the factor DNR, the results for
. It can be seen that when the resources were densely distributed (for example, DNR = 1), the results produced by configuration 2 were greatly deteriorated. The poorest performances were produced by configurations 1 (the baseline) and 4, which demonstrated that reassigning communities to banks alone is ineffective in the rebalancing of supply and demand in the case of a disaster.
As per the efficiency-oriented metrics, configurations 2 and 5 had the highest percentage of donations delivered (), consistent with the results obtained for and , whereas configuration 1 and 3 achieved the poorest values. Concerning the budget utilization , configurations 1 and 4 had the lowest values, whereas configurations 2, 3, and 5 were close to 100% budget utilization. The efficiency indicator showed, again, that configurations 2 and 5 offered the best results under disaster scenarios, displaying the highest amount of demand satisfied per percentage of budget spent for both levels of the network resource distribution factor. On the other hand, configuration 3 was among the least efficient. To summarize, a network reconfiguration in the highest level of the distribution chain is beneficial for performance and more cost-effective than reconfigurations in the lower levels.
7. Discussion
Altogether, the numerical results of the experiments demonstrated that the transition from day-to-day operations to a crisis is critical from a logistics planning standpoint. Moreover, a significant deterioration of the network performance can be expected if the network does not adapt its configuration, even if the total amount of donated food increases in the same proportion as the demand.
To cope with urgent situations, such as those in the aftermath of a natural disaster, the decentralized management approach, as practiced by BAMX, needs to be replaced by cooperative strategies focused on the reallocation of resources to achieve a higher and fairer fulfillment of the needs of the affected people. The results confirmed that situations where resources, such as capacity and budget, are unevenly distributed throughout the network, although efficient in day-to-day operations, tend to cause bottlenecks in the lowest-capacity nodes, which may cause high levels of unmet demand in the disaster zones, depending on the distribution strategy used. This may suggest that an alternative strategy, in which specific resources for emergencies are managed in a centralized rather than decentralized manner, should lead to better results.
Our experiments also indicated that a partial reconfiguration, limited to the re-assignment of food donors to banks, can yield very good results in a budget-balanced network and, as such reallocations are the most efficient, the negotiations between managers to cope with urgent situations should focus on them. Furthermore, the food mixture constraints can be better handled if they are considered within the upper-level decisions of the distribution chain; that is, during the planning of food collection from donors. Once a donation of the wrong mix reaches a bank, it becomes very costly, in terms of time and money, to execute redistribution among banks, creating a bottleneck in the network.
We also observed that trying to adapt the distribution part of the supply chain to mitigate an imbalance in food mixture and availability leads to transport routes that are too expensive or require too much time, delaying delivery beyond the acceptable target. Whereas donors can be reassigned easily to a new bank, banks often need to create less efficient routes to distribute to other regions. However, this conclusion strongly depends on the topological characteristics of the considered instance.
To summarize, the proposed mathematical model and its various configurations can be used to help guide foodbank managers in the challenging process of adapting their day-to-day operations to cope with the extreme requirements in the aftermath of a natural disaster. Considering the short time available to make decisions and the fact that, in practice, there is no formal protocol to support bank coordination, knowing that a rather small set of decisions have the most impact on network performance may help managers to focus first on these decisions and establish prioritized lines of action, in order to better respond to disaster situations.
8. Conclusions
We considered the problem of re-organizing foodbank logistics to cope with the extraordinary needs resulting from the occurrence of a natural disaster. Inspired by the real case of Bancos de Alimentos de México (BAMX), a food bank network in Mexico, this paper contributes a mathematical formulation that extends existing ones to encompass the whole supply chain, from donors to communities. Furthermore, it considers several types of products and incorporates restrictions on their proportions to guarantee the quality of the food delivered to communities from a nutritional perspective. Finally, it empirically analyzed the performance of five different options for network reconfiguration in terms of effectiveness and efficiency. From a practical standpoint, the empirical results offer insights that can be useful guiding foodbank managers in the challenging process of adapting their day-to-day operations to cope with the extreme requirements in the aftermath of a natural disaster. In particular, the experiments showed that the demand satisfaction levels at the communities served by the foodbanks may decrease drastically when the distribution of the demand changes, even if there is a rise in food supply and budget to cope with it. Additionally, the results showed that an uneven distribution of network resources can have a negative impact on the performance of a foodbank network when the day-to-day configuration is used or when only the upper section of the supply chain is modified. Finally, the results demonstrate that different network configurations from the centralized decision-maker perspective can lead to interesting results. As expected, giving responsibility to the whole range of decisions to the CLM offers the most effective performance. Despite this, the results showed that a network configuration focused only on the reassignment of food donors to the banks gives similar results in most scenarios. This is because the model can better deal with the food mixture constraints if they are addressed in the upper level of the distribution chain, which may give different results in networks that lack constraints of this type. Once a donation of the wrong mix reaches a bank, it tends to become too costly, in terms of time and money, to redistribute to other banks, thus creating a bottleneck in the network. With the prior knowledge of this, the process of negotiation between banks and the CLM can be accelerated, thereby improving the crucial response time when a disaster strikes, which may also help in the implementation of long-term interbank cooperation policies for the organization.
This work raises the need for additional research in certain directions. First, it is necessary to address the fairness of the measures taken by the CLM from the perspective of the individual banks, as well as the impact on performance when there is resistance to cooperation. Second, the variable nature of the donation volumes could be considered in a stochastic approach to the presented model. This implies a shift of focus from response execution to response planning. Finally, this work focuses on the first response offered by food banks to relief the affected people in the aftermath of a natural disaster. However, it does not consider the continuity of the operations between this first response and the moment the communities get back to normal and the food banks return to their day-to-day activities. Additional research is required to develop models supporting decision makers in this dynamic transition where the population’s needs, and the consequences of the disaster dynamically evolve.


