
The Impact of Mobility on Shopping Preferences during the COVID-19 Pandemic: The Evidence from the Slovak Republic

 ,
,  ,
,  ,
,  and
and
Abstract
:1. Introduction
2. Literature Review
3. Methodology and Data
3.1. Sample
- n: The sample size is 5,449,652 inhabitants in Slovakia [47];
- z: Critical minimal value for 95% confidence level is equal to 1.96;
- p: The estimated proportion of the population that has the attribute in question (0.5 is recommended for unknown values);
- e: Margin of error is equal to 0.05.
3.2. Categorical Variables
3.3. Method
4. Results
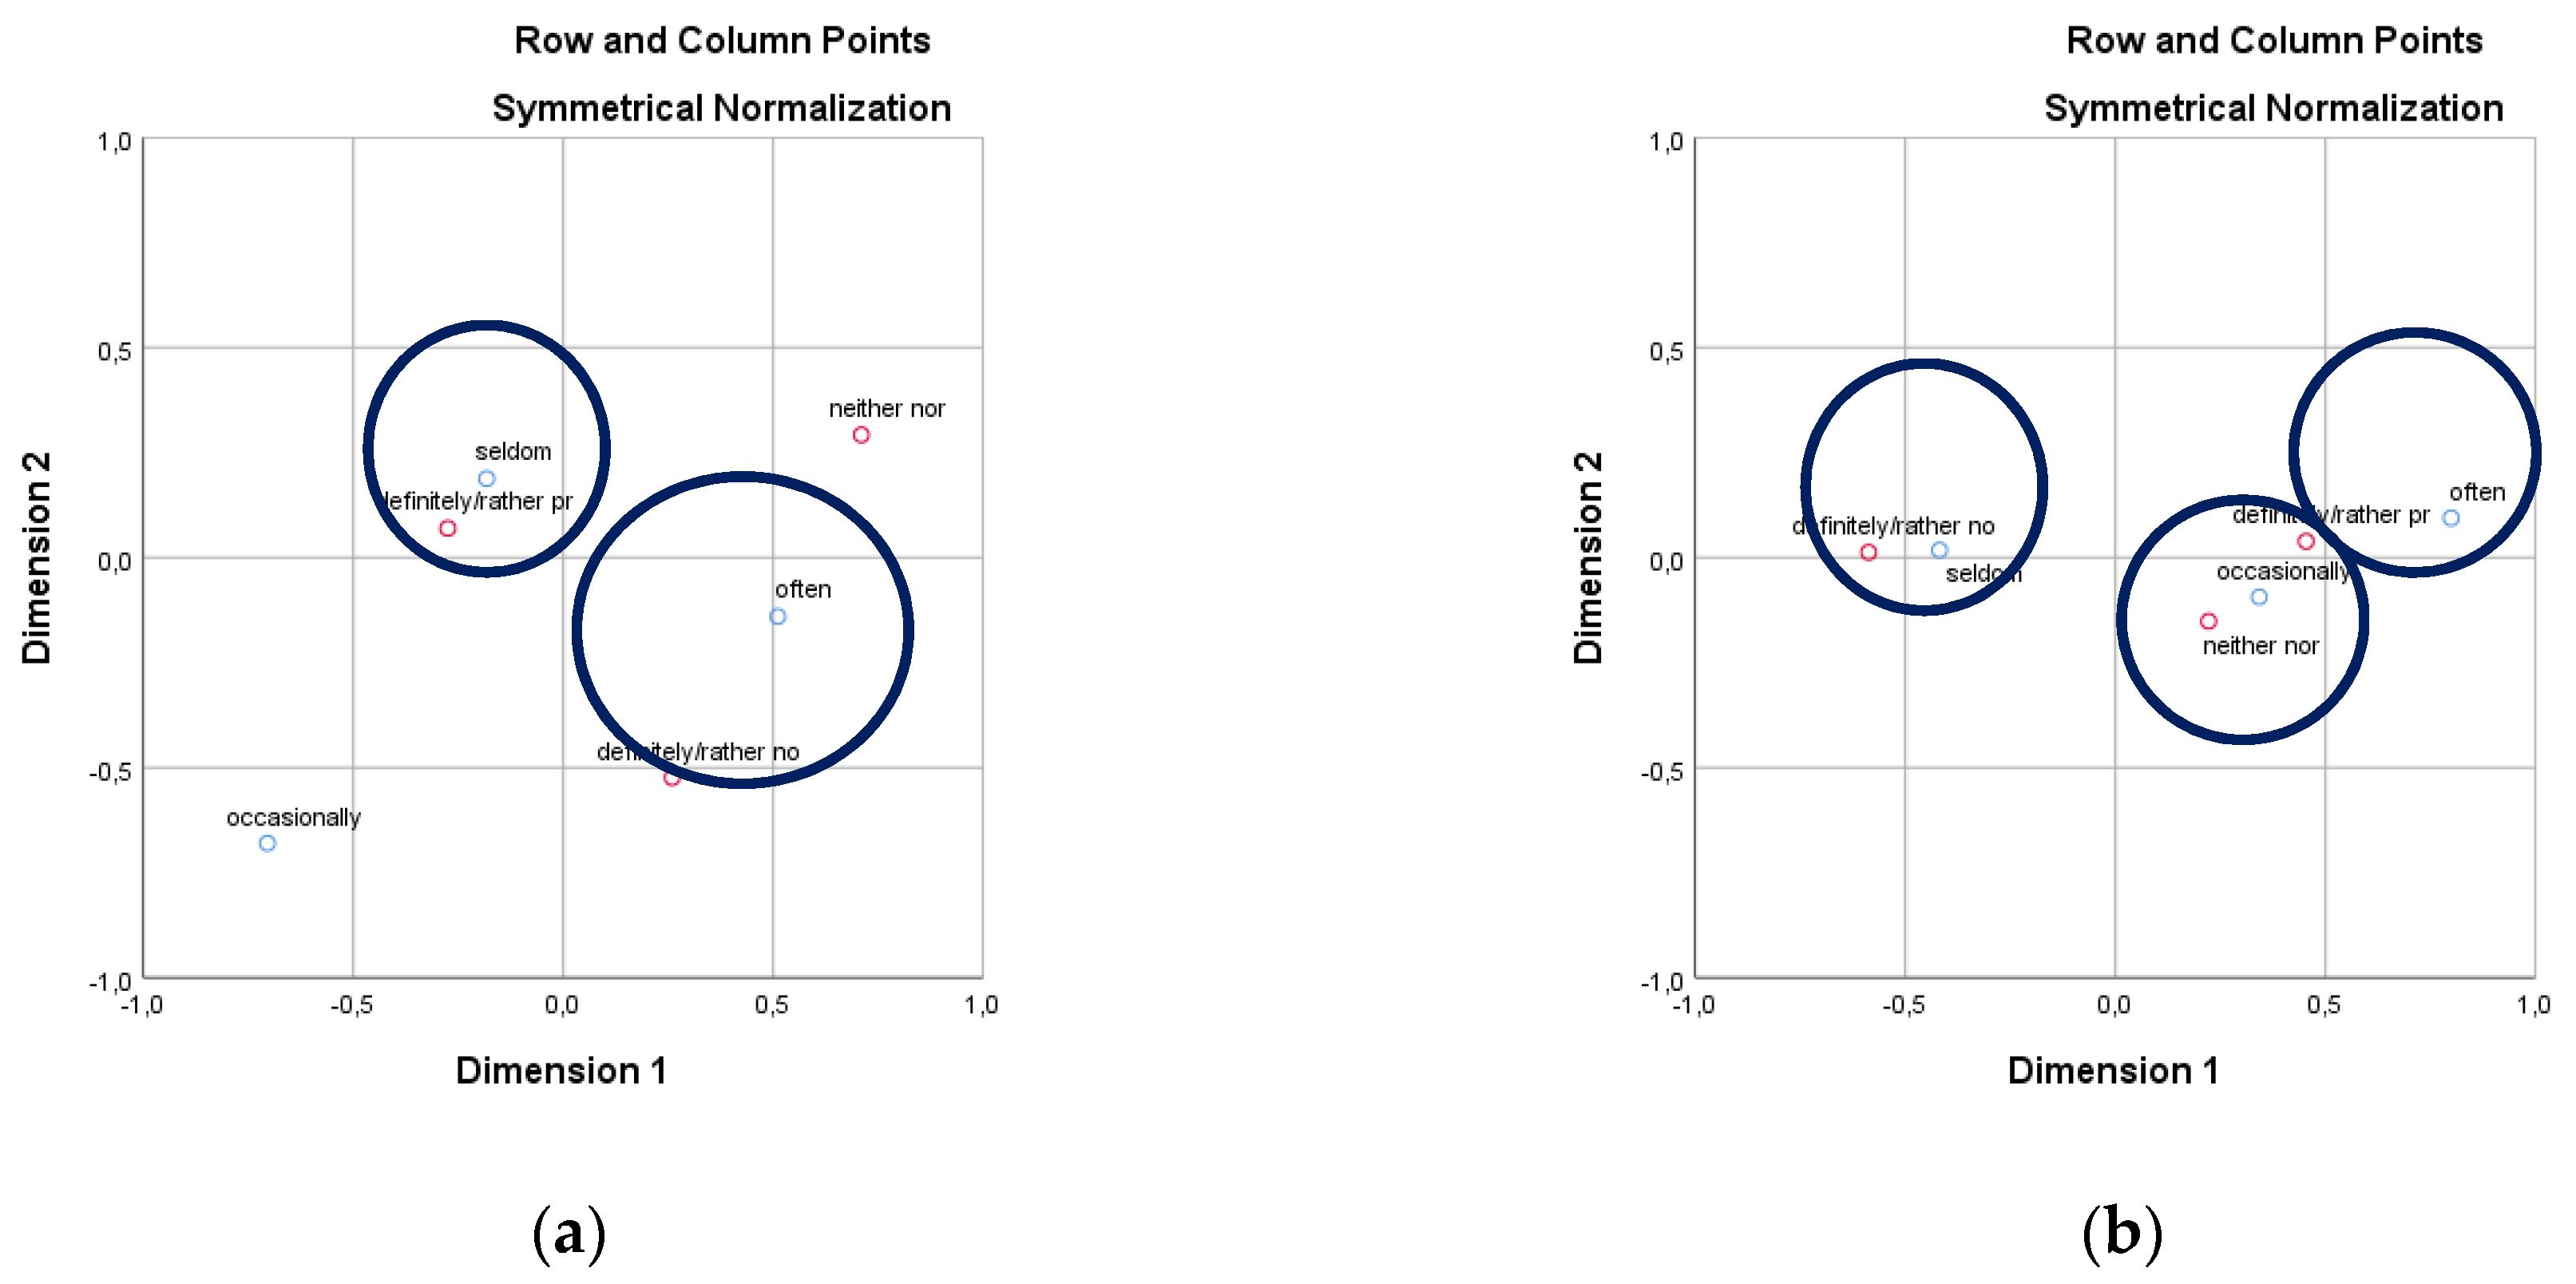
4.1. Correspondence Analysis I
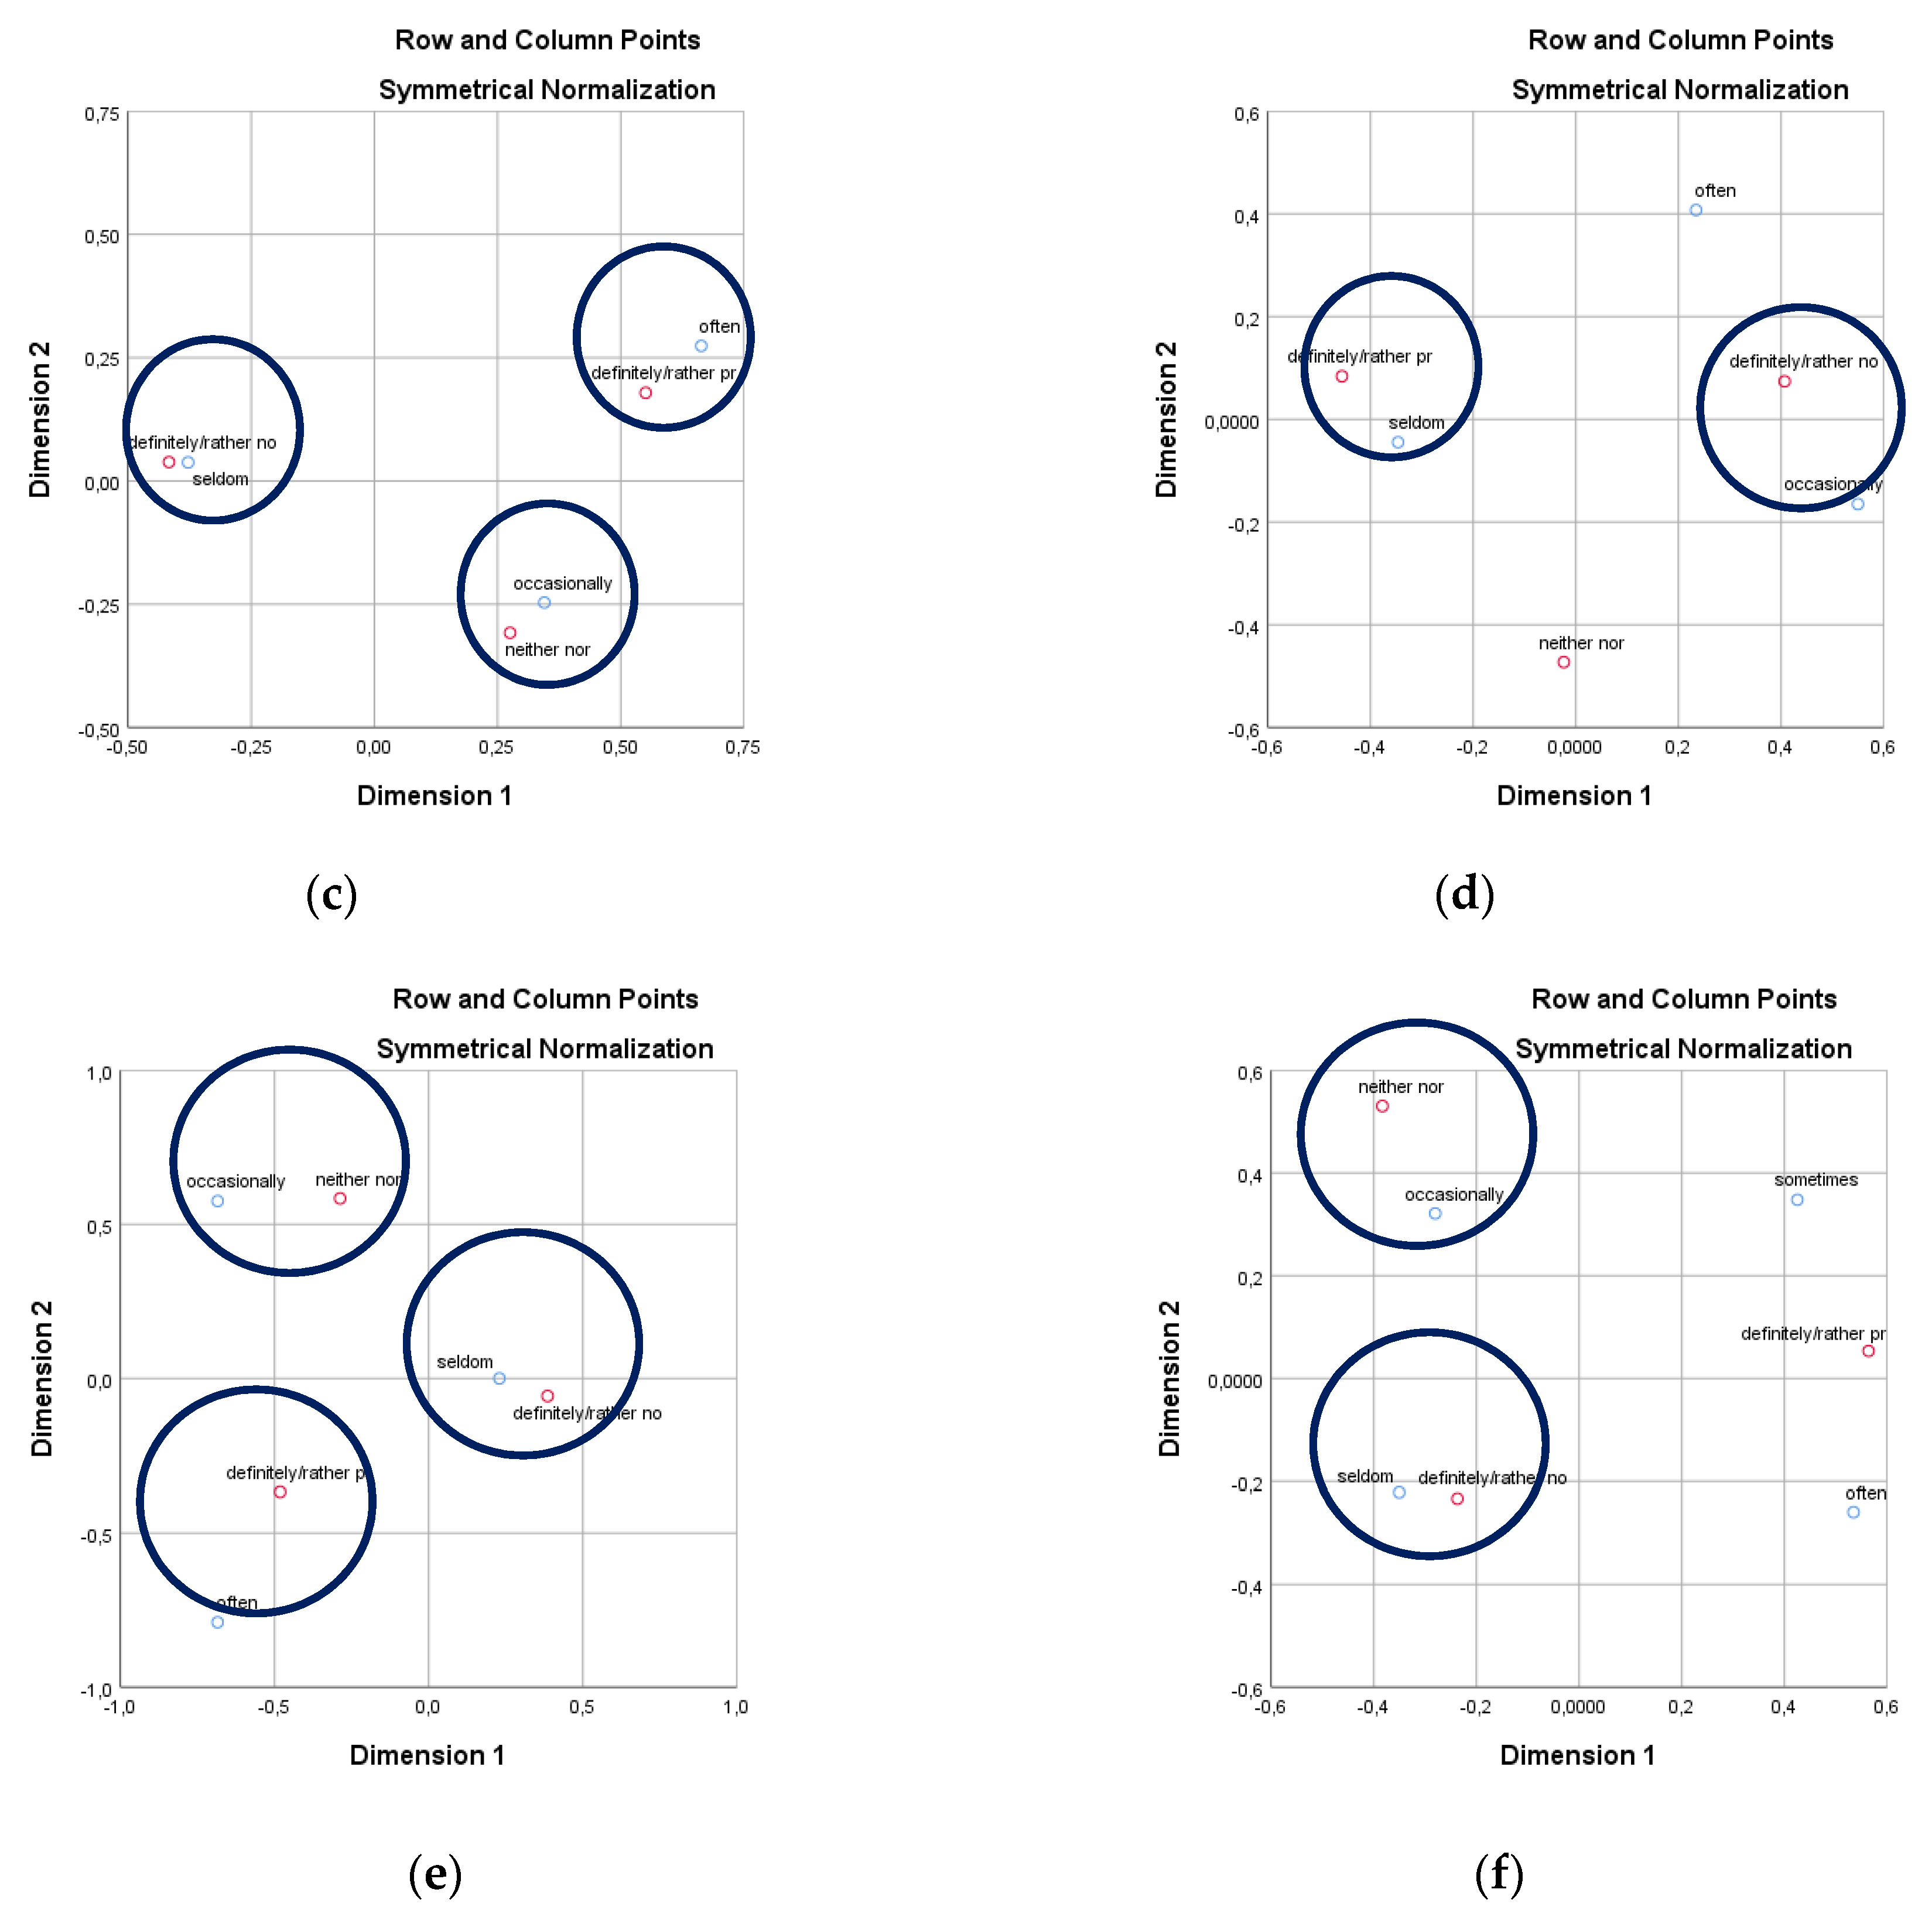
4.2. Correspondence Analysis II
5. Discussion
6. Conclusions
Author Contributions
Funding
Institutional Review Board Statement
Informed Consent Statement
Data Availability Statement
Conflicts of Interest
Appendix A

| No. | Question | Variable type | Category | N | % | Missing | Median | Mode | |
|---|---|---|---|---|---|---|---|---|---|
| 1 | What is your gender? | nominal variable | 1 | male | 194 | 47.7 | 0 | - | 2 |
| 2 | female | 213 | 52.3 | ||||||
| 2 | What is your highest level of education? | nominal variable | 1 | basic education | 8 | 2.0 | 1 | - | 3 |
| 2 | secondary education | 71 | 17.4 | ||||||
| 3 | university education | 327 | 80.3 | ||||||
| 4 | no reply (missing) | 1 | 0.2 | ||||||
| 3 | What is your status? | nominal variable | 1 | student | 83 | 20.4 | 3 | - | 3 |
| 2 | businessman/woman | 12 | 2.9 | ||||||
| 3 | employee | 291 | 71.5 | ||||||
| 4 | unemployed | 3 | 0.7 | ||||||
| 5 | retiree | 15 | 3.7 | ||||||
| 6 | other (missing) | 3 | 0.7 | ||||||
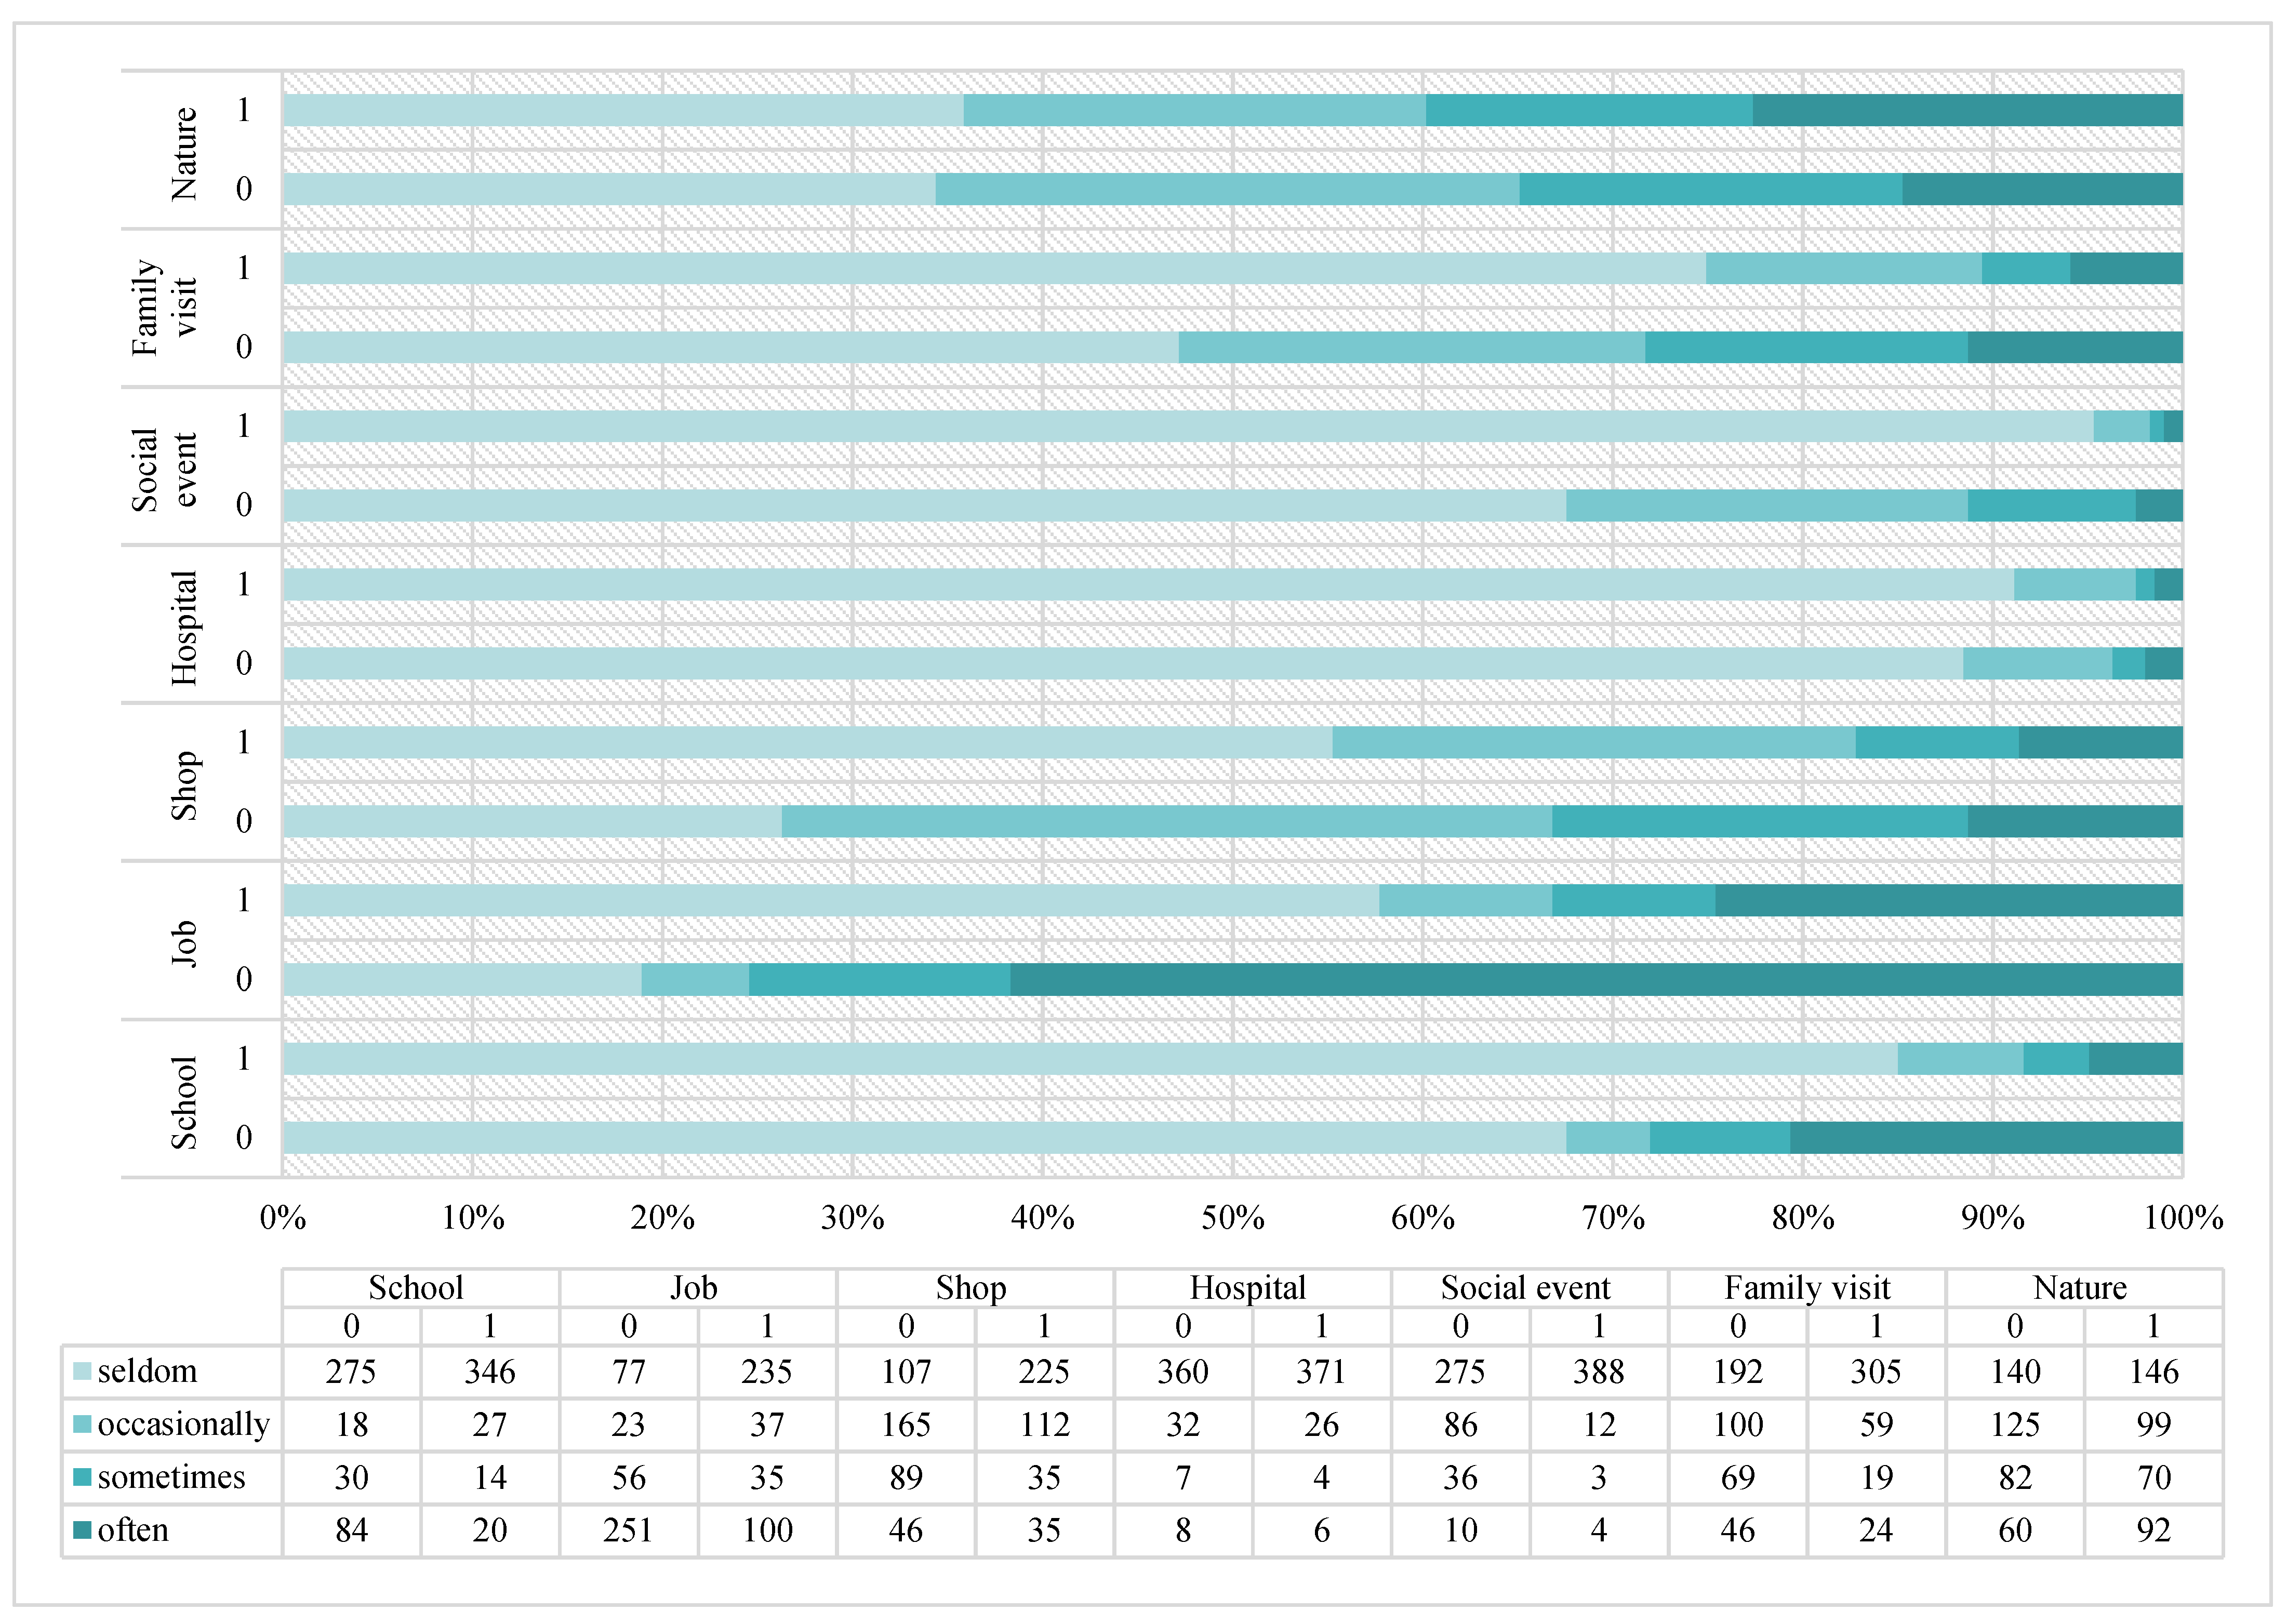
| 4 | How many times a week did you attend school before the COVID-19 pandemic? | ordinal variable | 1 | seldom | 275 | 67.6 | 0 | 1 | 1 |
| 2 | occasionally | 18 | 4.4 | ||||||
| 3 | sometimes | 30 | 7.4 | ||||||
| 4 | often | 84 | 20.6 | ||||||
| 5 | How many times a week did you go to work before the COVID-19 pandemic? | ordinal variable | 1 | seldom | 77 | 18.9 | 0 | 4 | 4 |
| 2 | occasionally | 23 | 5.7 | ||||||
| 3 | sometimes | 56 | 13.8 | ||||||
| 4 | often | 251 | 61.7 | ||||||
| 6 | How many times a week did you shop before the COVID-19 pandemic? | ordinal variable | 1 | seldom | 107 | 26.3 | 0 | 2 | 2 |
| 2 | occasionally | 165 | 40.5 | ||||||
| 3 | sometimes | 89 | 21.9 | ||||||
| 4 | often | 46 | 11.3 | ||||||
| 7 | How many times a week did you go to the doctor before the COVID-19 pandemic? | ordinal variable | 1 | seldom | 360 | 88.5 | 0 | 1 | 1 |
| 2 | occasionally | 32 | 7.9 | ||||||
| 3 | sometimes | 7 | 1.7 | ||||||
| 4 | often | 8 | 2.0 | ||||||
| 8 | How many times a week did you go to a social event before the COVID-19 pandemic? | ordinal variable | 1 | seldom | 275 | 67.6 | 0 | 1 | 1 |
| 2 | occasionally | 86 | 21.1 | ||||||
| 3 | sometimes | 36 | 8.8 | ||||||
| 4 | often | 10 | 2.5 | ||||||
| 9 | How many times a week did you go on a family visit before the COVID-19 pandemic? | ordinal variable | 1 | seldom | 192 | 47.2 | 0 | 2 | 1 |
| 2 | occasionally | 100 | 24.6 | ||||||
| 3 | sometimes | 69 | 17.0 | ||||||
| 4 | often | 46 | 11.3 | ||||||
| 10 | How many times a week did you go for a walk in nature before the COVID-19 pandemic? | ordinal variable | 1 | seldom | 140 | 34.4 | 0 | 2 | 1 |
| 2 | occasionally | 125 | 30.7 | ||||||
| 3 | sometimes | 82 | 20.1 | ||||||
| 4 | often | 60 | 14.7 | ||||||
| 11 | How many times a week have you attended school during the COVID-19 pandemic? | ordinal variable | 1 | seldom | 346 | 85.0 | 0 | 1 | 1 |
| 2 | occasionally | 27 | 6.6 | ||||||
| 3 | sometimes | 14 | 3.4 | ||||||
| 4 | often | 20 | 4.9 | ||||||
| 12 | How many times a week have you gone to work during the COVID-19 pandemic? | ordinal variable | 1 | seldom | 235 | 57.7 | 0 | 1 | 1 |
| 2 | occasionally | 37 | 9.1 | ||||||
| 3 | sometimes | 35 | 8.6 | ||||||
| 4 | often | 100 | 24.6 | ||||||
| 13 | How many times a week have you done shopping during the COVID-19 pandemic? | ordinal variable | 1 | seldom | 225 | 55.3 | 0 | 1 | 1 |
| 2 | occasionally | 112 | 27.5 | ||||||
| 3 | sometimes | 35 | 8.68 | ||||||
| 4 | often | 35 | 8.6 | ||||||
| 14 | How many times a week have you gone to the doctor during the COVID-19 pandemic? | ordinal variable | 1 | seldom | 371 | 91.2 | 0 | 1 | 1 |
| 2 | occasionally | 26 | 6.4 | ||||||
| 3 | sometimes | 4 | 1.0 | ||||||
| 4 | often | 6 | 1.5 | ||||||
| 15 | How many times a week have you gone to a social event during the COVID-19 pandemic? | ordinal variable | 1 | seldom | 388 | 95.3 | 0 | 1 | 1 |
| 2 | occasionally | 12 | 2.9 | ||||||
| 3 | sometimes | 3 | 0.7 | ||||||
| 4 | often | 4 | 1.0 | ||||||
| 16 | How many times a week have you gone on a family visit during the COVID-19 pandemic? | ordinal variable | 1 | seldom | 305 | 74.9 | 0 | 1 | 1 |
| 2 | occasionally | 59 | 14.5 | ||||||
| 3 | sometimes | 19 | 4.7 | ||||||
| 4 | often | 24 | 5.9 | ||||||
| 17 | How many times a week have you gone for a walk in nature during the COVID-19 pandemic? | ordinal variable | 1 | seldom | 146 | 35.9 | 0 | 2 | 1 |
| 2 | occasionally | 99 | 24.3 | ||||||
| 3 | sometimes | 70 | 17.2 | ||||||
| 4 | often | 92 | 22.6 | ||||||
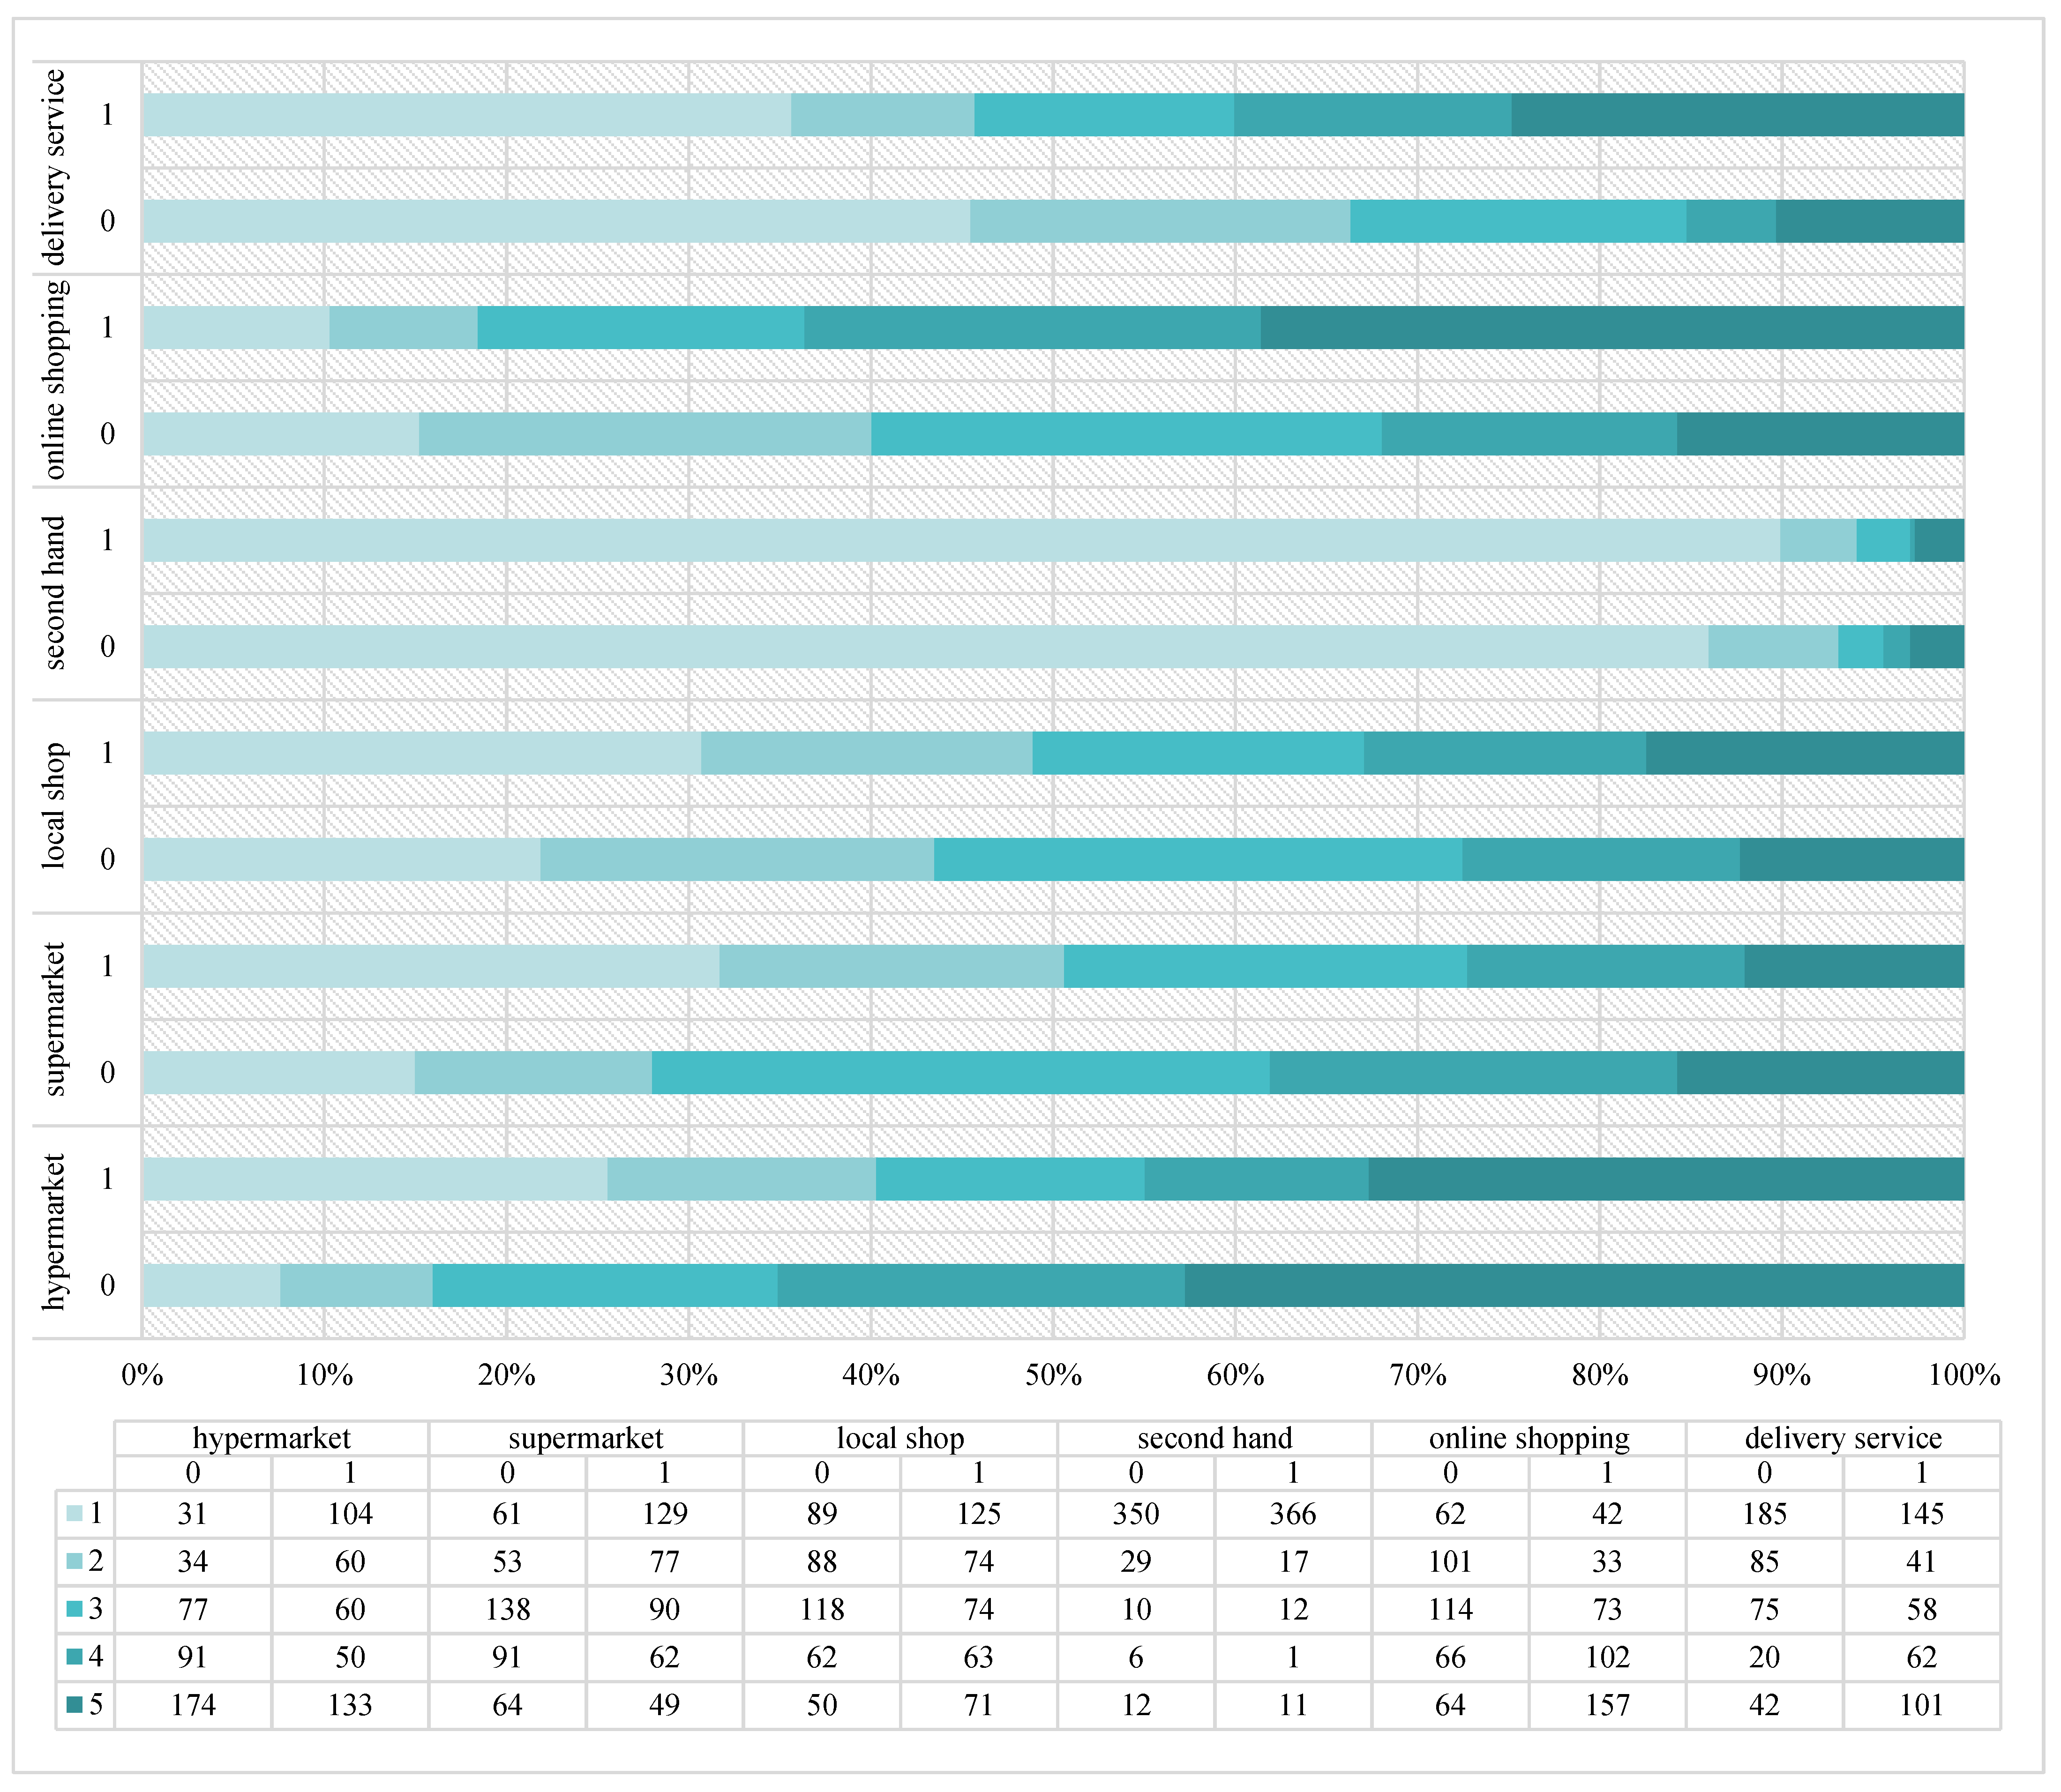
| 18 | What was your preference for shopping before the COVID-19 pandemic? (hypermarket) | ordinal variable | 1 | definitely/rather not preferred | 65 | 16.0 | 0 | 3 | 3 |
| 2 | neither nor | 77 | 18.9 | ||||||
| 3 | definitely/rather preferred | 265 | 65.1 | ||||||
| 19 | What was your preference for shopping before the COVID-19 pandemic? (supermarket) | ordinal variable | 1 | definitely/rather not preferred | 114 | 28.0 | 0 | 2 | 3 |
| 2 | neither nor | 138 | 33.9 | ||||||
| 3 | definitely/rather preferred | 155 | 38.1 | ||||||
| 20 | What was your preference for shopping before the COVID-19 pandemic? (local shop) | ordinal variable | 1 | definitely/rather not preferred | 177 | 43.5 | 0 | 2 | 1 |
| 2 | neither nor | 118 | 29.0 | ||||||
| 3 | definitely/rather preferred | 112 | 27.5 | ||||||
| 21 | What was your preference for shopping before the COVID-19 pandemic? (second hand) | ordinal variable | 1 | definitely/rather not preferred | 379 | 93.1 | 0 | 1 | 1 |
| 2 | neither nor | 10 | 2.5 | ||||||
| 3 | definitely/rather preferred | 18 | 4.4 | ||||||
| 22 | What was your preference for shopping before the COVID-19 pandemic? (online shopping) | ordinal variable | 1 | definitely/rather not preferred | 163 | 40.0 | 0 | 2 | 1 |
| 2 | neither nor | 114 | 28.0 | ||||||
| 3 | definitely/rather preferred | 130 | 31.9 | ||||||
| 23 | What was your preference for shopping before the COVID-19 pandemic? (delivery service) | ordinal variable | 1 | definitely/rather not preferred | 270 | 66.3 | 0 | 1 | 1 |
| 2 | neither nor | 75 | 18.4 | ||||||
| 3 | definitely/rather preferred | 62 | 15.2 | ||||||
| 24 | What is your preference for shopping during the COVID-19 pandemic? (hypermarket) | ordinal variable | 1 | definitely/rather not preferred | 164 | 40.3 | 0 | 2 | 3 |
| 2 | neither nor | 60 | 14.7 | ||||||
| 3 | definitely/rather preferred | 183 | 45.0 | ||||||
| 25 | What is your preference for shopping during the COVID-19 pandemic? (supermarket) | ordinal variable | 1 | definitely/rather not preferred | 206 | 50.6 | 0 | 1 | 1 |
| 2 | neither nor | 90 | 22.1 | ||||||
| 3 | definitely/rather preferred | 111 | 27.3 | ||||||
| 26 | What is your preference for shopping during the COVID-19 pandemic? (local shop) | ordinal variable | 1 | definitely/rather not preferred | 199 | 48.9 | 0 | 2 | 1 |
| 2 | neither nor | 74 | 18.2 | ||||||
| 3 | definitely/rather preferred | 134 | 32.9 | ||||||
| 27 | What is your preference for shopping during the COVID-19 pandemic? (second hand) | ordinal variable | 1 | definitely/rather not preferred | 383 | 94.1 | 0 | 1 | 1 |
| 2 | neither nor | 12 | 2.9 | ||||||
| 3 | definitely/rather preferred | 12 | 2.9 | ||||||
| 28 | What is your preference for shopping during the COVID-19 pandemic? (online shopping) | ordinal variable | 1 | definitely/rather not preferred | 75 | 18.4 | 0 | 3 | 3 |
| 2 | neither nor | 73 | 17.9 | ||||||
| 3 | definitely/rather preferred | 259 | 63.6 | ||||||
| 29 | What is your preference for shopping during the COVID-19 pandemic? (delivery service) | ordinal variable | 1 | definitely/rather not preferred | 186 | 45.7 | 0 | 2 | 1 |
| 2 | neither nor | 58 | 14.3 | ||||||
| 3 | definitely/rather preferred | 163 | 40.0 | ||||||
References
- Chan, H.F.; Skali, A.; Savage, D.A.; Stadelmann, D.; Torgler, B. Risk attitudes and human mobility during the COVID-19 pandemic. Sci. Rep. 2020, 10, 19931. [Google Scholar] [CrossRef] [PubMed]
- Jenelius, E.; Cebecauer, M. Impacts of COVID-19 on public transport ridership in Sweden: Analysis of ticket validations, sales and passenger counts. Transp. Res. Interdiscip. Perspect. 2020, 8, 100242. [Google Scholar] [CrossRef] [PubMed]
- Huang, C.; Wang, Y.; Li, X.; Ren, L.; Zhao, J.; Hu, Y.; Zhang, L.; Fan, G.; Xu, J.; Gu, X.; et al. Clinical features of patients infected with 2019 novel coronavirus in Wuhan, China. Lancet 2020, 395, 497–506. [Google Scholar] [CrossRef] [Green Version]
- ECDC. Timeline of ECDC’s Reponse Response to COVID-19. Available online: https://www.ecdc.europa.eu/en/covid-19/timelineecdc-response (accessed on 10 January 2022).
- Word Health Organization (WHO). Novel Coronavirus (2019-nCoV) Situation Report—11. Available online: https://www.who.int/docs/defaultsource/coronaviruse/situation-reports/20200131-sitrep-11-ncov.pdf?sfvrsn=de7c0f7_4 (accessed on 28 November 2021).
- Wu, Y.; Pu, C.; Li, L.; Zhang, G. Traffic-driven epidemic spreading and its control strategies. Digit. Commun. Netw. 2019, 5, 56–61. [Google Scholar] [CrossRef]
- Borkowski, P.; Jażdżewska-Gutta, M.; Szmelter-Jarosz, A. Lockdowned: Everyday mobility changes in response to COVID-19. J. Transp. Geogr. 2021, 90, 102906. [Google Scholar] [CrossRef]
- Chong, K.C.; Zee, B.C.Y. Modeling the impact of air, sea, and land travel restrictions supplemented by other interventions on the emergence of a new influenza pandemic virus. BMC Infect. Dis. 2012, 12, 309. [Google Scholar] [CrossRef] [Green Version]
- Brockmann, D.; David, V.; Gallardo, A.M. Human mobility and spatial disease dynamics. Rev. Nonlinear Dyn. Complex. 2009, 2, 1–24. [Google Scholar] [CrossRef]
- Poletto, C.; Tizzoni, M.; Colizza, V. Human mobility and time spent at destination: Impact on spatial epidemic spreading. J. Theor. Biol. 2013, 338, 41–58. [Google Scholar] [CrossRef] [Green Version]
- Yang, X.-H.; Wang, B.; Chen, S.-Y.; Wang, W.-L. Epidemic dynamics behavior in some bus transport networks. Phys. A Stat. Mech. Its Appl. 2012, 391, 917–924. [Google Scholar] [CrossRef]
- Germann, T.C.; Kadau, K.; Longini, I.M.; Macken, C.A. Mitigation strategies for pandemic influenza in the United States. Proc. Natl. Acad. Sci. USA 2006, 103, 5935–5940. [Google Scholar] [CrossRef] [Green Version]
- Aguiléra, A.; Gébert, J. Passenger transport mode share in cities: Exploration of actual and future trends with a worldwide survey. Int. J. Automot. Technol. Manag. 2014, 14, 203–216. [Google Scholar] [CrossRef]
- Puello, L.L.P.; Chowdhury, S.; Geurs, K. Using panel data for modelling duration dynamics of outdoor leisure activities. J. Choice Model. 2019, 31, 141–155. [Google Scholar] [CrossRef]
- Hussein, T.; Löndahl, J.; Thuresson, S.; Alsved, M.; Al-Hunaiti, A.; Saksela, K.; Aqel, H.; Junninen, H.; Mahura, A.; Kulmala, M. Indoor Model Simulation for COVID-19 Transport and Exposure. Int. J. Environ. Res. Public Health 2021, 18, 2927. [Google Scholar] [CrossRef] [PubMed]
- Poliak, M.; Poliaková, A.; Čulík, K. Impact of the Social Law on Truck Parking Sustainability in the EU. Sustainability 2020, 12, 9430. [Google Scholar] [CrossRef]
- Lee, J.; Baig, F.; Pervez, A. Impacts of COVID-19 on individual’s mobility behavior in Pakistan based on self-reported responses. J. Transp. Health 2021, 22, 101228. [Google Scholar] [CrossRef] [PubMed]
- Lawal, O.; Nwegbu, C. Movement and risk perception: Evidence from spatial analysis of mobile phone-based mobility during the COVID-19 lockdown, Nigeria. GeoJournal 2020, 2, 1–16. [Google Scholar] [CrossRef]
- Klompas, M.; Baker, M.A.; Rhee, C. Airborne transmission of SARS-CoV-2: Theoretical considerations and available evidence. J. Am. Med. Assoc. 2020, 324, 441–442. [Google Scholar] [CrossRef]
- Kraemer, M.U.G.; Yang, C.-H.; Gutierrez, B.; Wu, C.-H.; Klein, B.; Pigott, D.M.; Open COVID-19 Data Working Group; du Plessis, L.; Faria, N.R.; Li, R.; et al. The effect of human mobility and control measures on the COVID-19 epidemic in China. Science 2020, 368, 493–497. [Google Scholar] [CrossRef] [Green Version]
- <monospace>Chinazzi, M.; Davis, J.T.; Ajelli, M.; Gioannini, C.; Litvinova, M.; Merler, S.; Pastore y Piontti, A.; Mu, K.; Rossi, L.; Sun, K.; et al. The effect of travel restrictions on the spread of the 2019 novel coronavirus (COVID-19) outbreak. Science 2020, 368, 395–400. [Google Scholar] [CrossRef] [Green Version]
- Cui, Z.; Meixin, Z.; Shuo, W.; Pengfei, W.; Yang, Z.; Qianxia, C.; Cole, K.; Yinhai, W. Traffic performance score for measuring the impact of covid-19 on urban mobility. arXiv 2020, arXiv:2007.00648. [Google Scholar] [CrossRef]
- Heiler, G.; Reisch, T.; Hurt, J.; Forghani, M.; Omani, A.; Hanbury, A.; Karimipour, F. Country-wide mobility changes ob-served using mobile phone data during COVID-19 pandemic. In Proceedings of the 2020 IEEE International Conference on Big Data (Big Data), Altanta, GA, USA, 10–13 December 2020; pp. 3123–3132. [Google Scholar] [CrossRef]
- Sheth, J. Impact of Covid-19 on consumer behavior: Will the old habits return or die? J. Bus. Res. 2020, 117, 280–283. [Google Scholar] [CrossRef] [PubMed]
- Hesham, F.; Riadh, H.; Sihem, N. What Have We Learned about the Effects of the COVID-19 Pandemic on Consumer Behavior? Sustainability 2021, 13, 4304. [Google Scholar] [CrossRef]
- Roșu, M.-M.; Ianole-Călin, R.; Dinescu, R.; Bratu, A.; Papuc, R.-M.; Cosma, A. Understanding Consumer Stockpiling during the COVID-19 Outbreak through the Theory of Planned Behavior. Mathematics 2021, 9, 1950. [Google Scholar] [CrossRef]
- Ahmadi, I.; Habel, J.; Jia, M.; Wei, S. Consumer stockpiling under the impact of a global disaster: The evolution of affective and cognitive motives. J. Bus. Res. 2021, 142, 56–71. [Google Scholar] [CrossRef]
- Koch, J.; Frommeyer, B.; Schewe, G. Online Shopping Motives during the COVID-19 Pandemic—Lessons from the Crisis. Sustainability 2020, 12, 10247. [Google Scholar] [CrossRef]
- Loxton, M.; Truskett, R.; Scarf, B.; Sindone, L.; Baldry, G.; Zhao, Y. Consumer behaviour during crises: Preliminary research on how coronavirus has manifested consumer panic buying, herd mentality, changing discretionary spending and the role of the media in influencing behaviour. J. Risk Financ. Manag. 2020, 13, 166. [Google Scholar] [CrossRef]
- Schmidt, S.; Benke, C.; Pané-Farré, C.A. Purchasing under threat: Changes in shopping patterns during the COVID-19 pandemic. PLoS ONE 2021, 16, e0253231. [Google Scholar] [CrossRef]
- Gerritsen, S.; Egli, V.; Roy, R.; Haszard, J.; De Backer, C.; Teunissen, L.; Cuykx, I.; Decorte, P.; Pabian, S.P.; Van Royen, K.; et al. Seven weeks of home-cooked meals: Changes to New Zealanders’ grocery shopping, cooking and eating during the COVID-19 lockdown. J. R. Soc. N. Z. 2021, 51 (Suppl. 1), S4–S22. [Google Scholar] [CrossRef]
- Janssen, M.; Chang, B.P.I.; Hristov, H.; Pravst, I.; Profeta, A.; Millard, J. Changes in Food Consumption During the COVID-19 Pandemic: Analysis of Consumer Survey Data From the First Lockdown Period in Denmark, Germany, and Slovenia. Front. Nutr. 2021, 8, 635859. [Google Scholar] [CrossRef]
- Szocska, M.; Pollner, P.; Schiszler, I.; Joo, T.; Palicz, T.; McKee, M.; Asztalos, A.; Bencze, L.; Kapronczay, M.; Petrecz, P.; et al. Countrywide population movement monitoring using mobile devices generated (big) data during the COVID-19 crisis. Sci. Rep. 2021, 11, 5943. [Google Scholar] [CrossRef]
- Huang, X.; Li, Z.; Jiang, Y.; Ye, X.; Deng, C.; Zhang, J.; Li, X. The characteristics of multi-source mobility datasets and how they reveal the luxury nature of social distancing in the U.S. during the COVID-19 pandemic. Int. J. Digit. Earth 2021, 14, 424–442. [Google Scholar] [CrossRef]
- Brownstein, J.S.; Freifeld, C.C.; Madoff, L.C. Digital Disease Detection—Harnessing the Web for Public Health Surveillance. N. Engl. J. Med. 2009, 360, 2153–2157. [Google Scholar] [CrossRef] [PubMed] [Green Version]
- Cot, C.; Cacciapaglia, G.; Sannino, F. Mining Google and Apple mobility data: Temporal anatomy for COVID-19 social distancing. Sci. Rep. 2021, 11, 4150. [Google Scholar] [CrossRef] [PubMed]
- European Commission: Commission Recommendation (EU) on a Common Union Toolbox for the Use of Technology and Data to Combat and Exit from the Covid-19 Crisis, in Particular Concerning Mobile Applications and the Use of Anonymised Mobility Data, 2020/518. Available online: https://op.europa.eu/en/publication-detail/-/publication/1e8b1520-7e0c-11ea-aea8-01aa75ed71a1/language-en (accessed on 15 December 2021).
- Citymapper. Mobility in Selected Cities between March 3, 2020, and June 1, 2021, Compared with Movement Prior to the Coronavirus Outbreak. Statista Inc. 2021. Available online: https://www.statista.com/statistics/1106798/change-in-traffic-volume-amid-coronavirus-crisis-selected-cities (accessed on 15 December 2021).
- Gupta, M.; Pawar, N.M.; Velaga, N.R. Impact of lockdown and change in mobility patterns on road fatalities during COVID-19 pandemic. Transp. Lett. 2021, 13, 447–460. [Google Scholar] [CrossRef]
- Below, D.; Mairanowski, F. The impact of vaccination on the spread patterns of the COVID epidemic. medRxiv 2021. [Google Scholar] [CrossRef]
- Warren, M.S.; Skillman, S.W. Mobility changes in response to COVID-19. arXiv 2020, arXiv:2003.14228. [Google Scholar]
- Huang, X.; Li, Z.; Jiang, Y.; Li, X.; Porter, D. Twitter reveals human mobility dynamics during the COVID-19 pandemic. PLoS ONE 2020, 15, e0241957. [Google Scholar] [CrossRef]
- Konečný, V.; Brídziková, M.; Senko, Š. Impact of COVID-19 and Anti-Pandemic Measures on the Sustainability of Demand in Suburban Bus Transport. The Case of the Slovak Republic. Sustainability 2021, 13, 4967. [Google Scholar] [CrossRef]
- Taherdoost, H. Determining sample size; how to calculate survey sample size. Int. J. Econ. Manag.-Ment Syst. 2017, 2, 3. Available online: https://ssrn.com/abstract=3224205 (accessed on 18 March 2020).
- Wang, X.; Ji, X. Sample size estimation in clinic research: Od randomized controlled trials to observational studies. Chest 2020, 158, S12–S20. [Google Scholar] [CrossRef]
- Hemming, K.; Kasza, J.; Hooper, R.; Forbes, A.; Taljaard, M. A tutorial on sample size calculation for multiple-period cluster randomized parallel, cross-over and stepped-wedge trials using the Shiny CRT Calculator. Int. J. Epidemiol. 2020, 49, 979–995. [Google Scholar] [CrossRef]
- Gnap, J.; Kupčuljaková, J.; Černický, Ľ.; Dydkowski, G. The Transport Service of Small Towns. Commun.-Sci. Lett. Univ. Zilina 2021, 23, A21–A31. [Google Scholar] [CrossRef]
- Hanada, M. Using Japanese Onomatopoeias to Explore Perceptual Dimensions in Visual Material Perception. Perception 2016, 45, 568–587. [Google Scholar] [CrossRef] [PubMed]
- Ali, F.; Dissanayake, D.; Bell, M.; Farrow, M. Investigating car users’ attitudes to climate change using multiple correspondence analysis. J. Transp. Geogr. 2018, 72, 237–247. [Google Scholar] [CrossRef]
- Bieliński, T.; Dopierała, Ł.; Tarkowski, M.; Ważna, A. Lessons from Implementing a Metropolitan Electric Bike Sharing System. Energies 2020, 13, 6240. [Google Scholar] [CrossRef]
- Scacchi, A.; Catozzi, D.; Boietti, E.; Bert, F.; Siliquini, R. COVID-19 Lockdown and Self-Perceived Changes of Food Choice, Waste, Impulse Buying and Their Determinants in Italy: QuarantEat, a Cross-Sectional Study. Foods 2020, 10, 306. [Google Scholar] [CrossRef]
- Jribi, S.; Ben Ismail, H.; Doggui, D.; Debbabi, H. COVID-19 virus outbreak lockdown: What impacts on household food wastage? Environ. Dev. Sustain. 2020, 22, 3939–3955. [Google Scholar] [CrossRef] [Green Version]
- Laguna, L.; Fiszman, S.; Puerta, P.; Chaya, C.; Tárrega, A. The impact of COVID-19 lockdown on food priorities. Results from a preliminary study using social media and an online survey with Spanish consumers. Food Qual. Prefer. 2020, 86, 104028. [Google Scholar] [CrossRef]
- Li, S.; Kallas, Z.; Rahmani, D.; Gil, J.M. Trends in Food Preferences and Sustainable Behavior during the COVID-19 Lockdown: Evidence from Spanish Consumers. Foods 2021, 10, 1898. [Google Scholar] [CrossRef]
- Shamim, K.; Ahmad, S.; Alam, A. COVID-19 health safety practices: Influence on grocery shopping behavior. J. Public Aff. 2021, 21, e2624. [Google Scholar] [CrossRef]
- Chang, H.; Meyerhoefer, C.D. COVID-19 and the Demand for Online Food Shopping Services: Empirical Evidence from Taiwan. Am. J. Agric. Econ. 2021, 103, 448–465. [Google Scholar] [CrossRef]
- Wang, X.; Sun, S.; Zhang, B.; Han, J. Solar heating to inactivate thermal-sensitive pathogenic microorganisms in vehicles: Application to COVID-19. Environ. Chem. Lett. 2021, 19, 1765–1772. [Google Scholar] [CrossRef]
- Kubaľák, S.; Kalašová, A.; Hájnik, A. The Bike-Sharing System in Slovakia and the Impact of COVID-19 on This Shared Mobility Service in a Selected City. Sustainability 2021, 13, 6544. [Google Scholar] [CrossRef]
- Hunter, R.F.; Garcia, L.; de Sa, T.H.; Zapata-Diomedi, B.; Millett, C.; Woodcock, J.; Pentland, A.; Moro, E. Effect of COVID-19 response policies on walking behavior in US cities. Nat. Commun. 2021, 12, 3652. [Google Scholar] [CrossRef] [PubMed]
- Rajabifard, A.; Paez, D.; Foliente, G. COVID-19 Pandemic, Geospatial Information, and Community Resilience: Global Applications and Lessons; Taylor & Francis: Abingdon, UK, 2021; p. 544. [Google Scholar]
- Abdullah, M.; Ali, N.; Aslam, A.B.; Javid, M.A.; Hussain, S.A. Factors affecting the mode choice behavior before and during COVID-19 pandemic in Pakistan. Int. J. Transp. Sci. Technol. 2021, 11, 174–186. [Google Scholar] [CrossRef]
- Przybylowski, A.; Stelmak, S.; Suchanek, M. Mobility Behaviour in View of the Impact of the COVID-19 Pandemic—Public Transport Users in Gdansk Case Study. Sustainability 2021, 13, 364. [Google Scholar] [CrossRef]
- Campisi, T.; Basbas, S.; Al-Rashid, M.A.; Tesoriere, G.; Georgiadis, G. A region-wide survey on emotional and psychological impacts of COVID-19 on public transport choices in Sicily, Italy. Trans. Transp. Sci. 2021, 12, 34–43. [Google Scholar] [CrossRef]
- Tian, H.; Liu, Y.; Li, Y.; Wu, C.-H.; Chen, B.; Kraemer, M.U.G.; Li, B.; Cai, J.; Xu, B.; Yang, Q.; et al. An investigation of transmission control measures during the first 50 days of the COVID-19 epidemic in China. Science 2020, 368, 638–642. [Google Scholar] [CrossRef] [Green Version]
- Florida, R.; Glaeser, E.; Sharif, M.M.; Bedi, K.; Campanella, T.J.; Chee, C.H.; Sadik-Khan, J. How life in our cities will look after the coronavirus pandemic. Foreign Policy 2020, 1. Available online: https://foreignpolicy.com/2020/05/01/future-of-cities-urban-life-aftercoronavirus-pandemic/ (accessed on 11 July 2021).
- Bohman, H.; Ryan, J.; Stjernborg, V.; Nilsson, D. A study of changes in everyday mobility during the Covid-19 pandemic: As perceived by people living in Malmö, Sweden. Transp. Policy 2020, 106, 109–119. [Google Scholar] [CrossRef]
- Toger, M.; Kourtit, K.; Nijkamp, P.; Östh, J. Mobility during the COVID-19 Pandemic: A Data-Driven Time-Geographic Analysis of Health-Induced Mobility Changes. Sustainability 2021, 13, 4027. [Google Scholar] [CrossRef]
- Gasparik, J.; Dedik, M.; Cechovic, L.; Blaho, P. Estimation of Transport Potential in Regional Rail Passenger Transport by Using the Innovative Mathematical-Statistical Gravity Approach. Sustainability 2020, 12, 3821. [Google Scholar] [CrossRef]
- Pérez-Arnal, R.; Conesa, D.; Alvarez-Napagao, S.; Suzumura, T.; Català, M.; Alvarez-Lacalle, E.; Garcia-Gasulla, D. Comparative Analysis of Geolocation Information through Mobile-Devices under Different COVID-19 Mobility Restriction Patterns in Spain. ISPRS Int. J. Geo-Inf. 2020, 10, 73. [Google Scholar] [CrossRef]
- Barbieri, D.M.; Lou, B.; Passavanti, M.; Hui, C.; Hoff, I.; Lessa, D.A.; Sikka, G.; Chang, K.; Gupta, A.; Fang, K.; et al. Impact of COVID-19 pandemic on mobility in ten countries and associated perceived risk for all transport modes. PLoS ONE 2021, 16, e0245886. [Google Scholar] [CrossRef] [PubMed]
- Yelamanchili, R.; Wukadada, B.; Jain, A.; Pathak, P. A study on consumers attitude towards online grocery shopping in COVID-19 pandemic. Acad. Mark. Stud. J. 2021, 25, 1–9. Available online: https://www.proquest.com/scholarly-journals/study-on-consumers-attitude-towards-online/docview/2585993902/se-2?accountid=49401 (accessed on 26 October 2021).
- Bukhari, A.; Akram, M.; Hayat, A. University Student’s Behavior Towards Online Shopping during COVID-19 Pandemic in Lahore, Pakistan. Multicult. Educ. 2021, 7, 379–386. [Google Scholar] [CrossRef]
- Cranfield, J.A.L. Framing consumer food demand responses in a viral pandemic. Can. J. Agric. Econ. Can. D’agroeconomie 2020, 68, 151–156. [Google Scholar] [CrossRef]
- Skotnicka, M.; Karwowska, K.; Kłobukowski, F.; Wasilewska, E.; Małgorzewicz, S. Dietary Habits before and during the COVID-19 Epidemic in Selected European Countries. Nutrients 2021, 13, 1690. [Google Scholar] [CrossRef]
- Nicewicz, R.; Bilska, B. Analysis of Changes in Shopping Habits and Causes of Food Waste among Consumers Before and During the COVID-19 Pandemic in Poland. Environ. Prot. Nat. Resour. 2021, 32, 8–19. [Google Scholar] [CrossRef]
- Valaskova, K.; Durana, P.; Adamko, P. Changes in Consumers’ Purchase Patterns as a Consequence of the COVID-19 Pandemic. Mathematics 2021, 9, 1788. [Google Scholar] [CrossRef]
- Jensen, K.L.; Yenerall, J.; Chen, X.; Yu, T.E. US Consumers’ Online Shopping Behaviors and Intentions During and After the COVID-19 Pandemic. J. Agric. Appl. Econ. 2021, 53, 416–434. [Google Scholar] [CrossRef]


| Gender | Status | Total | |||||||
|---|---|---|---|---|---|---|---|---|---|
| Student | Businessman | Employee | Unemployed | Retiree | Other | ||||
| Male | Education | Basic education | 3 | 0 | 0 | 0 | 0 | 0 | 3 |
| Secondary education | 18 | 2 | 12 | 0 | 0 | 0 | 32 | ||
| University education | 26 | 4 | 120 | 0 | 5 | 3 | 158 | ||
| No reply | 1 | 0 | 0 | 0 | 0 | 0 | 1 | ||
| Total | 48 | 6 | 132 | 0 | 5 | 3 | 194 | ||
| Female | Education | Basic education | 5 | 0 | 0 | 0 | 0 | 0 | 5 |
| Secondary education | 8 | 0 | 24 | 2 | 5 | 0 | 39 | ||
| University education | 22 | 6 | 135 | 1 | 5 | 0 | 169 | ||
| Total | 35 | 6 | 159 | 3 | 10 | 0 | 213 | ||
| Total | Education | Basic education | 8 | 0 | 0 | 0 | 0 | 0 | 8 |
| Secondary education | 26 | 2 | 36 | 2 | 5 | 0 | 71 | ||
| University education | 48 | 10 | 255 | 1 | 10 | 3 | 327 | ||
| No reply | 1 | 0 | 0 | 0 | 0 | 0 | 1 | ||
| Total | 83 | 12 | 291 | 3 | 15 | 3 | 407 | ||
| No. | Hypothesis | p-Value |
|---|---|---|
| # | Frequency of school visits per week and shopping preferences | |
| 1 | There is a significant association between the frequency of school visits per week and the consumer’s preference for shopping in the hypermarket. | >0.05 |
| 2 | There is a significant association between the frequency of school visits per week and the consumer’s preference for shopping in the supermarket. | 0.032 |
| 3 | There is a significant association between the frequency of school visits per week and the consumer’s preference for shopping in the local shop. | >0.05 |
| 4 | There is a significant association between the frequency of school visits per week and the consumer’s preference for shopping in a second-hand shop. | >0.05 |
| 5 | There is a significant association between the frequency of school visits per week and the consumer’s preference for online shopping. | >0.05 |
| 6 | There is a significant association between the frequency of school visits and the consumer’s preference for shopping through the delivery service. | >0.05 |
| # | Frequency of work visits per week and shopping preferences | |
| 7 | There is a significant association between the frequency of work visits per week and the consumer’s preference for shopping in the hypermarket. | >0.05 |
| 8 | There is a significant association between the frequency of work visits per week and the consumer’s preference for shopping in the supermarket. | >0.05 |
| 9 | There is a significant association between the frequency of work visits per week and the consumer’s preference for shopping in the local shop. | >0.05 |
| 10 | There is a significant association between the frequency of work visits per week and the consumer’s preference for shopping in a second-hand shop. | >0.05 |
| 11 | There is a significant association between the frequency of work visits per week and the consumer’s preference for online shopping. | >0.05 |
| 12 | There is a significant association between the frequency of work visits per week and the consumer’s preference for shopping through the delivery service. | 0.006 |
| 13 | There is a significant association between the frequency of shopping per week and the consumer’s preference for shopping in the hypermarket. | 0.034 |
| # | Frequency of shopping per week and shopping preferences | |
| 14 | There is a significant association between the frequency of shopping per week and the consumer’s preference for shopping in the supermarket. | 0.000 |
| 15 | There is a significant association between the frequency of shopping per week and the consumer’s preference for shopping in the local shop. | >0.05 |
| 16 | There is a significant association between the frequency of shopping per week and the consumer’s preference for shopping in a second-hand shop. | >0.05 |
| 17 | There is a significant association between the frequency of shopping per week and the consumer’s preference for online shopping. | 0.042 |
| 18 | There is a significant association between the frequency of shopping per week and the consumer’s preference for shopping through the delivery service. | >0.05 |
| # | Frequency of hospital visits per week and shopping preferences | |
| 19 | There is a significant association between the frequency of hospital visits per week and the consumer’s preference for shopping in the hypermarket. | >0.05 |
| 20 | There is a significant association between the frequency of hospital visits per week and the consumer’s preference for shopping in the supermarket. | >0.05 |
| 21 | There is a significant association between the frequency of hospital visits per week and the consumer’s preference for shopping in the local shop. | >0.05 |
| 22 | There is a significant association between the frequency of hospital visits per week and the consumer’s preference for shopping in a second-hand shop. | >0.05 |
| 23 | There is a significant association between the frequency of hospital visits per week and the consumer’s preference for online shopping. | >0.05 |
| 24 | There is a significant association between the frequency of hospital visits per week and the consumer’s preference for shopping through the delivery service. | >0.05 |
| # | Frequency of social events per week and shopping preferences | |
| 25 | There is a significant association between the frequency of social events per week and the consumer’s preference for shopping in the hypermarket. | >0.05 |
| 26 | There is a significant association between the frequency of social events per week and the consumer’s preference for shopping in the supermarket. | >0.05 |
| 27 | There is a significant association between the frequency of social events per week and the consumer’s preference for shopping in the local shop. | >0.05 |
| 28 | There is a significant association between the frequency of social events per week and the consumer’s preference for shopping in a second-hand shop. | >0.05 |
| 29 | There is a significant association between the frequency of social events per week and the consumer’s preference for online shopping. | >0.05 |
| 30 | There is a significant association between the frequency of social events per week and the consumer’s preference for shopping through the delivery service. | >0.05 |
| # | Frequency of family visits per week and shopping preferences | |
| 31 | There is a significant association between the frequency of family visits per week and the consumer’s preference for shopping in the hypermarket. | >0.05 |
| 32 | There is a significant association between the frequency of family visits per week and the consumer’s preference for shopping in the supermarket. | >0.05 |
| 33 | There is a significant association between the frequency of family visits per week and the consumer’s preference for shopping in the local shop. | >0.05 |
| 34 | There is a significant association between the frequency of family visits per week and the consumer’s preference for shopping in a second-hand shop. | >0.05 |
| 35 | There is a significant association between the frequency of family visits per week and the consumer’s preference for online shopping. | >0.05 |
| 36 | There is a significant association between the frequency of family visits per week and the consumer’s preference for shopping through the delivery service. | >0.05 |
| # | Frequency of walking in nature per week and shopping preferences | |
| 37 | There is a significant association between the frequency of walking in nature per week and the consumer’s preference for shopping in the hypermarket. | >0.05 |
| 38 | There is a significant association between the frequency of walking in nature per week and the consumer’s preference for shopping in the supermarket. | >0.05 |
| 39 | There is a significant association between the frequency of walking in nature per week and the consumer’s preference for shopping in the local shop. | 0.035 |
| 40 | There is a significant association between the frequency of walking in nature per week and the consumer’s preference for shopping in a second-hand shop. | >0.05 |
| 41 | There is a significant association between the frequency of walking in nature per week and the consumer’s preference for online shopping. | >0.05 |
| 42 | There is a significant association between the frequency of walking in nature per week and the consumer’s preference for shopping through the delivery service. | >0.05 |
| No. | Hypothesis | p-Value |
|---|---|---|
| # | Frequency of school visits per week and shopping preferences | |
| 1 | There is a significant association between the frequency of school visits per week and the consumer’s preference for shopping in the hypermarket. | >0.05 |
| 2 | There is a significant association between the frequency of school visits per week and the consumer’s preference for shopping in the supermarket. | >0.05 |
| 3 | There is a significant association between the frequency of school visits per week and the consumer’s preference for shopping in the local shop. | >0.05 |
| 4 | There is a significant association between the frequency of school visits per week and the consumer’s preference for shopping in a second-hand shop. | >0.05 |
| 5 | There is a significant association between the frequency of school visits per week and the consumer’s preference for online shopping. | >0.05 |
| 6 | There is a significant association between the frequency of school visits and the consumer’s preference for shopping through the delivery service. | >0.05 |
| # | Frequency of work visits per week and shopping preferences | |
| 7 | There is a significant association between the frequency of work visits per week and the consumer’s preference for shopping in the hypermarket. | >0.05 |
| 8 | There is a significant association between the frequency of work visits per week and the consumer’s preference for shopping in the supermarket. | >0.05 |
| 9 | There is a significant association between the frequency of work visits per week and the consumer’s preference for shopping in the local shop. | >0.05 |
| 10 | There is a significant association between the frequency of work visits per week and the consumer’s preference for shopping in a second-hand shop. | >0.05 |
| 11 | There is a significant association between the frequency of work visits per week and the consumer’s preference for online shopping. | 0.024 |
| 12 | There is a significant association between the frequency of work visits per week and the consumer’s preference for shopping through the delivery service. | >0.05 |
| 13 | There is a significant association between the frequency of shopping per week and the consumer’s preference for shopping in the hypermarket. | 0.000 |
| # | Frequency of shopping per week and shopping preferences | |
| 14 | There is a significant association between the frequency of shopping per week and the consumer’s preference for shopping in the supermarket. | 0.005 |
| 15 | There is a significant association between the frequency of shopping per week and the consumer’s preference for shopping in the local shop. | >0.05 |
| 16 | There is a significant association between the frequency of shopping per week and the consumer’s preference for shopping in a second-hand shop. | >0.05 |
| 17 | There is a significant association between the frequency of shopping per week and the consumer’s preference for online shopping. | >0.05 |
| 18 | There is a significant association between the frequency of shopping per week and the consumer’s preference for shopping through the delivery service. | 0.028 |
| # | Frequency of hospital visits per week and shopping preferences | |
| 19 | There is a significant association between the frequency of hospital visits per week and the consumer’s preference for shopping in the hypermarket. | >0.05 |
| 20 | There is a significant association between the frequency of hospital visits per week and the consumer’s preference for shopping in the supermarket. | >0.05 |
| 21 | There is a significant association between the frequency of hospital visits per week and the consumer’s preference for shopping in the local shop. | >0.05 |
| 22 | There is a significant association between the frequency of hospital visits per week and the consumer’s preference for shopping in a second-hand shop. | >0.05 |
| 23 | There is a significant association between the frequency of hospital visits per week and the consumer’s preference for online shopping. | >0.05 |
| 24 | There is a significant association between the frequency of hospital visits per week and the consumer’s preference for shopping through the delivery service. | >0.05 |
| # | Frequency of social events per week and shopping preferences | |
| 25 | There is a significant association between the frequency of social events per week and the consumer’s preference for shopping in the hypermarket. | >0.05 |
| 26 | There is a significant association between the frequency of social events per week and the consumer’s preference for shopping in the supermarket. | >0.05 |
| 27 | There is a significant association between the frequency of social events per week and the consumer’s preference for shopping in the local shop. | >0.05 |
| 28 | There is a significant association between the frequency of social events per week and the consumer’s preference for shopping in a second-hand shop. | >0.05 |
| 29 | There is a significant association between the frequency of social events per week and the consumer’s preference for online shopping. | >0.05 |
| 30 | There is a significant association between the frequency of social events per week and the consumer’s preference for shopping through the delivery service. | >0.05 |
| # | Frequency of family visits per week and shopping preferences | |
| 31 | There is a significant association between the frequency of family visits per week and the consumer’s preference for shopping in the hypermarket. | >0.05 |
| 32 | There is a significant association between the frequency of family visits per week and the consumer’s preference for shopping in the supermarket. | 0.004 |
| 33 | There is a significant association between the frequency of family visits per week and the consumer’s preference for shopping in the local shop. | >0.05 |
| 34 | There is a significant association between the frequency of family visits per week and the consumer’s preference for shopping in a second-hand shop. | >0.05 |
| 35 | There is a significant association between the frequency of family visits per week and the consumer’s preference for online shopping. | >0.05 |
| 36 | There is a significant association between the frequency of family visits per week and the consumer’s preference for shopping through the delivery service. | >0.05 |
| # | Frequency of walking in nature per week and shopping preferences | |
| 37 | There is a significant association between the frequency of walking in nature per week and the consumer’s preference for shopping in the hypermarket. | >0.05 |
| 38 | There is a significant association between the frequency of walking in nature per week and the consumer’s preference for shopping in the supermarket. | >0.05 |
| 39 | There is a significant association between the frequency of walking in nature per week and the consumer’s preference for shopping in the local shop. | 0.046 |
| 40 | There is a significant association between the frequency of walking in nature per week and the consumer’s preference for shopping in a second-hand shop. | >0.05 |
| 41 | There is a significant association between the frequency of walking in nature per week and the consumer’s preference for online shopping. | >0.05 |
| 42 | There is a significant association between the frequency of walking in nature per week and the consumer’s preference for shopping through the delivery service. | >0.05 |
Publisher’s Note: MDPI stays neutral with regard to jurisdictional claims in published maps and institutional affiliations. |
© 2022 by the authors. Licensee MDPI, Basel, Switzerland. This article is an open access article distributed under the terms and conditions of the Creative Commons Attribution (CC BY) license (https://creativecommons.org/licenses/by/4.0/).
Share and Cite
Harantová, V.; Kalašová, A.; Skřivánek Kubíková, S.; Mazanec, J.; Jordová, R. The Impact of Mobility on Shopping Preferences during the COVID-19 Pandemic: The Evidence from the Slovak Republic. Mathematics 2022, 10, 1394. https://doi.org/10.3390/math10091394
Harantová V, Kalašová A, Skřivánek Kubíková S, Mazanec J, Jordová R. The Impact of Mobility on Shopping Preferences during the COVID-19 Pandemic: The Evidence from the Slovak Republic. Mathematics. 2022; 10(9):1394. https://doi.org/10.3390/math10091394
Chicago/Turabian StyleHarantová, Veronika, Alica Kalašová, Simona Skřivánek Kubíková, Jaroslav Mazanec, and Radomíra Jordová. 2022. "The Impact of Mobility on Shopping Preferences during the COVID-19 Pandemic: The Evidence from the Slovak Republic" Mathematics 10, no. 9: 1394. https://doi.org/10.3390/math10091394
APA StyleHarantová, V., Kalašová, A., Skřivánek Kubíková, S., Mazanec, J., & Jordová, R. (2022). The Impact of Mobility on Shopping Preferences during the COVID-19 Pandemic: The Evidence from the Slovak Republic. Mathematics, 10(9), 1394. https://doi.org/10.3390/math10091394