
Taylor-ChOA: Taylor-Chimp Optimized Random Multimodal Deep Learning-Based Sentiment Classification Model for Course Recommendation


Abstract
:1. Introduction
2. Related Work
- (a)
- Hierarchical Approach:
- (b)
- Deep Learing Approach:
- (c)
- Query-based Approach:
- (d)
- Other Approaches:
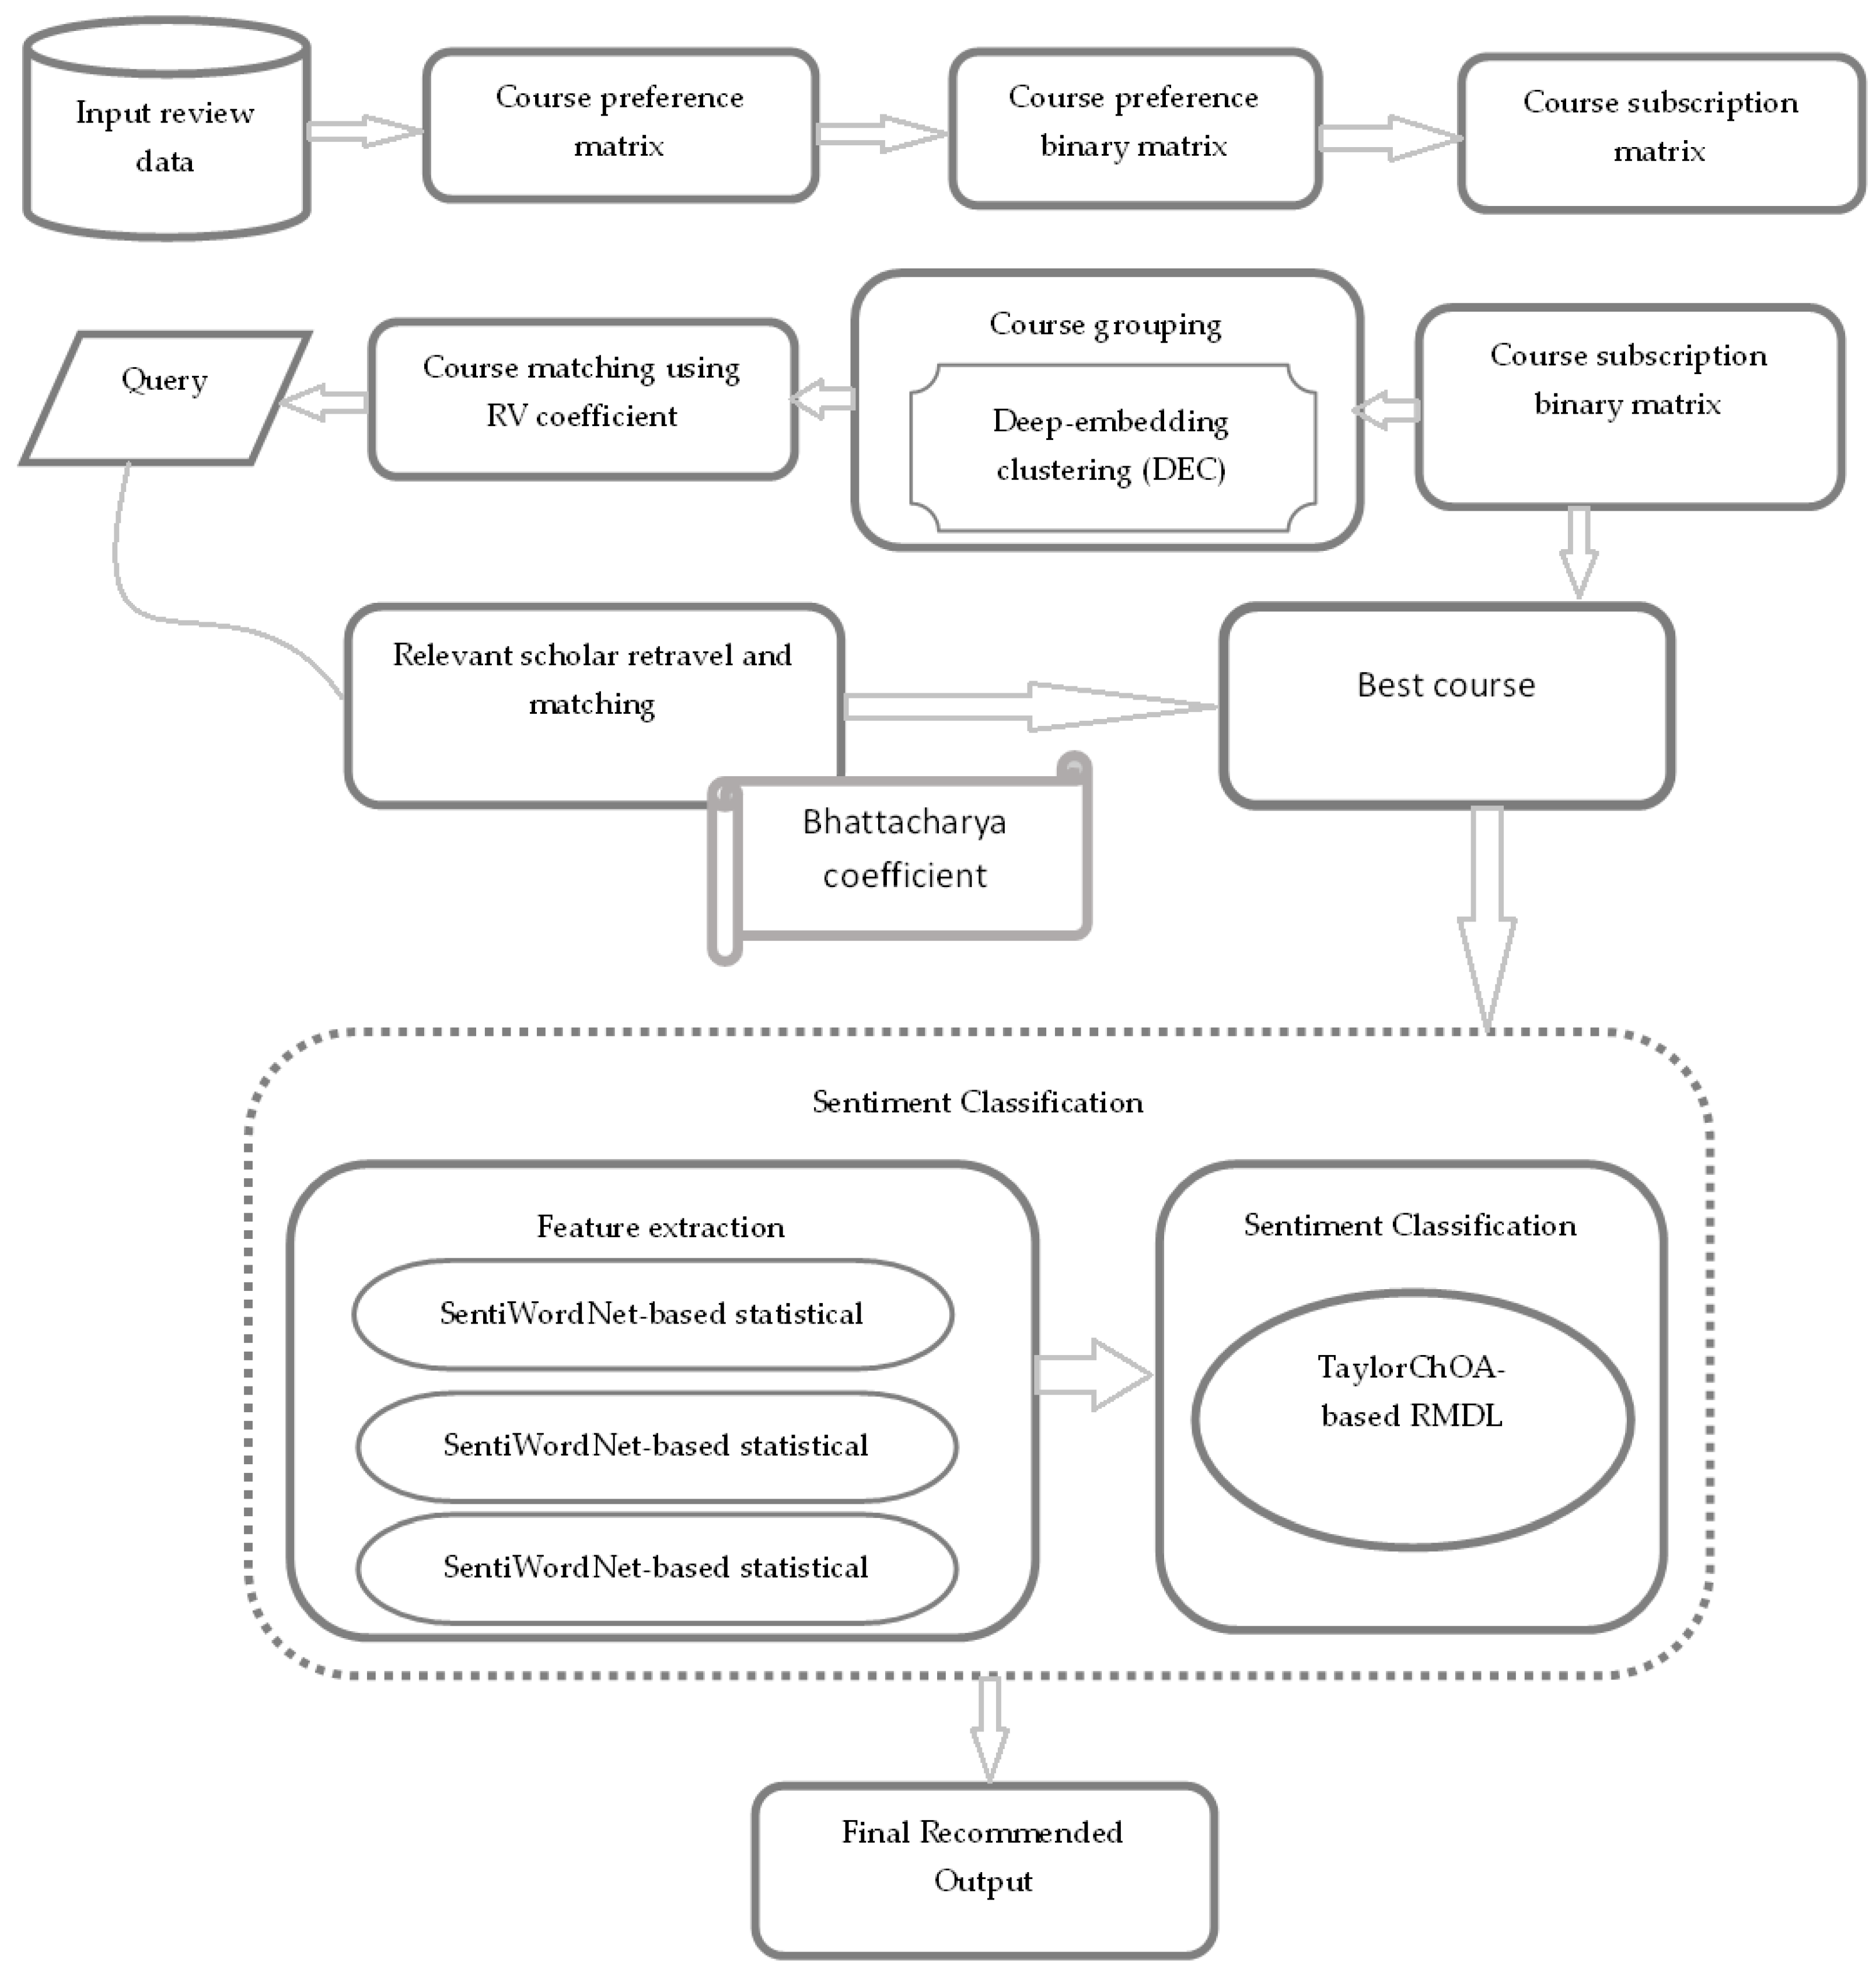
3. Proposed Method
3.1. Acquisition of Input Data
3.2. Matrix Construction
3.3. Course Grouping Using DEC Algorithm
3.4. Course Matching Using RV Coefficient
3.5. Relevant Scholar Retrieval
| Algorithm 1 Pseudo-code of Course Review Framework. |
| Input: UserID: D, ItemID: Parameter course preference matrix, G best-clustered course group, relevant scholar retrieved, n courses in optimal clustered group, course preference binary matrix, n number of scholars, m number of courses, k is the total number of preferred course. Output: Best course Begin Read Input clustersize course Matching phase Compute Relevant visitor phase ; Matched visitor phase //Course preference matrix phase if scholar search the course; Print 1 else Print 0 if (m course is visited by the scholar) Print 1 else Print 0 generation based on for to G For to coeff End for RV.grp.app end() End for //Relevant scholar phase for to got scholars who viewed the courses End for Return //Matched scholar phase for to len .append (Bhattacharya End for Sort by Return |
3.6. Sentiment Classification
3.7. Sentiment Classification Using Proposed TaylorChOA-Based RMDL
| Algorithm 2 Pseudo-code of proposed TaylorChOA algorithm. |
| Input: Output: Initialize population Initialize the parameters, like , and r Determine the position of each chimp while maximum iterations for each chimp Extract the group of chimps Use the grouping mechanism to update , and r end for for each search chimp if if Update position of search agent using Equation (56) else if Choose a random search agent end if else if Update position of search using the chaotic value end if end for Update , and r end while Return the best solution |
4. Systems Implementation and Evaluation
4.1. Description of Datasets
4.2. Experimental Setup
4.3. Evaluation Metrics
4.4. Baseline Methods
- HSACN [14]: The method was formulated to learn item and user representations from reviews.
- MCNN [20]: Multichannel Deep Convolutional Neural Network for Recommender Systems.
- Query Optimization [22]: The Query Optimization method for course recommendation model designed to improve the categorization of action verbs to a more precise level.
- DCBVN [21]: Demand-aware Collaborative Bayesian Variational Network for course recommendation.
- Proposed TaylorChOA-based RMDL: Proposed TaylorChOA-based RMDL model is developed for recommending the finest courses.
5. Results and Discussion
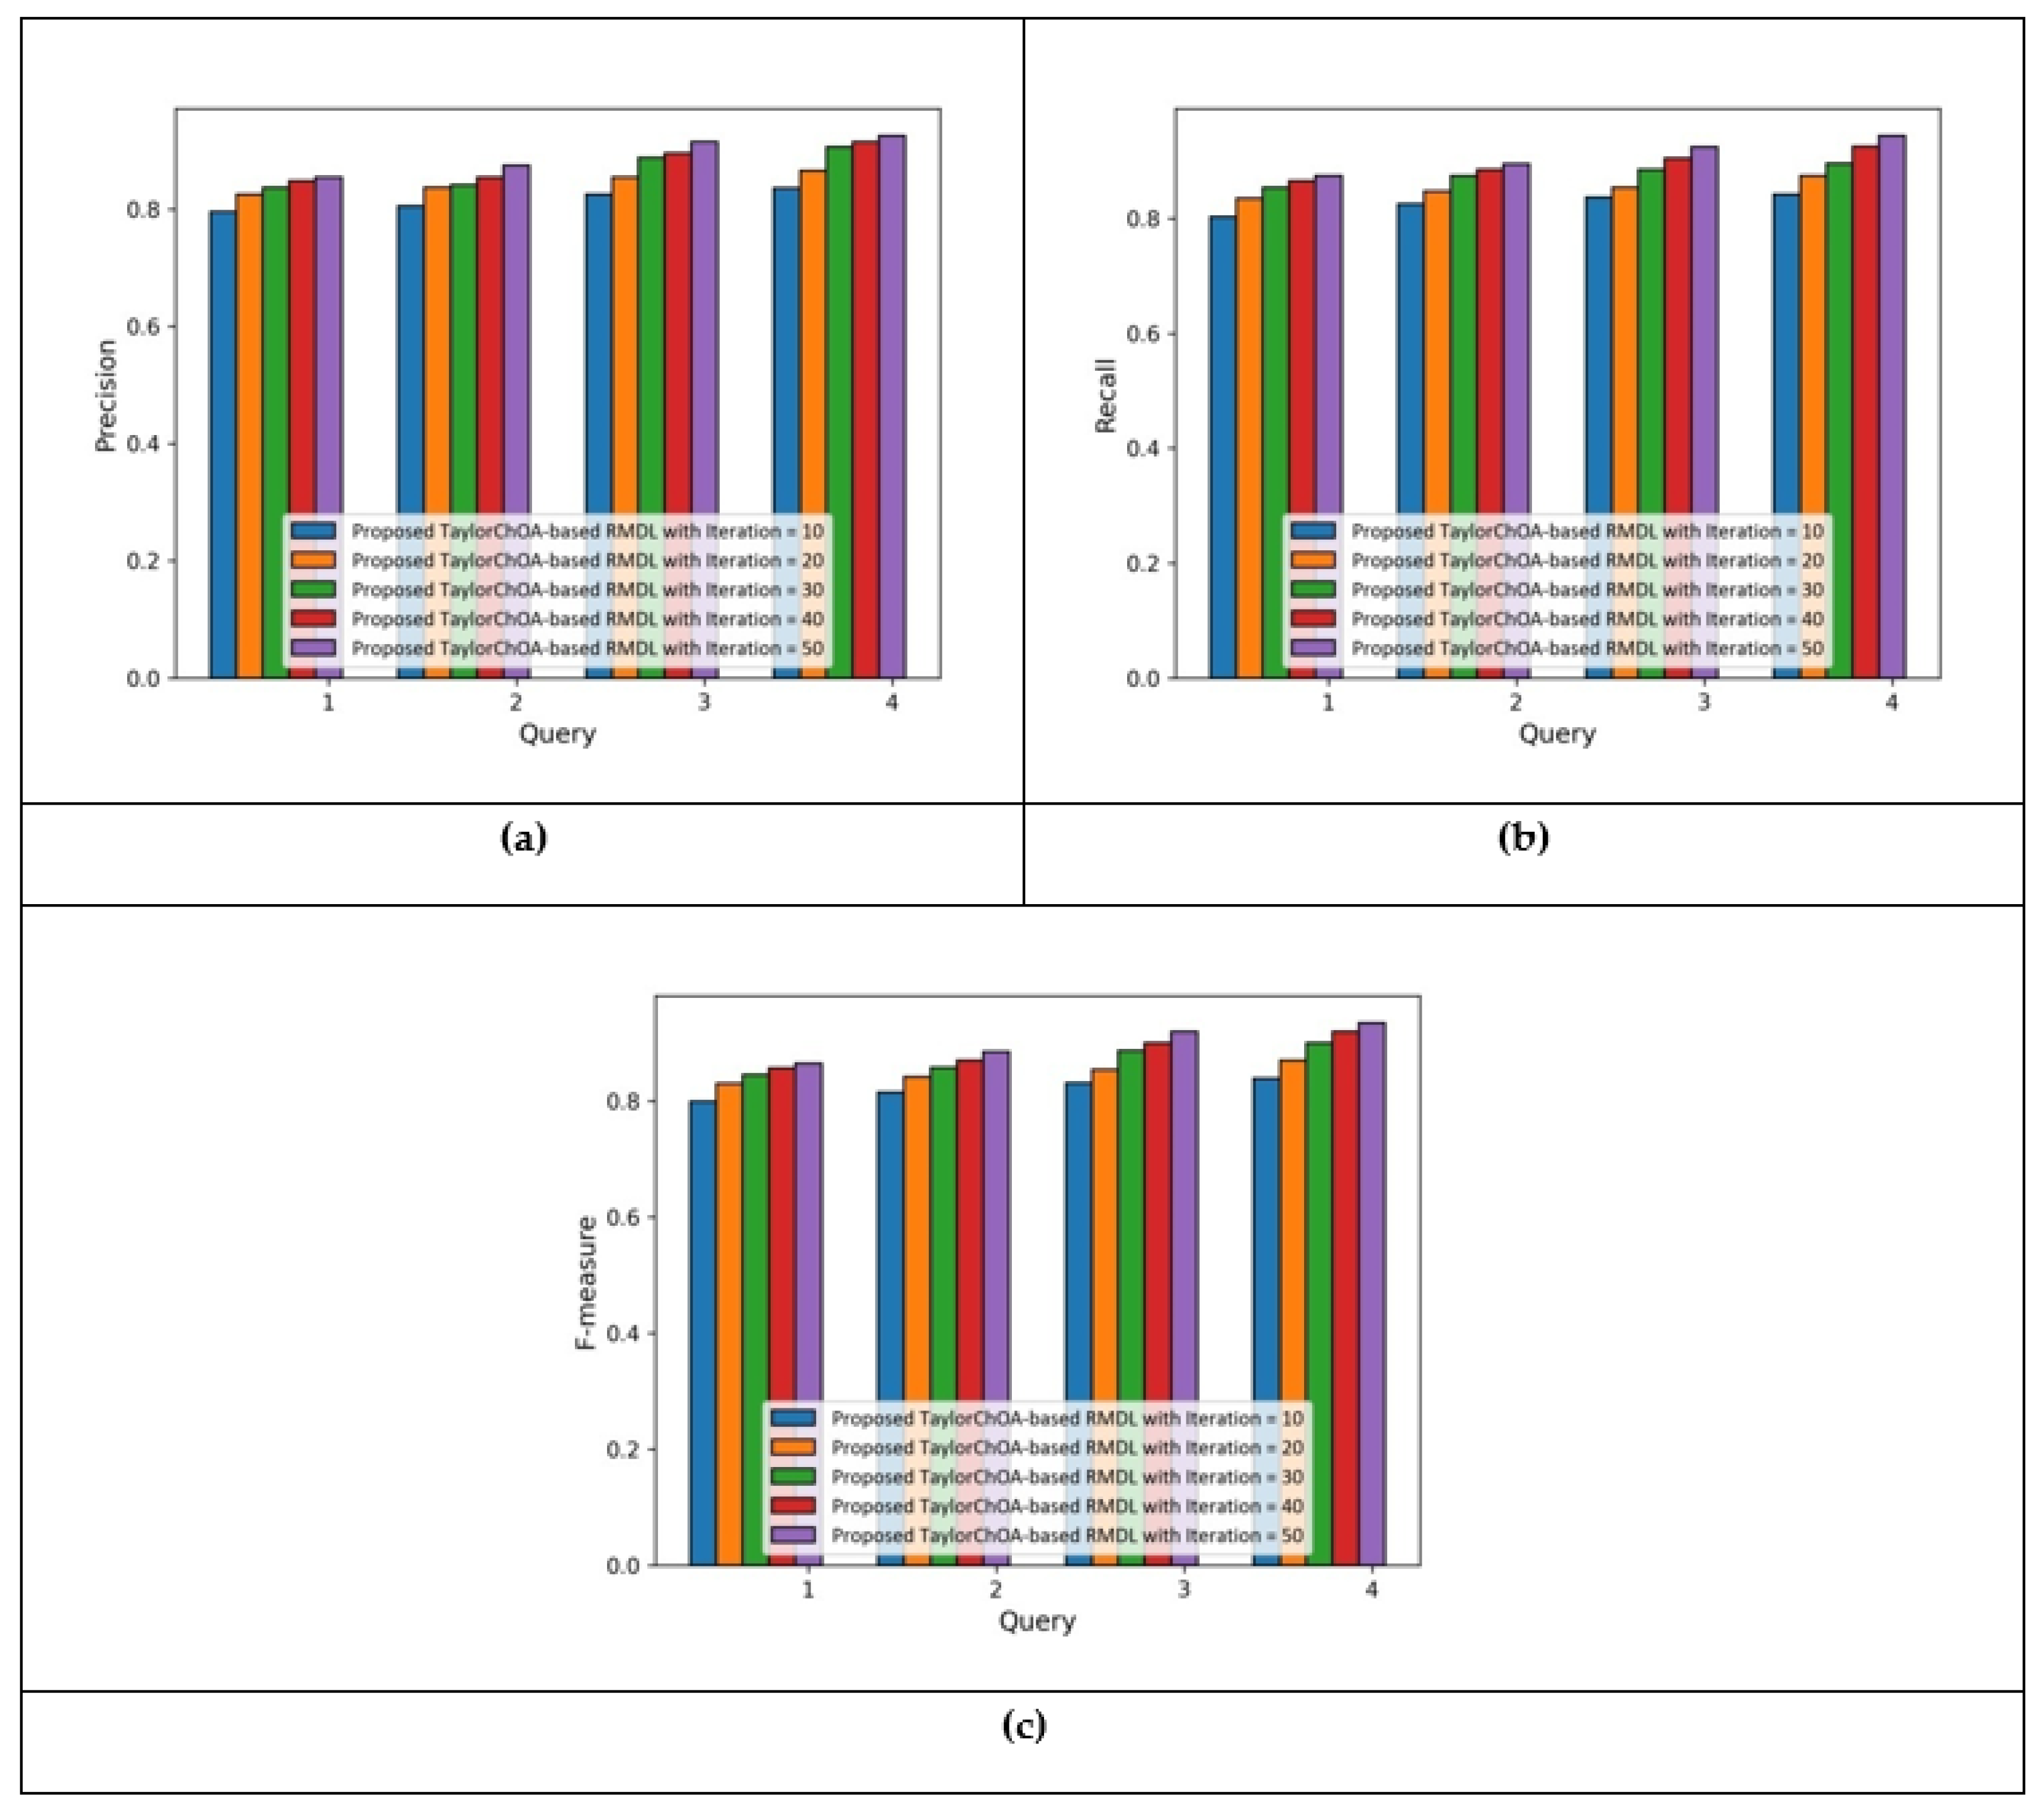
5.1. Results Based on E-Khool Dataset, with Respect to Number of Iterations (10 to 50)
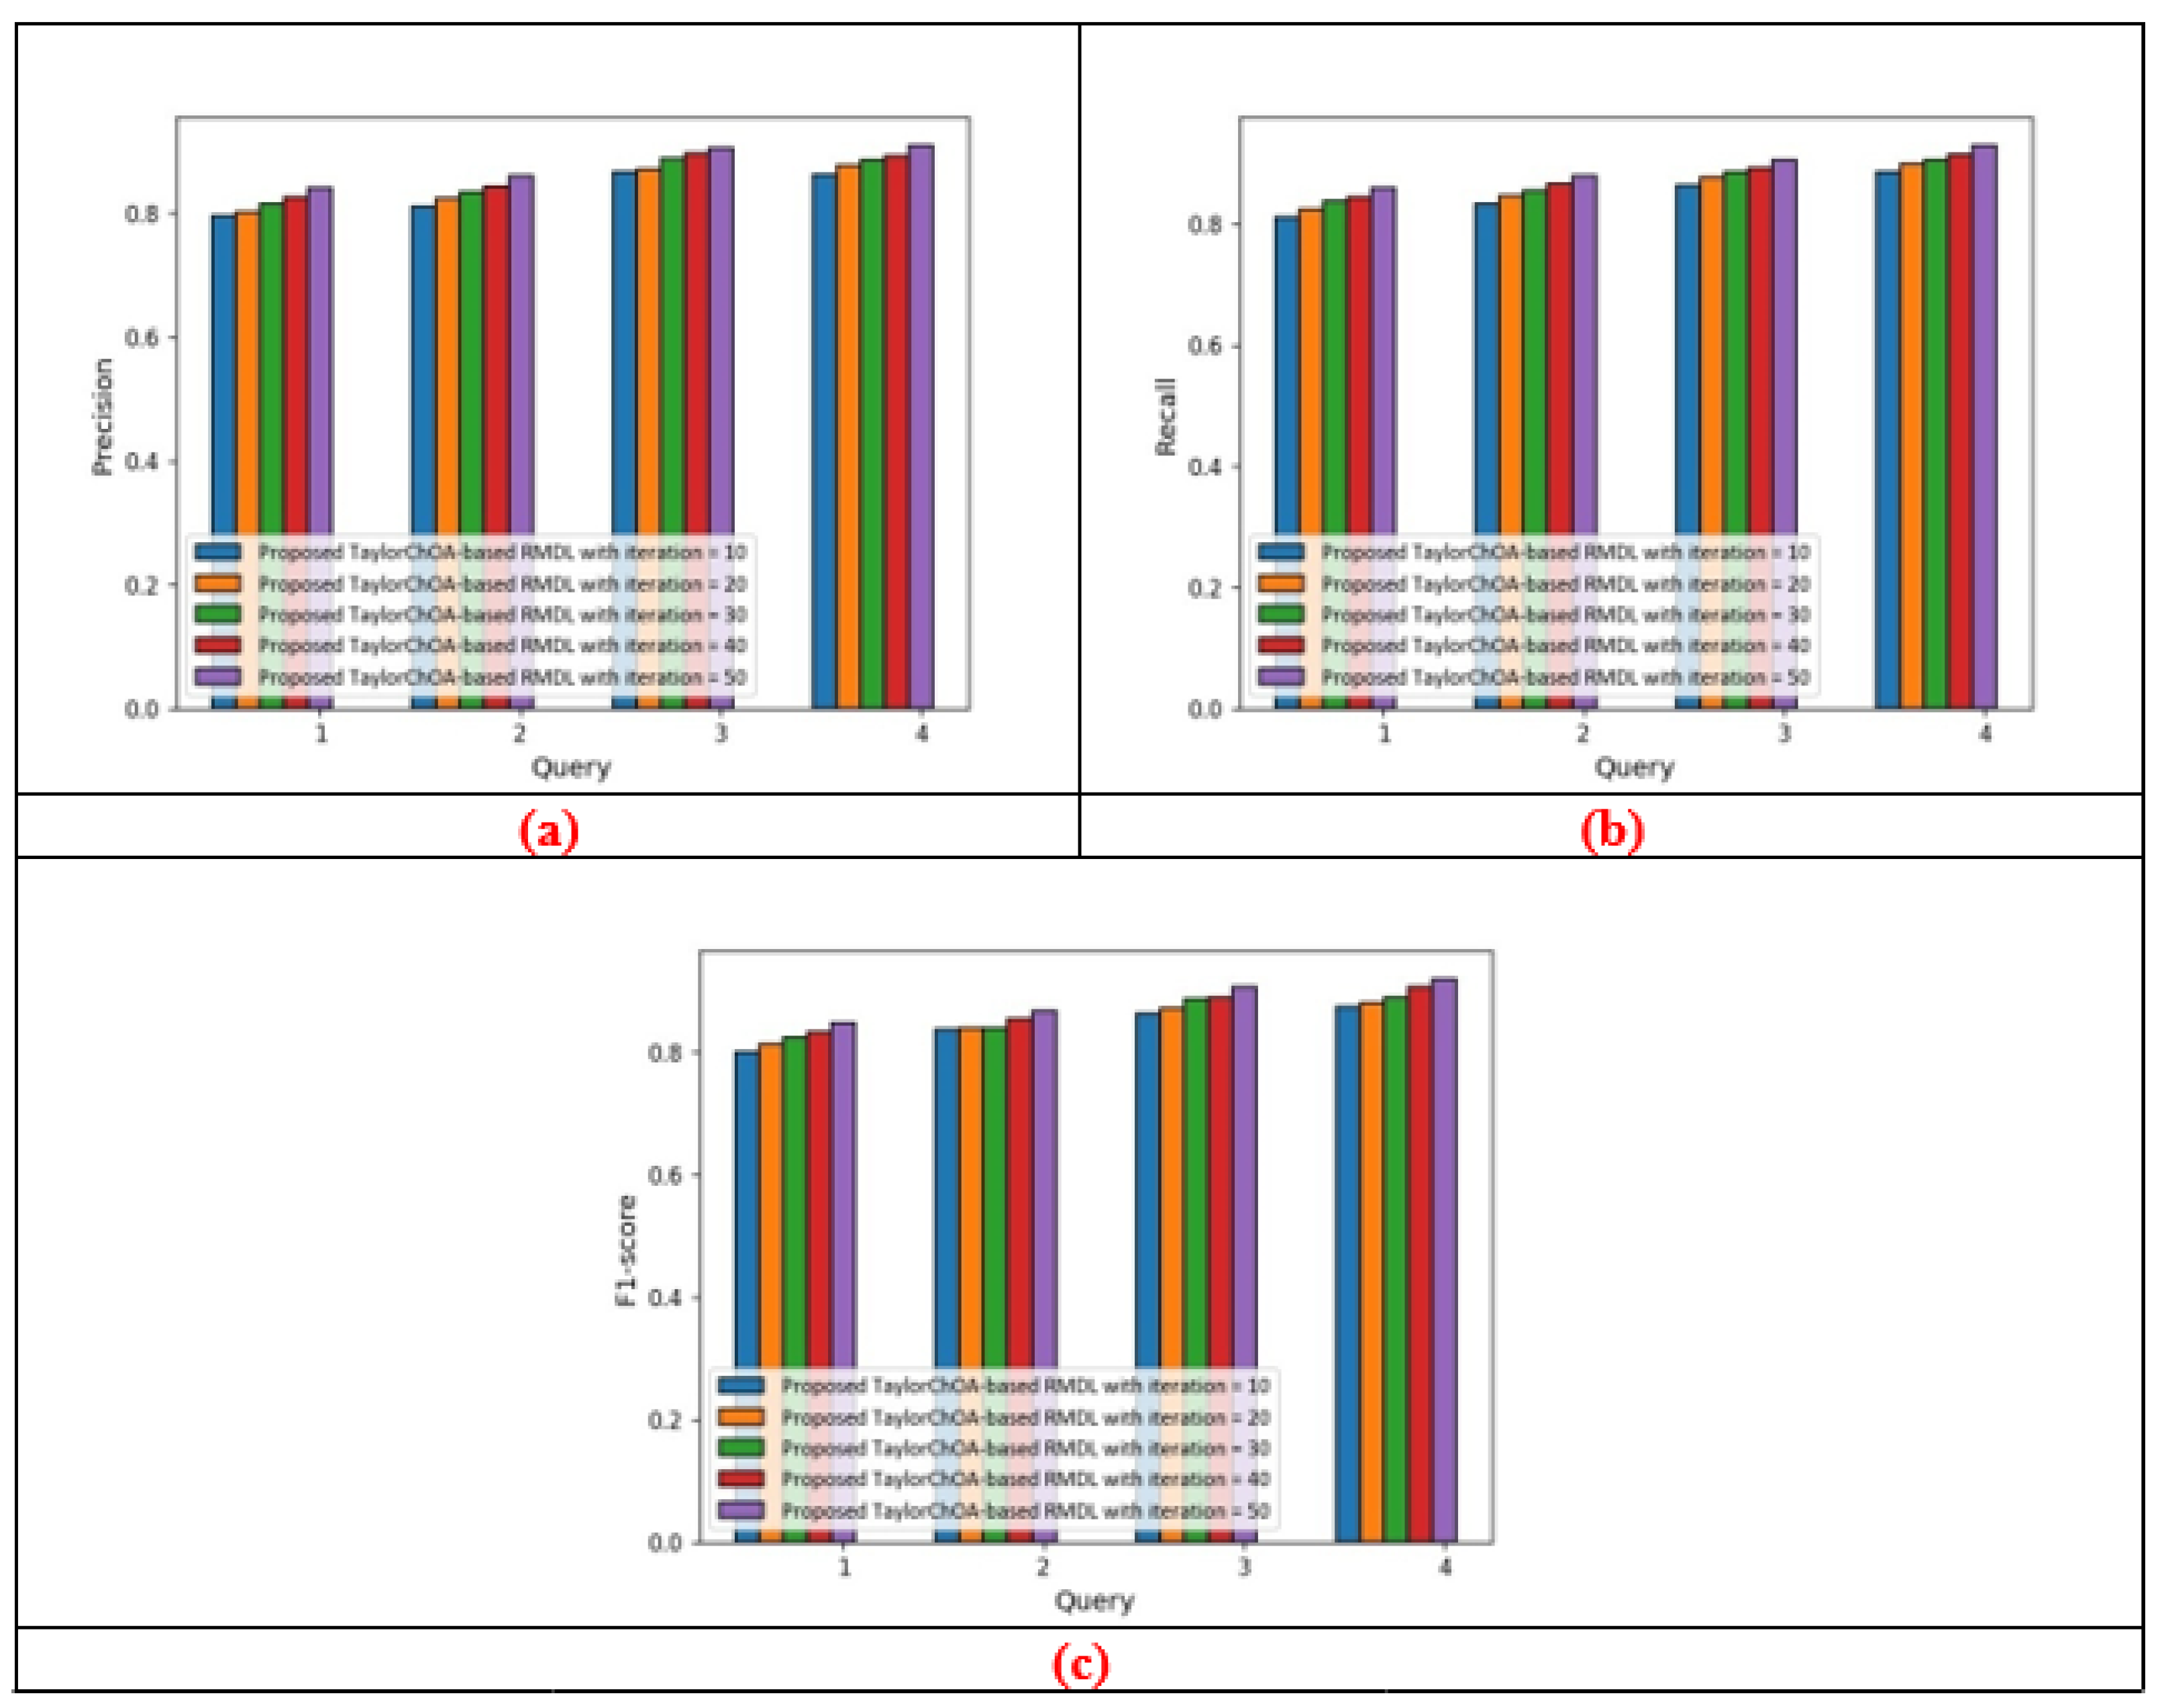
5.1.1. Performance Analysis Based on Cluster Size = 3
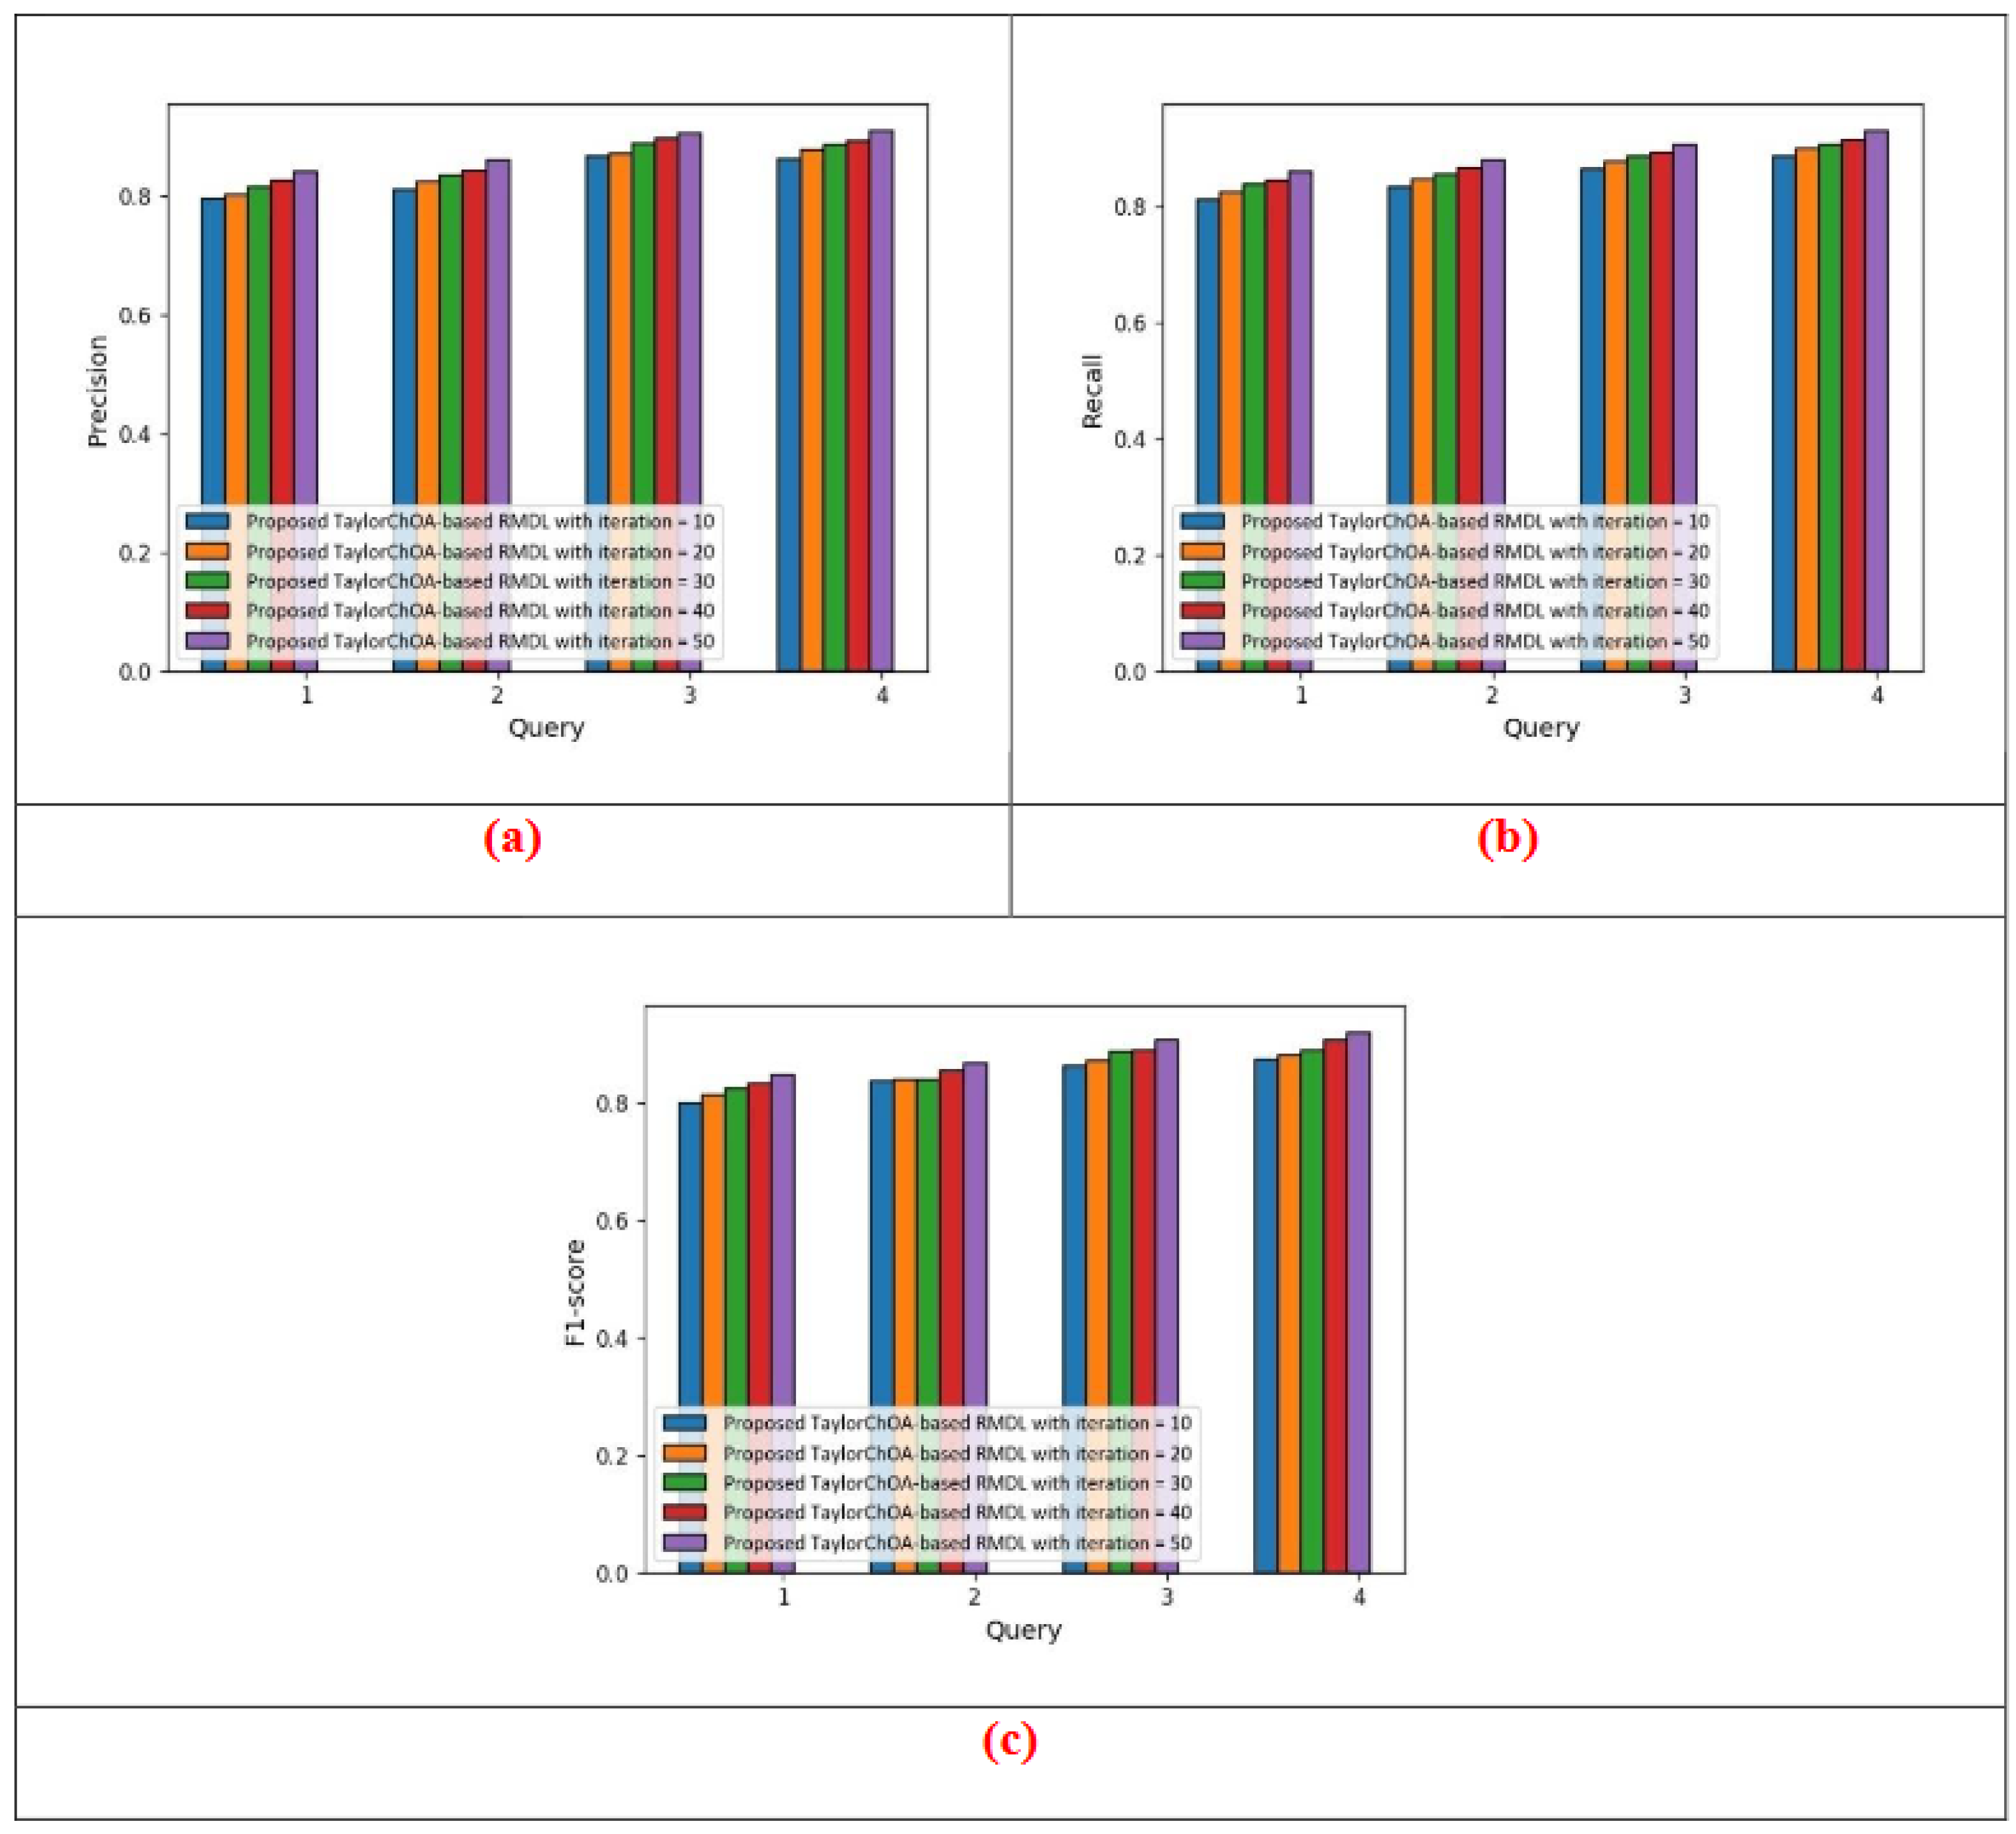
5.1.2. Performance Analysis Based on Cluster Size = 4
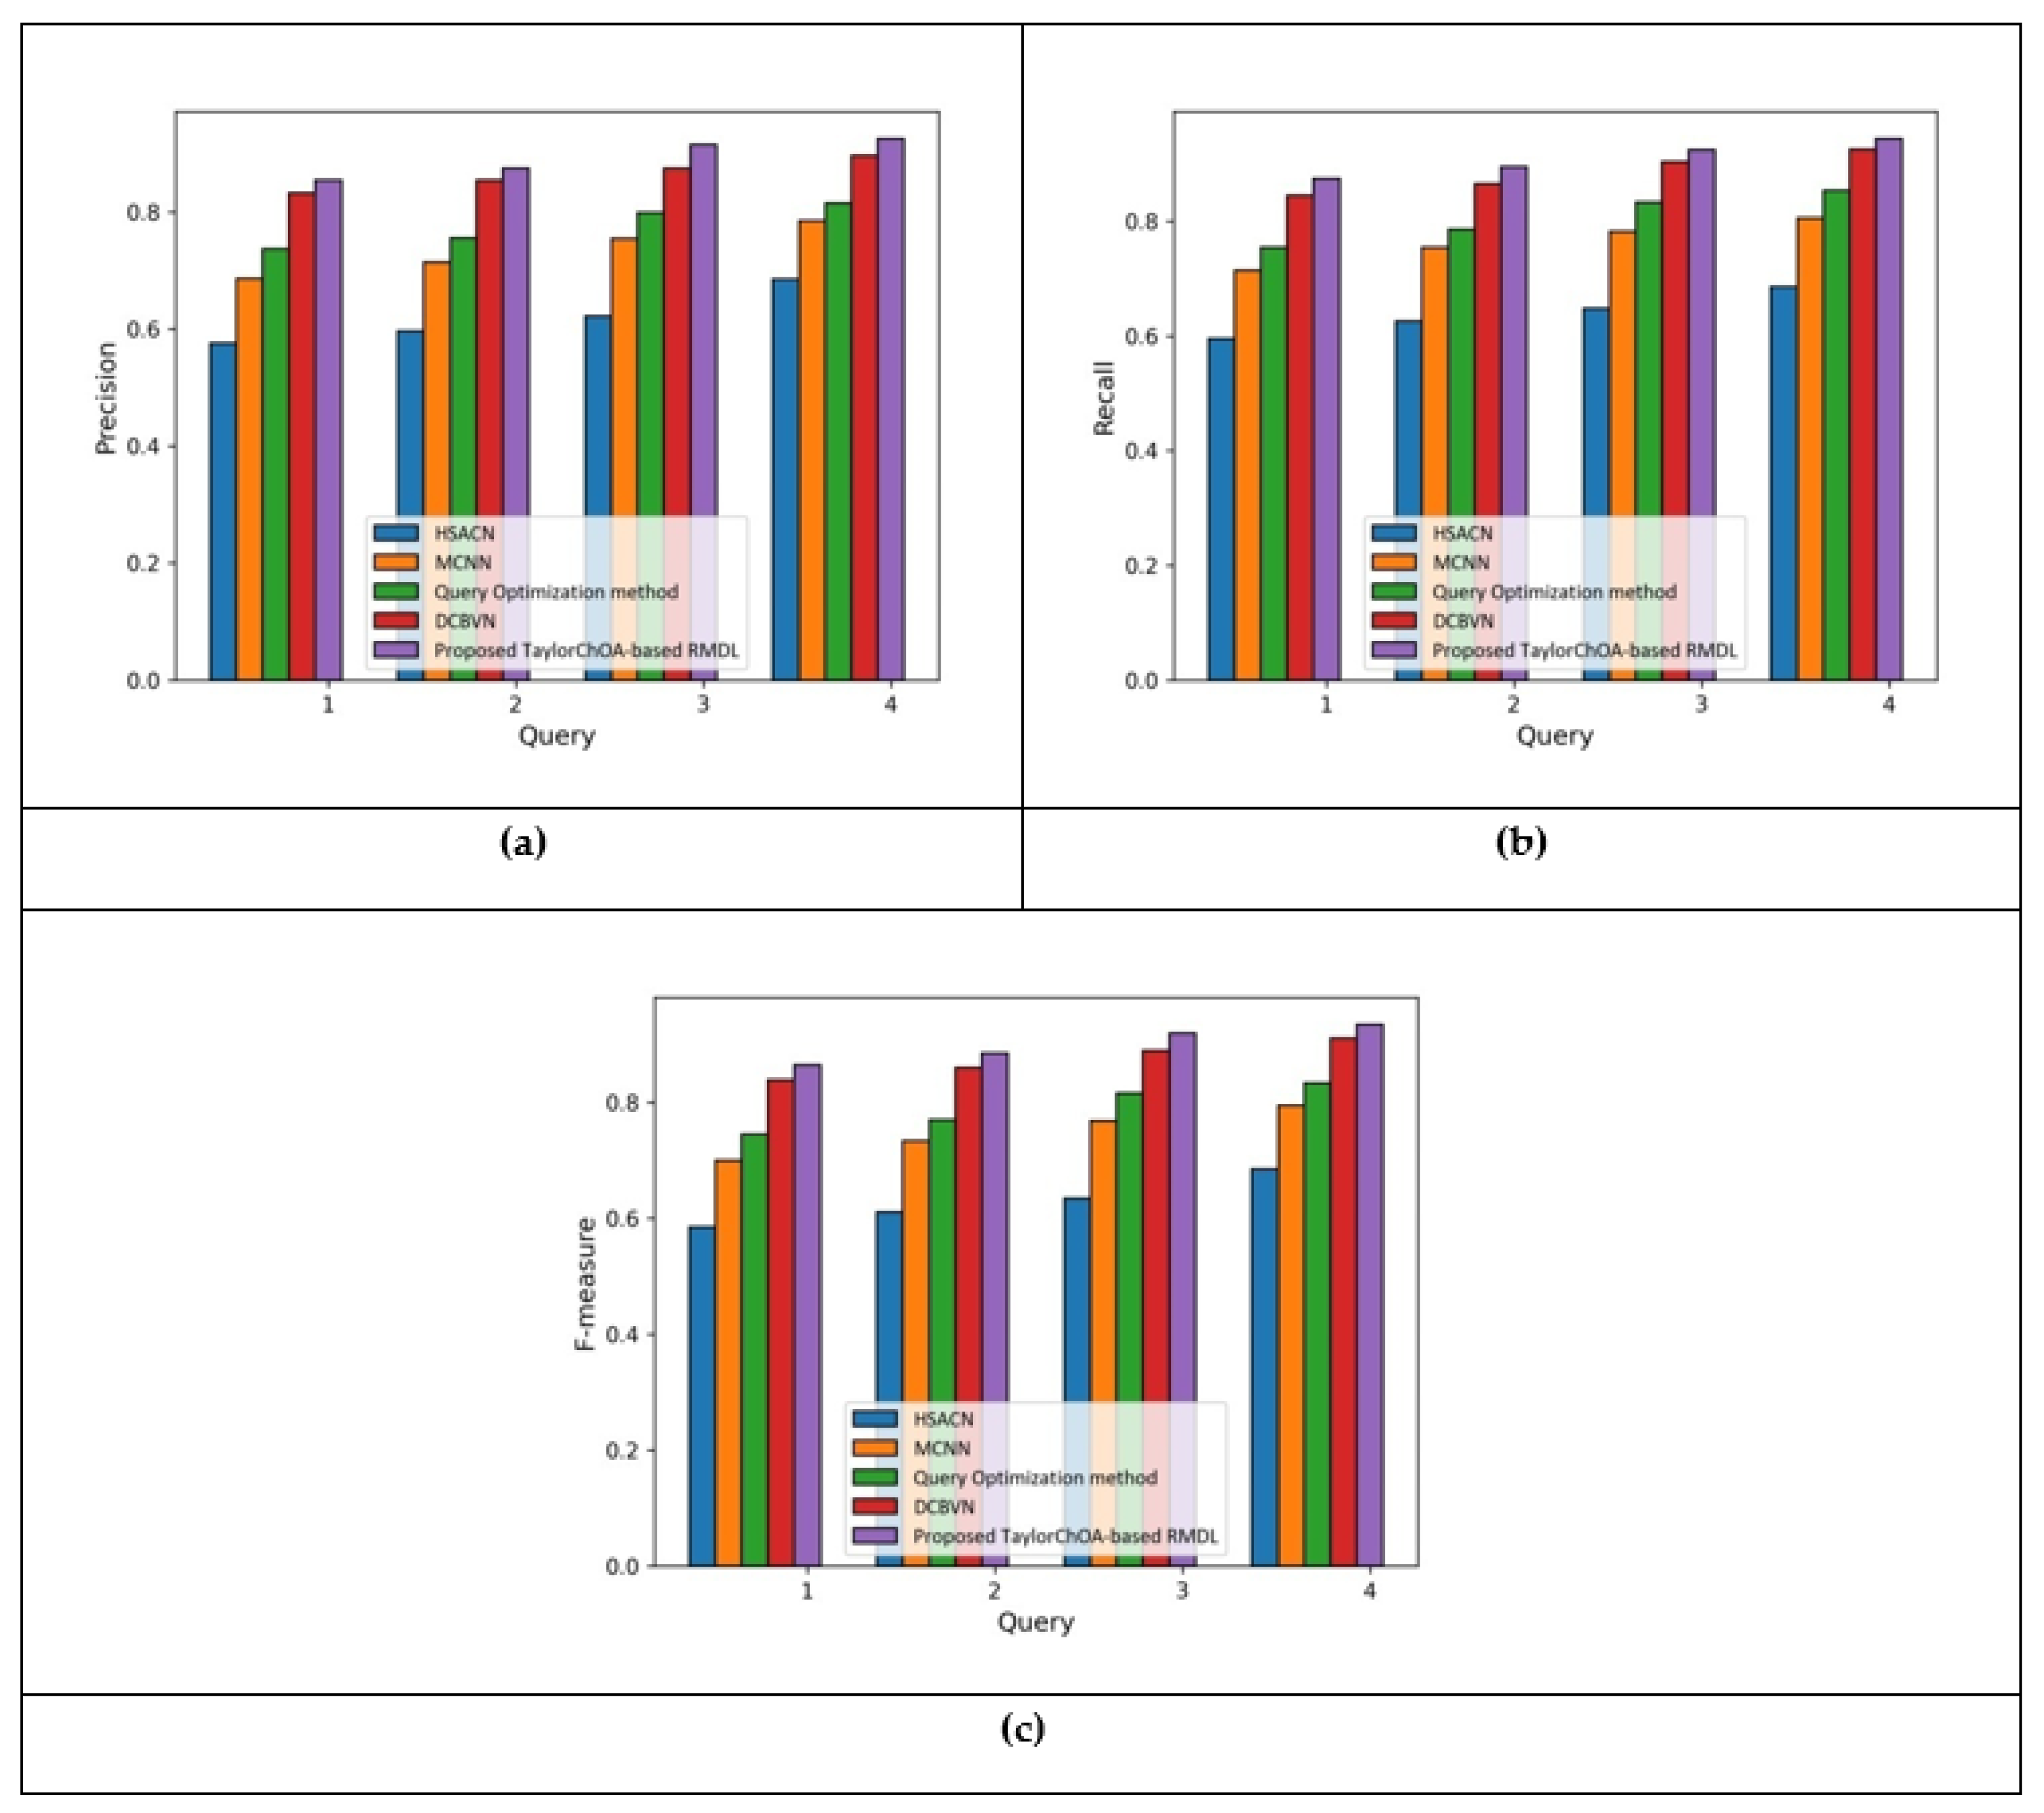
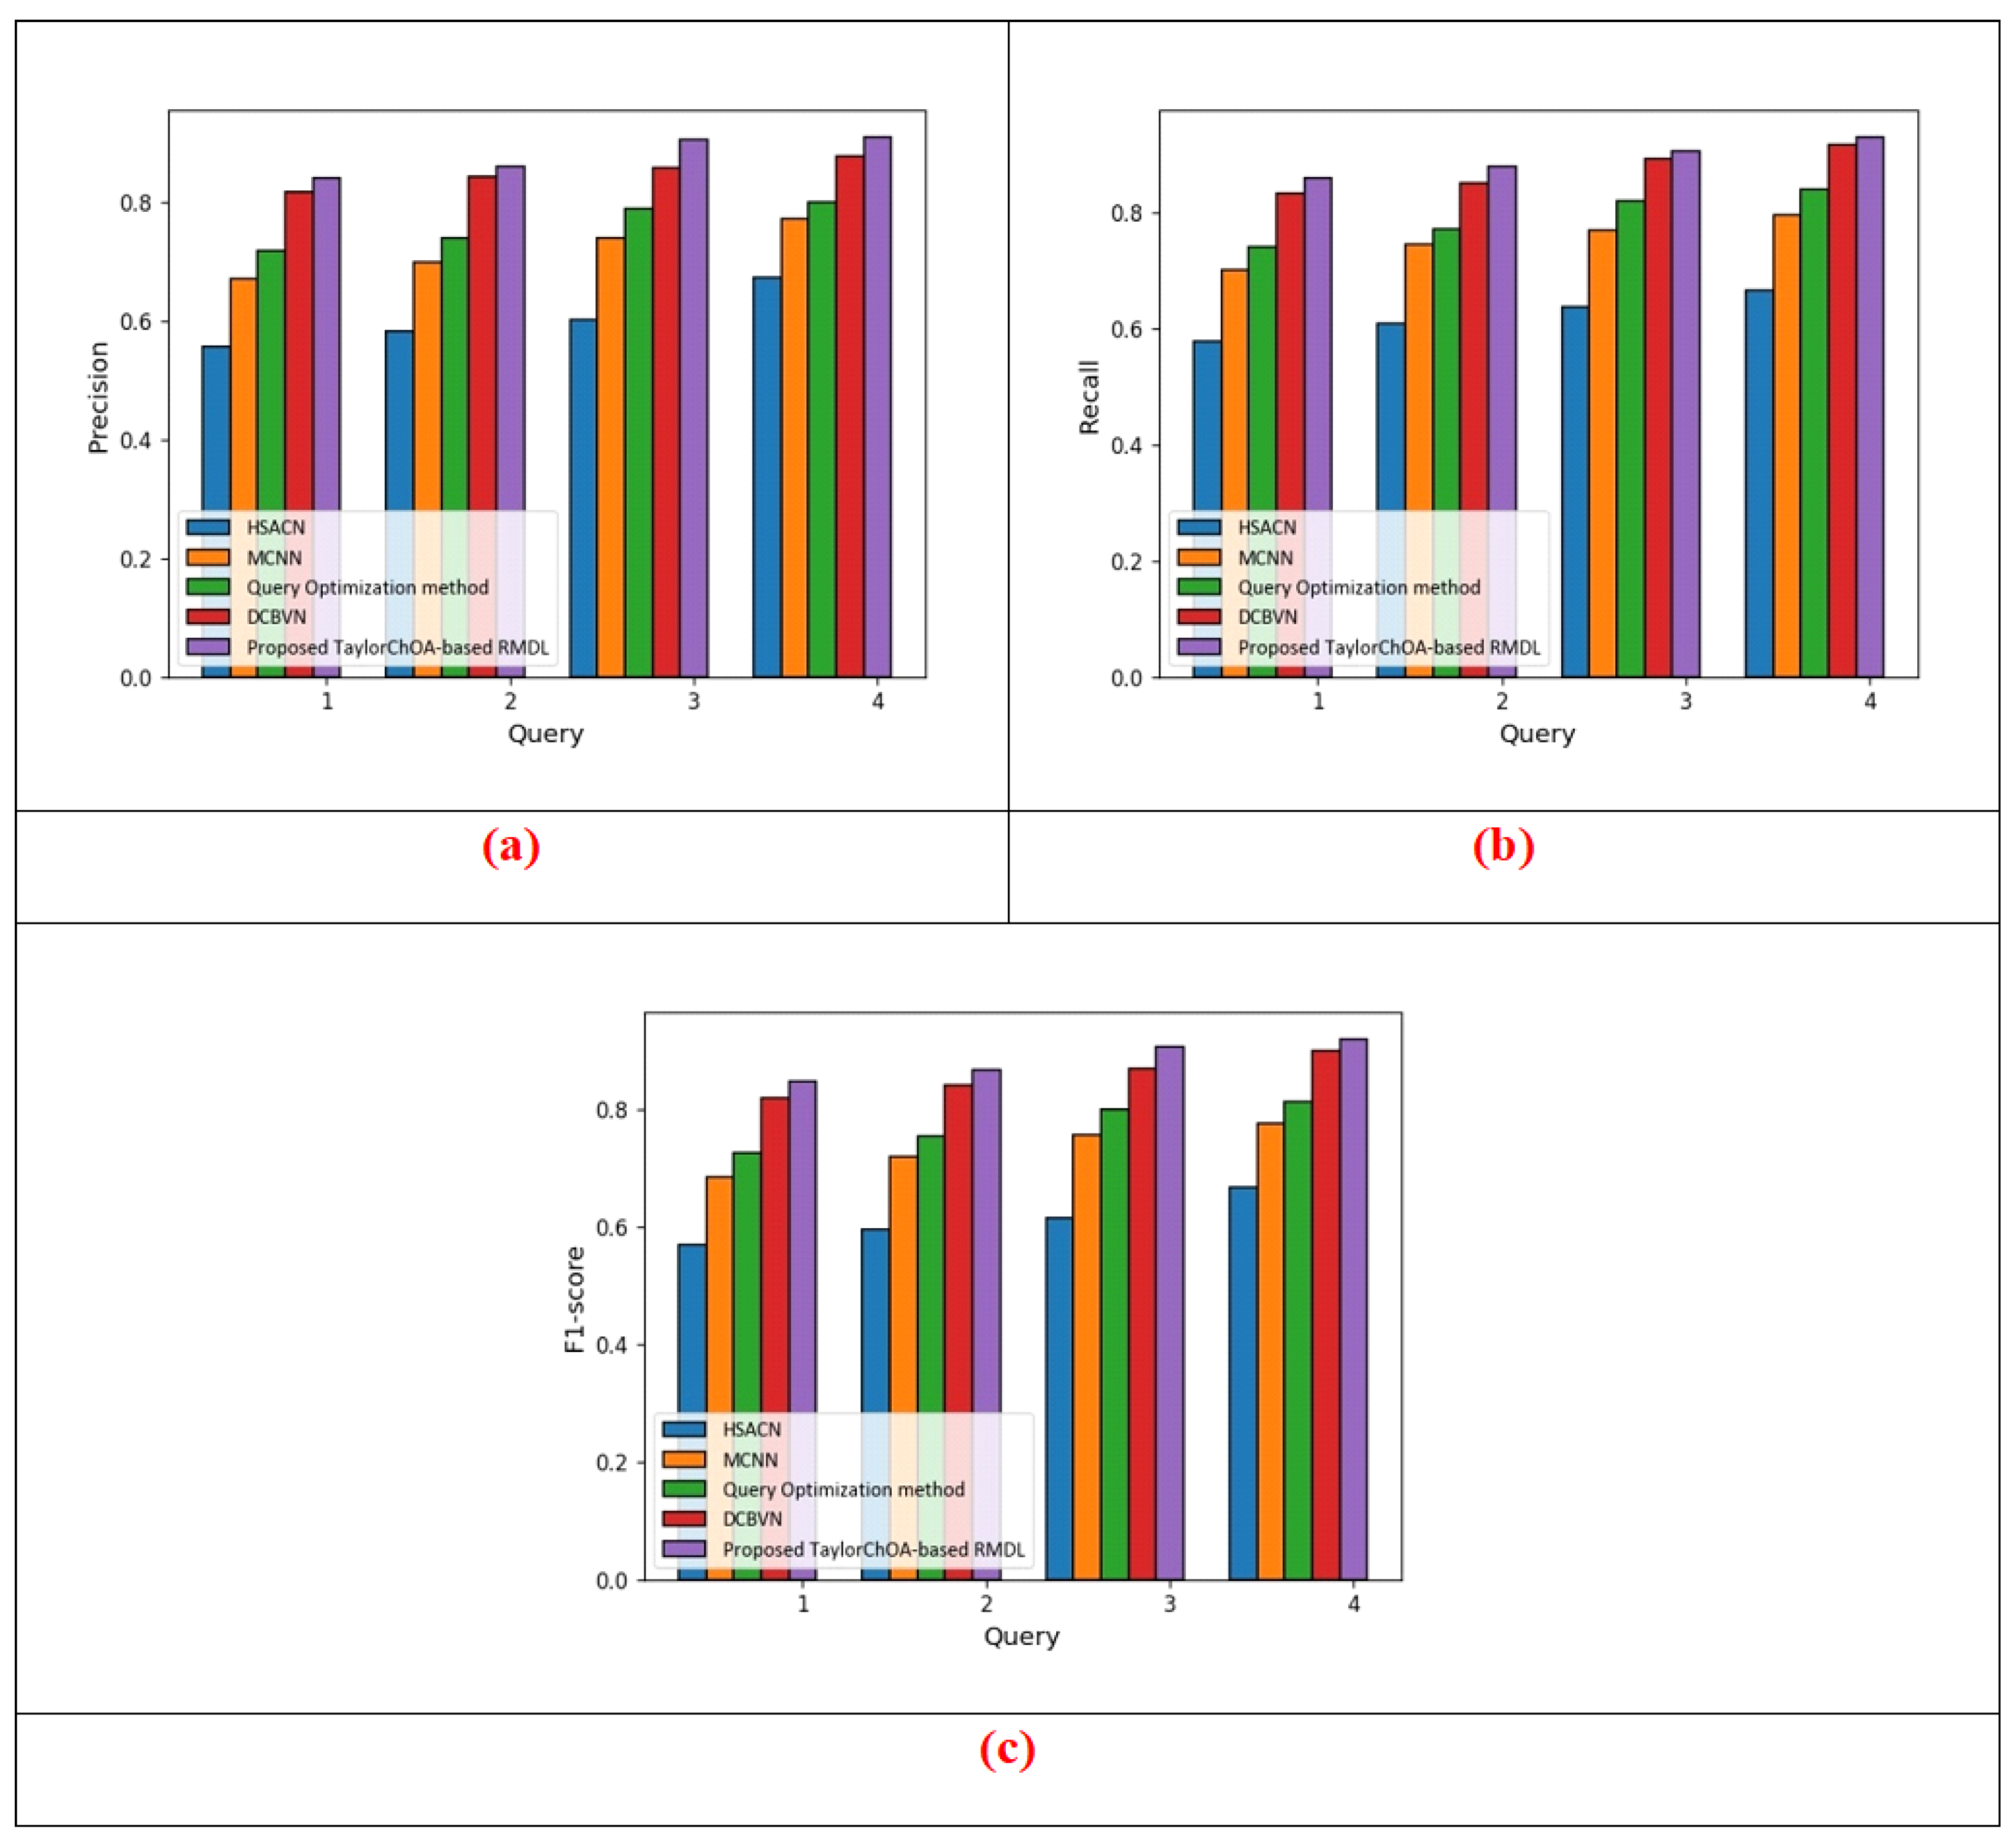
5.1.3. Comparative Analysis Based on Cluster Size = 3 in terms of Precision, Recall, and F1-Score Using E-Khool Dataset
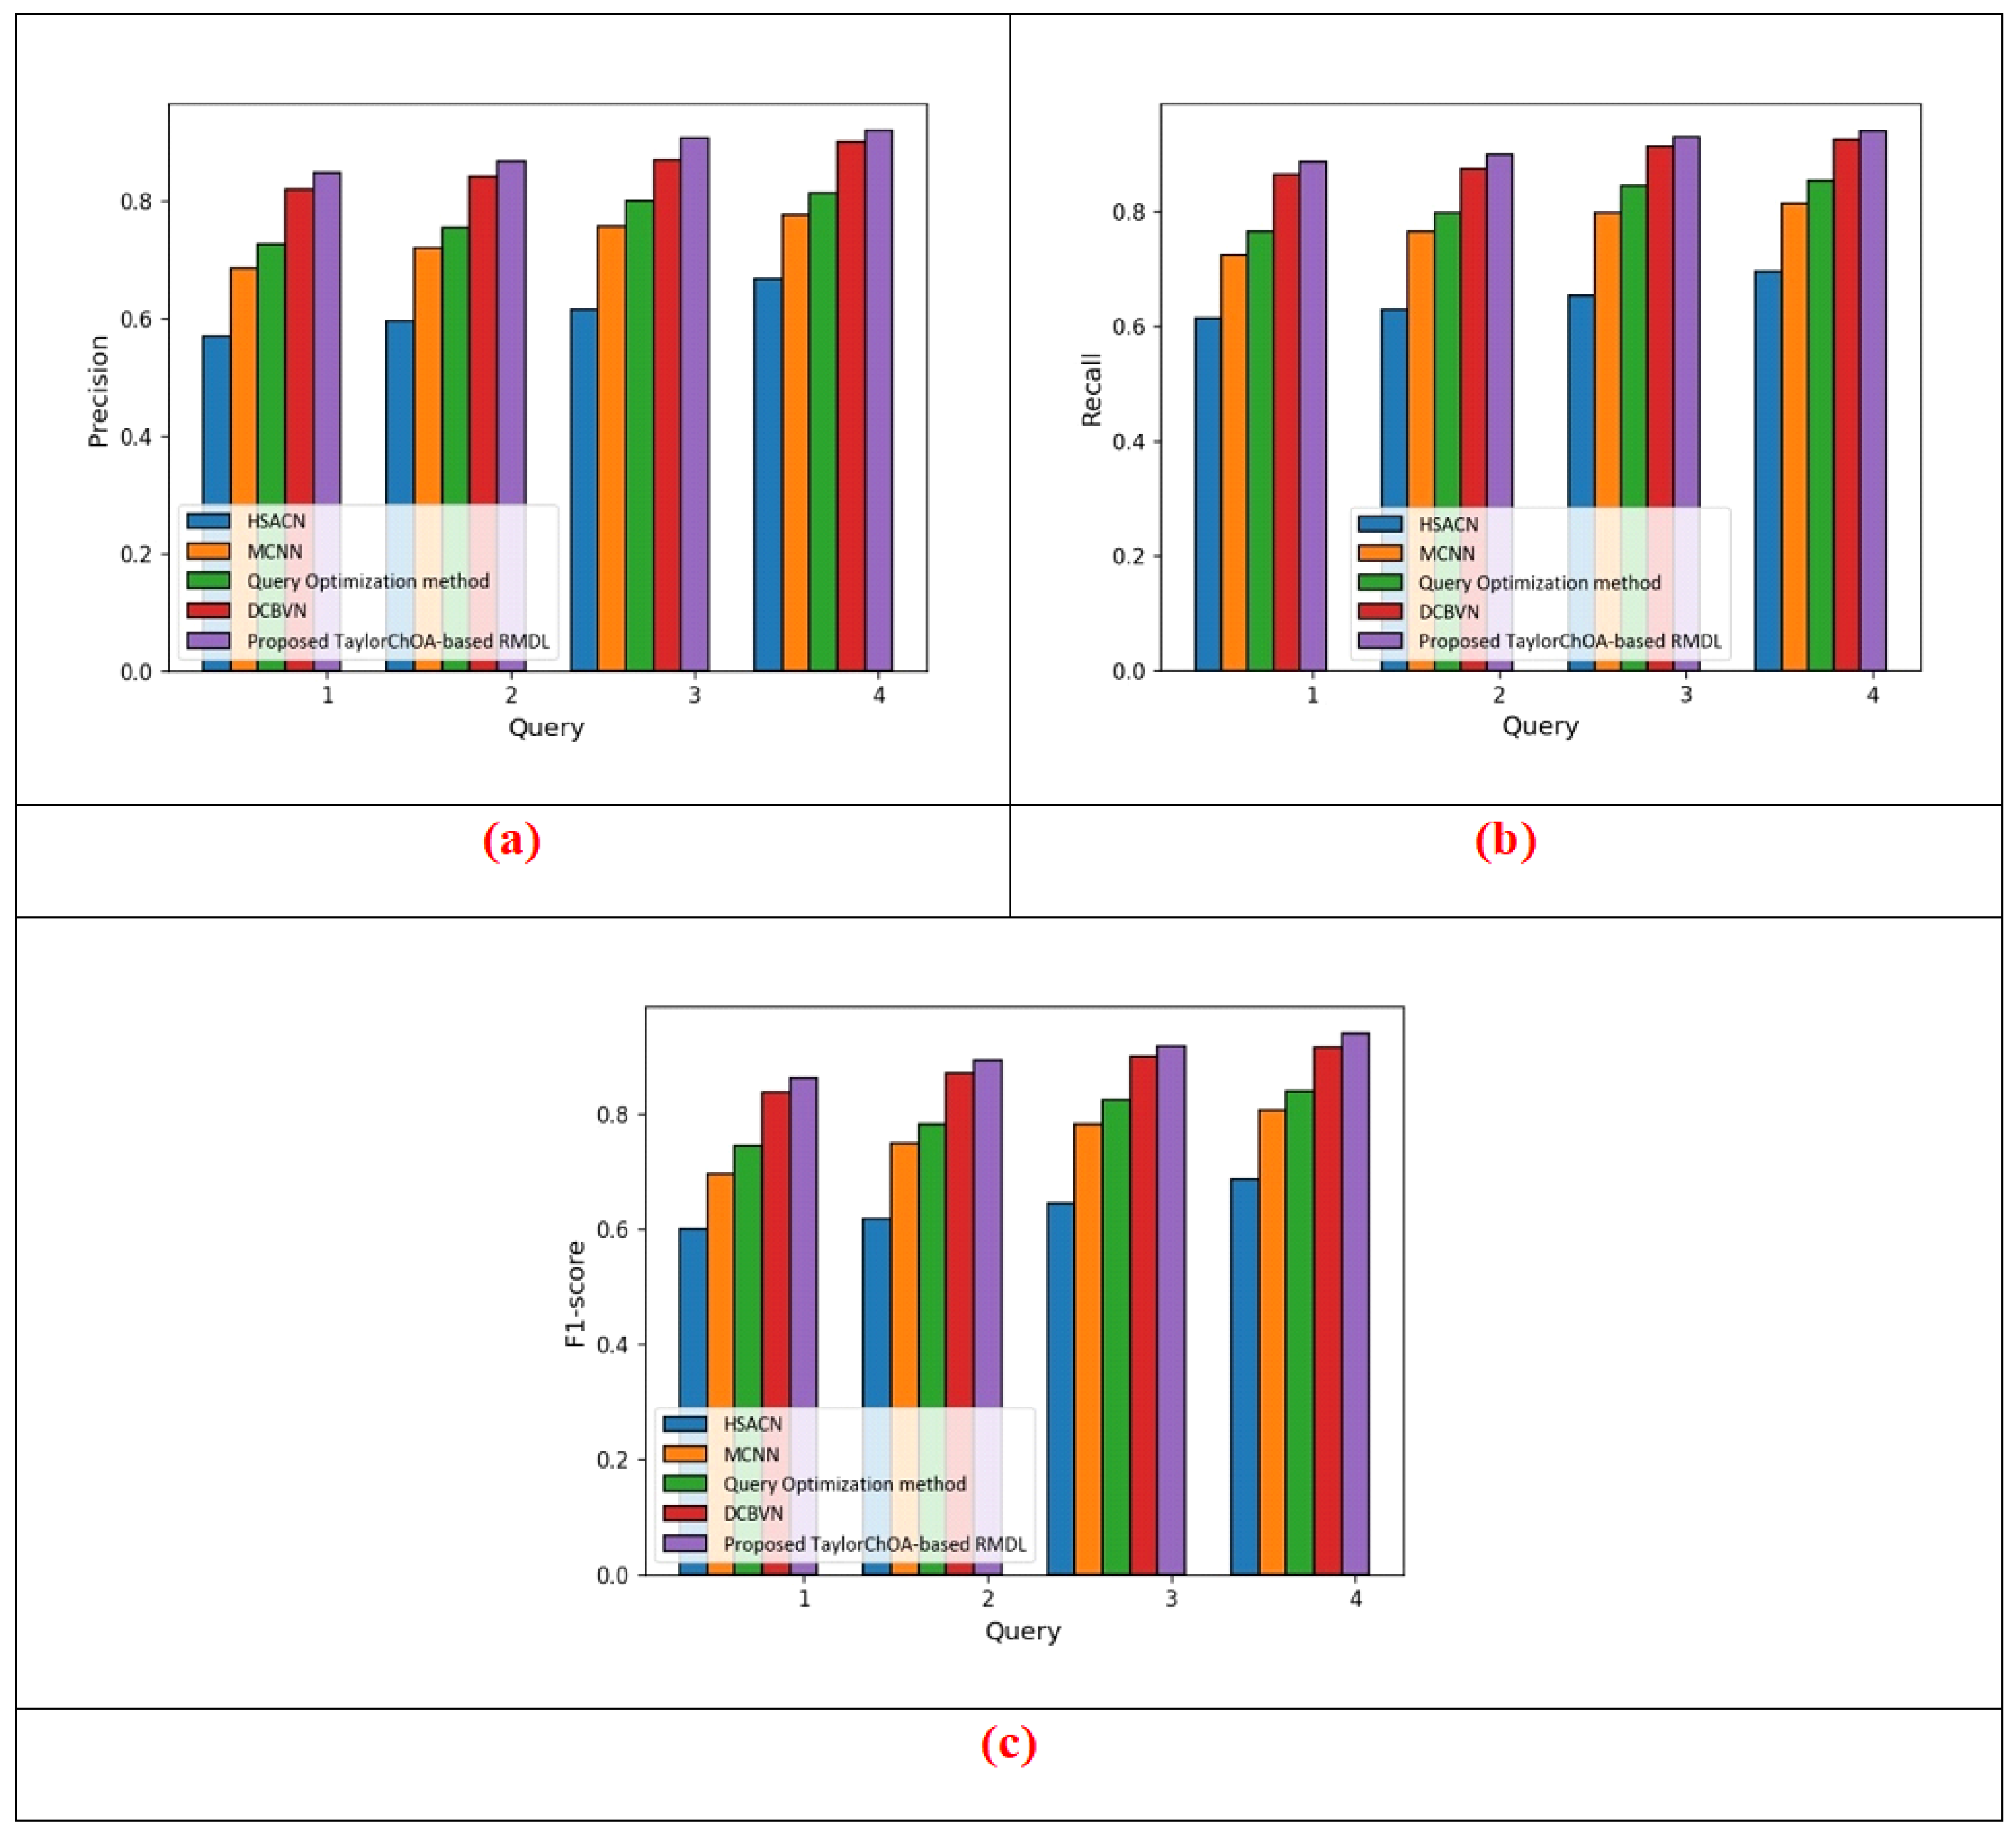
5.1.4. Comparative Analysis Based on Cluster Size = 4 in Terms of Precision, Recall, and F1-Score Using E-Khool Dataset
5.2. Results Based on Coursera Course Dataset with Respect to the Number of Iterations (10 to 50)
5.2.1. Performance Analysis Based on Cluster Size = 3
5.2.2. Performance Analysis Based on Cluster Size = 4
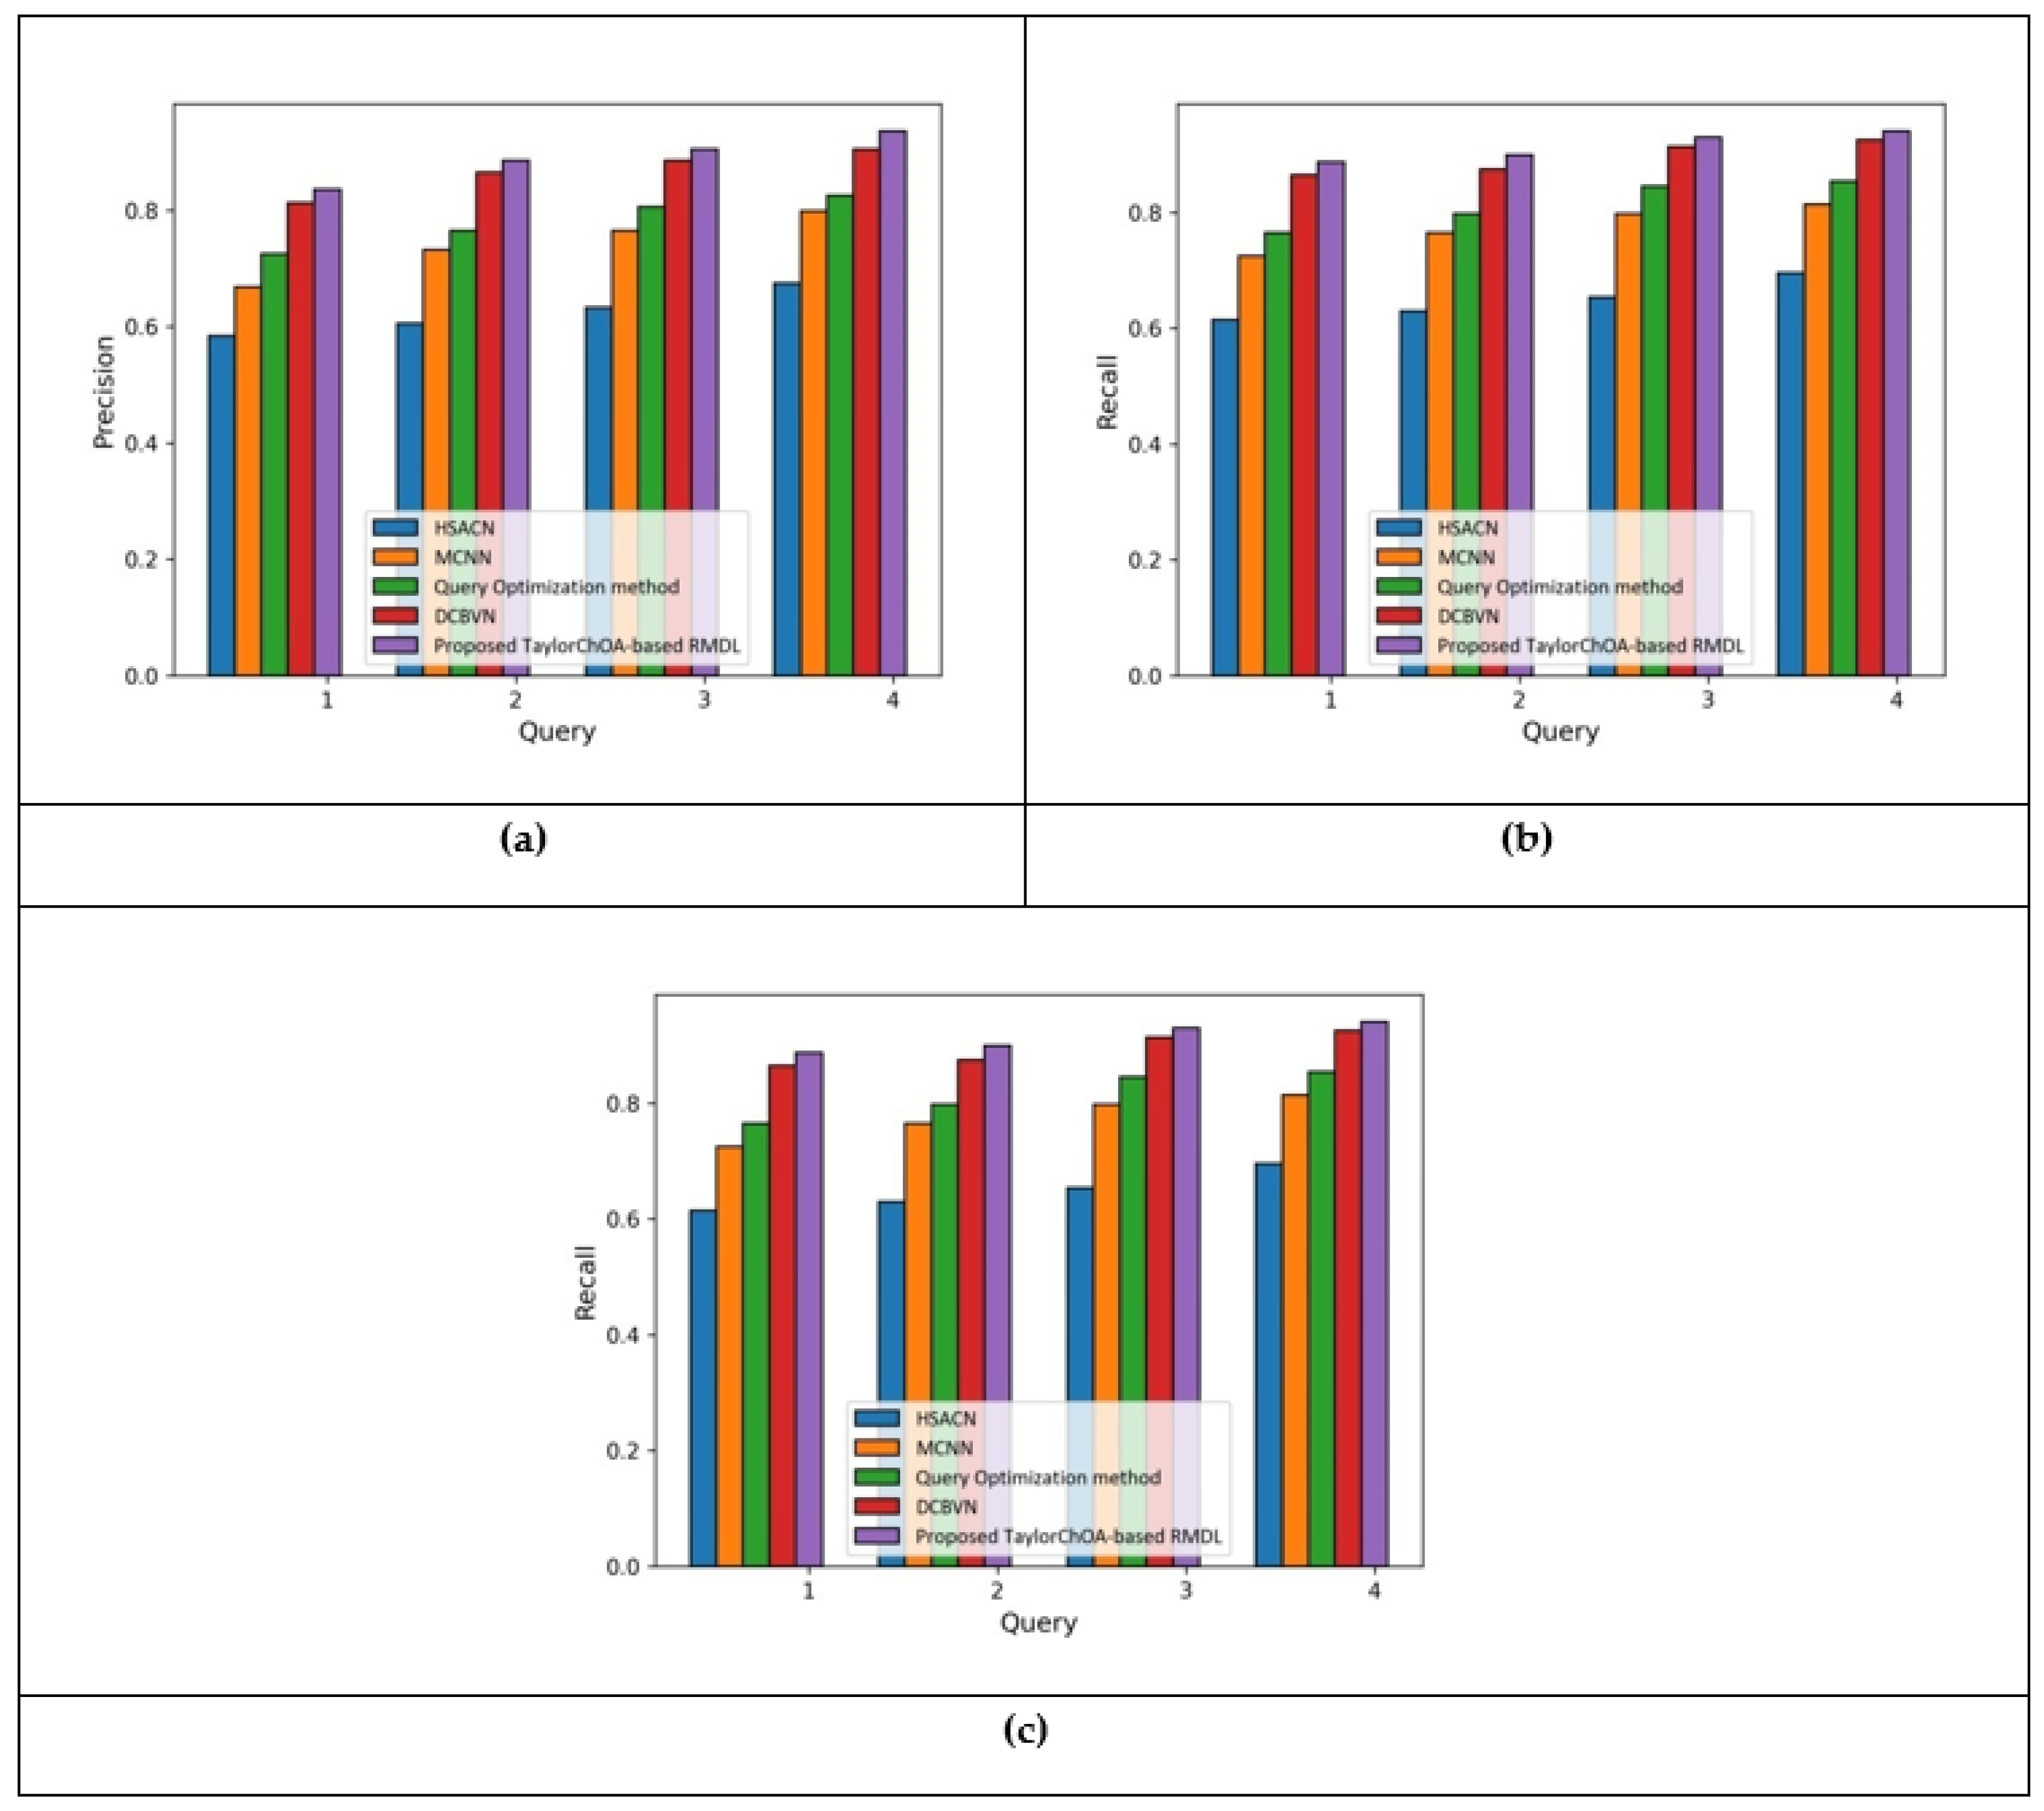
5.2.3. Analysis Based on Cluster Size = 3 in Terms of Precision, Recall, and F1-Score
5.2.4. Analysis Based on Cluster Size = 4 in Terms of Precision, Recall, and F1-Score
6. Conclusions and Future Work
Author Contributions
Funding
Institutional Review Board Statement
Informed Consent Statement
Data Availability Statement
Conflicts of Interest
Abbreviations
| ChOA | Chimp Optimization Algorithm |
| DCBVN | Demand-aware Collaborative Bayesian Variational Network |
| DÉCOR | Deep learning-enabled Course Recommender System |
| DNN | Deep Neural Networks |
| GRU | Gated Recurrent Unit |
| HANCI | Hierarchical Attention Network Oriented towards Crowd Intelligence |
| HSACN | Hierarchical Self-Attentive Convolution Network |
| LSTM | Long Short-Term Memory |
| MCNN | Multi-model Convolutional Neural Network |
| NLP | Natural Language Processing |
| RMDL | Random Multi-model Deep Learning |
| RNN | Recurrent Neural Network |
References
- Wen-Shung Tai, D.; Wu, H.-J.; Li, P.-H. Effective e-learning recommendation system based on self-organizing maps and association mining. Electron. Libr. 2008, 26, 329–344. [Google Scholar] [CrossRef]
- Persky, A.M.; Joyner, P.U.; Cox, W.C. Development of a course review process. Am. J. Pharm. Educ. 2012, 76, 130. [Google Scholar] [CrossRef]
- Guanchen, W.; Kim, M.; Jung, H. Personal customized recommendation system reflecting purchase criteria and product reviews sentiment analysis. Int. J. Electr. Comput. Eng. 2021, 11, 2399–2406. [Google Scholar] [CrossRef]
- Gunawan, A.; Cheong, M.L.F.; Poh, J. An Essential Applied Statistical Analysis Course using RStudio with Project-Based Learning for Data Science. In Proceedings of the 2018 IEEE International Conference on Teaching, Assessment, and Learning for Engineering (TALE), Wollongong, Australia, 4–7 December 2018; pp. 581–588. [Google Scholar]
- Assami, S.; Daoudi, N.; Ajhoun, R. A Semantic Recommendation System for Learning Personalization in Massive Open Online Courses. Int. J. Recent Contrib. Eng. Sci. IT 2020, 8, 71–80. [Google Scholar] [CrossRef]
- Hua, Z.; Wang, Y.; Xu, X.; Zhang, B.; Liang, L. Predicting corporate financial distress based on integration of support vector machine and logistic regression. Expert Syst. Appl. 2007, 33, 434–440. [Google Scholar] [CrossRef]
- Aher, S.B.; Lobo, L. Best combination of machine learning algorithms for course recommendation system in e-learning. Int. J. Comput. Appl. 2012, 41. [Google Scholar] [CrossRef]
- Tarus, J.K.; Niu, Z.; Mustafa, G. Knowledge-based recommendation: A review of ontology-based recommender systems for e-learning. Artif. Intell. Rev. 2018, 50, 21–48. [Google Scholar] [CrossRef]
- Zhang, H.; Huang, T.; Lv, Z.; Liu, S.; Zhou, Z. MCRS: A course recommendation system for MOOCs. Multimed. Tools Appl. 2018, 77, 7051–7069. [Google Scholar] [CrossRef]
- Li, Q.; Kim, J. A Deep Learning-Based Course Recommender System for Sustainable Development in Education. Appl. Sci. 2021, 11, 8993. [Google Scholar] [CrossRef]
- Almahairi, A.; Kastner, K.; Cho, K.; Courville, A. Learning distributed representations from reviews for collaborative filtering. In Proceedings of the 9th ACM Conference on Recommender Systems, Vienna, Austria, 16–20 September 2015; pp. 147–154. [Google Scholar]
- Yang, C.; Zhou, W.; Wang, Z.; Jiang, B.; Li, D.; Shen, H. Accurate and Explainable Recommendation via Hierarchical Attention Network Oriented Towards Crowd Intelligence. Knowl.-Based Syst. 2021, 213, 106687. [Google Scholar] [CrossRef]
- Zheng, L.; Noroozi, V.; Yu, P.S. Joint deep modeling of users and items using reviews for recommendation. In Proceedings of the Tenth ACM International Conference on Web Search and Data Mining, Cambridge, UK, 6–10 February 2017; pp. 425–434. [Google Scholar]
- Zeng, H.; Ai, Q. A Hierarchical Self-attentive Convolution Network for Review Modeling in Recommendation Systems. arXiv 2020, arXiv:2011.13436. [Google Scholar]
- Dong, X.; Ni, J.; Cheng, W.; Chen, Z.; Zong, B.; Song, D.; Liu, Y.; Chen, H.; De Melo, G. Asymmetrical hierarchical networks with attentive interactions for interpretable review-based recommendation. In Proceedings of the AAAI Conference on Artificial Intelligence, New York, NY, USA, 7–12 February 2020; Volume 34, pp. 7667–7674. [Google Scholar]
- Wang, H.; Wu, F.; Liu, Z.; Xie, X. Fine-grained interest matching for neural news recommendation. In Proceedings of the 58th Annual Meeting of the Association for Computational Linguistics, Seattle, WA, USA, 5–10 July 2020; pp. 836–845. [Google Scholar]
- Bansal, T.; Belanger, D.; McCallum, A. Ask the gru: Multi-task learning for deep text recommendations. In Proceedings of the 10th ACM Conference on Recommender Systems, Boston, MA, USA, 15–19 September 2016; pp. 107–114. [Google Scholar]
- Tay, Y.; Luu, A.T.; Hui, S.C. Multi-pointer co-attention networks for recommendation. In Proceedings of the 24th ACM SIGKDD International Conference on Knowledge Discovery & Data Mining, London, UK, 19–23 August 2018; pp. 2309–2318. [Google Scholar]
- Bai, Y.; Li, Y.; Wang, L. A Joint Summarization and Pre-Trained Model for Review-Based Recommendation. Information 2021, 12, 223. [Google Scholar] [CrossRef]
- Da’u, A.; Salim, N.; Rabiu, I.; Osman, A. Recommendation system exploiting aspect-based opinion mining with deep learning method. Inf. Sci. 2020, 512, 1279–1292. [Google Scholar]
- Wang, C.; Zhu, H.; Zhu, C.; Zhang, X.; Chen, E.; Xiong, H. Personalized Employee Training Course Recommendation with Career Development Awareness. In Proceedings of the Web Conference 2020, Taipei, Taiwan, 20–24 April 2020; pp. 1648–1659. [Google Scholar]
- Rafiq, M.S.; Jianshe, X.; Arif, M.; Barra, P. Intelligent query optimization and course recommendation during online lectures in E-learning system. J. Ambient. Intell. Humaniz. Comput. 2021, 12, 10375–10394. [Google Scholar] [CrossRef]
- Sulaiman, M.S.; Tamizi, A.A.; Shamsudin, M.R.; Azmi, A. Course recommendation system using fuzzy logic approach. Indones. J. Electr. Eng. Comput. Sci. 2020, 17, 365–371. [Google Scholar] [CrossRef]
- Xie, J.; Girshick, R.; Farhadi, A. Unsupervised deep embedding for clustering analysis. In Proceedings of the International Conference on Machine Learning, New York, NY, USA, 19–24 June 2016; pp. 478–487. [Google Scholar]
- Kowsari, K.; Heidarysafa, M.; Brown, D.E.; Meimandi, K.J.; Barnes, L.E. Rmdl: Random multimodel deep learning for classification. In Proceedings of the 2nd International Conference on Information System and Data Mining, Lakeland, FL, USA, 9–1 April 2018; pp. 19–28. [Google Scholar]
- Mangai, S.A.; Sankar, B.R.; Alagarsamy, K. Taylor series prediction of time series data with error propagated by artificial neural network. Int. J. Comput. Appl. 2014, 89, 41–47. [Google Scholar]
- Khishe, M.; Mosavi, M.R. Chimp optimization algorithm. Expert Syst. Appl. 2020, 149, 113338. [Google Scholar] [CrossRef]
- Ohana, B.; Tierney, B. Sentiment classification of reviews using SentiWordNet. In Proceedings of the IT&T, Dublin, Ireland, 22–23 October 2009. [Google Scholar]
- Christian, H.; Agus, M.P.; Suhartono, D. Single document automatic text summarization using term frequency-inverse document frequency (TF-IDF). ComTech Comput. Math. Eng. Appl. 2016, 7, 285–294. [Google Scholar] [CrossRef]


| Method | Metrics | HSACN | MCNN | Qu Opt. | DCBVN | Proposed Method |
|---|---|---|---|---|---|---|
| Cluster Size = 3 | Precision | 0.684 | 0.784 | 0.814 | 0.896 | 0.925 |
| Recall | 0.685 | 0.805 | 0.854 | 0.925 | 0.944 | |
| F1-score | 0.684 | 0.794 | 0.833 | 0.910 | 0.934 | |
| Cluster Size = 4 | Precision | 0.674 | 0.798 | 0.825 | 0.905 | 0.936 |
| Recall | 0.695 | 0.814 | 0.854 | 0.925 | 0.941 | |
| F1-score | 0.685 | 0.806 | 0.839 | 0.915 | 0.938 |
| Method | Metrics | HSACN | MCNN | Qu Opt. | DCBVN | Proposed Method |
|---|---|---|---|---|---|---|
| Cluster Size = 3 | Precision | 0.672 | 0.772 | 0.798 | 0.877 | 0.908 |
| Recall | 0.665 | 0.795 | 0.837 | 0.914 | 0.928 | |
| F1-score | 0.667 | 0.776 | 0.813 | 0.899 | 0.919 | |
| Cluster Size = 4 | Precision | 0.667 | 0.776 | 0.813 | 0.899 | 0.919 |
| Recall | 0.676 | 0.798 | 0.839 | 0.907 | 0.926 | |
| F1-score | 0.674 | 0.788 | 0.825 | 0.899 | 0.925 |
| Dataset | Time | HSACN | MCNN | Qu Opt. | DCBVN | Proposed Method |
|---|---|---|---|---|---|---|
| E-Khool | Seconds | 182.41 | 180.41 | 162.25 | 145.36 | 127.25 |
| Coursera Course | Seconds | 192.45 | 187.52 | 170.54 | 153.25 | 133.84 |
Publisher’s Note: MDPI stays neutral with regard to jurisdictional claims in published maps and institutional affiliations. |
© 2022 by the authors. Licensee MDPI, Basel, Switzerland. This article is an open access article distributed under the terms and conditions of the Creative Commons Attribution (CC BY) license (https://creativecommons.org/licenses/by/4.0/).
Share and Cite
Banbhrani, S.K.; Xu, B.; Lin, H.; Sajnani, D.K. Taylor-ChOA: Taylor-Chimp Optimized Random Multimodal Deep Learning-Based Sentiment Classification Model for Course Recommendation. Mathematics 2022, 10, 1354. https://doi.org/10.3390/math10091354
Banbhrani SK, Xu B, Lin H, Sajnani DK. Taylor-ChOA: Taylor-Chimp Optimized Random Multimodal Deep Learning-Based Sentiment Classification Model for Course Recommendation. Mathematics. 2022; 10(9):1354. https://doi.org/10.3390/math10091354
Chicago/Turabian StyleBanbhrani, Santosh Kumar, Bo Xu, Hongfei Lin, and Dileep Kumar Sajnani. 2022. "Taylor-ChOA: Taylor-Chimp Optimized Random Multimodal Deep Learning-Based Sentiment Classification Model for Course Recommendation" Mathematics 10, no. 9: 1354. https://doi.org/10.3390/math10091354
APA StyleBanbhrani, S. K., Xu, B., Lin, H., & Sajnani, D. K. (2022). Taylor-ChOA: Taylor-Chimp Optimized Random Multimodal Deep Learning-Based Sentiment Classification Model for Course Recommendation. Mathematics, 10(9), 1354. https://doi.org/10.3390/math10091354