
Optimization of the Cognitive Processes in a Virtual Classroom: A Multi-objective Integer Linear Programming Approach


Abstract
1. Introduction
2. Related Cognitive Processing and Environment Works
3. Materials and Methods
3.1. Participants
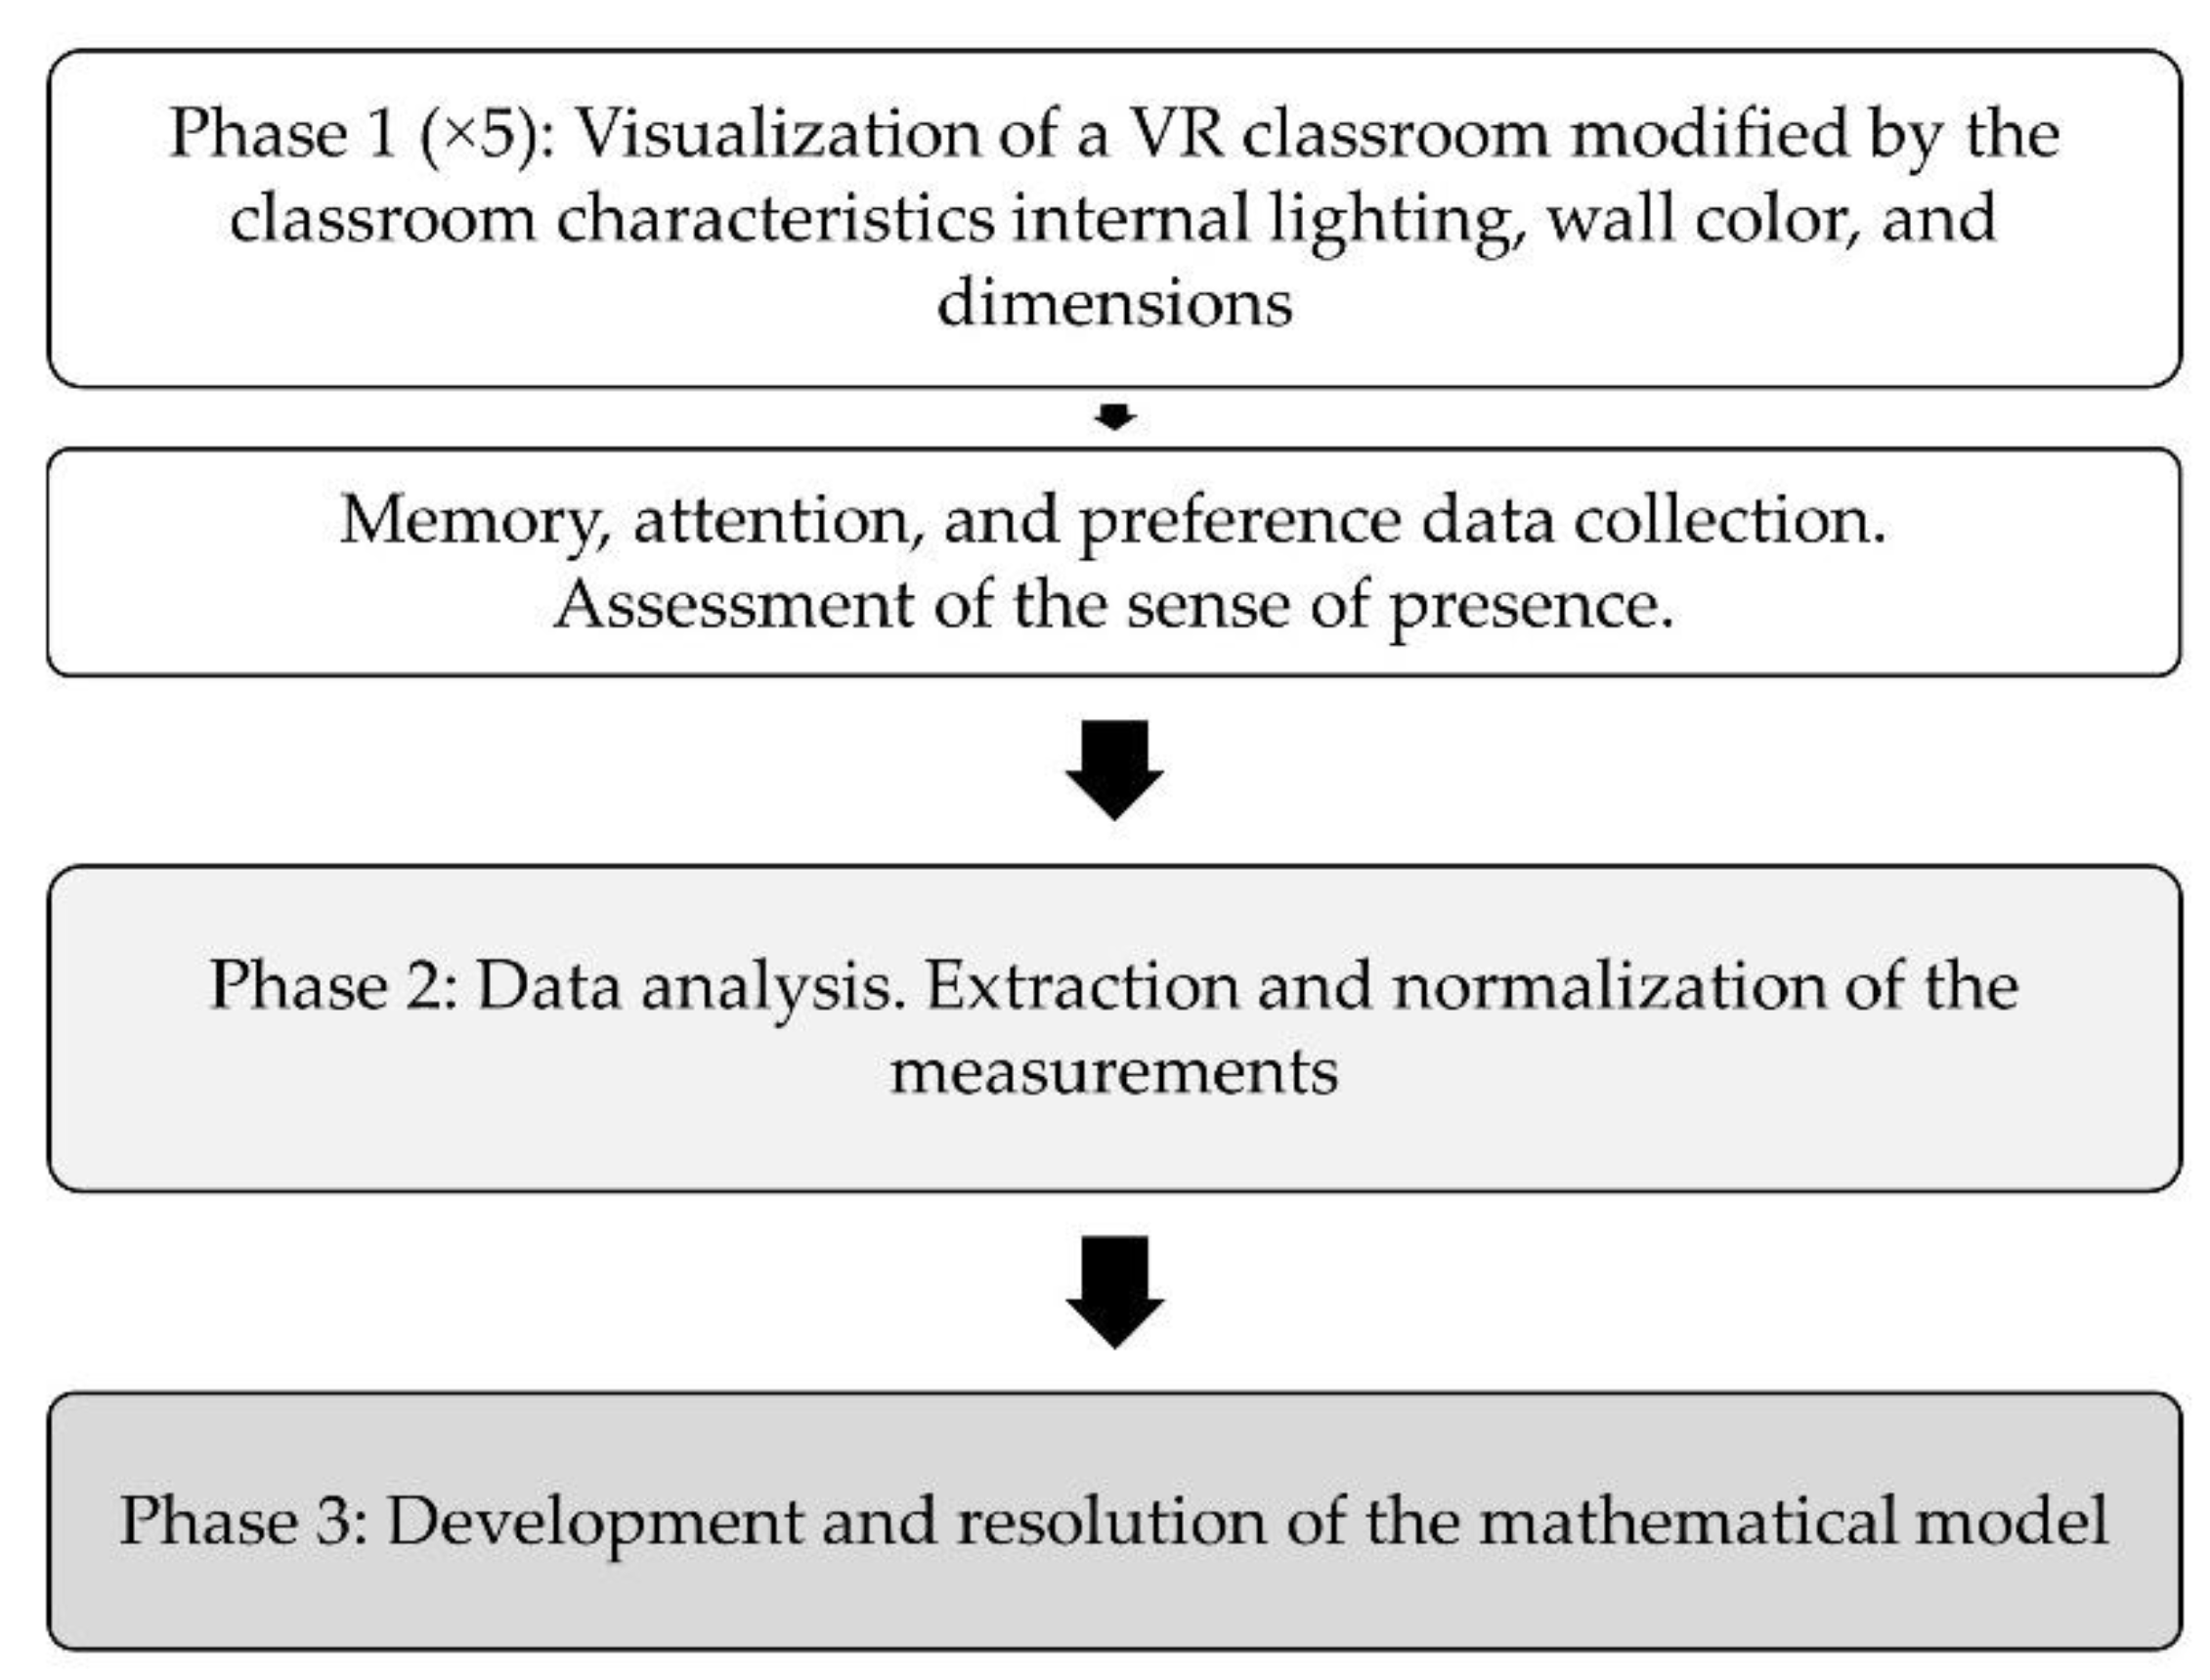
3.2. Procedure
3.3. Experimental Design
3.3.1. Conditions
3.3.2. Materials Set-Up
3.4. Metrics
3.4.1. Memory Task
3.4.2. Attention Task
3.4.3. Preference Task
3.4.4. Sense of Presence
3.5. Data Collection Results
- Let and be the 0–1 variables whose values of 1 indicate that the classroom has lighting with illuminance of type i, color temperature of type j, dimensions with height type i, and width type j, and walls colored with hue type i, and with saturation type j, respectively. Conversely, a 0 value indicates that the classroom does not have type i lighting and j-type color temperature, dimensions of height type i and width type j, and walls colored with tone type i and saturation of type j, respectively. These variables are shown in column 3 of Table 1, Table 2 and Table 3, respectively.
4. Mathematical Model
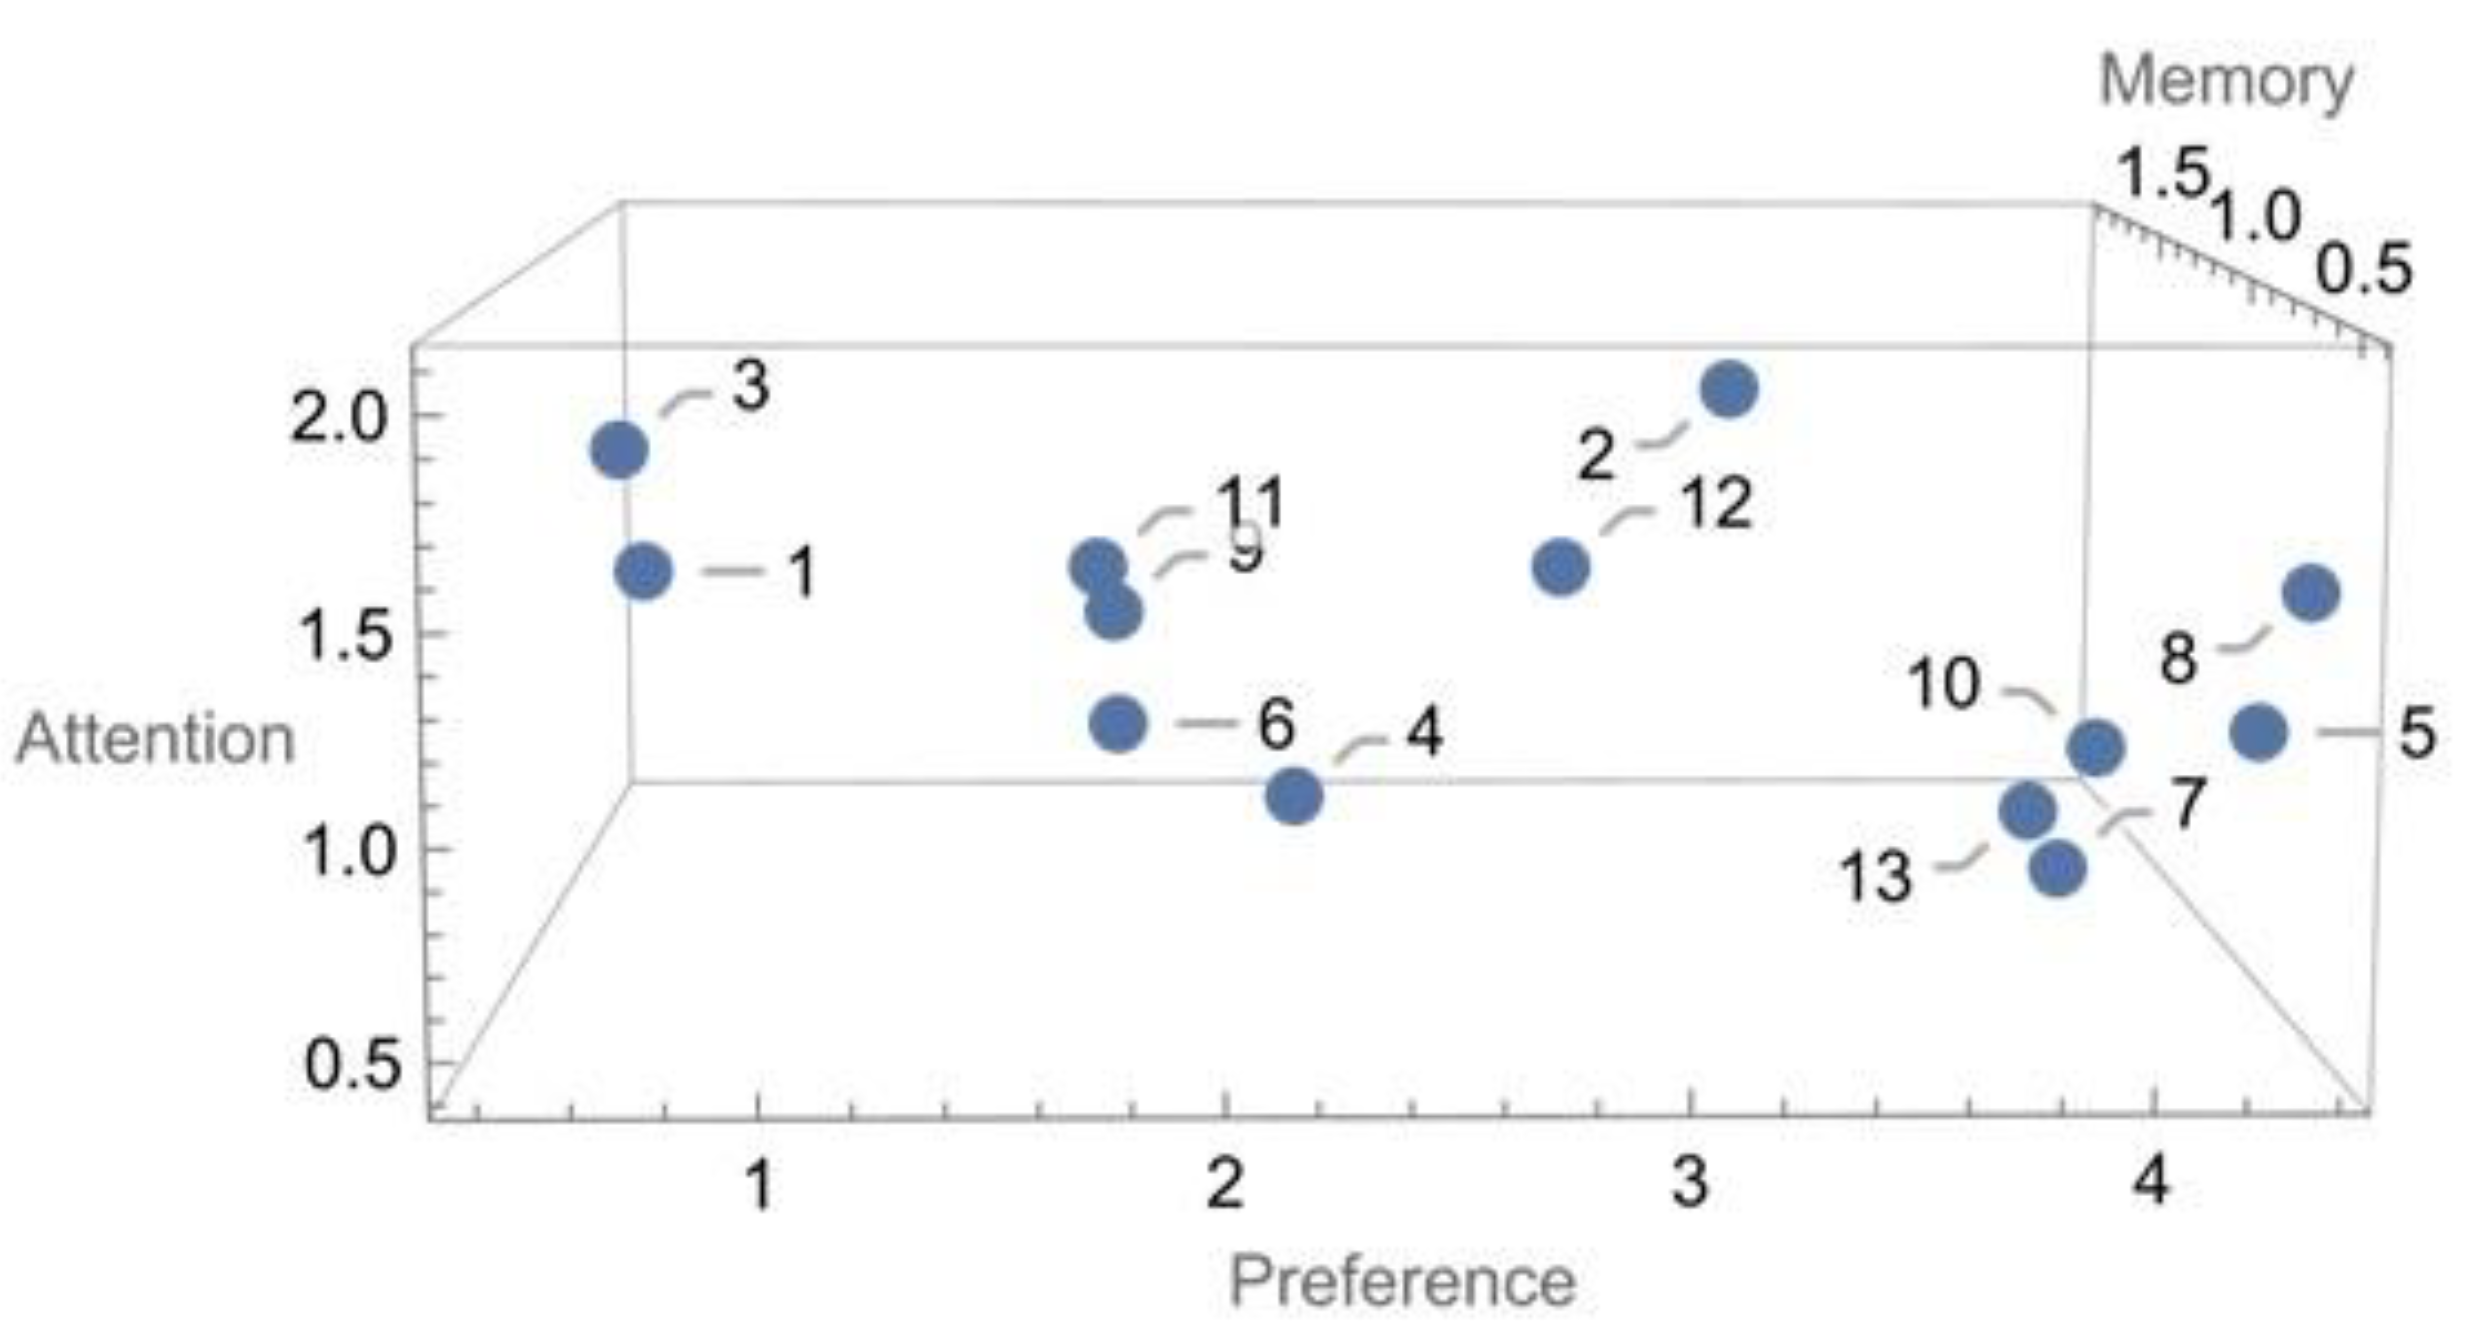
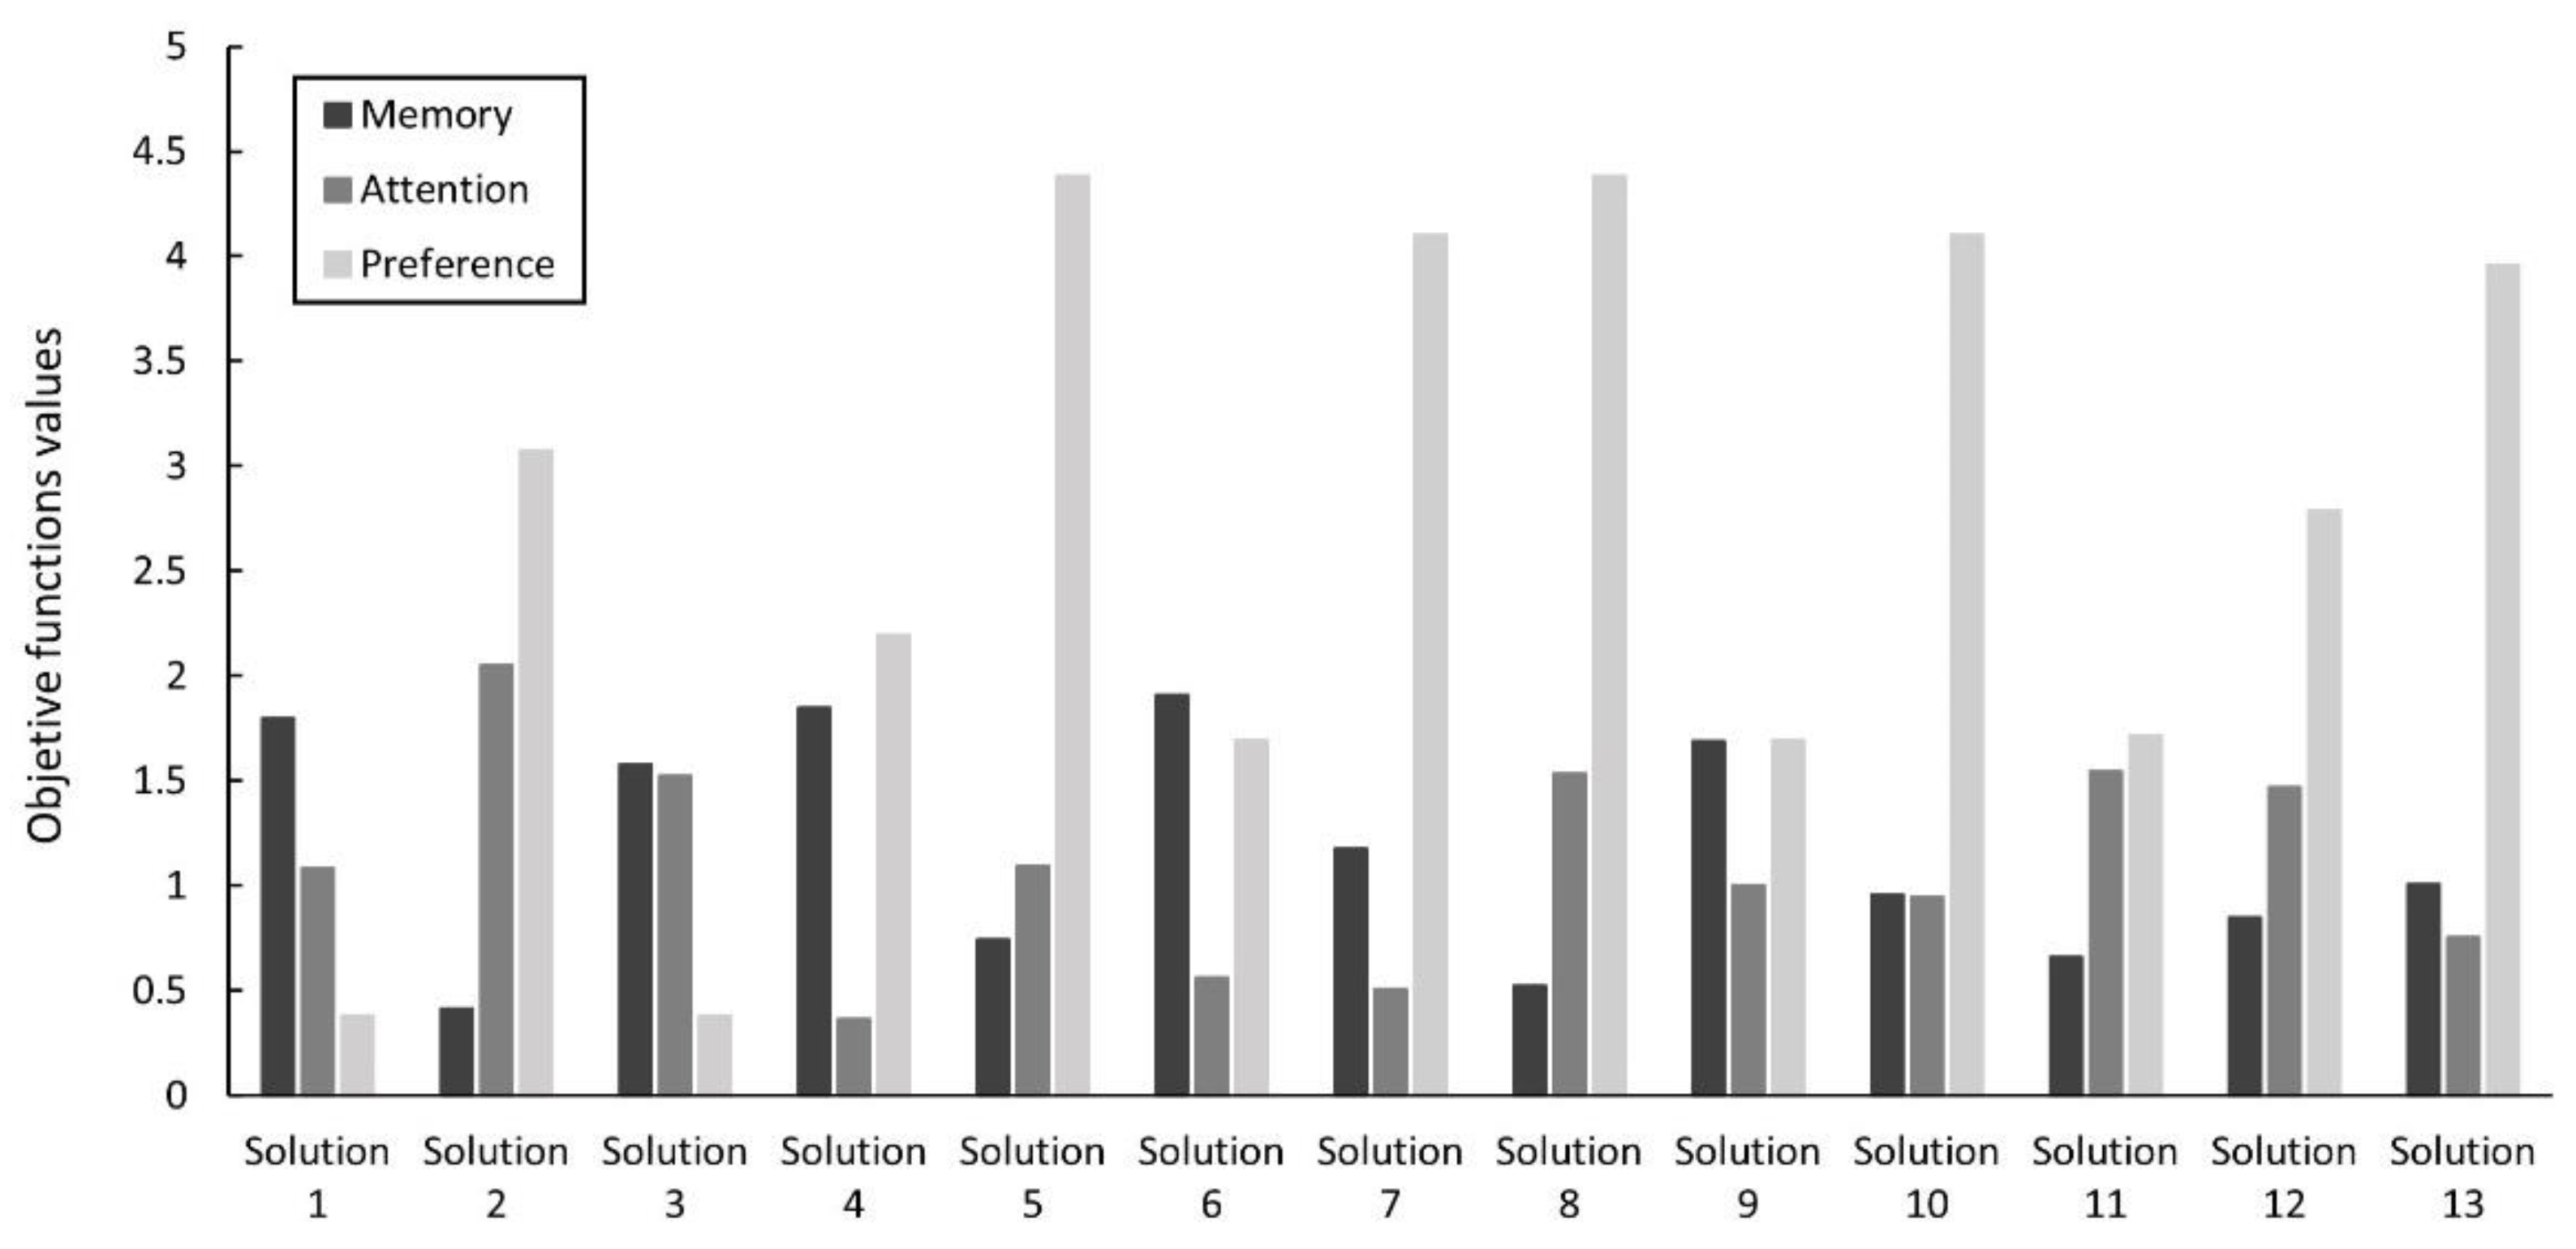
5. Results
6. Discussion
7. Conclusions and Future Research
Author Contributions
Funding
Institutional Review Board Statement
Informed Consent Statement
Data Availability Statement
Acknowledgments
Conflicts of Interest
References
- Luptacik, M. Multiobjetive linear programming. In Mathematical Optimization and Economic Analysis, 1st ed.; Pardalos, P.M., Du, D.Z., Eds.; Springer: New York, NY, USA, 2010; Volume 36, pp. 243–269. [Google Scholar]
- Sakawa, M.; Yano, H.; Nishizaki, I. Multiobjective linear programming. In Linear and Multiobjective Programming with Fuzzy Stochastic Extensions, 1st ed.; Hillier., F.S., Ed.; Springer: Boston, MA, USA, 2013; Volume 203, pp. 73–102. [Google Scholar]
- Antunes, C.H.; Alves, M.J.; Clímaco, J. Multiobjective integer and mixed-integer linear programming. In Multiobjective Linear and Integer Programming, 1st ed.; Antunes, C.H., Alves, M.J., Clímaco, J., Eds.; Springer: Cham, Switzerland, 2016; pp. 161–203. [Google Scholar]
- Herzel, A.; Ruzika, S.; Thielen, C. Approximation methods for multiobjective optimization problems: A survey. INFORMS J. Comput. 2020, 33, 1284–1299. [Google Scholar] [CrossRef]
- Halffmann, P.; Schäfer, L.E.; Dächert, K.; Klamroth, K.; Ruzika, S. Exact algorithms for multiobjective linear optimization problems with integer variables: A state of the art survey. J. Multi-Criteria Decis. Anal. 2022, 1–23. [Google Scholar] [CrossRef]
- Sherali, H.D.; Driscoll, P.J. Evolution and state-of-the-art in integer programming. J. Comput. Appl. Math. 2000, 124, 319–340. [Google Scholar] [CrossRef]
- Chan, D.Y.; Ku, C.Y.; Li, M.C. A method to improve integer linear programming problem with branch-and-bound procedure. Appl. Math. Comput. 2006, 179, 484–493. [Google Scholar] [CrossRef]
- Fallah, M.K.; Fazlali, M.; Daneshtalab, M. A symbiosis between population based incremental learning and LP-relaxation based parallel genetic algorithm for solving integer linear programming models. Computing 2021, 1–19. [Google Scholar] [CrossRef]
- Tantawy, S.F. A new procedure for solving integer linear programming problems. Arab. J. Sci. Eng. 2014, 39, 5265–5269. [Google Scholar] [CrossRef]
- Tengan, T.; Yoshida, T.; Nakamura, M. A monte carlo iterative optimization algorithm for integer linear programming problems. Int. J. Comput. Sci. Netw. Secur. 2018, 18, 60–67. [Google Scholar]
- Alves, M.J.; Clímaco, J. A review of interactive methods for multiobjective integer and mixed-integer programming. Eur. J. Oper. Res. 2007, 180, 99–115. [Google Scholar] [CrossRef]
- Köhn, H.F. A review of multiobjective programming and its application in quantitative psychology. J. Math. Psychol. 2011, 55, 386–396. [Google Scholar] [CrossRef]
- González-Gallardo, S.; Ruiz, A.B.; Luque, M. Analysis of the well-being levels of students in spain and finland through interval multiobjective linear programming. Mathematics 2021, 9, 1628. [Google Scholar] [CrossRef]
- Oliveira, C.; Antunes., C.H. Multiple objective linear programming models with interval coefficients—An illustrated overview. Eur. J. Oper. Res. 2007, 181, 1434–1463. [Google Scholar] [CrossRef]
- Prieto-Latorre, C.; Lopez-Agudo, L.A.; Luque, M.; Marcenaro-Gutierrez, O.D. The ideal use of the internet and academic success: Finding a balance between competences and knowledge using interval multiobjective programming. Socio-Econ. Plan. Sci. 2021, 101208. [Google Scholar] [CrossRef]
- Karakas, T.; Yildiz, D. Exploring the influence of the built environment on human experience through a neuroscience approach: A systematic review. Front. Archit. Res. 2020, 9, 236–247. [Google Scholar] [CrossRef]
- Marín-Morales, J.; Higuera-Trujillo, J.L.; Guixeres, J.; Llinares, C.; Alcañiz, M.; Valenza, G. Heart rate variability analysis for the assessment of immersive emotional arousal using virtual reality: Comparing real and virtual scenarios. PLoS ONE 2021, 16, e0254098. [Google Scholar] [CrossRef] [PubMed]
- Ammann, J.; Stucki, M.; Siegrist, M. True colours: Advantages and challenges of virtual reality in a sensory science experiment on the influence of colour on flavour identification. Food Qual. Prefer. 2020, 86, 103998. [Google Scholar] [CrossRef]
- Latini, A.; Di Giuseppe, E.; D’Orazio, M.; Di Perna, C. Exploring the use of immersive virtual reality to assess occupants’ productivity and comfort in workplaces: An experimental study on the role of walls colour. Energy Build. 2021, 253, 111508. [Google Scholar] [CrossRef]
- Armougum, A.; Orriols, E.; Gaston-Bellegarde, A.; Joie-La Marle, C.; Piolino, P. Virtual reality: A new method to investigate cognitive load during navigation. J. Environ. Psychol. 2019, 65, 101338. [Google Scholar] [CrossRef]
- Rizzo, A.A.; Bowerly, T.; Buckwalter, J.G.; Klimchuk, D.; Mitura, R.; Parsons, T.D. A virtual reality scenario for all seasons: The virtual classroom. Cns Spectr. 2006, 11, 35–44. [Google Scholar] [CrossRef]
- Iriarte, Y.; Diaz-Orueta, U.; Cueto, E.; Irazustabarrena, P.; Banterla, F.; Climent, G. AULA—Advanced virtual reality tool for the assessment of attention: Normative study in Spain. J. Atten. Disord. 2016, 20, 542–568. [Google Scholar] [CrossRef]
- Diaz-Orueta, U.; Garcia-López, C.; Crespo-Eguilaz, N.; Sánchez-Carpintero, R.; Climent, G.; Narbona, J. AULA virtual reality test as an attention measure: Convergent validity with Conners’ Continuous Performance Test. Child Neuropsychol. 2013, 20, 328–342. [Google Scholar] [CrossRef]
- Hoffman, A.J. Going “green” from gray: Providing opportunities of community development and sustainability within a correctional facilities program. J. Prev. Interv. Community 2020, 48, 272–280. [Google Scholar] [CrossRef]
- Kim, D.; Hyun, H.; Park, J. The effect of interior color on customers’ aesthetic perception, emotion, and behavior in the luxury service. J. Retail. Consum. Serv. 2020, 57, 102252. [Google Scholar] [CrossRef]
- Toews, B.; Wagenfeld, A.; Stevens, J.; Shoemaker, C. Feeling at home in nature: A mixed method study of the impact of visitor activities and preferences in a prison visiting room garden. J. Offender Rehabil. 2020, 59, 223–246. [Google Scholar] [CrossRef]
- Ulrich, R.S. View through a window may influence recovery from surgery. Science 1984, 224, 420–421. [Google Scholar] [CrossRef] [PubMed]
- Pritchard, A. Ways of Learning: Learning Theories for the Classroom, 4th ed.; Routledge: London, UK, 2017. [Google Scholar]
- Schunk, D.H. Learning Theories an Educational Perspective, 6th ed.; Pearson: Boston, MA, USA, 2012. [Google Scholar]
- Brosowsky, N.P.; Murray, S.; Schooler, J.W.; Seli, P. Attention need not always apply: Mind wandering impedes explicit but not implicit sequence learning. Cognition 2021, 209, 104530. [Google Scholar] [CrossRef] [PubMed]
- Jongbloed-Pereboom, M.; Nijhuis-Van der Sanden, M.W.G.; Steenbergen, B. Implicit and explicit motor learning in typically developing children: Effects of task, age and working memory. Physiotherapy 2015, 101, e693–e694. [Google Scholar] [CrossRef][Green Version]
- Sörqvist, P.; Marsh, J.E. How concentration shields against distraction. Curr. Dir. Psychol. Sci. 2015, 24, 267–272. [Google Scholar] [CrossRef]
- Sörqvist, P.; Dahlström, Ö.; Karlsson, T.; Rönnberg, J. Concentration: The neural underpinnings of how cognitive load shields against distraction. Front. Hum. Neurosci. 2016, 10, 221. [Google Scholar] [CrossRef]
- Gao, T.; Zhang, T.; Zhu, L.; Gao, Y.; Qiu, L. Exploring psychophysiological restoration and individual preference in the different environments based on virtual reality. Int. J. Environ. Res. Public Health 2019, 16, 3102. [Google Scholar] [CrossRef]
- Bryan, T.; Mathur, S.; Sullivan, K. The impact of positive mood on learning. Learn. Disabil. Q. 1996, 19, 153–162. [Google Scholar] [CrossRef]
- Loewen, L.J.; Suedfeld, P. Cognitive and arousal effects of masking office noise. Environ. Behav. 1992, 24, 381–395. [Google Scholar] [CrossRef]
- Aldridge, S.; Rowley, J. Measuring customer satisfaction in higher education. Qual. Assur. Educ. 1998, 6, 197–204. [Google Scholar] [CrossRef]
- Van den Berg, A.E.; Wesselius, J.E.; Maas, J.; Tanja-Dijkstra, K. Green walls for a restorative classroom environment: A controlled evaluation study. Environ. Behav. 2017, 49, 791–813. [Google Scholar] [CrossRef]
- Doxey, J.S.; Waliczek, T.M.; Zajicek, J.M. The impact of interior plants in university classrooms on student course performance and on student perceptions of the course and instructor. HortScience 2009, 44, 384–391. [Google Scholar] [CrossRef]
- Daly, J.; Burchett, M.; Torpy, F.; National Interior Plantscape Association. Plants in the classroom can improve student performance. 2010. Available online: https://www.wolvertonenvironmental.com/Plants-Classroom.pdf (accessed on 13 February 2022).
- Wheldall, K.; Lam, Y.Y. Rows versus Tables. II. The Effects of Two Classroom Seating Arrangements on Classroom Disruption Rate, On-task Behaviour and Teacher Behaviour in Three Special School Classes. Educ. Psychol. 1987, 7, 303–312. [Google Scholar] [CrossRef]
- Baum, E.J. Learning space design and classroom behavior. Int. J. Learn. Teach. Educ. Res. 2018, 17, 34–54. [Google Scholar] [CrossRef][Green Version]
- Wannarka, R.; Ruhl, K. Seating arrangements that promote positive academic and behavioural outcomes: A review of empirical research. Support Learn. 2008, 23, 89–93. [Google Scholar] [CrossRef]
- Shernoff, D.; Sannella, A.; Schorr, R.; Sanchez-Wall, L.; Ruzek, E.; Sinha, S.; Bressler, D. Separate worlds: The influence of seating location on student engagement, classroom experience, and performance in the large university lecture hall. J. Environ. Psychol. 2017, 49, 55–64. [Google Scholar] [CrossRef]
- Park, E.L.; Choi, B.K. Transformation of classroom spaces: Traditional versus active learning classroom in colleges. High. Educ. 2014, 68, 749–771. [Google Scholar] [CrossRef]
- Marchand, G.; Nardi, N.M.; Reynolds, D.; Pamoukov, S. The impact of the classroom built environment on student perceptions and learning. J. Environ. Psychol. 2014, 40, 187–197. [Google Scholar] [CrossRef]
- Bernardo, F.; Loupa-Ramos, I.; Matos, C.; Manso, M. The restorative effect of the presence of greenery on the classroom in children’s cognitive performance. Sustainability 2021, 13, 3488. [Google Scholar] [CrossRef]
- Barrett, P.; Davies, F.; Zhang, Y.; Barrett, L. The impact of classroom design on pupils’ learning: Final results of a holistic, multi-level analysis. Build. Environ. 2015, 89, 118–133. [Google Scholar] [CrossRef]
- Kwallek, N.; Lewis, C.M.; Lin-Hsiao, J.W.D.; Woodson, H. Effects of nine monochromatic office interior colors on clerical tasks and worker mood. Color Res. Appl. 1996, 21, 448–458. [Google Scholar] [CrossRef]
- Cockerill, I.M.; Miller, B.P. Children’s Colour Preferences and Motor Skill Performance with Variation in Environmental Colour. Percept. Mot. Ski. 1983, 56, 845–846. [Google Scholar] [CrossRef]
- Stone, N.J. Environmental view and color for a simulated telemarketing task. J. Environ. Psychol. 2003, 23, 63–78. [Google Scholar] [CrossRef]
- Xia, T.; Song, L.; Wang, T.T.; Tan, L.; Mo, L. Exploring the Effect of Red and Blue on Cognitive Task Performances. Front. Psychol. 2016, 7, 784. [Google Scholar] [CrossRef]
- Llinares, C.; Higuera-Trujillo, J.L.; Serra, J. Cold and warm coloured classrooms. Effects on students’ attention and memory measured through psychological and neurophysiological responses. Build. Environ. 2021, 196, 107726. [Google Scholar] [CrossRef]
- Jago, E.; Tanner, K. Influence of the School Facility on Studies Achievement: Lighting; Color, Athens, Ga; Department of Educational Leadership, University of Georgia: Athens, GA, USA, 1999. [Google Scholar]
- Smolders, K.C.; de Kort, Y.A. Bright light and mental fatigue: Effects on alertness, vitality, performance and physiological arousal. J. Environ. Psychol. 2014, 39, 77–91. [Google Scholar] [CrossRef]
- Llinares, C.; Castilla, N.; Higuera-Trujillo, J.L. Do attention and memory tasks require the same lighting? A study in university classrooms. Sustainability 2021, 13, 8374. [Google Scholar] [CrossRef]
- Huiberts, L.M.; Smolders, K.C.H.J.; de Kort, Y.A.W. Shining light on memory: Effects of bright light on working memory performance. Behav. Brain Res. 2015, 294, 234–245. [Google Scholar] [CrossRef]
- Keis, O.; Helbig, H.; Streb, J.; Hille, K. Influence of blue-enriched classroom lighting on students cognitive performance. Trends Neurosci. Educ. 2014, 3, 86–92. [Google Scholar] [CrossRef]
- Read, M.A.; Sugawara, A.I.; Brandt, J.A. Impact of space and color in the physical environment on preschool children’s cooperative behavior. Environ. Behav. 1999, 31, 413–428. [Google Scholar] [CrossRef]
- Llinares, C.; Higuera-Trujillo, J.L.; Montañana i Aviñó, A.; Torres, J.; Sentieri, C. The influence of classroom width on attention and memory: Virtual-reality-based task performance and neurophysiological effects. Build. Res. Inf. 2021, 49, 813–826. [Google Scholar] [CrossRef]
- Roskos, K.; Neuman, S.B. The classroom environment: First, last, and always. Read. Teach. 2021, 65, 110–114. [Google Scholar] [CrossRef]
- Yang, Z.; Becerik-Gerber, B.; Mino, L. A study on student perceptions of higher education classrooms: Impact of classroom attributes on student satisfaction and performance. Build. Environ. 2013, 70, 171–188. [Google Scholar] [CrossRef]
- Ahrentzen, S.; Evans, G.W. Distraction, privacy, and classroom design. Environ. Behav. 1984, 16, 437–454. [Google Scholar] [CrossRef]
- Smolders, K.C.; De Kort, Y.A.; Cluitmans, P.J.M. A higher illuminance induces alertness even during office hours: Findings on subjective measures, task performance and heart rate measures. Physiol. Behav. 2012, 107, 7–16. [Google Scholar] [CrossRef]
- Al-Ayash, A.; Kane, R.T.; Smith, D.; Green-Armytage, P. The influence of color on student emotion, heart rate, and performance in learning environments. Color Res. Appl. 2016, 41, 196–205. [Google Scholar] [CrossRef]
- Steuer, J. Defining virtual reality: Dimensions determining telepresence. J. Commun. 1992, 42, 73–93. [Google Scholar] [CrossRef]
- Lombard, M.; Ditton, T. At the heart of it all: The concept of presence. J. Comput.-Mediat. Commun. 1997, 3, JCMC321. [Google Scholar] [CrossRef]
- Higuera-Trujillo, J.L.; Maldonado, J.L.T.; Millán, C.L. Psychological and physiological human responses to simulated and real environments: A comparison between photographs, 360 panoramas, and virtual reality. Appl. Ergon. 2017, 65, 398–409. [Google Scholar] [CrossRef] [PubMed]
- Itten, J. Design and Form: The Basic Course at the Bauhaus, 1st ed.; Thames & Hudson: London, UK, 1987. [Google Scholar]
- Beato, M.S.; Díez, E. False recognition production indexes in Spanish for 60 DRM lists with three critical words. Behav. Res. Methods 2001, 43, 499–507. [Google Scholar] [CrossRef] [PubMed][Green Version]
- Seidman, L.J.; Breiter, H.C.; Goodman, J.M.; Goldstein, J.M.; Woodruff, P.W.R.; O’Craven, K.; Savoy, R.; Tsuang, M.T.; Rosen, B.R. A functional magnetic resonance imaging study of auditory vigilance with low and high information processing demands. Neuropsychology 1998, 12, 505. [Google Scholar] [CrossRef] [PubMed]
- Galindo-Galindo, M.P.; Corraliza Rodríguez, J.A. Estética ambiental y bienestar psicológico: Algunas relaciones existentes entre los juicios de preferencia por paisajes urbanos y otras respuestas afectivas relevantes. Apunt. Psicol. 2012, 30, 289–303. [Google Scholar]
- Slater, M.; Usoh, M.; Steed, A. Depth of presence in virtual environments. Presence Teleoperators Virtual Environ. 1994, 3, 130–144. [Google Scholar] [CrossRef]
- Slater, M.; Steed, A. A virtual presence counter. Presence Teleoperators Virtual Environ. 2000, 9, 413–434. [Google Scholar] [CrossRef]
- Vogel, S.; Schwabe, L. Learning and memory under stress: Implications for the classroom. Npj Sci. Learn. 2016, 1, 16011. [Google Scholar] [CrossRef]
- Sart, G. The effects of the development of metacognition on project-based learning. Procedia-Soc. Behav. Sci. 2014, 152, 131–136. [Google Scholar] [CrossRef]
- Mattis, K.V. Flipped classroom versus traditional textbook instruction: Assessing accuracy and mental effort at different levels of mathematical complexity. Technol. Knowl. Learn. 2015, 20, 231–248. [Google Scholar] [CrossRef]
- Burke, K.; Burke-Samide, B. Required changes in the classroom environment it’s a matter of design. Clear. House A J. Educ. Strateg. Issues Ideas 2004, 77, 236–240. [Google Scholar] [CrossRef]
- Ferlazzo, F.; Piccardi, L.; Burattini, C.; Barbalace, M.; Giannini, A.M.; Bisegna, F. Effects of new light sources on task switching and mental rotation performance. J. Environ. Psychol. 2014, 39, 92–100. [Google Scholar] [CrossRef]
- Leccese, F.; Salvadori, G.; Öner, M.; Kazanasmaz, T. Exploring the impact of external shading system on cognitive task performance, alertness and visual comfort in a daylit workplace environment. Indoor Built Environ. 2020, 29, 942–955. [Google Scholar] [CrossRef]
- Leichtfried, V.; Mair-Raggautz, M.; Schaeffer, V.; Hammerer-Lercher, A.; Mair, G.; Bartenbach, C.; Canazei, M.; Schobersberger, W. Intense illumination in the morning hours improved mood and alertness but not mental performance. Appl. Ergon. 2015, 46, 54–59. [Google Scholar] [CrossRef] [PubMed]
- Mahnke, F.H. Color, Environment, and Human Response: An Interdisciplinary Understanding of Color and Its Use as a Beneficial Element in the Design of the Architectural Environment; John Wiley & Sons: Hoboken, NJ, USA, 1996. [Google Scholar]
- Barrett, P.; Zhang, Y.; Moffat, J.; Kobbacy, K. A holistic, multilevel analysis identifying the impact of classroom design on pupils’ learning. Build. Environ. 2013, 59, 678–689. [Google Scholar] [CrossRef]
- Vartanian, O.; Navarrete, G.; Chatterjee, A.; Fich, L.B.; Gonzalez-Mora, J.L.; Leder, H.; Skov, M. Architectural design and the brain: Effects of ceiling height and perceived enclosure on beauty judgments and approach-avoidance decisions. J. Environ. Psychol. 2015, 41, 10–18. [Google Scholar] [CrossRef]
- Herzog, T.R. A cognitive analysis of preference for urban spaces. J. Environ. Psychol. 1992, 12, 237–248. [Google Scholar] [CrossRef]
- Stamps, A.E. Simulation effects on environmental preference. J. Environ. Manag. 1993, 38, 115–132. [Google Scholar] [CrossRef]
- Lipczynska, A.; Schiavon, S.; Graham, L.T. Thermal comfort and self-reported productivity in an office with ceiling fans in the tropics. Build. Environ. 2018, 135, 202–212. [Google Scholar] [CrossRef]
- Bear, M.F.; Connors, B.W.; Paradiso, M.A. Neurociencia: La Exploración del Cerebro; Wolters Kluwer: Alphen aan den Rijn, The Netherlands, 2016. [Google Scholar]
- Carlson, N.R.; Platón, M.J.R.; Carson, N.R.; Urbano, B.C. Fundamentos de Fisiología de la Conducta; Pearson Educación: London, UK, 2010. [Google Scholar]
- Ganong, W.F.; Barrett, K.E.; Barman, S.M.; Boitano, S.; Brooks, H.L. Ganong. In Sección III: Neurofesiología Central y Periferica; McGraw-Hill Interamericana Editores: Ciudad de México, Mexico, 2010; pp. 167–299. [Google Scholar]
- Yang, W.; Moon, H.J. Combined effects of acoustic, thermal, and illumination conditions on the comfort of discrete senses and overall indoor environment. Build. Environ. 2019, 148, 623–633. [Google Scholar] [CrossRef]
- Picucci, L.; Caffò, A.O.; Bosco, A. Besides navigation accuracy: Gender differences in strategy selection and level of spatial confidence. J. Environ. Psychol. 2011, 31, 430–438. [Google Scholar] [CrossRef]
- Miola, L.; Meneghetti, C.; Toffalini, E.; Pazzaglia, F. Environmental learning in a virtual environment: Do gender, spatial self-efficacy, and visuospatial abilities matter? J. Environ. Psychol. 2021, 78, 101704. [Google Scholar] [CrossRef]


| Reference | Classroom Design Parameters | Experience Register Behavioral | Experience Methods |
|---|---|---|---|
| Ahrentzen and Evans, 1984 | Interior Spaciousness; Degree of Open Perimeter and Amenities | Distraction; Privacy | RC 3 |
| Wheldall and Lam, 1987 | Seating Arrangements | Classroom Disruption Rate; Task Behavior; Teacher Behavior | RC 3 |
| Jago and Tanner, 1999 | Lighting; Color | Academic Progress | RC 3 |
| Read, Sugawara, and Brandt, 1999 | Ceiling Height; Wall Color | Cooperative Behavior | RC 3 |
| Wannarka Ruhl, 2008 | Seating Arrangements | Attention; Instructional Time | RC 3 |
| Doxey, Waliczek, and Zajicek, 2009 | Plants | Cognitive Performance; Perception | RC 3 |
| Daly, Burchett, and Torpy, 2010 | Plants | Classroom Performance | RC 3 |
| Yang, Becerik-Gerber, and Mino, 2013 | Temperature; Air quality; Artificial and Natural Lighting; Acoustics; Visibility; Room Layout; Furniture; Hardware and Software. | Satisfaction; Performance | RC 3 |
| Park and Choi, 2014 | Seating Arrangements | Motivation; Participation | RC 3 |
| Marchand, Nardi, Reynolds, et al., 2014 | Lighting; Sound; Temperature | Student Learning; Mood; Environmental Perception | RC 3 |
| Smolders and de Kort, 2014 | Lighting (Bright Light) | Alertness; Vitality; Performance and Physiological Arousal (HRV 1 and Electrodermal Activity) | ER 4 |
| Keis, Helbig, Streb, et al., 2014 | Lighting (Blue-enriched White Light vs. Standard Lighting) | Speed of Cognitive Processing; Concentration Performance; Visuospatial and Verbal Memory | RC 3 |
| Barrett, Davies, Zhang, et al., 2015 | Lighting; Temperature; Air quality; Ownership; Flexibility; Complexity; Color | Academic Progress | RC 3 |
| Huiberts, Smolders, and de Kort, 2015 | Lighting (Illuminance Level and Bright Light) | Working Memory | ER 4 |
| Xia, Song, Wang, et al., 2016 | Color | Cognitive Task Performance | RC 3 |
| Al-Ayash, Kane, Smith, et al., 2016 | Wall Color | Reading Task Performance; Emotional Responses; Neurophysiological (HRV 1) | ER 4 |
| Van den Berg, Wesselius, Maas, et al., 2017 | Green Walls vs. Plants | Cognitive Performance; Well-being | RC 3 |
| Shernoff, Sannella, Schorr, et al., 2017 | Seating Location | Student Engagement; Attention | RC 3 |
| Baum, 2018 | Node Classroom vs. Spoke Classroom (Seating Arrangement; Lighting; Audio-visual and Computing equipment) | Classroom Activity; Student Attitude | RC 3 |
| Bernardo, Loupa-Ramos, Matos, et al., 2021 | Plants | Sustained and Selective Attention; Working Memory | RC 3 |
| Llinares, Higuera-Trujillo, and Serra, 2021 | Wall color | Attention; Memory; Neurophy-siological (HRV 1 and EEG 2) | VR |
| Llinares, Castilla, and Higuera-Trujillo, 2021 | Lighting (Illuminance; CCT) | Attention; Memory | VR |
| Llinares, Higuera-Trujillo, Montañana i Aviñó, et al., 2021 | Classroom Width | Attention; Memory; Neurophy-siological (HRV 1 and EEG 2) | VR |
| Illuminance | Color Temperature | Variable | |||
|---|---|---|---|---|---|
| 500 lx | 10,500 K | −0.3573 | 0.4647 | 0.7778 | |
| 6500 K | 0.1104 | −0.2373 | 0.6154 | ||
| 4000 K | −0.0857 | 0.208 | 0.6429 | ||
| 3000 K | −0.1174 | 0.0887 | −0.3571 | ||
| 300 lx | 10,500 K | −0.5019 | −0.1531 | 0.3333 | |
| 6500 K | 0.4349 | −0.7734 | 0.0714 | ||
| 4000 K | −0.0525 | 0.0225 | 0.011 | ||
| 3000 K | 0.2053 | −0.2405 | 0.4615 | ||
| 100 lx | 10,500 K | −0.1168 | 0.0298 | 0.5714 | |
| 6500 K | 0.5459 | −0.2542 | 1.3846 | ||
| 4000 K | 0.4598 | 0.1283 | 1 | ||
| 3000 K | −0.1188 | 0.2714 | 0.7059 | ||
| = 0.0338 | = −0.0371 | = 0.5182 |
| Height | Width | Variable | |||
|---|---|---|---|---|---|
| 3.2 m | 8.4 m | 0.2123 | −0.4279 | 1 | |
| 6.2 m | 0.964 | 0.0556 | 0.1333 | ||
| 6 m | 0.3807 | −0.1804 | 1.1429 | ||
| 4.8 m | −0.3999 | 0.2504 | −0.625 | ||
| 3.6 m | −0.1748 | 0.4341 | −2 | ||
| 2.4 m | −0.6995 | 0.6277 | 0 | ||
| 3.8 m | 8.4 m | −0.0828 | 0.1032 | −0.0814 | |
| 6.2 m | 0.1614 | −0.0116 | 0.1333 | ||
| 6 m | −0.3945 | 0.5679 | 0.3333 | ||
| 4.8 m | 0.0007 | 0.5091 | −0.375 | ||
| 3.6 m | −0.4977 | −0.5824 | 0 | ||
| 2.4 m | −0.0565 | −0.1736 | −2.1667 | ||
| 4.4 m | 8.4 m | 0.1639 | −0.6203 | 1.1429 | |
| 6.2 m | 0.0575 | −0.27 | −0.1 | ||
| 6 m | −0.5299 | 0.0587 | −1 | ||
| 4.8 m | 0.0537 | 0.1453 | −0.1429 | ||
| 3.6 m | −0.1942 | −0.2556 | −1.3333 | ||
| 2.4 m | −0.5925 | 0.916 | −0.8333 | ||
| 2.6 m | 8.4 m | −032256 | −0.432 | 0.5455 | |
| 6.2 m | −0.1003 | −0.2714 | 0.3077 | ||
| 6 m | −0.1668 | 2.2663 | −1.2857 | ||
| 4.8 m | −0.2615 | 0.117 | 1 | ||
| 3.6 m | 0.1623 | −0.0309 | −2.625 | ||
| 2.4 m | 0.0421 | 0.7354 | −1.7143 | ||
| = −0.1269 | = 0.1471 | = −0.3417 |
| Hue | Saturation | Variable | |||
|---|---|---|---|---|---|
| 5B | High | 0.9211 | 0.0702 | −0.3333 | |
| Low | −0.0039 | 0.2269 | −0.1667 | ||
| 5G | High | −0.4155 | 0.2138 | −0.2 | |
| Low | −0.2939 | 0.4916 | −2.1429 | ||
| 5GY | High | −0.0421 | −0.0328 | −0.8333 | |
| Low | −0.0758 | 0.3397 | 1.4286 | ||
| 5Y | High | −0.6764 | −0.3718 | 1.1429 | |
| Low | −0.1845 | −0.6578 | 1.8571 | ||
| 5YR | High | 0.0605 | −0.1496 | 0.5 | |
| Low | 0.0816 | −0.3638 | −0.3333 | ||
| 5R | High | −0.1929 | 0.3043 | −2.125 | |
| Low | −0.309 | 0.2662 | 1.5 | ||
| 5RP | High | −0.2257 | 0.6897 | −0.625 | |
| Low | −0.544 | −0.3037 | −2.1429 | ||
| 5P | High | 0.3314 | 0.0233 | −1.1667 | |
| Low | 0.9799 | −0.127 | −0.8333 | ||
| 5PB | High | −0.1766 | −0.3066 | 0.2222 | |
| Low | 0.249 | −0.073 | 1.5714 | ||
| 5GB | High | −0.1321 | −0.0261 | 0.6667 | |
| Low | 0.0734 | 0.0751 | −0.1429 | ||
| = −0.0288 | = 0.0144 | = −0.1078 |
| Solutions | n1 | Memory | Attention | Preference | R-h Side 2 | Step 1 |
|---|---|---|---|---|---|---|
| 9 | 1.7955 | 1.0808 | 0.381 | = 0.0686 | 1st run | |
| 200 | 0.4143 | 2.0515 | 3.0714 | |||
| 55 | 1.5787 | 1.5207 | 0.381 | |||
| 50 | 1.8477 | 0.3644 | 2.1942 | |||
| 108 | 0.7421 | 1.0924 | 4.3846 | |||
| 86 | 1.9065 | 0.5616 | 1.6942 | |||
| 121 | 1.1756 | 0.5076 | 4.0989 | |||
| 527 | 0.5253 | 1.5323 | 4.3846 | |||
| 18 | 1.6897 | 1.0015 | 1.6942 | |||
| 3 | 0.9588 | 0.9475 | 4.0989 | |||
| 16 | 0.6593 | 1.5433 | 1.7143 | = 0.4143; = 0.5076; = 1.6942 | 2nd run | |
| 131 | 0.8478 | 1.4667 | 2.7857 | |||
| 672 | 0.7421 | 1.0924 | 4.3846 | |||
| 140 | 1.9065 | 0.5616 | 1.6942 | |||
| 127 | 1.1756 | 0.5076 | 4.0989 | |||
| 83 | 1.6897 | 1.0015 | 1.6942 | |||
| 8 | 0.9588 | 0.9475 | 4.0989 | |||
| 1124 | 0.9588 | 0.9475 | 4.0989 | = 0.5253; = 0.5616; = 3.0714 | 3rd run | |
| 53 | 1.0072 | 0.7551 | 3.956 |
| Design Parameters | Decision Criterion | ||||
|---|---|---|---|---|---|
| Better (Memory, Attention, Preference) | Better (Memory, Attention) | ||||
| 10 | 9 | 1 | 3 | ||
| Lighting | Color Temperature | 6500 K | 6500 K | 6500 K | 6500 K |
| Illuminance | 100 lx | 100 lx | 300 lx | 300 lx | |
| Color | Hue | 5PB | 5P | 5P | 5P |
| Saturation | low | low | low | low | |
| Dimension | Height | 4.4 m | 4.4 m | 3.2 m | 4.4 m |
| Width | 8.4 m | 8.4 m | 6 m | 8.4 m | |
Publisher’s Note: MDPI stays neutral with regard to jurisdictional claims in published maps and institutional affiliations. |
© 2022 by the authors. Licensee MDPI, Basel, Switzerland. This article is an open access article distributed under the terms and conditions of the Creative Commons Attribution (CC BY) license (https://creativecommons.org/licenses/by/4.0/).
Share and Cite
Nolé, M.L.; Soler, D.; Higuera-Trujillo, J.L.; Llinares, C. Optimization of the Cognitive Processes in a Virtual Classroom: A Multi-objective Integer Linear Programming Approach. Mathematics 2022, 10, 1184. https://doi.org/10.3390/math10071184
Nolé ML, Soler D, Higuera-Trujillo JL, Llinares C. Optimization of the Cognitive Processes in a Virtual Classroom: A Multi-objective Integer Linear Programming Approach. Mathematics. 2022; 10(7):1184. https://doi.org/10.3390/math10071184
Chicago/Turabian StyleNolé, María Luisa, David Soler, Juan Luis Higuera-Trujillo, and Carmen Llinares. 2022. "Optimization of the Cognitive Processes in a Virtual Classroom: A Multi-objective Integer Linear Programming Approach" Mathematics 10, no. 7: 1184. https://doi.org/10.3390/math10071184
APA StyleNolé, M. L., Soler, D., Higuera-Trujillo, J. L., & Llinares, C. (2022). Optimization of the Cognitive Processes in a Virtual Classroom: A Multi-objective Integer Linear Programming Approach. Mathematics, 10(7), 1184. https://doi.org/10.3390/math10071184