Article

Comparative Assessment between Five Control Techniques to Optimize the Maximum Power Point Tracking Procedure for PV Systems

1
Laboratory LAPER, University Tunis El Manar, Tunis 2092, Tunisia
2
Department of Mechanical Engineering, College of Engineering, Hail University, Hail 55476, Saudi Arabia
3
Laboratory of Thermal and Energetic Systems Studies, National School of Engineering of Monastir, University of Monastir, Monastir 5000, Tunisia
4
Department of Industrial Engineering, College of Engineering, Hail University, Hail 55476, Saudi Arabia
*
Author to whom correspondence should be addressed.
Mathematics 2022, 10(7), 1080; https://doi.org/10.3390/math10071080
Submission received: 27 February 2022 / Revised: 23 March 2022 / Accepted: 24 March 2022 / Published: 28 March 2022

Abstract

:
Solar photovoltaic (PV) energy production is important in reducing global energy crises since it is transportable, scalable, and highly customizable dependent on the needs of the industry or end-user. In addition, compared to other renewable resources, photovoltaic systems can produce electricity without moving parts and have a long lifespan. Nevertheless, solar photovoltaic (PV) systems provide intermittent output electricity with a nonlinear output voltage. Due to this intermittent availability, PV installations are facing significant challenges. As a result, in PV power systems, a Maximum Power Point Tracker (MPPT), a power extraction mechanism, is required to assure maximum power delivery at any given moment. The main objective of this work is to study the MPPT method of extracting the maximum power from photovoltaic modules under different solar irradiation and temperatures. Several MPPT methods have been developed for photovoltaic systems to achieve MPP, depending on weather conditions and applications, ranging from simple to more complex methods. Among these methods, five techniques have been presented and compared that are P&O perturbation and observation method, INC incremental conductance method, the ANN neural network method, the open circuit voltage based neural network method FVCO, and the neural network method at the base of FCC (short circuit current).

1. Introduction

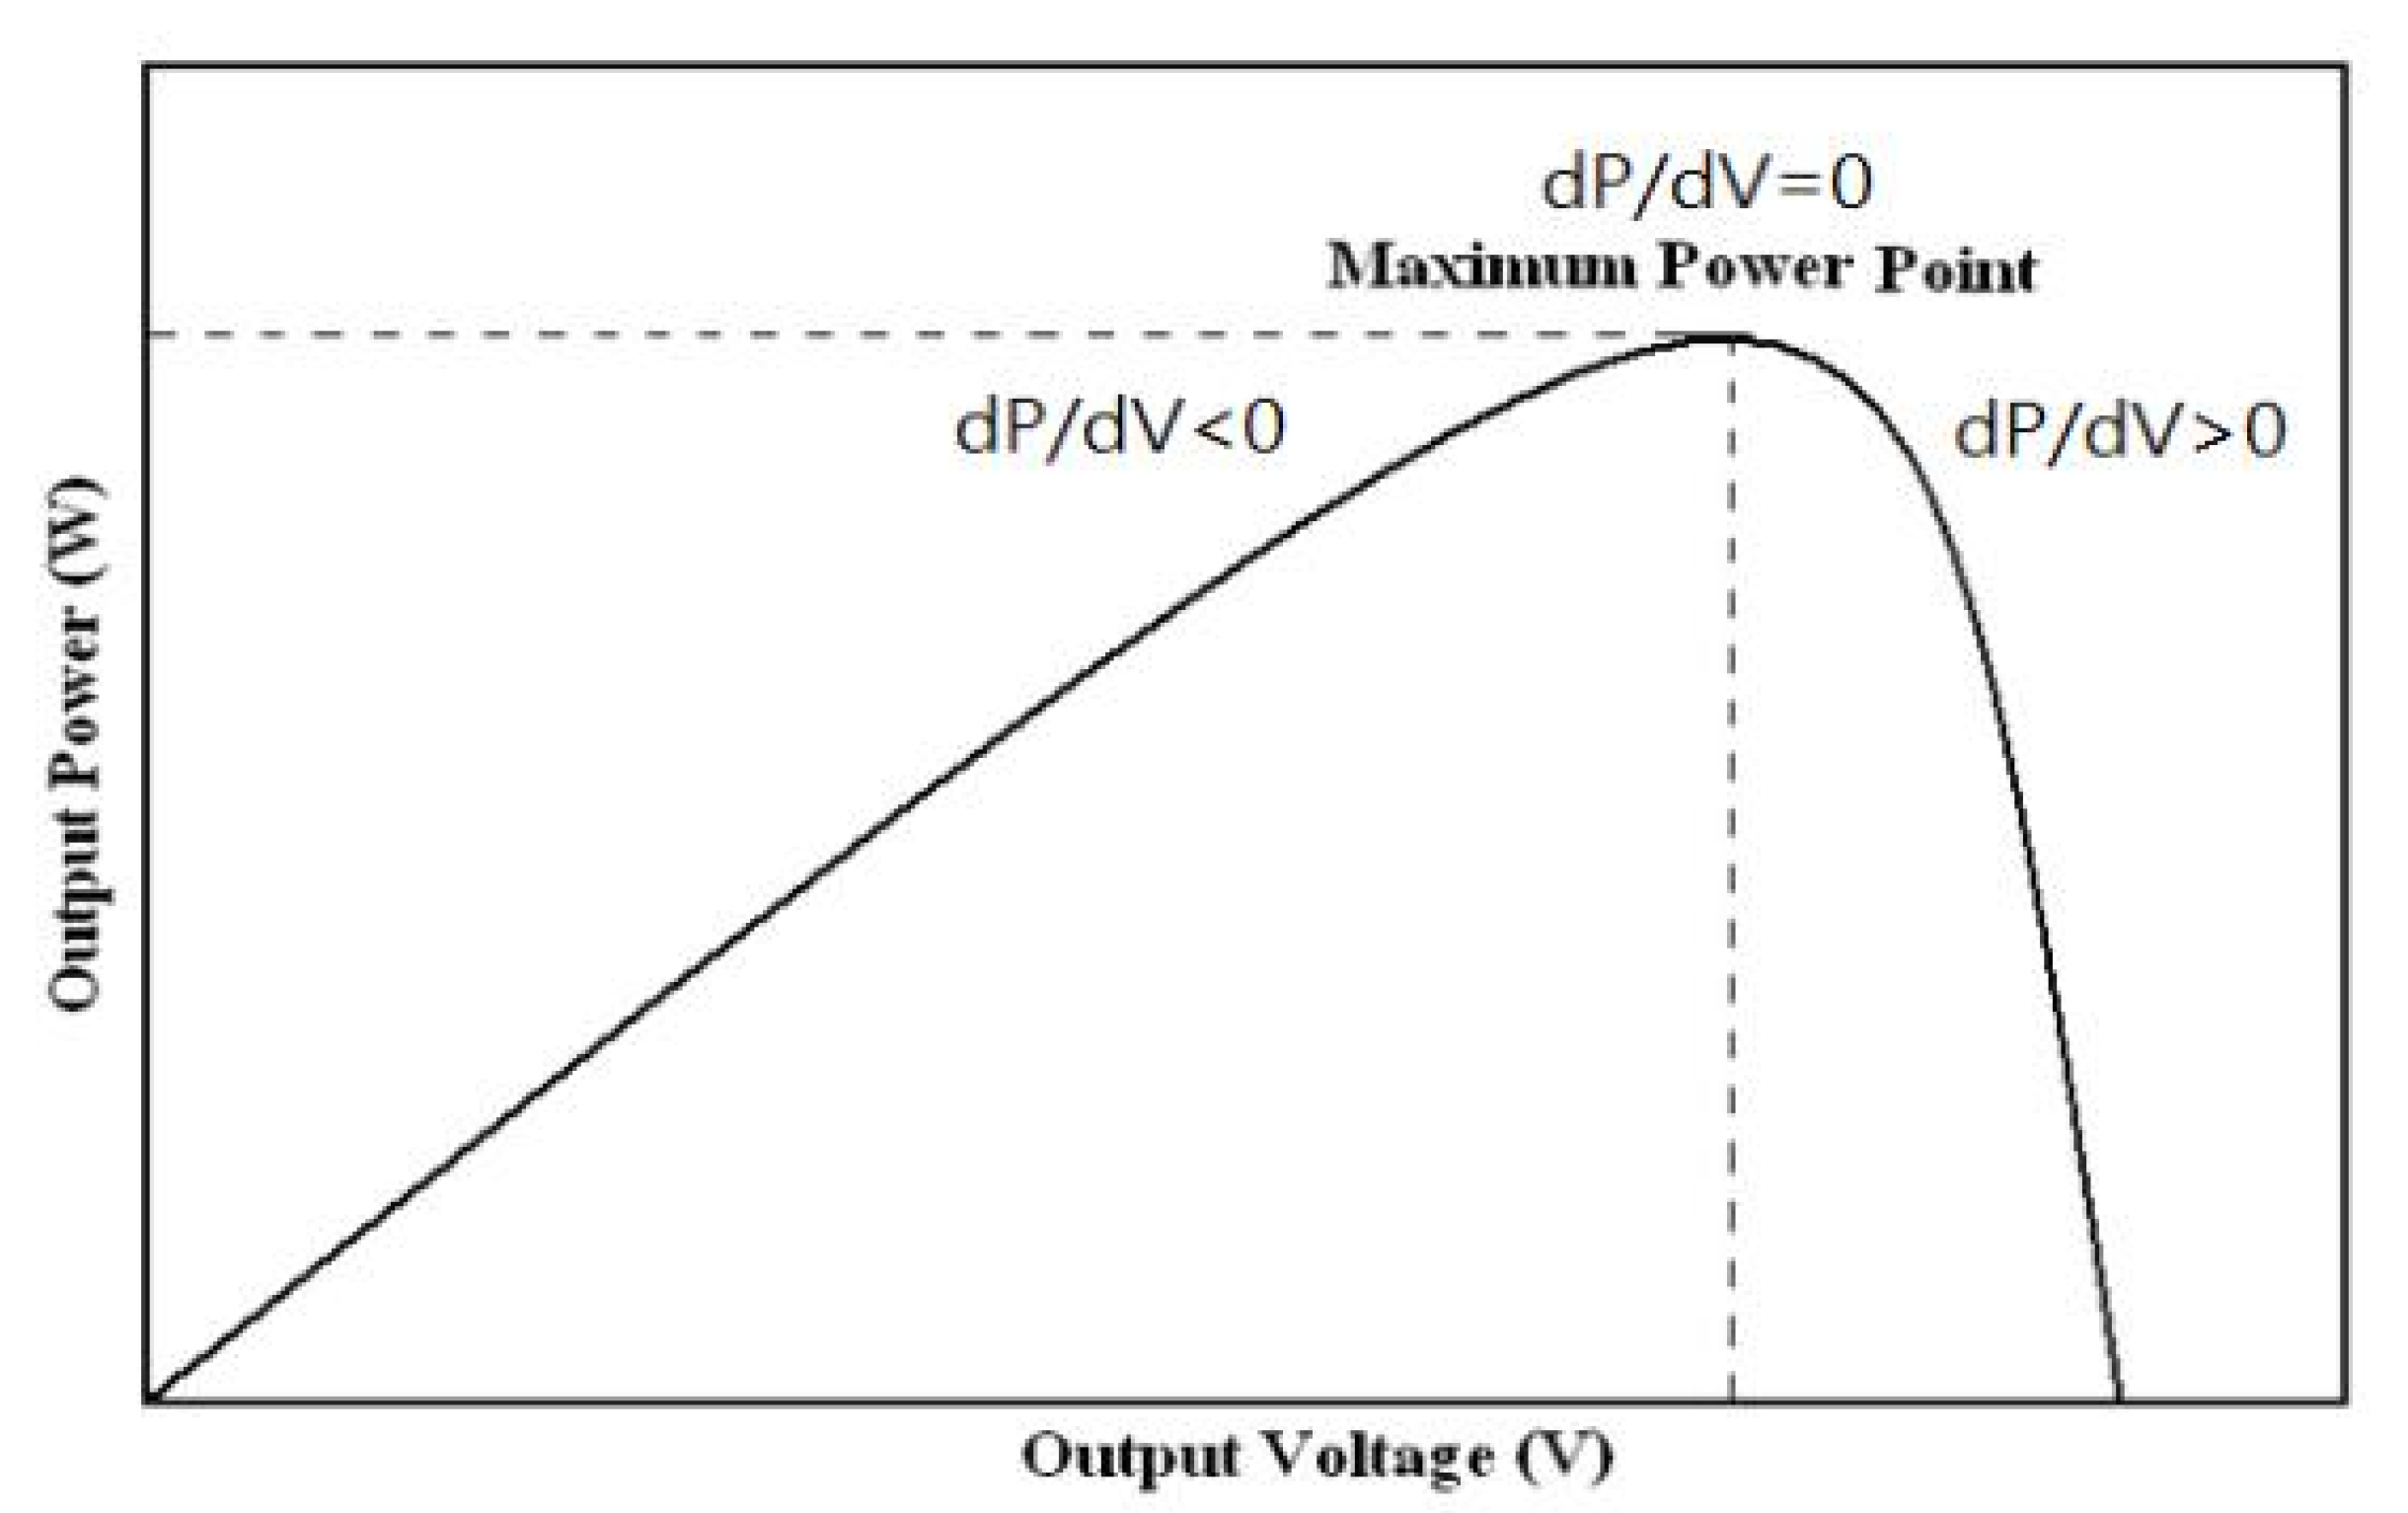
The use of photovoltaic systems has become a popular method of electricity generation because of its certificates, energy freedom, well-known technology, lack of maintenance, and increased efficiency. In addition, photovoltaic systems can generate electricity without moving parts and have a long life compared to other renewable resources. Changes in atmospheric conditions cause the PV system to exhibit nonlinear characteristics. In addition, in all weather conditions, the PV module has a point that can generate the maximum output current and voltage; it is called the maximum power point (MPP).Therefore, it is essential to control the photovoltaic module so that it works under its MPP. The main goal of MPPT is to extract the maximum output power from the photovoltaic modules under different solar rays and temperatures. Several MPPT methods have been developed for photovoltaic systems to achieve MPP, depending on weather conditions and applications, ranging from simple to more complex methods [1,2,3,
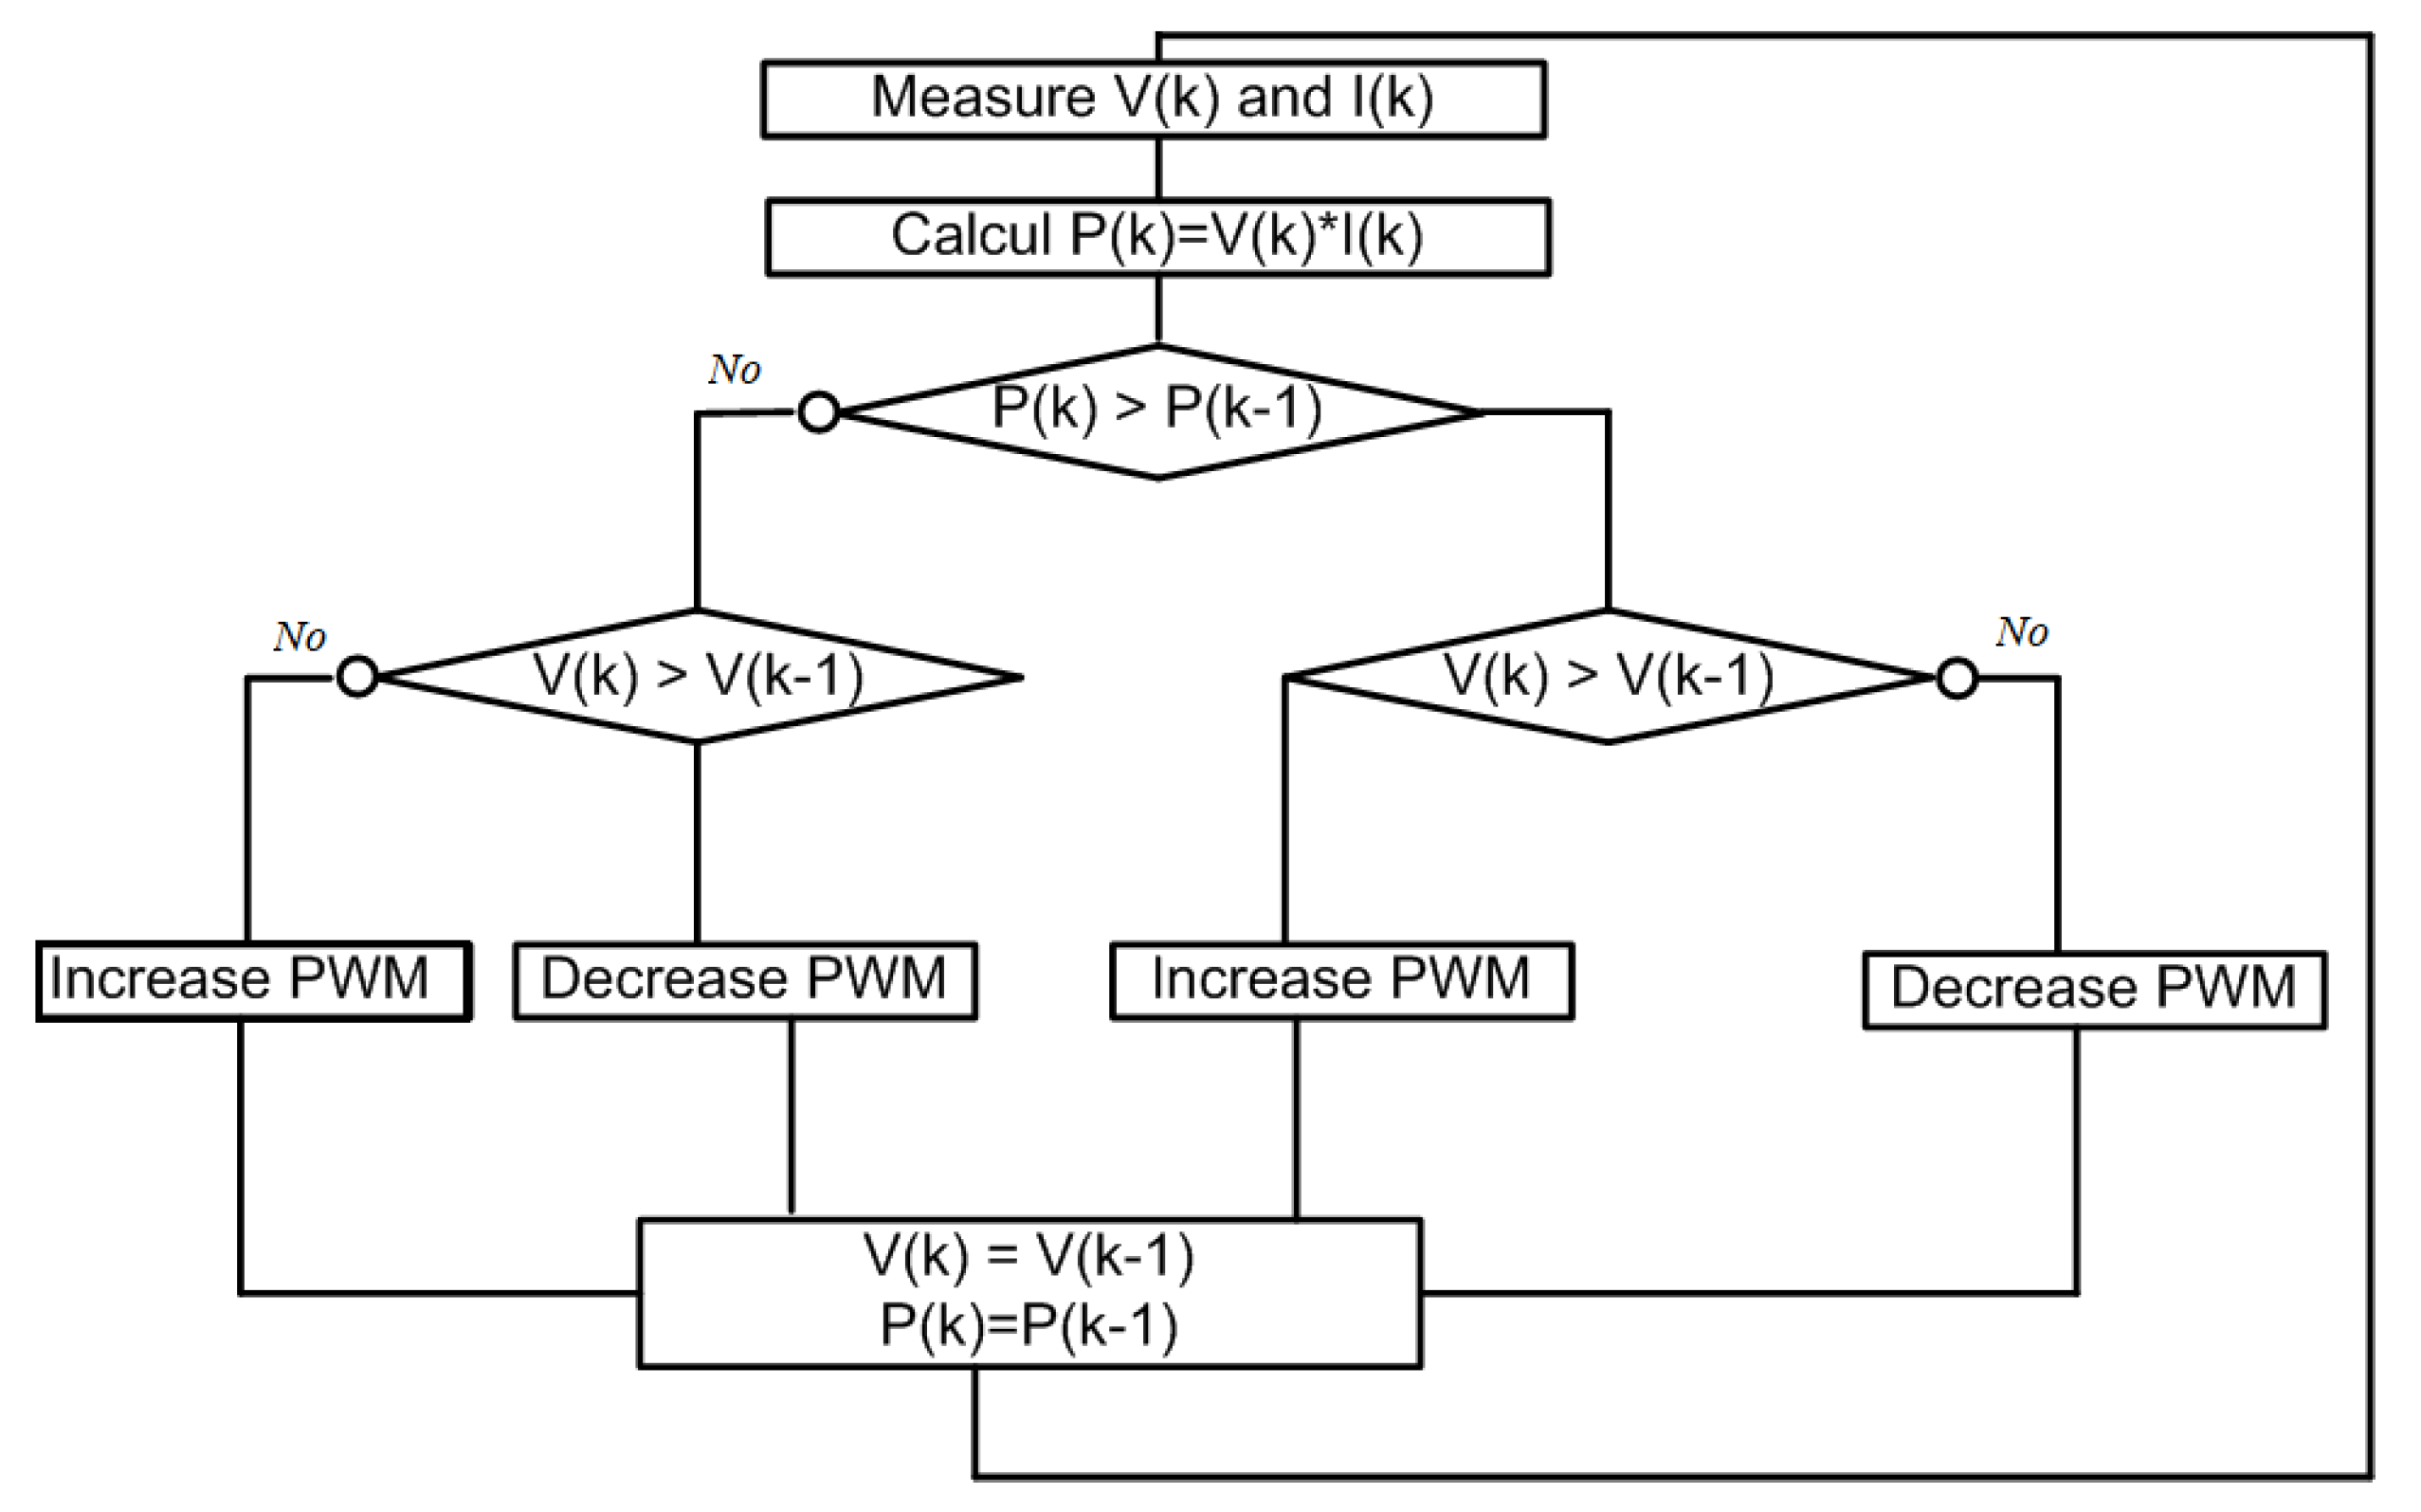
4]. Many MPPT methods have been discussed in the literature: the Perturbation and Observation (P&O) method [2,
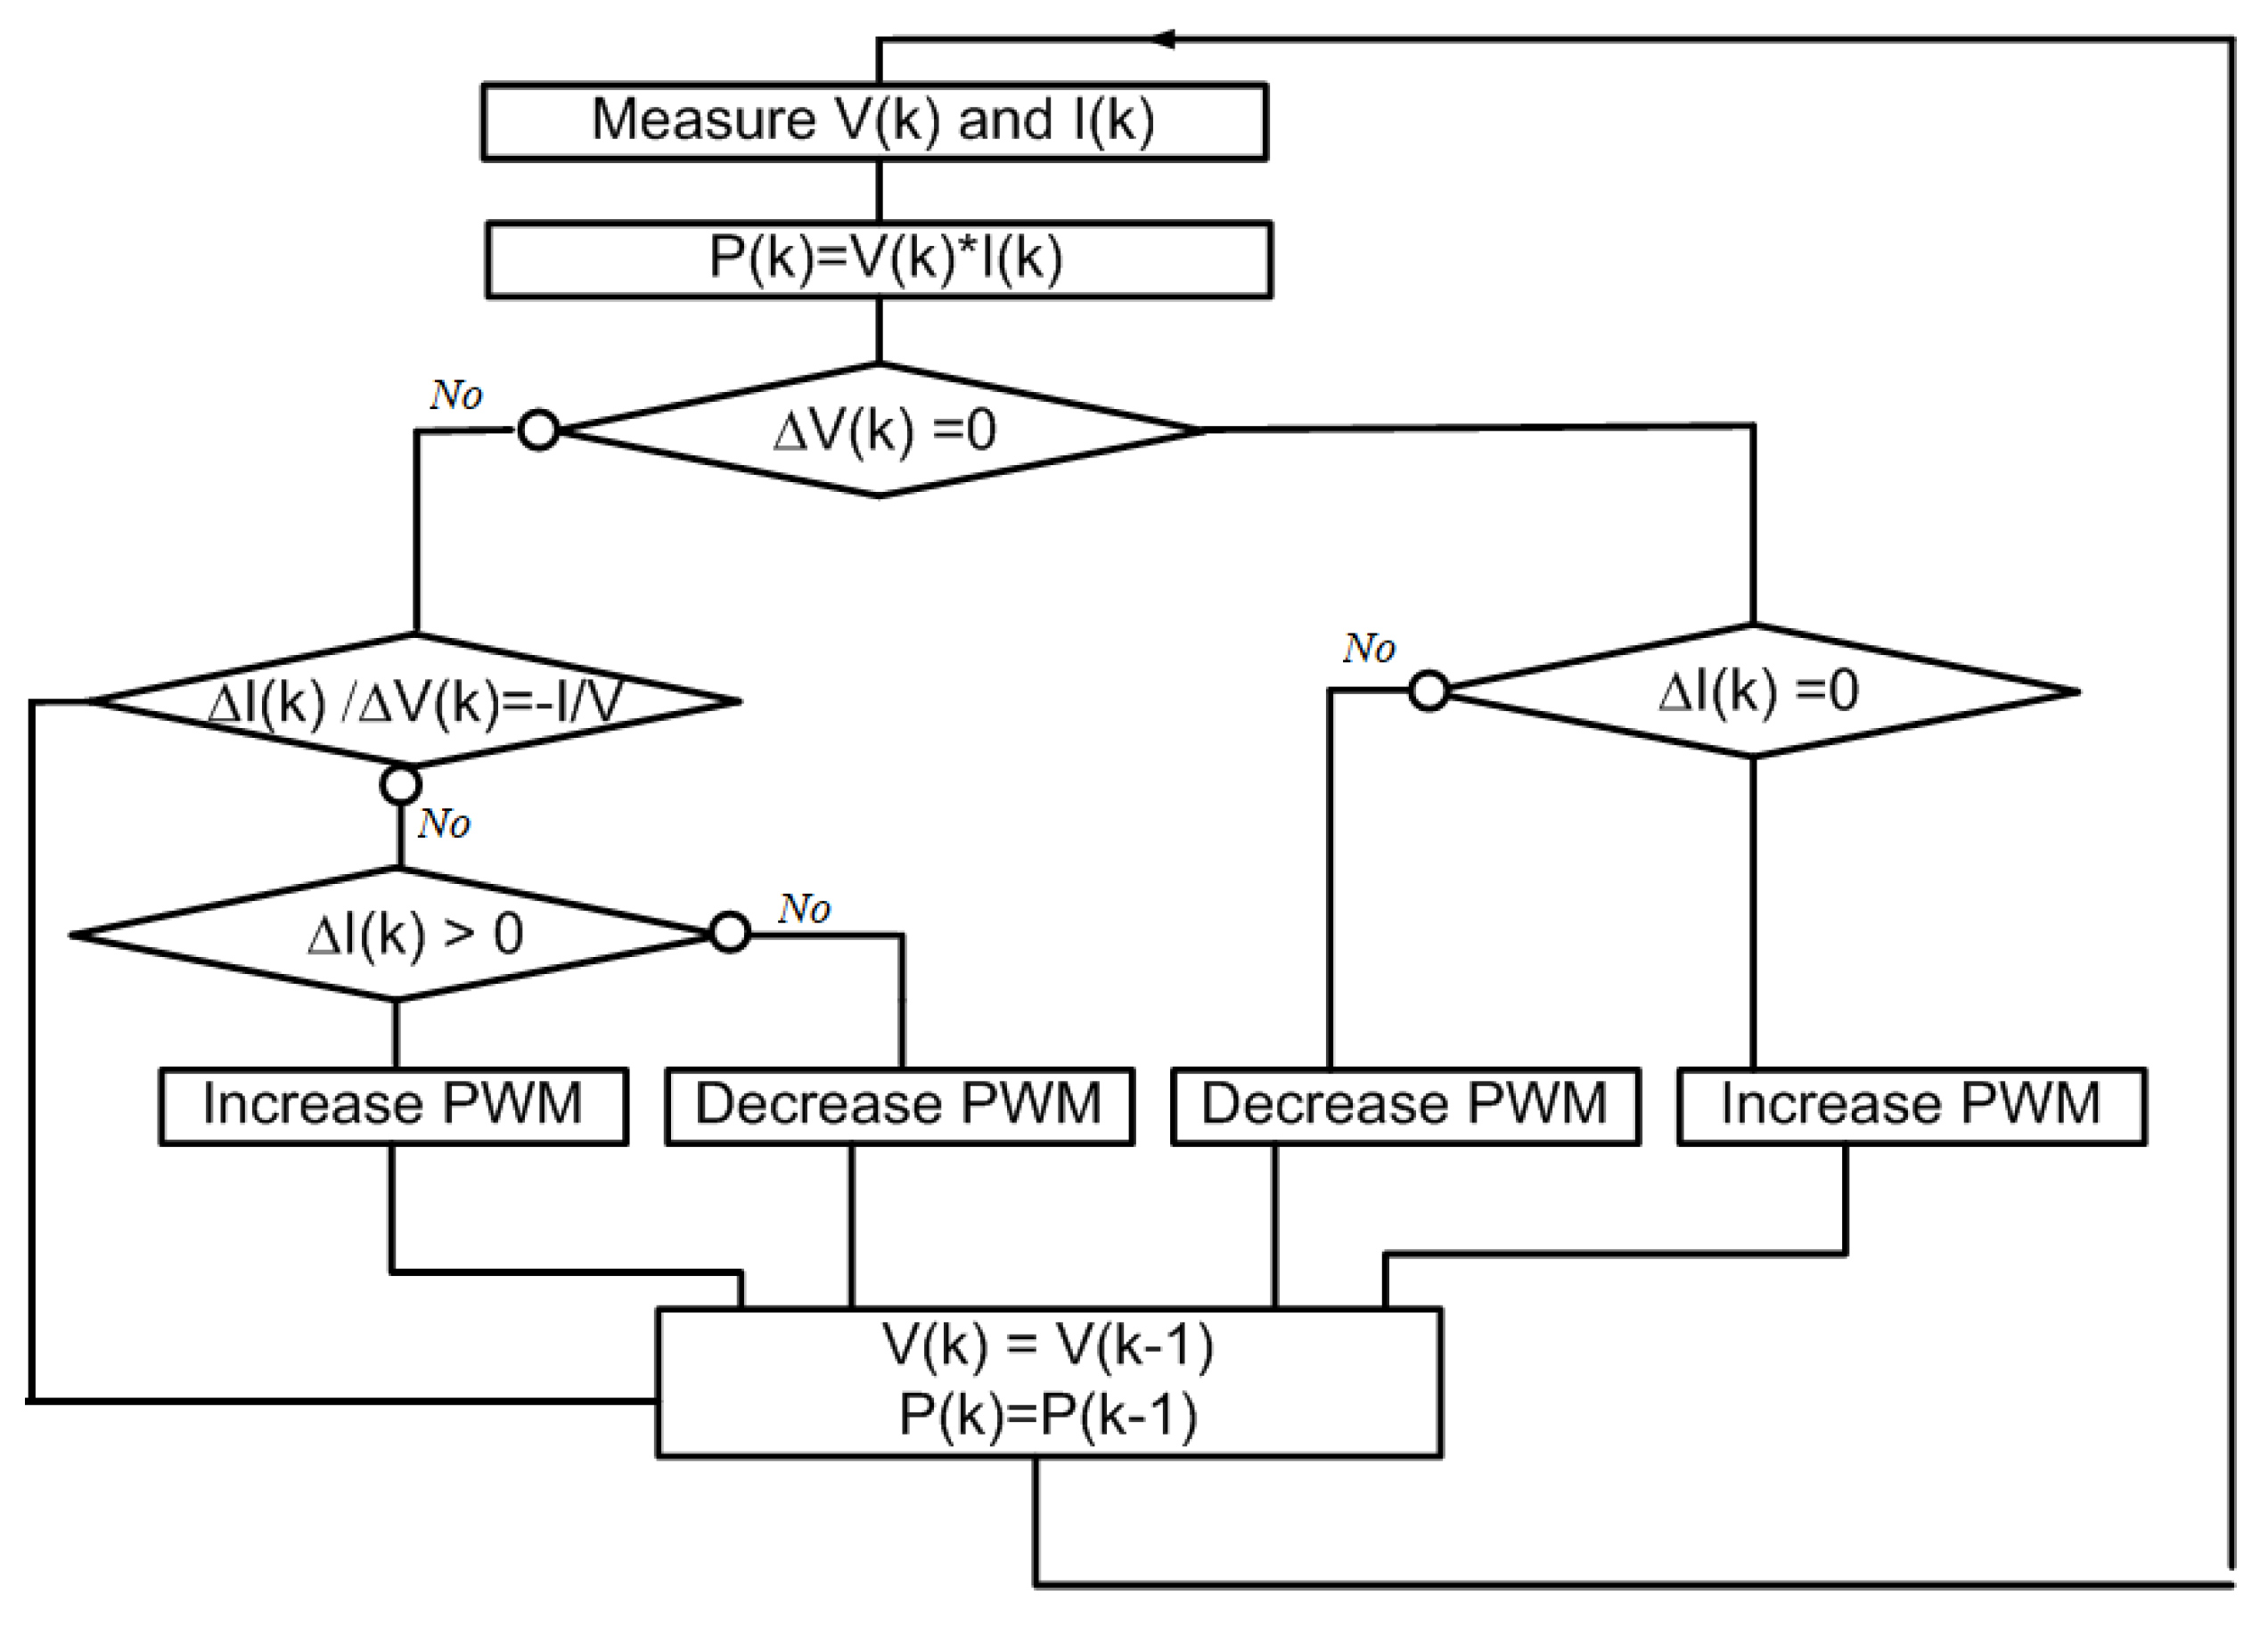
5], incremental conductance method (Inc Cond) [1], the fuzzy logic method [6,7], and the neural network method. These methods can be compared by several characteristics: their simplicity, their cost, their convergence efficiency, the application equipment, the number of sensors, etc. [8].
Yadav et al. [9] summarized the behavior of MPP under uniform and non-uniform working conditions based on the performance comparison, and selected the best duty cycle of MPPT technology recognized in the industry thanks to its algorithm.
It should also be able to track the global MPP under rapidly changing climatic conditions. In order to track the maximum power point of solar cells under different operating conditions, accurate electronic power equipment should be used. The comparison of industrial methods requires a test bench that allows the study of the effect of changes of climatic conditions, for instance illumination and temperature. Moutchou et al. [5] are currently studying and simulating a photovoltaic system controlled by the MPPT method based on the INC algorithm to control the DC/DC boost choppers. Moreover, they integrate the control feedback (reverse thrust) in the P&O algorithm to improve the dynamic behavior of the MPP tracking. The implementation of the INC algorithm in the electronic circuit makes it possible to reproduce the real behavior of the photovoltaic system. Furthermore, it allows the study of transient phenomena, and to provide control of the impact on the power oscillation. The results specified in this work should be implemented in practice in order to test the effects of changing climatic conditions, especially temperature and irradiation, on the dynamic behavior of the proposed MPPT method. Yoganandini et al. [
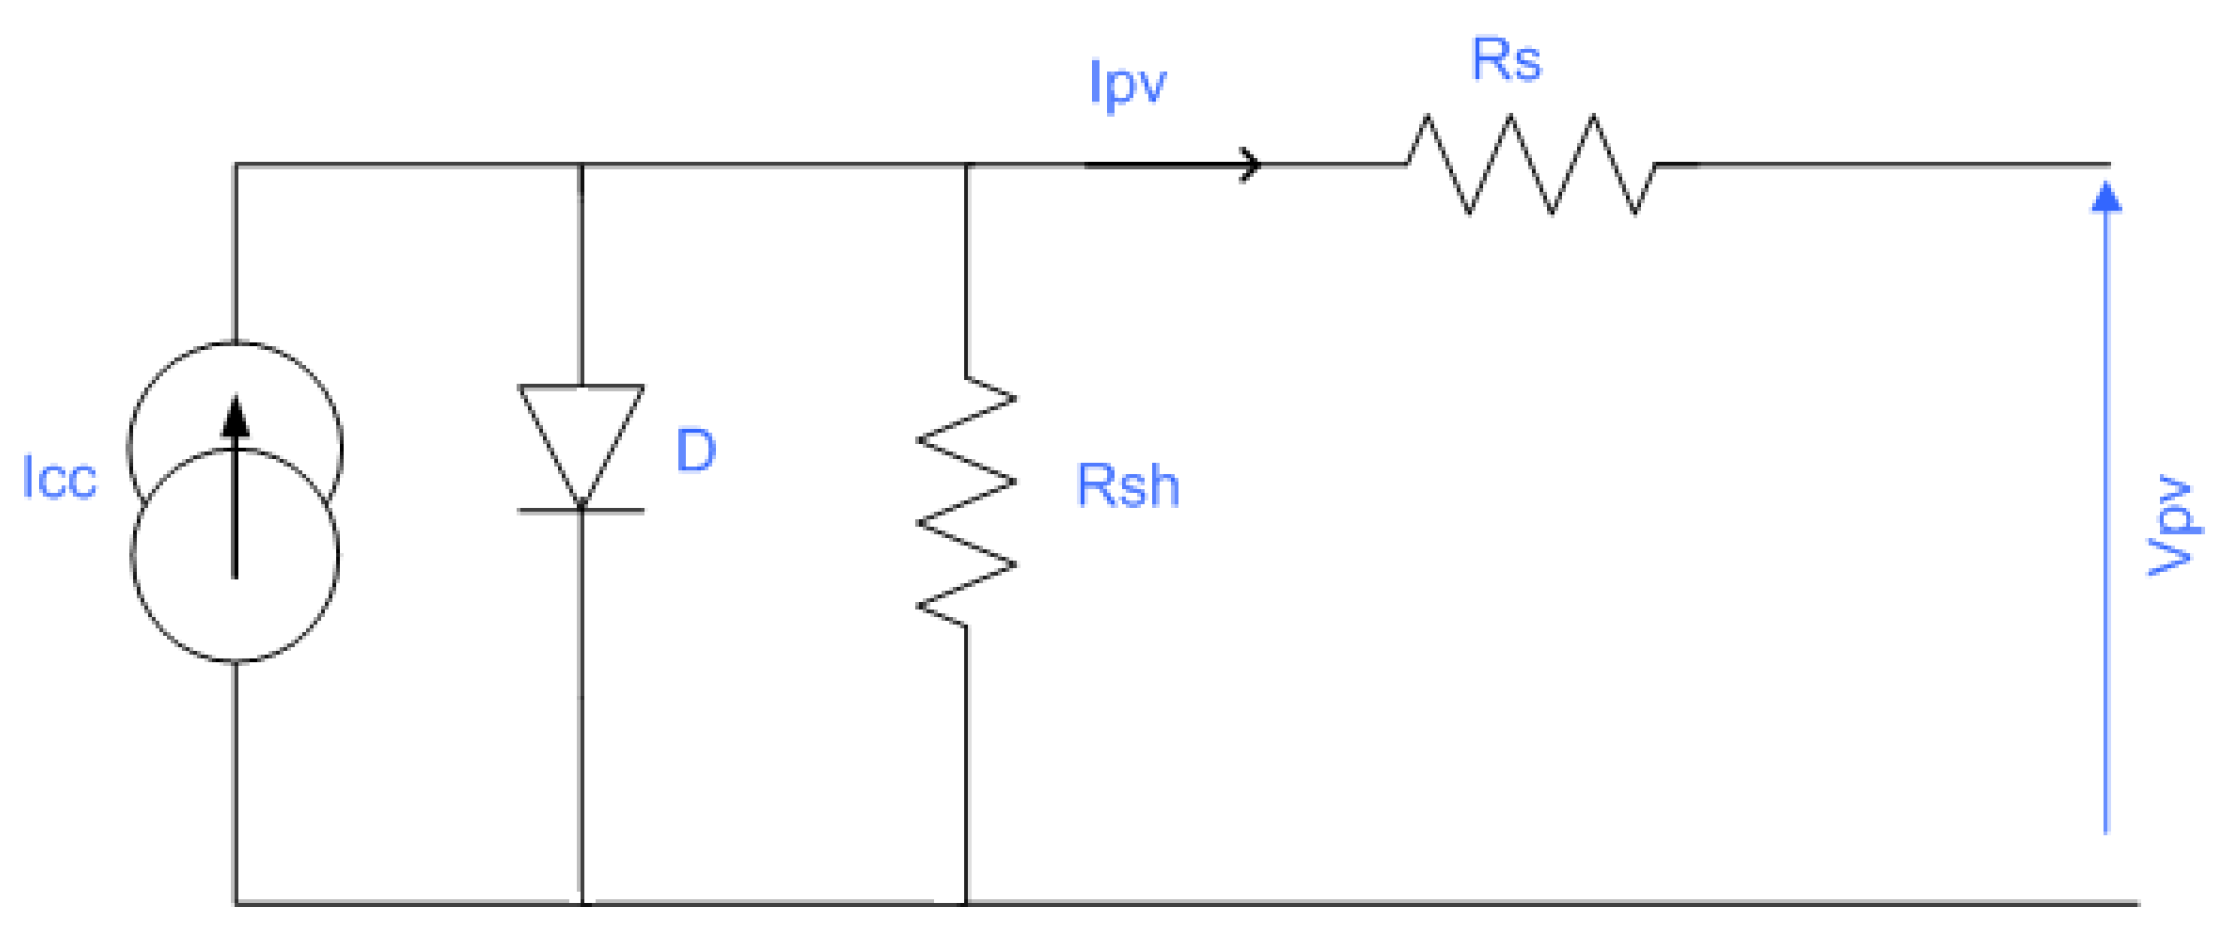
10] propose a new design of MPPT, without using any form of complex design mechanism or including any form of frequently used iterative methods. The proposed model is entirely focused on the development of the algorithm, which uses voltage (open circuit), current (short circuit), and maximum power inputs to obtain the peak power to be extracted from the battery. The proposed system uses the law of diodes, where there is a single diode of junction, current, resistance (in series), solar radiation, and temperature. The proposed system uses solar parameters and temperature as case studies to assess MPPT scores. The results of the method proposed by this work are proven only by the simulation of the model of the photovoltaic cell. Their findings are not implemented in practice to take into account the changes of real surroundings conditions such as the variation in irradiation and temperature in order to validate their dynamic response. MPP point tracking. Abayomi et al. [1] presented a simulation of a PV system connected to the distribution network supplying a variable load. It is also controlled by an incremental conductance algorithm (indCond) under various weather conditions that vary rapidly. In order to demonstrate the efficiency of the proposed method, the authors tested the PV system for both cases where the surplus or shortage of the generated power occurs. The authors did not present other methods of controlling the PV system and managing the excess power in order to compare them—for example, the method of the ANN neural network allows the management of the PV system according to the meteorological conditions. Obaidulah et al. [2] presented the MPPT control based on the predictive P&O algorithm. They compared the results of the behavior of the system with the method of the classical P&O algorithm under optimum conditions in order to minimize fluctuations in the power generated by the PV system. The comparative study of the predictive P&O method should also be done with other MPPT methods based on an incremental conductance algorithm or network of neurons ANN. In order to highlight their advantages and disadvantages of operation and study the characteristics such as speed, stability, and precision (fluctuation), this comparison should be performed. Elahi et al. [11] presented a study for the identification of the operating conditions of the PV system as well as the effect of the variations of irradiation and charges by applying a comparative analysis of the P&O algorithm, the PSO algorithm, the GWO algorithm, the FPA algorithm, and the ChOA algorithm. The performance comparison of the different techniques have proved the robustness of the ChOA method under the considered operating conditions. However, the effectiveness of the studied techniques under real operating conditions such as the change of insolation and the variation of the charges are not considered in this work.
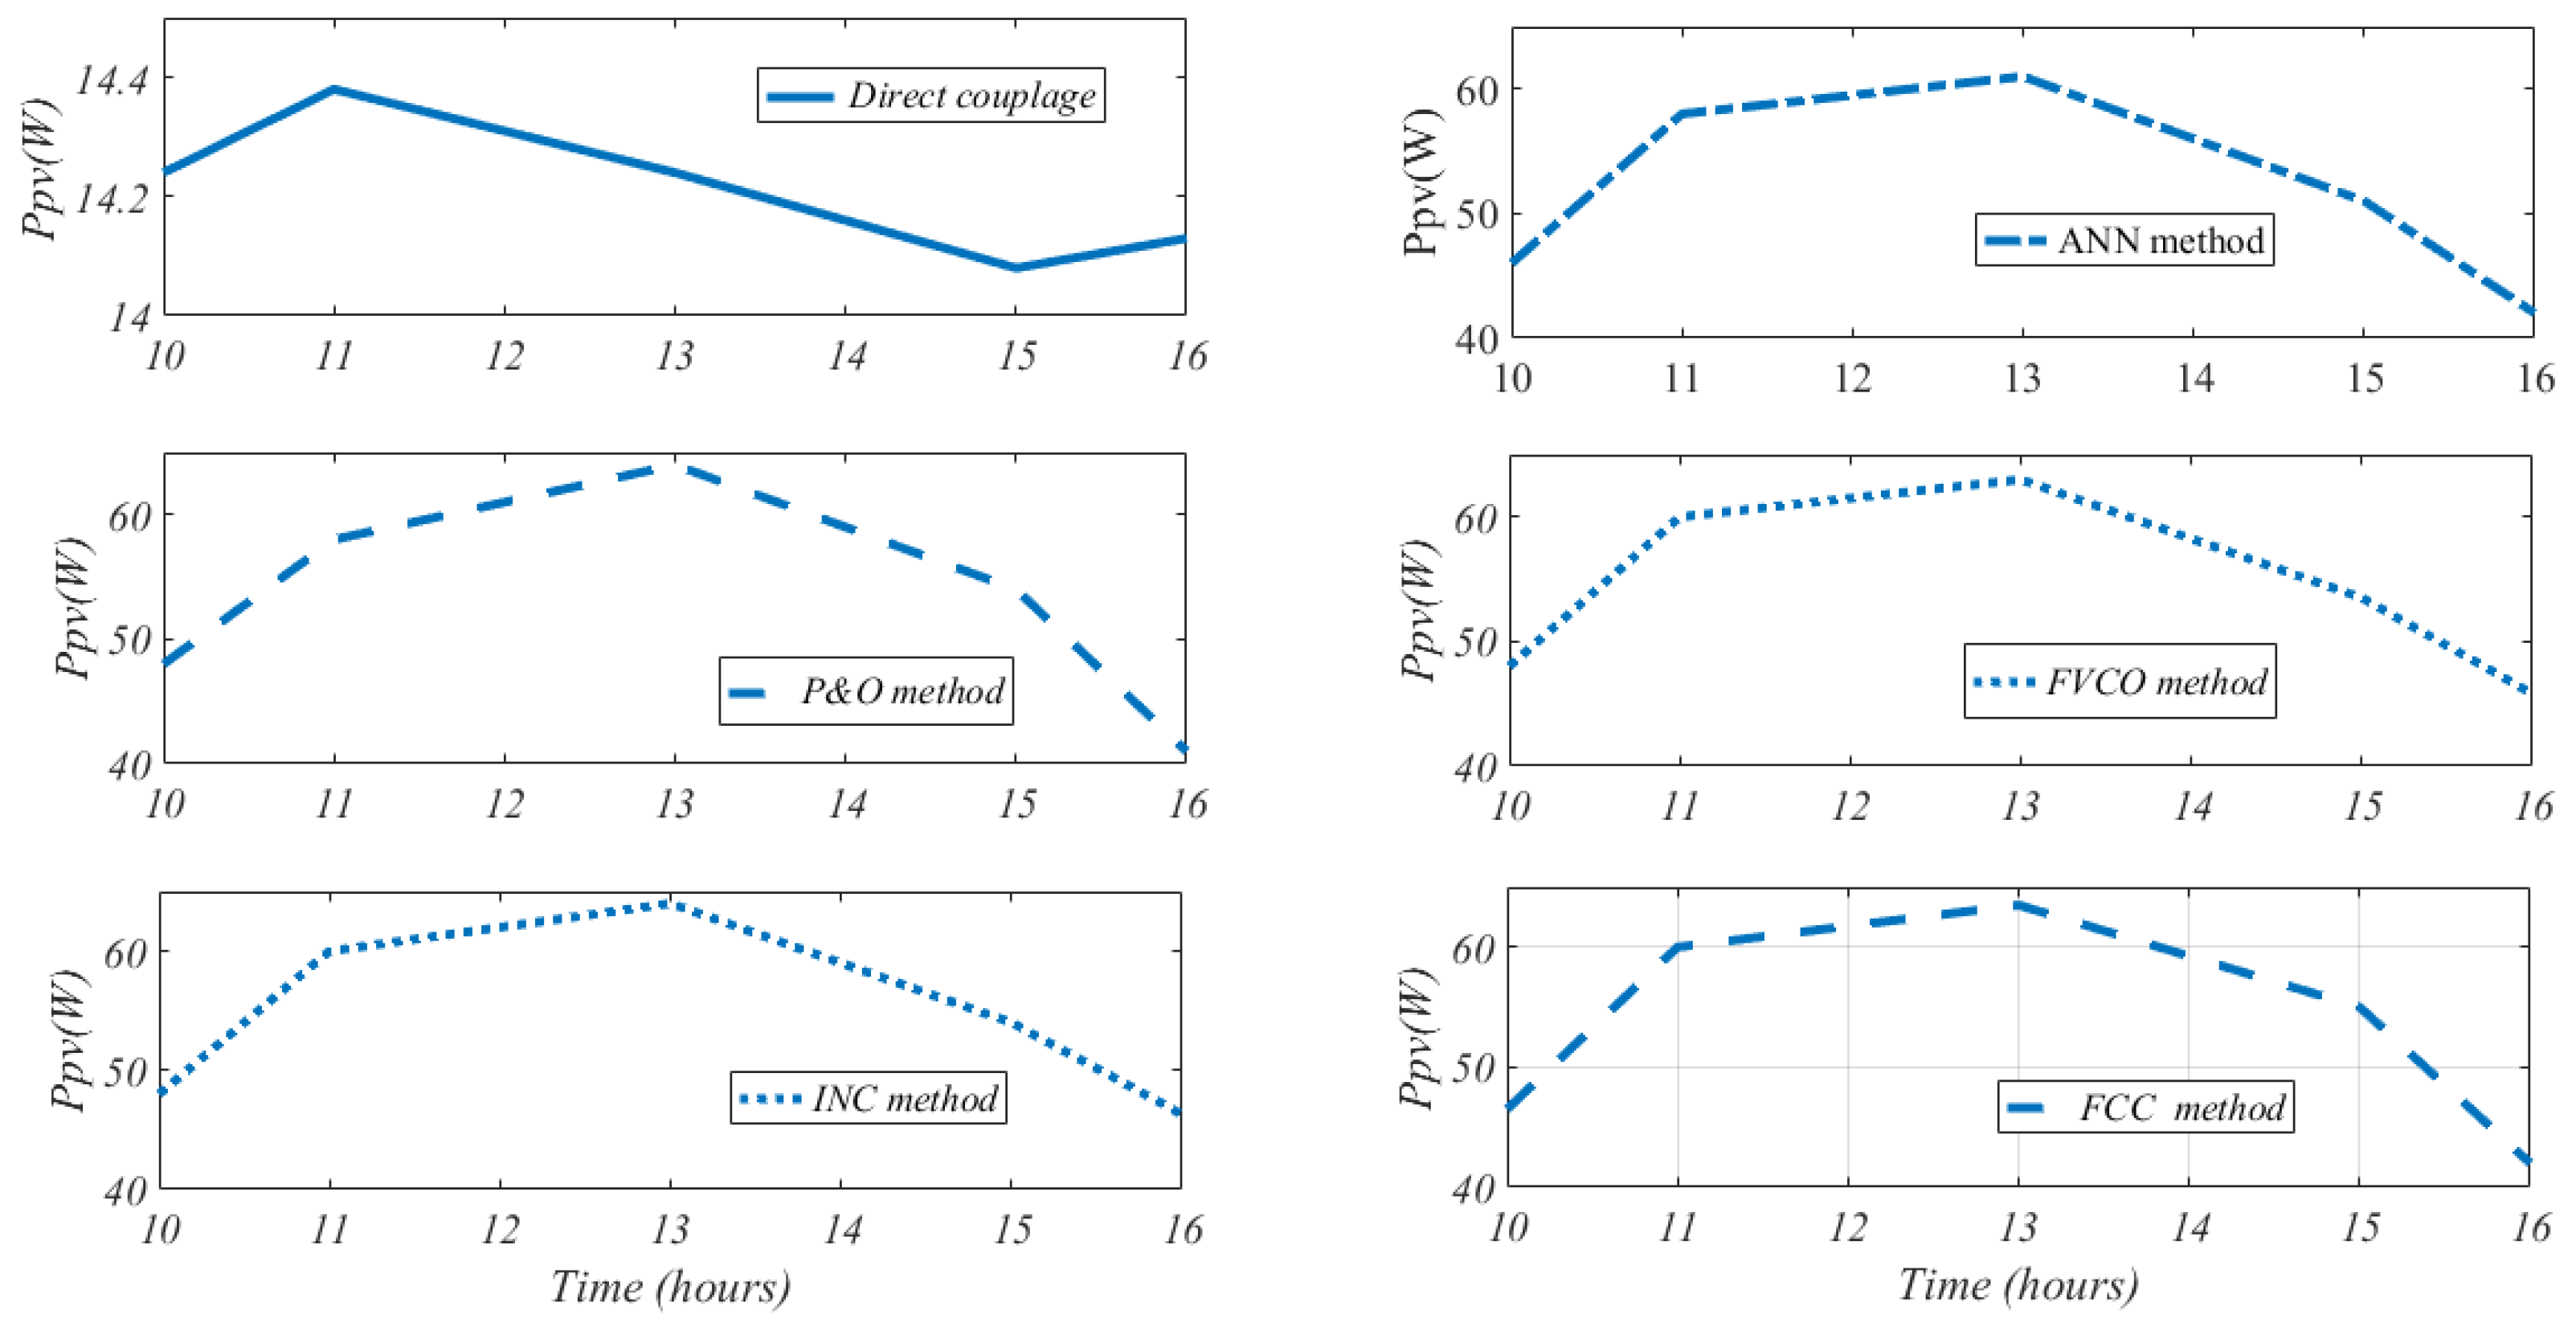
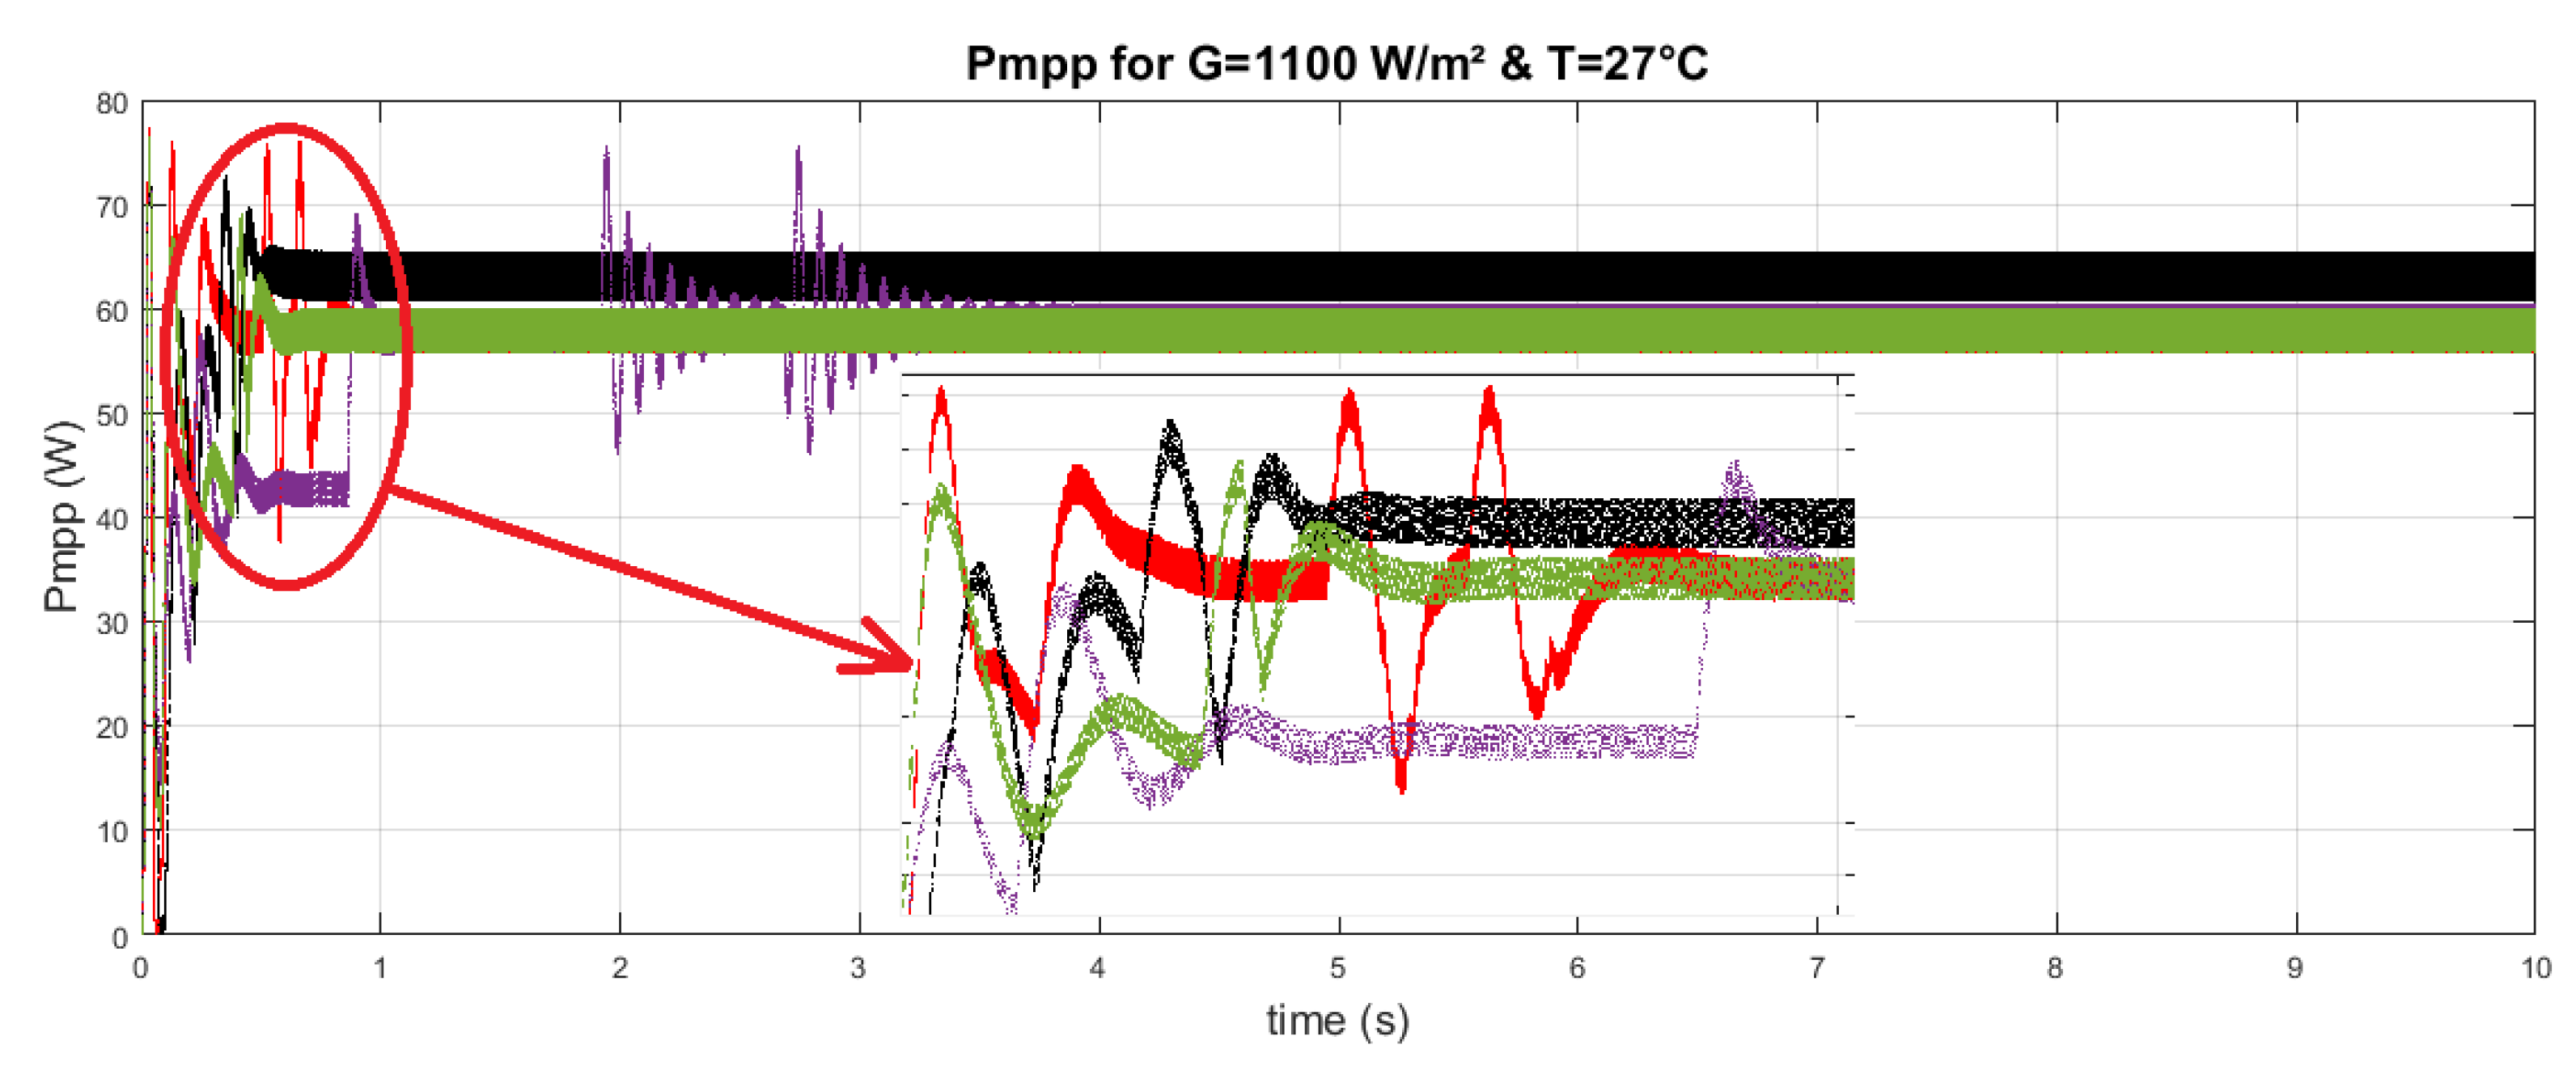
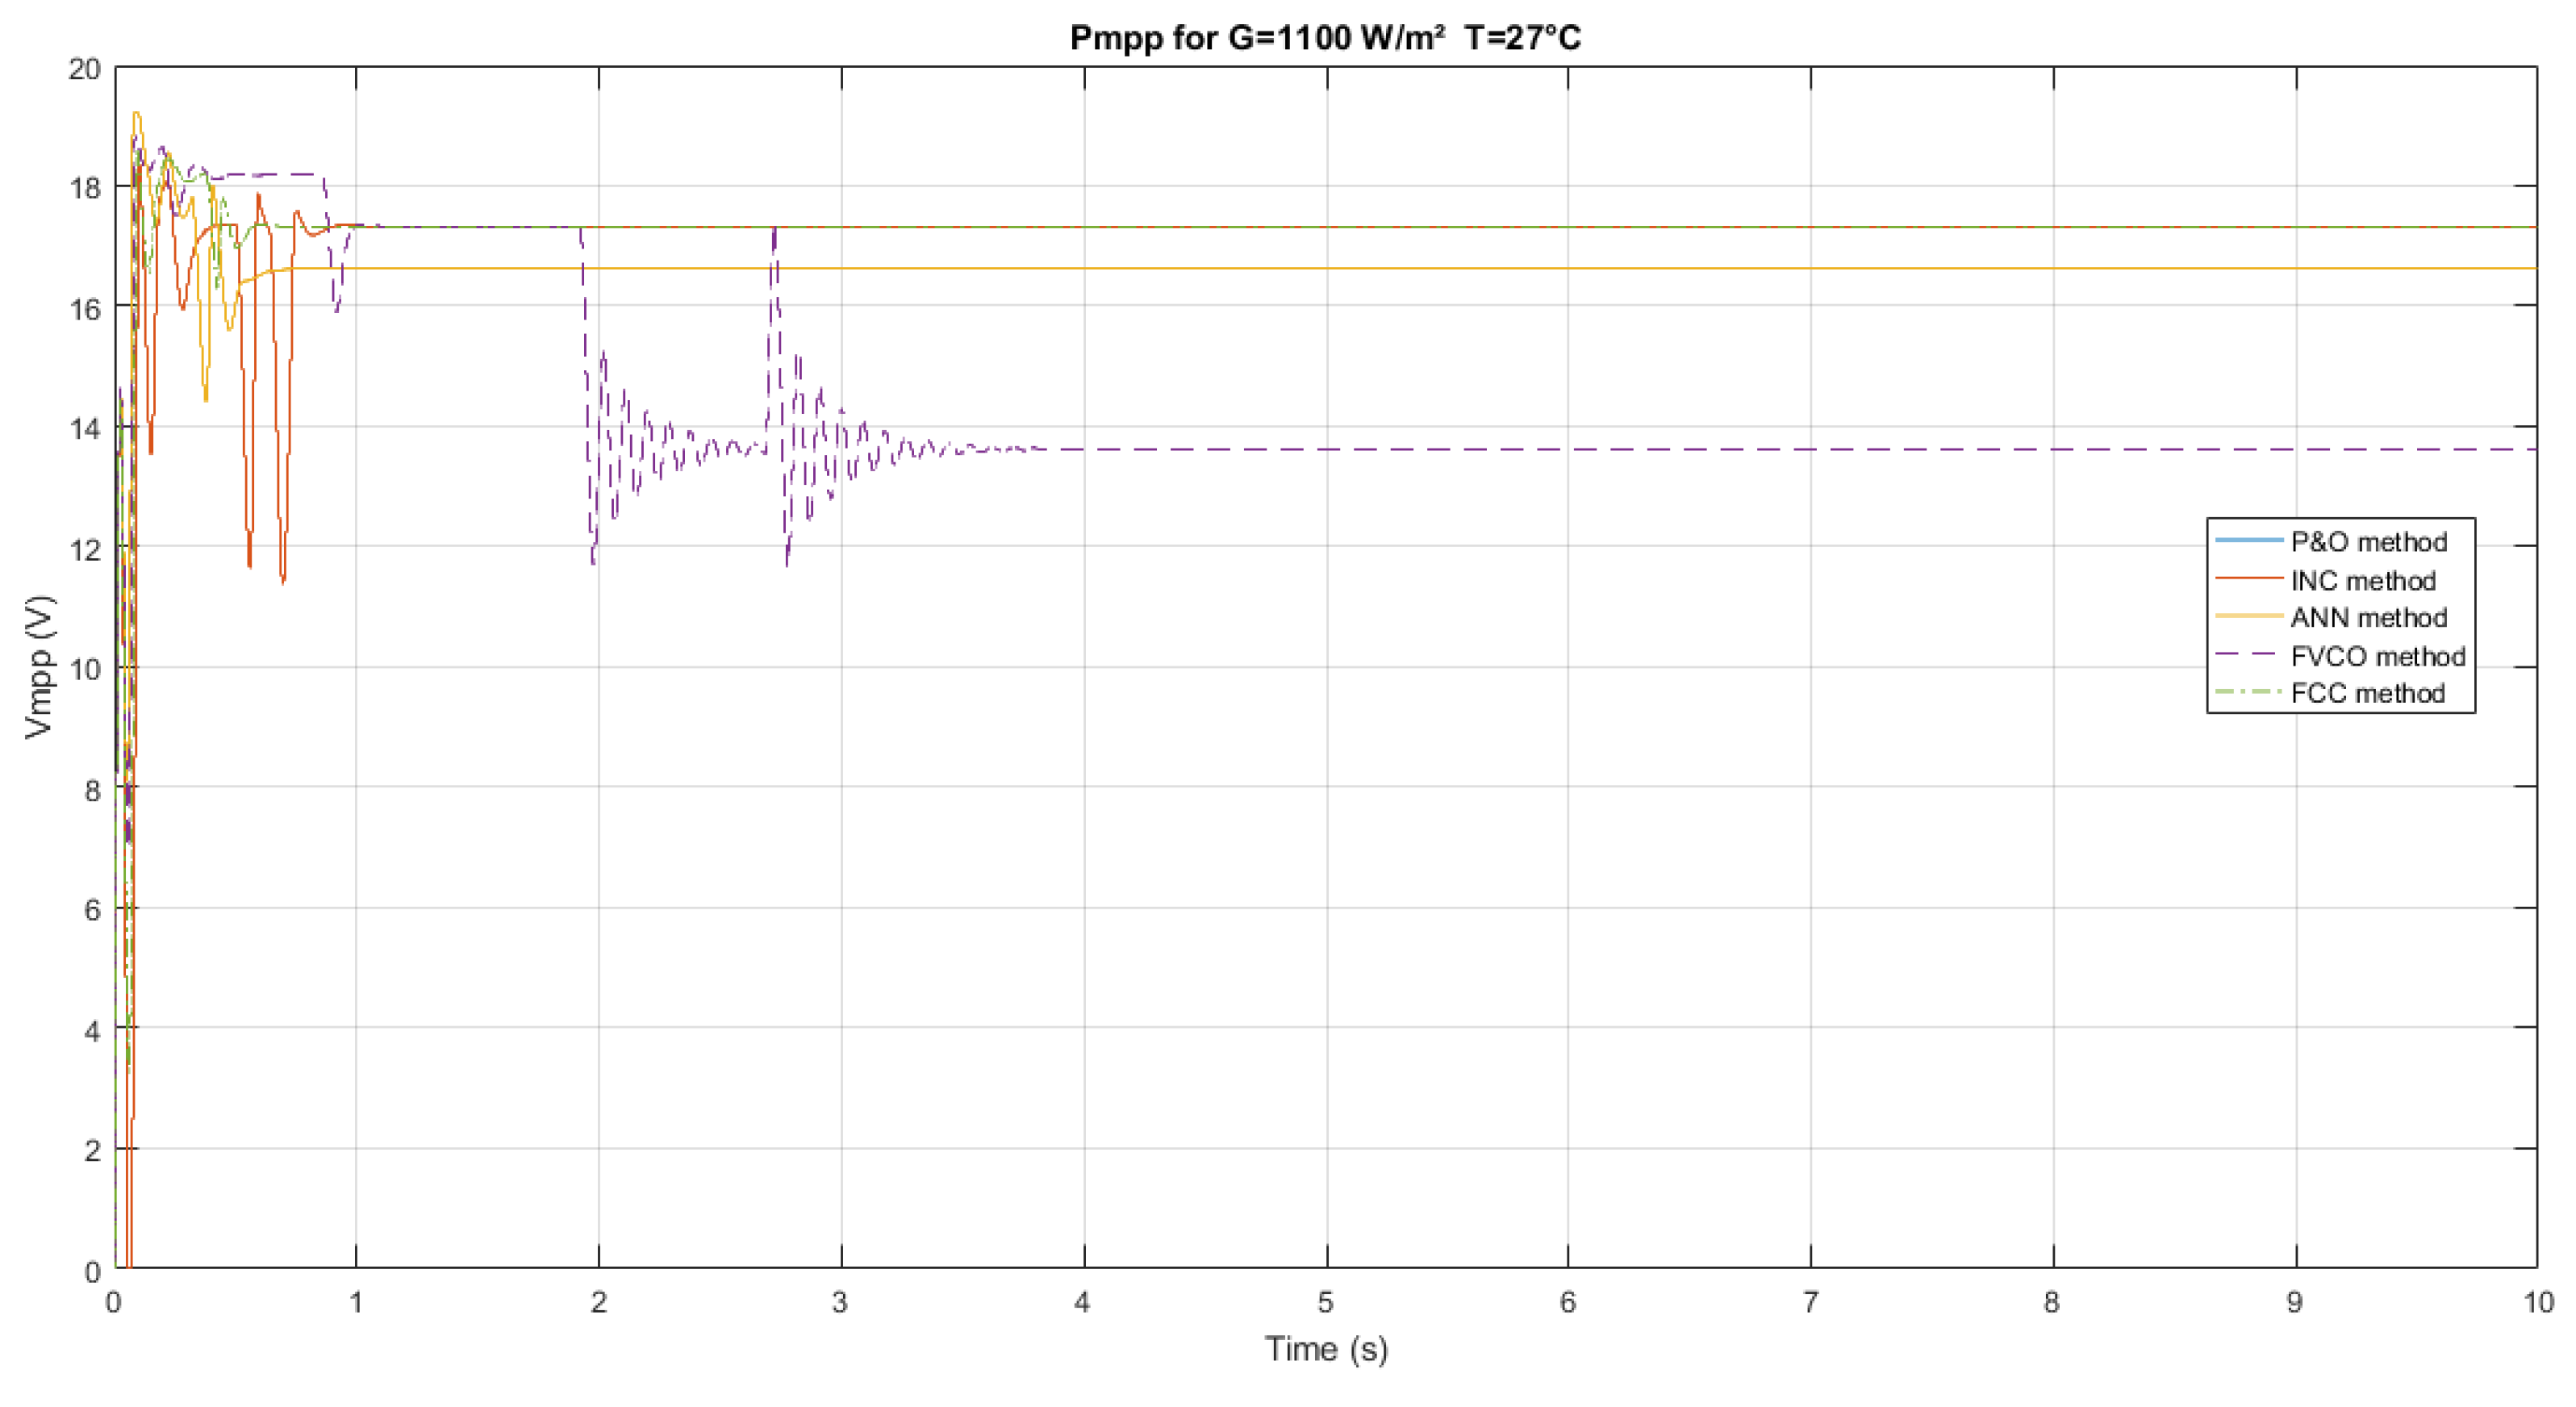
This research, which compares the five MPPT algorithms under specific operating conditions, may be exploited and utilized as decision-making tools, ensuring that the right algorithm is chosen for the right application. Moreover, this comparative study allows the examination of the dynamic responses (electrical quantities Ppv, Vpv, and Ipv) while the complexity of implementation of each algorithm is taken into account.
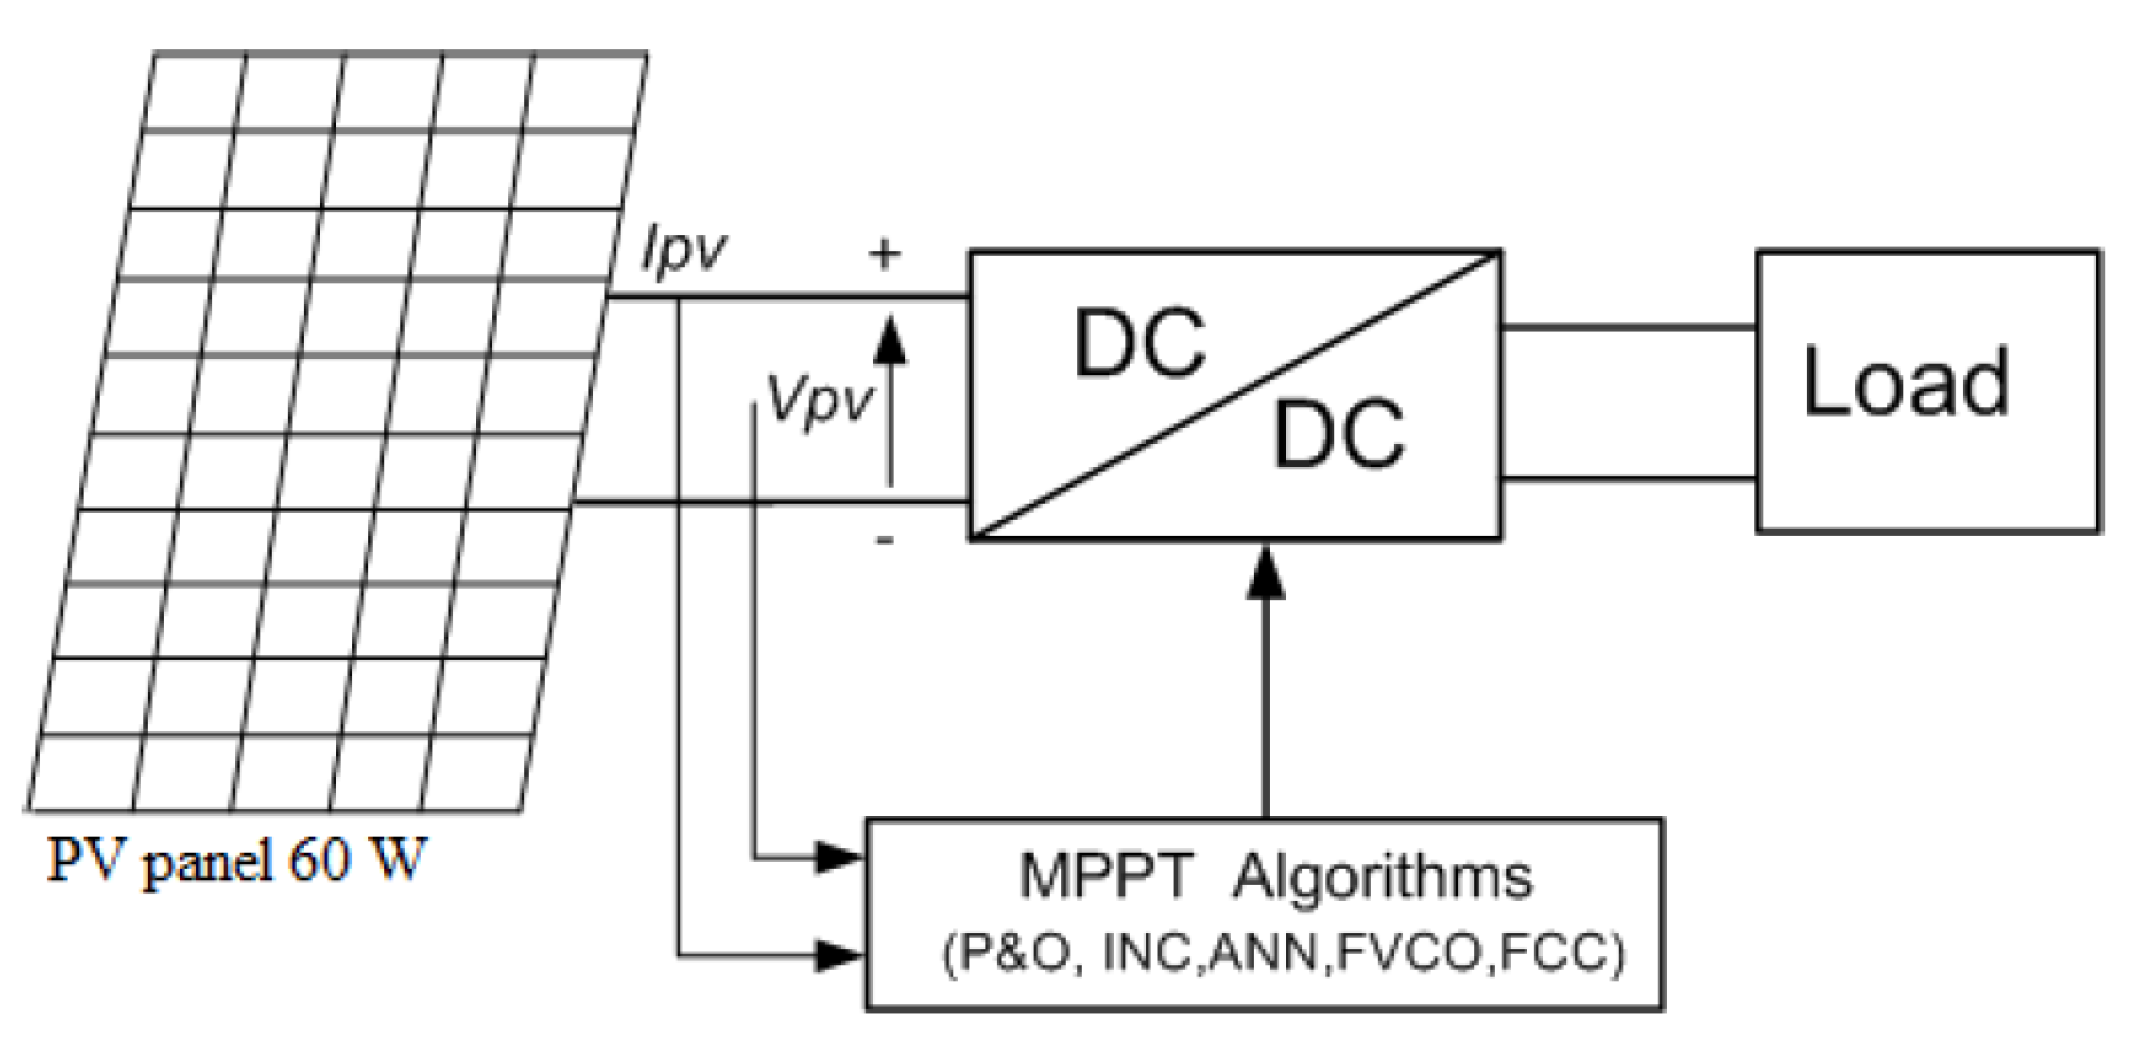
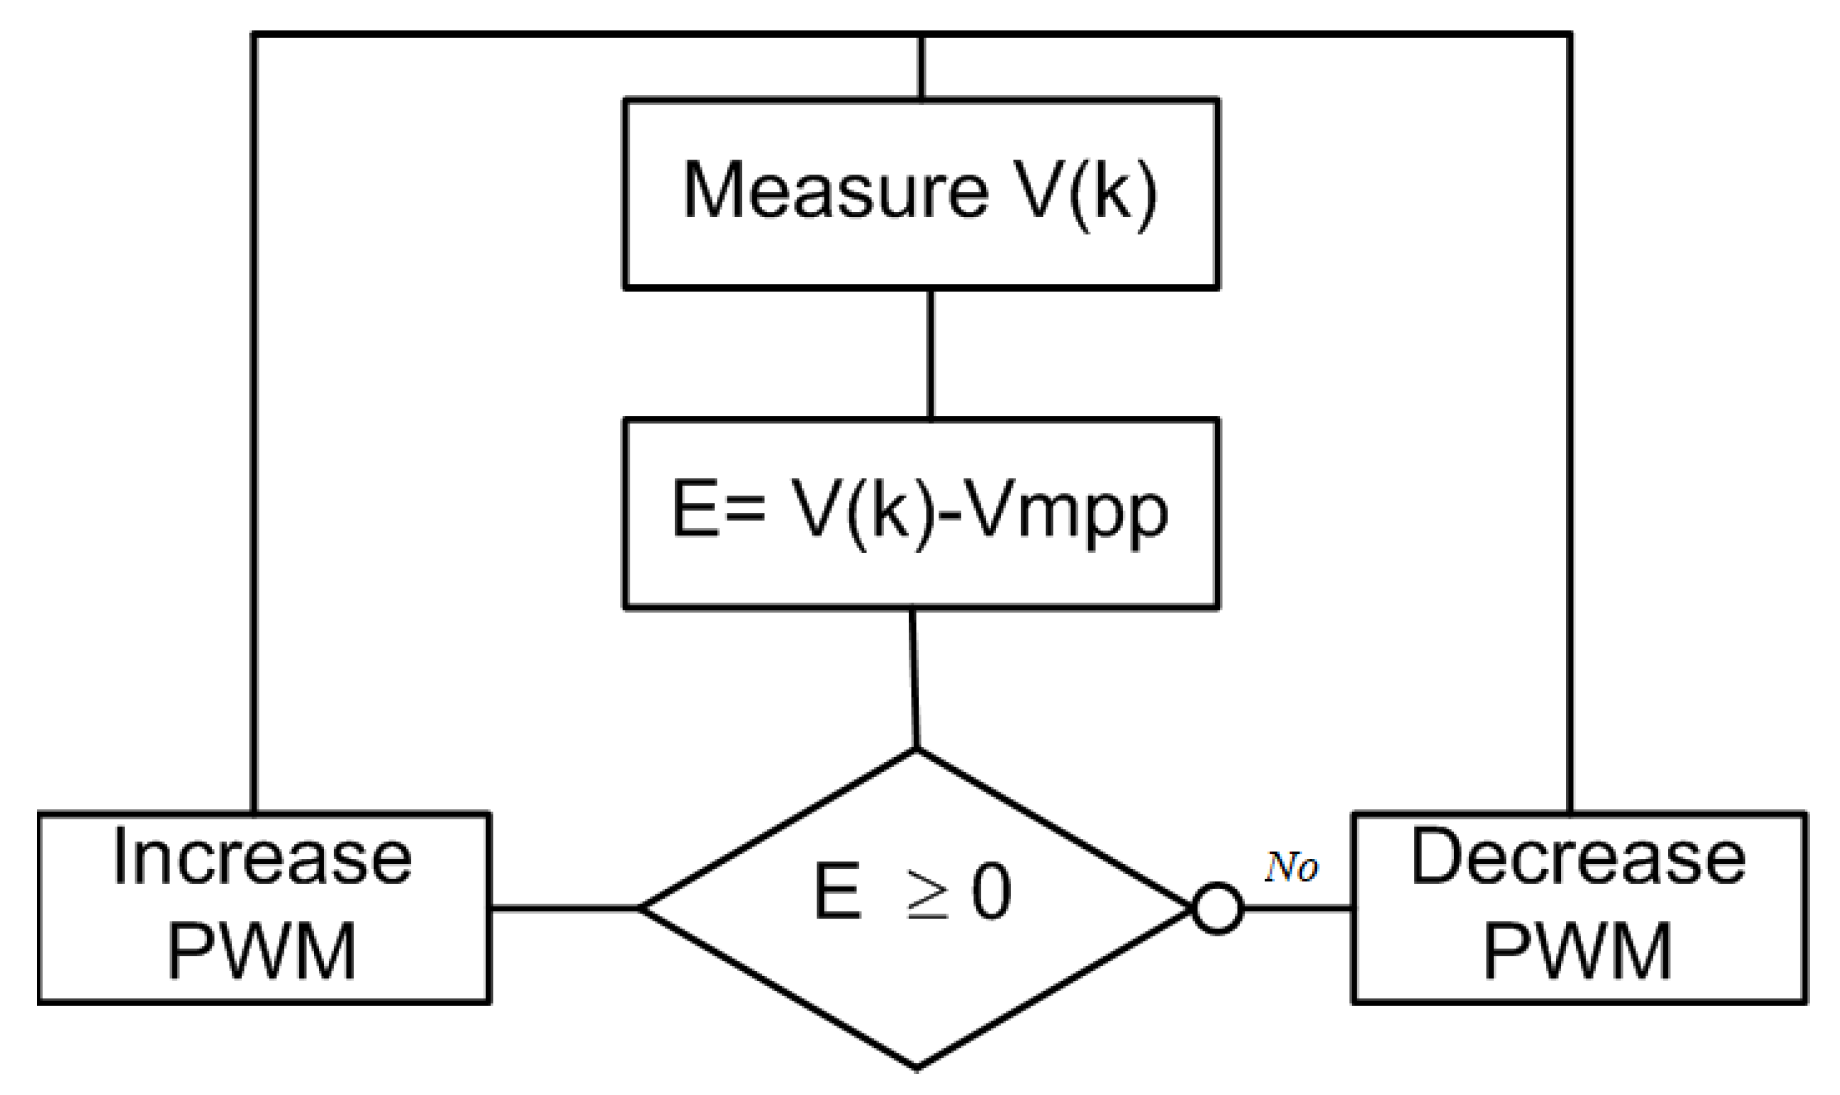
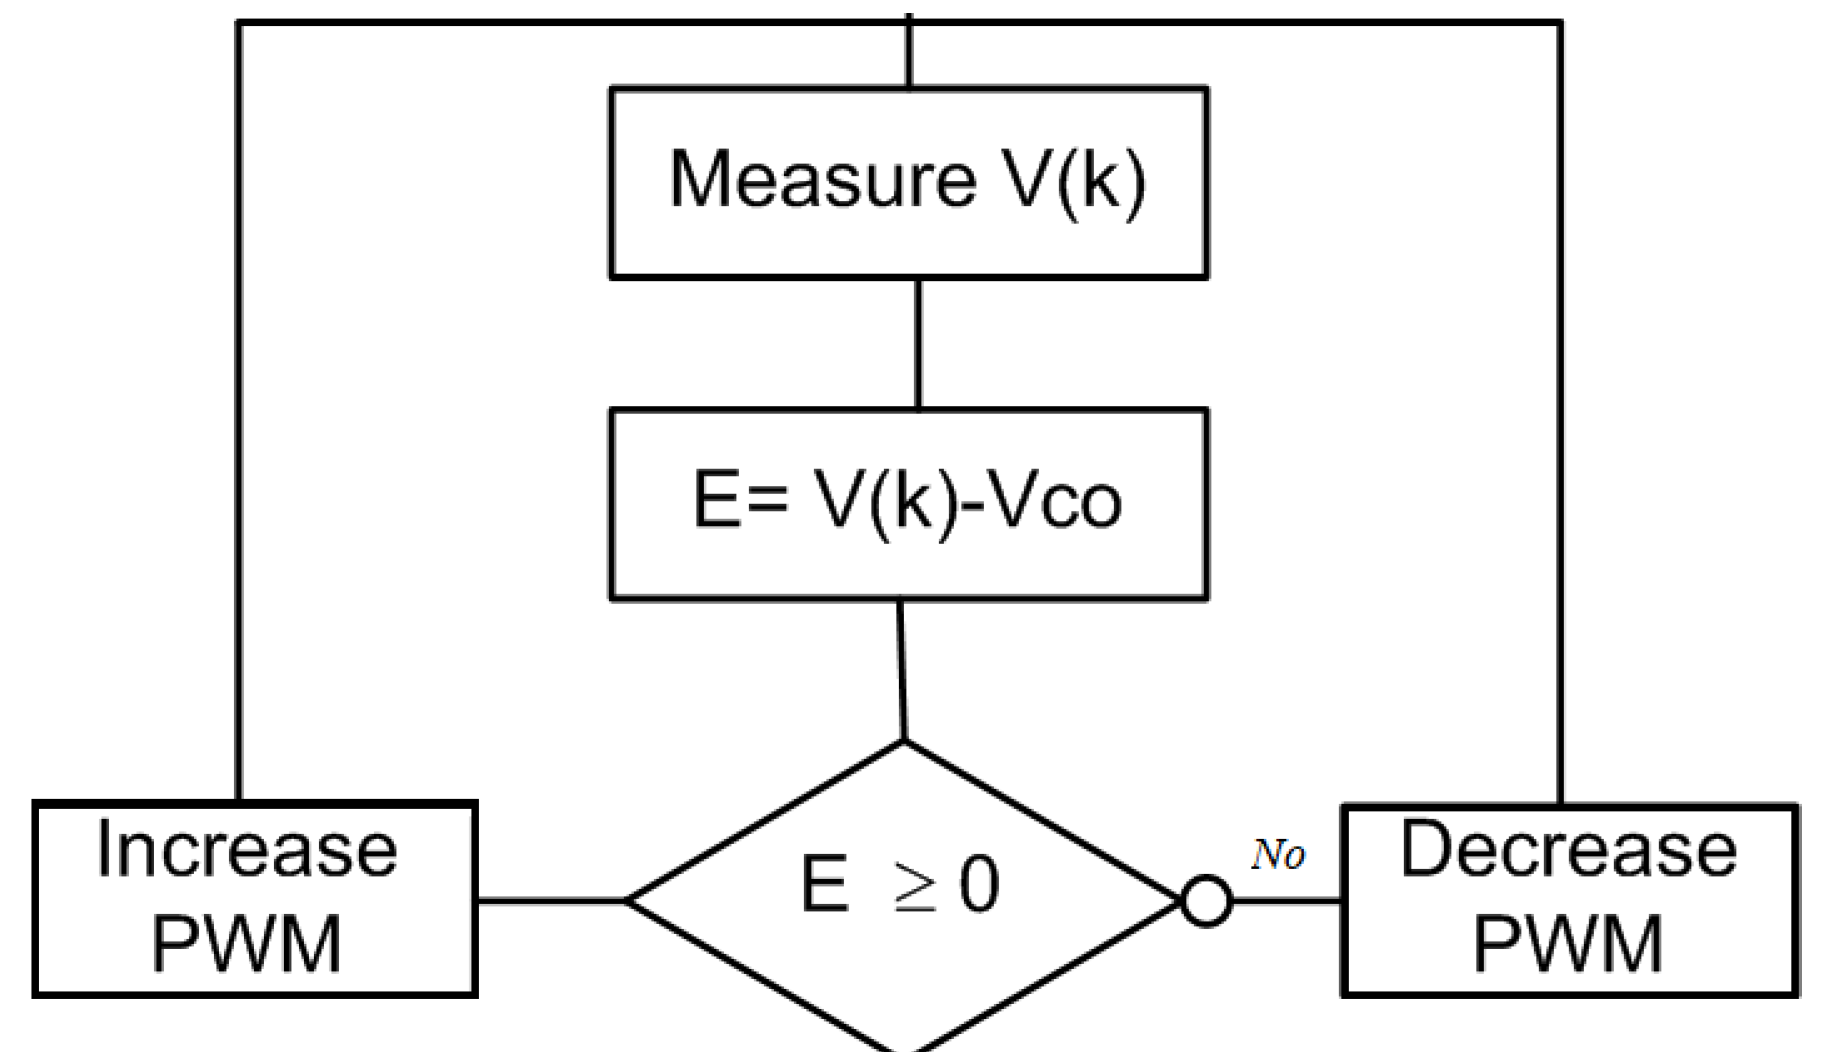
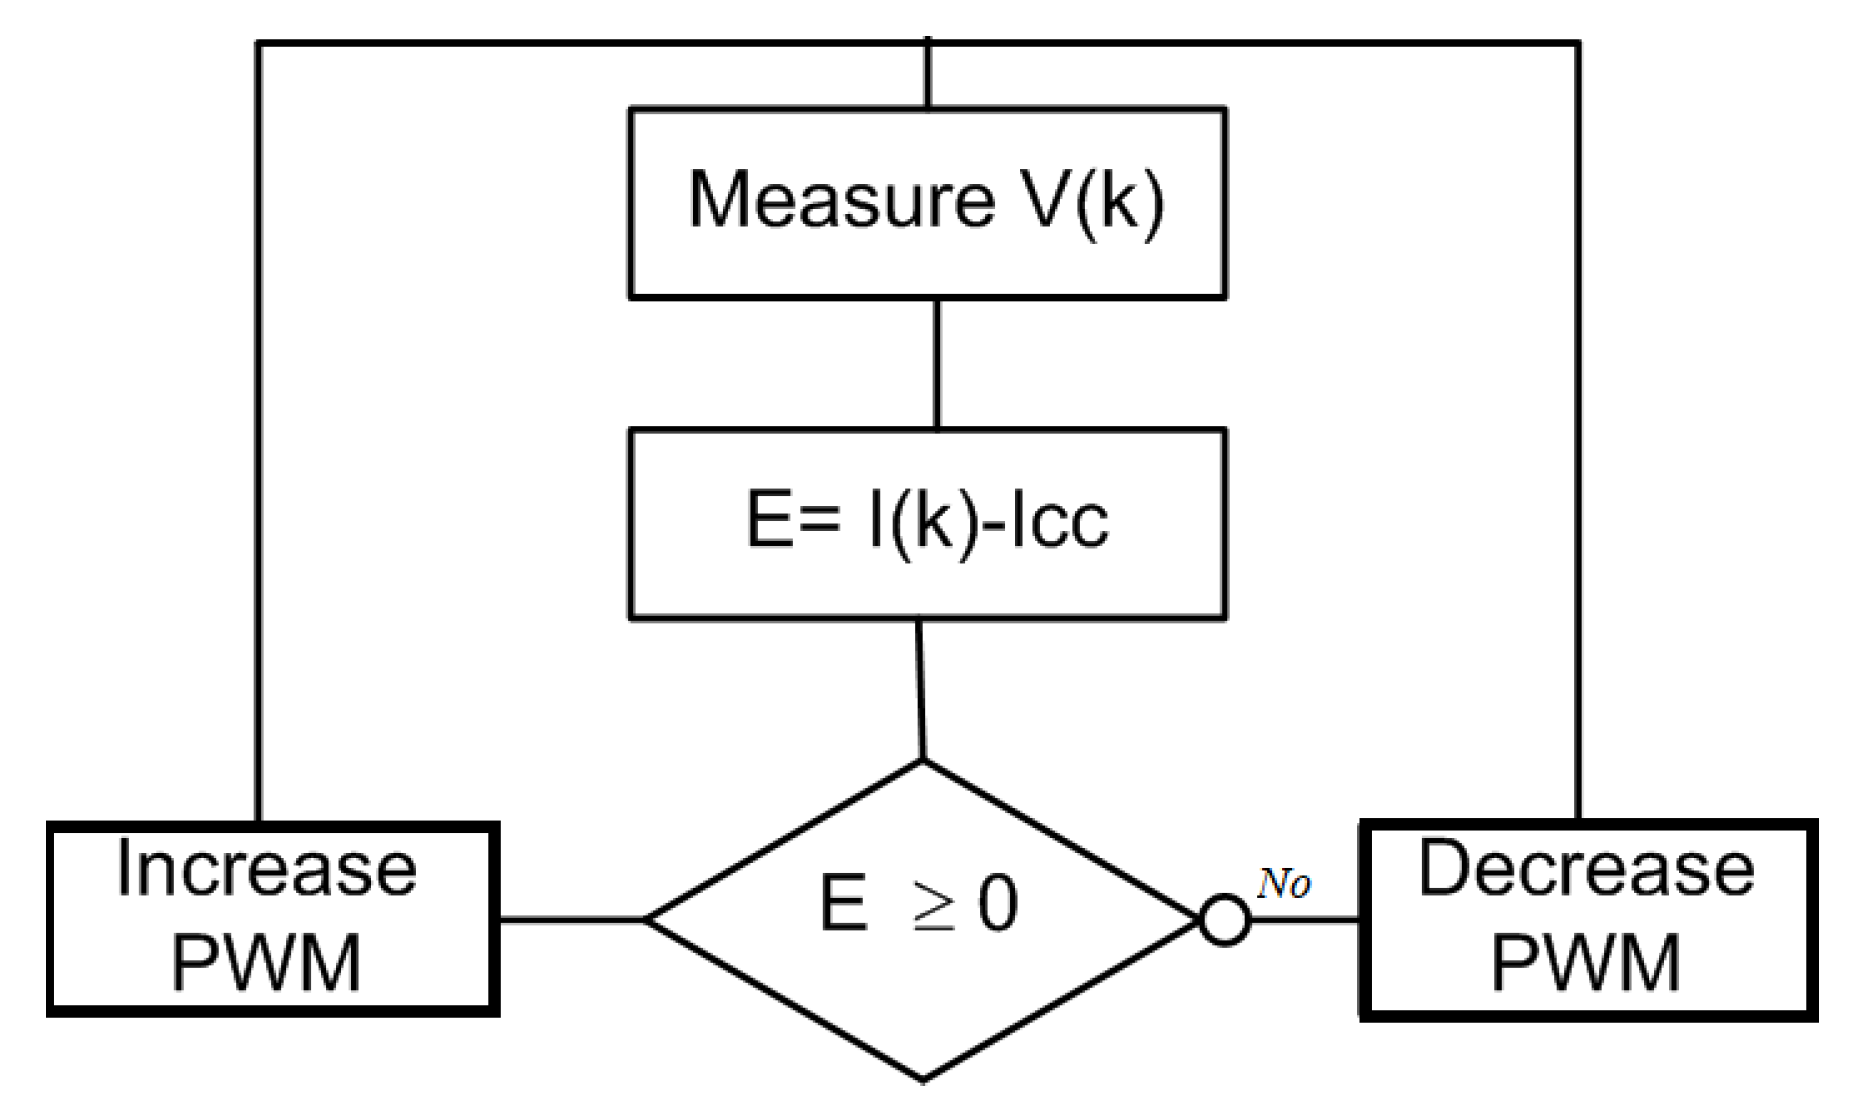
In this research, five MPPT algorithms are proposed and compared in different atmospheric conditions: P&O method [2], IncCond method [1], a method based on the neural network ANN [
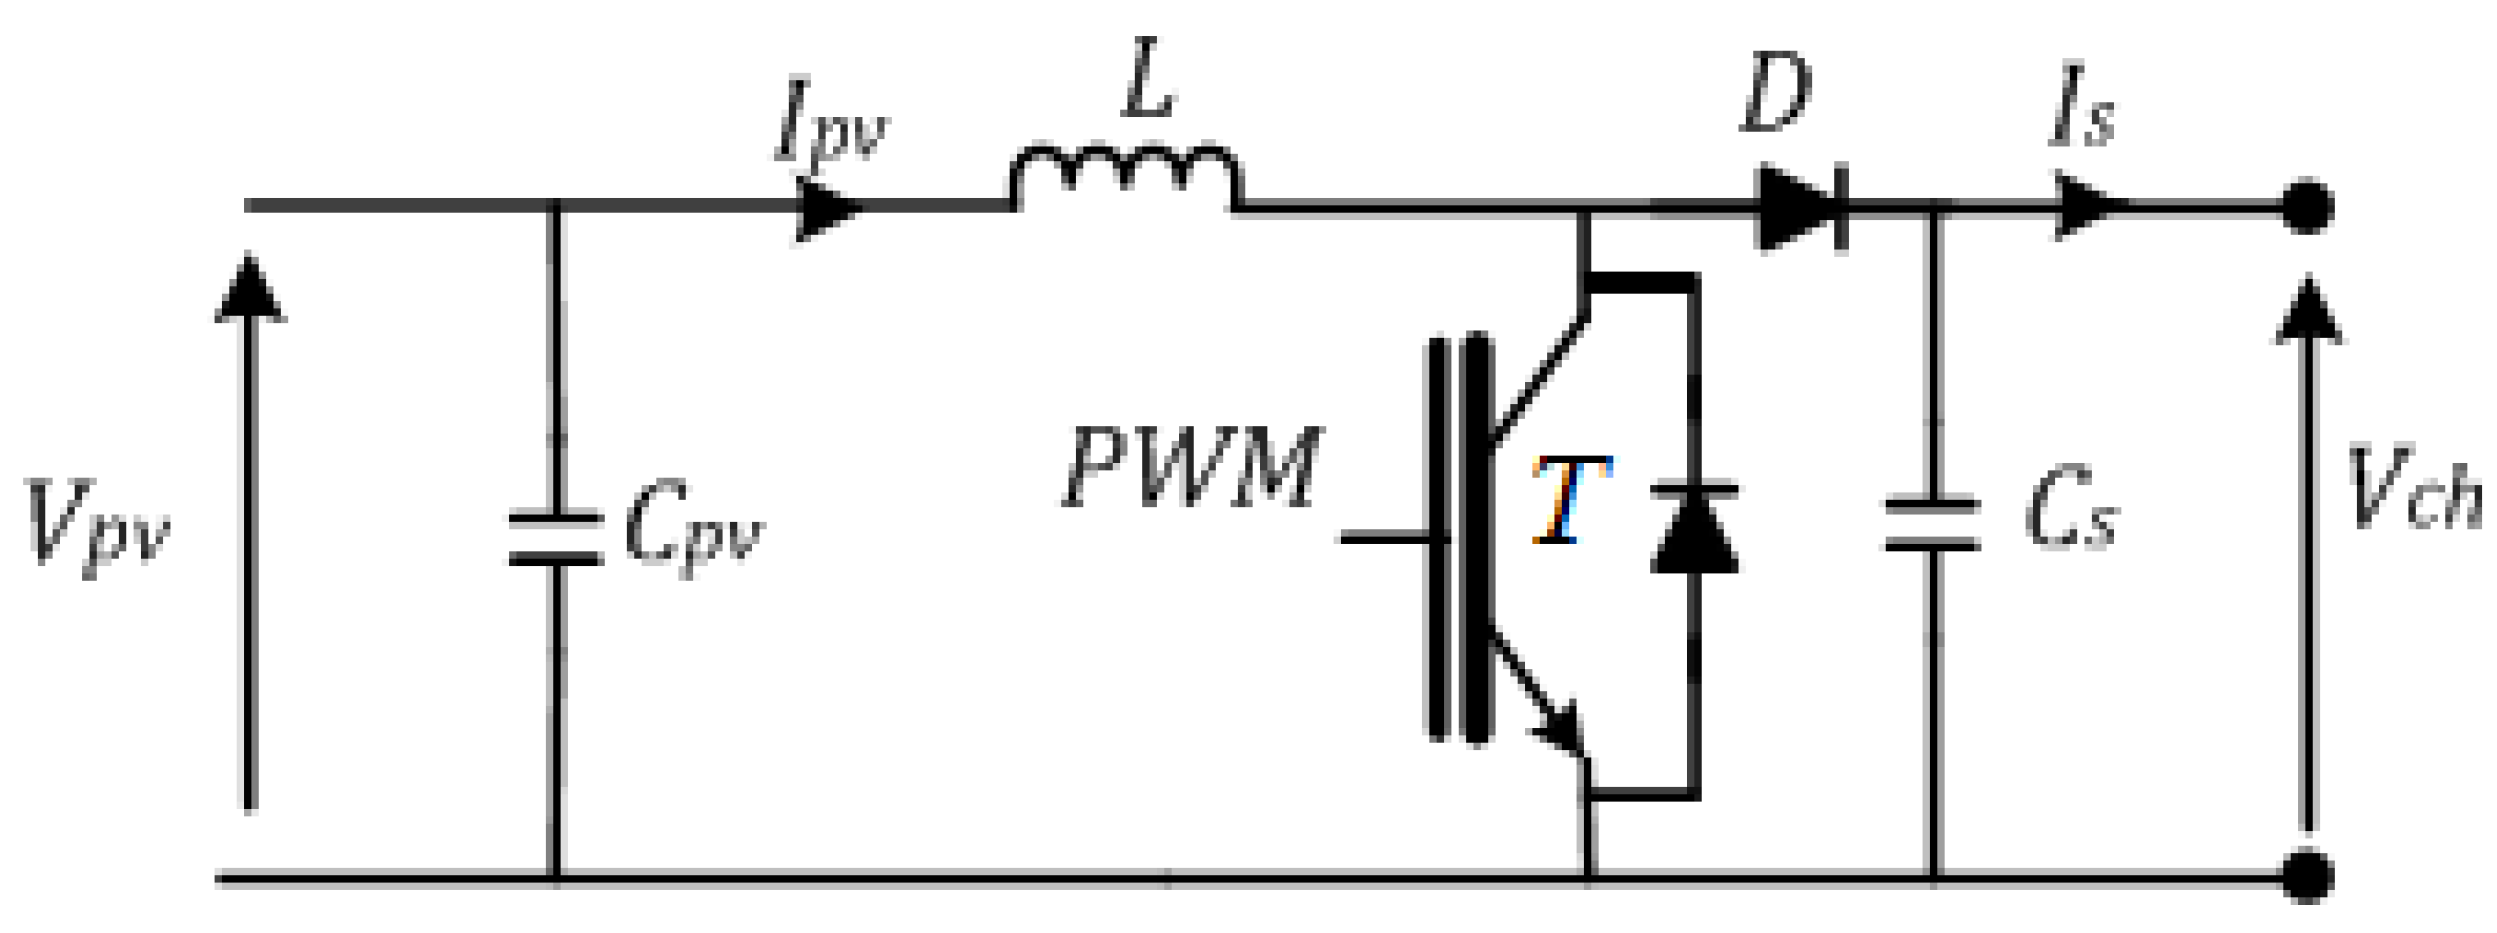
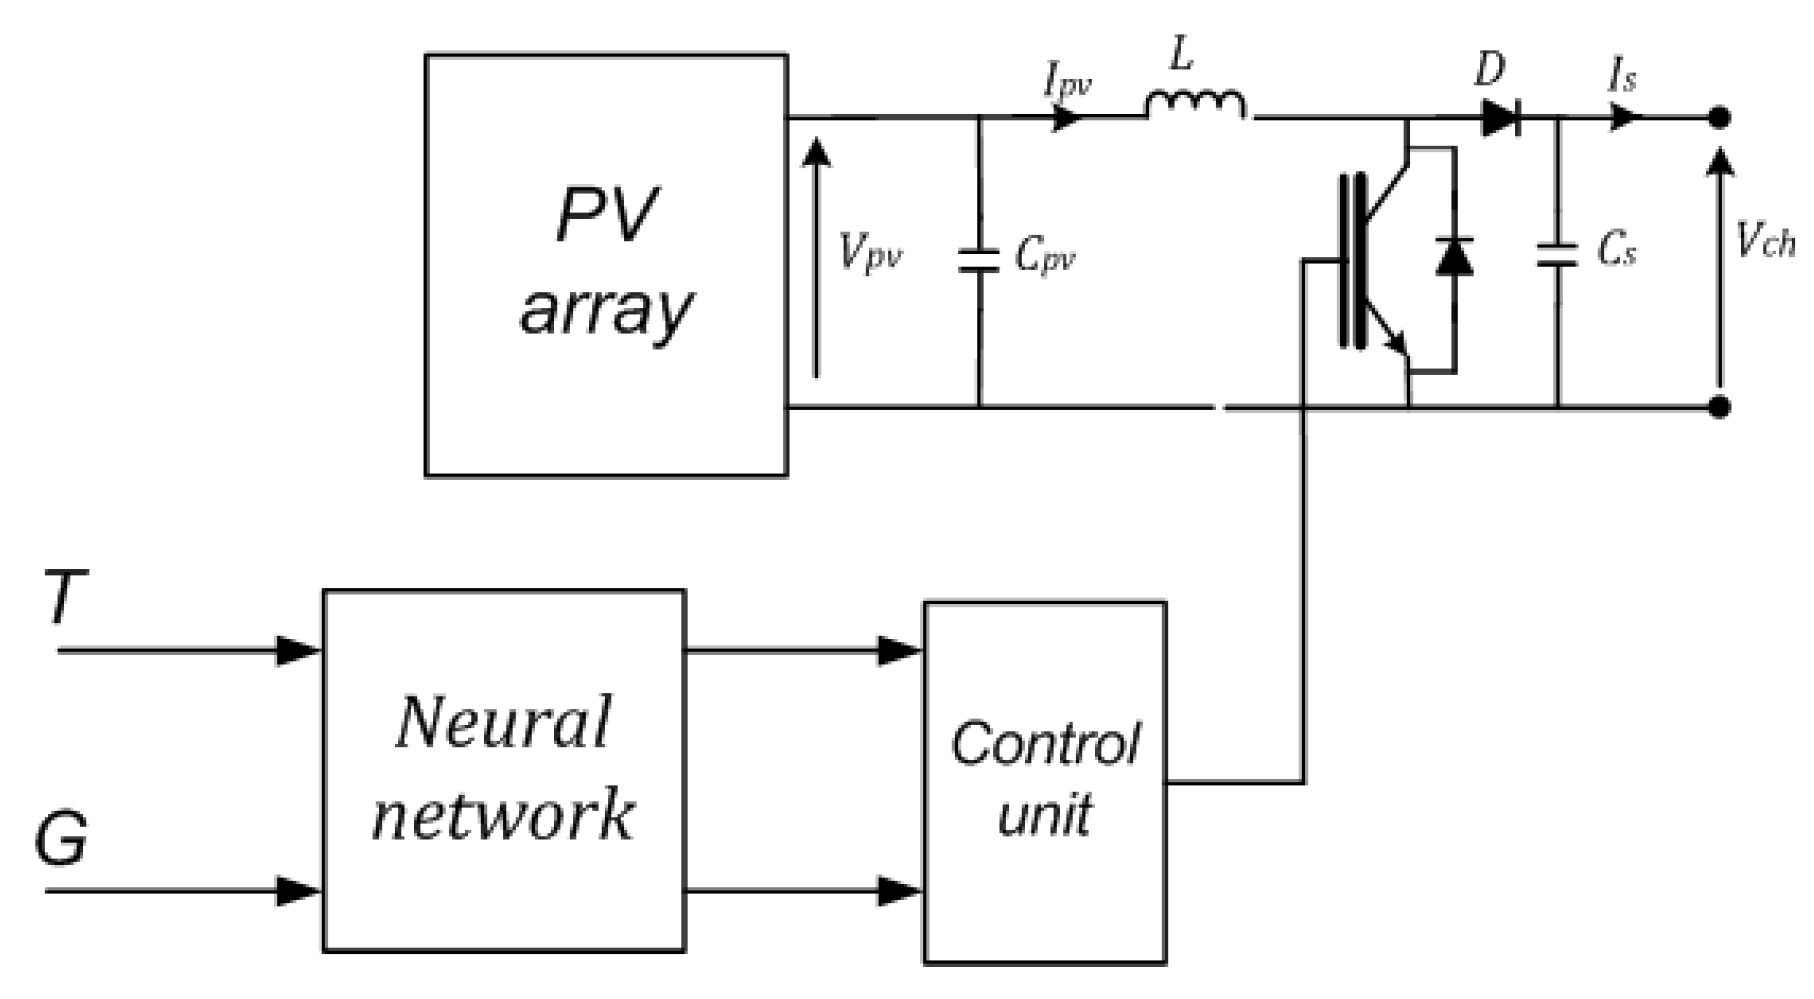
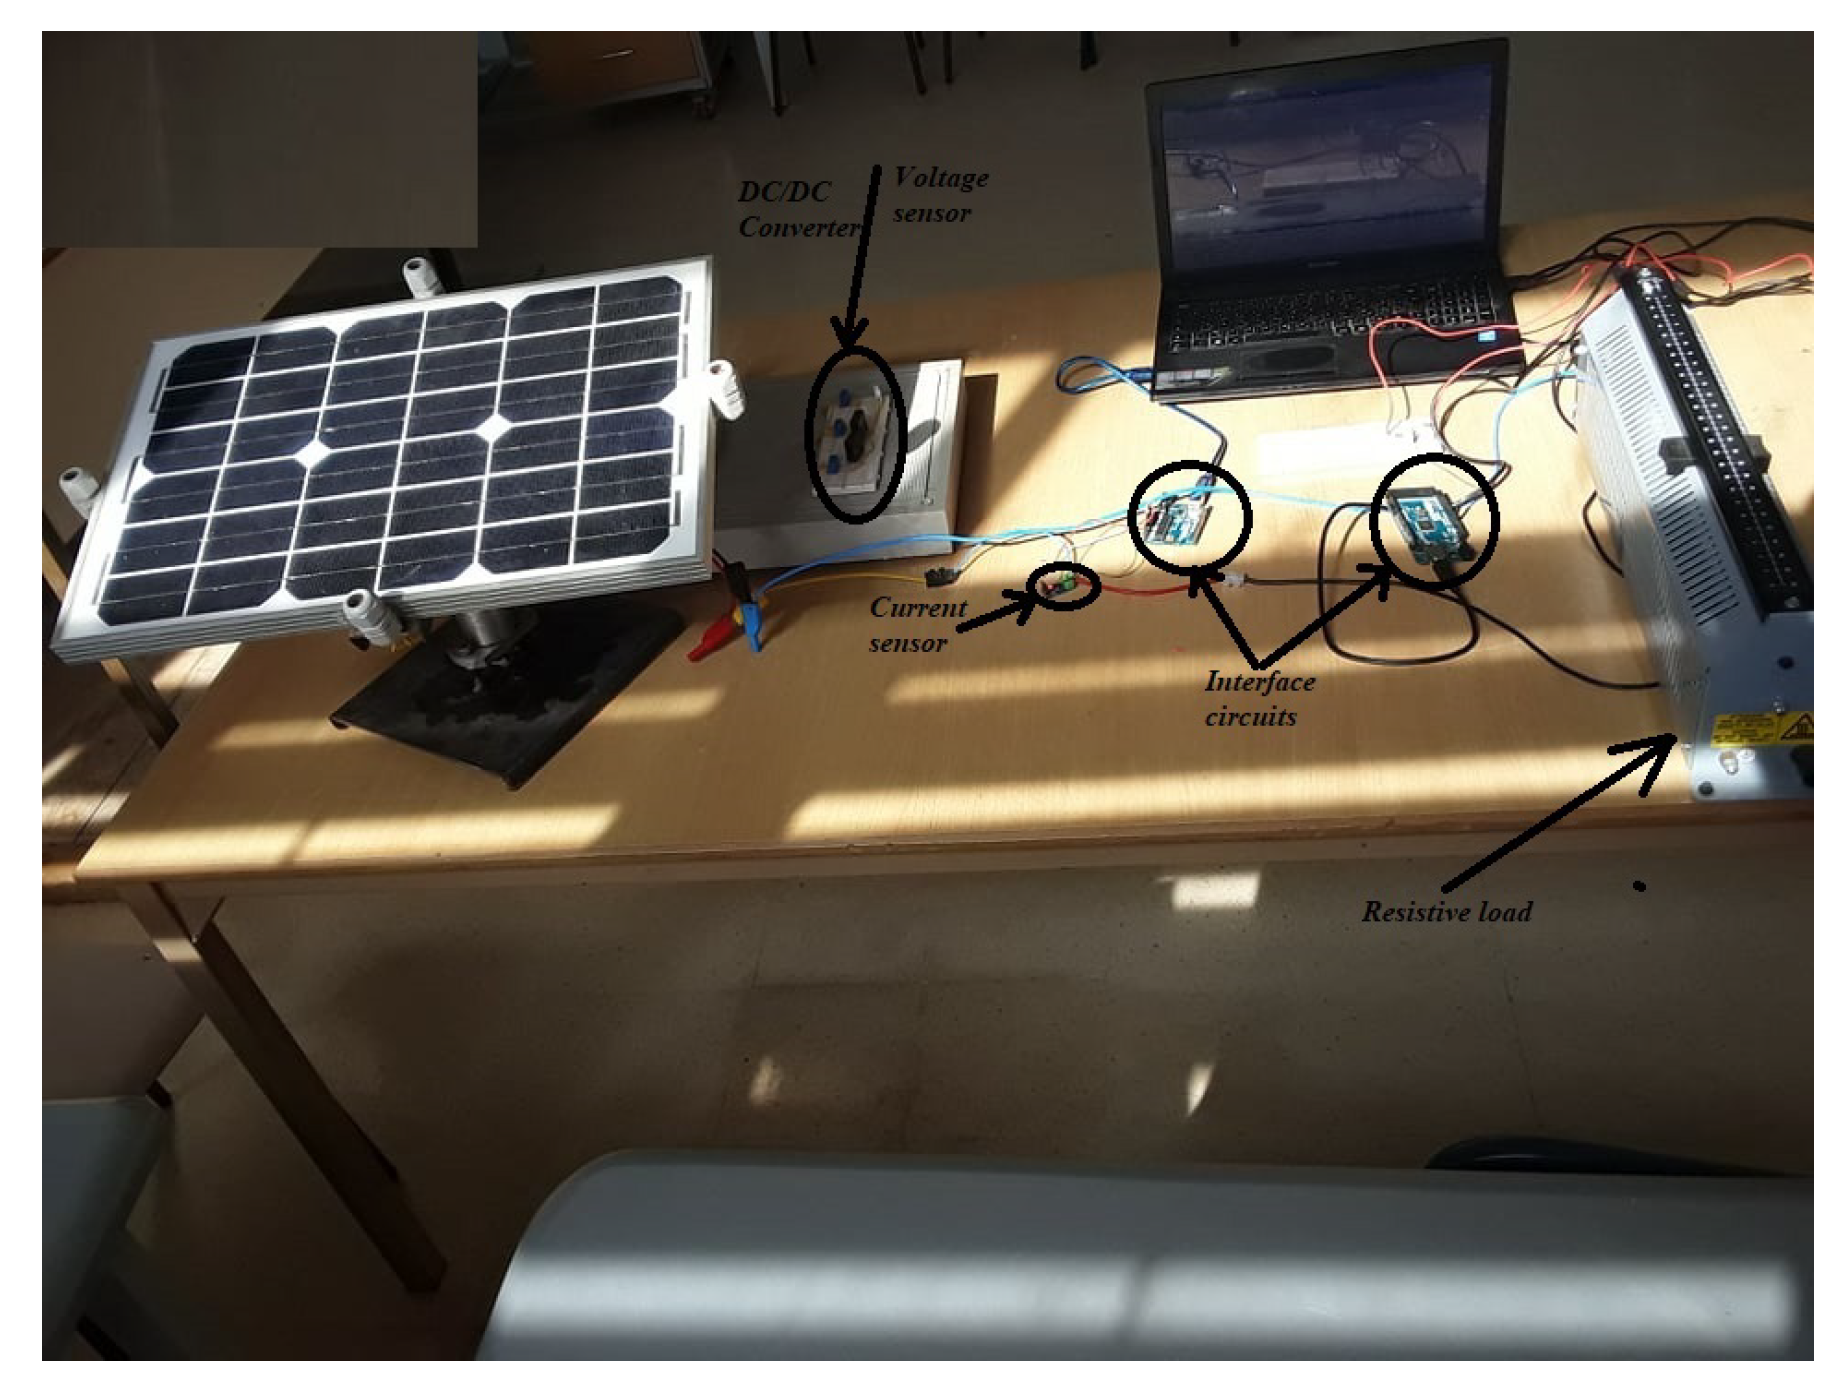
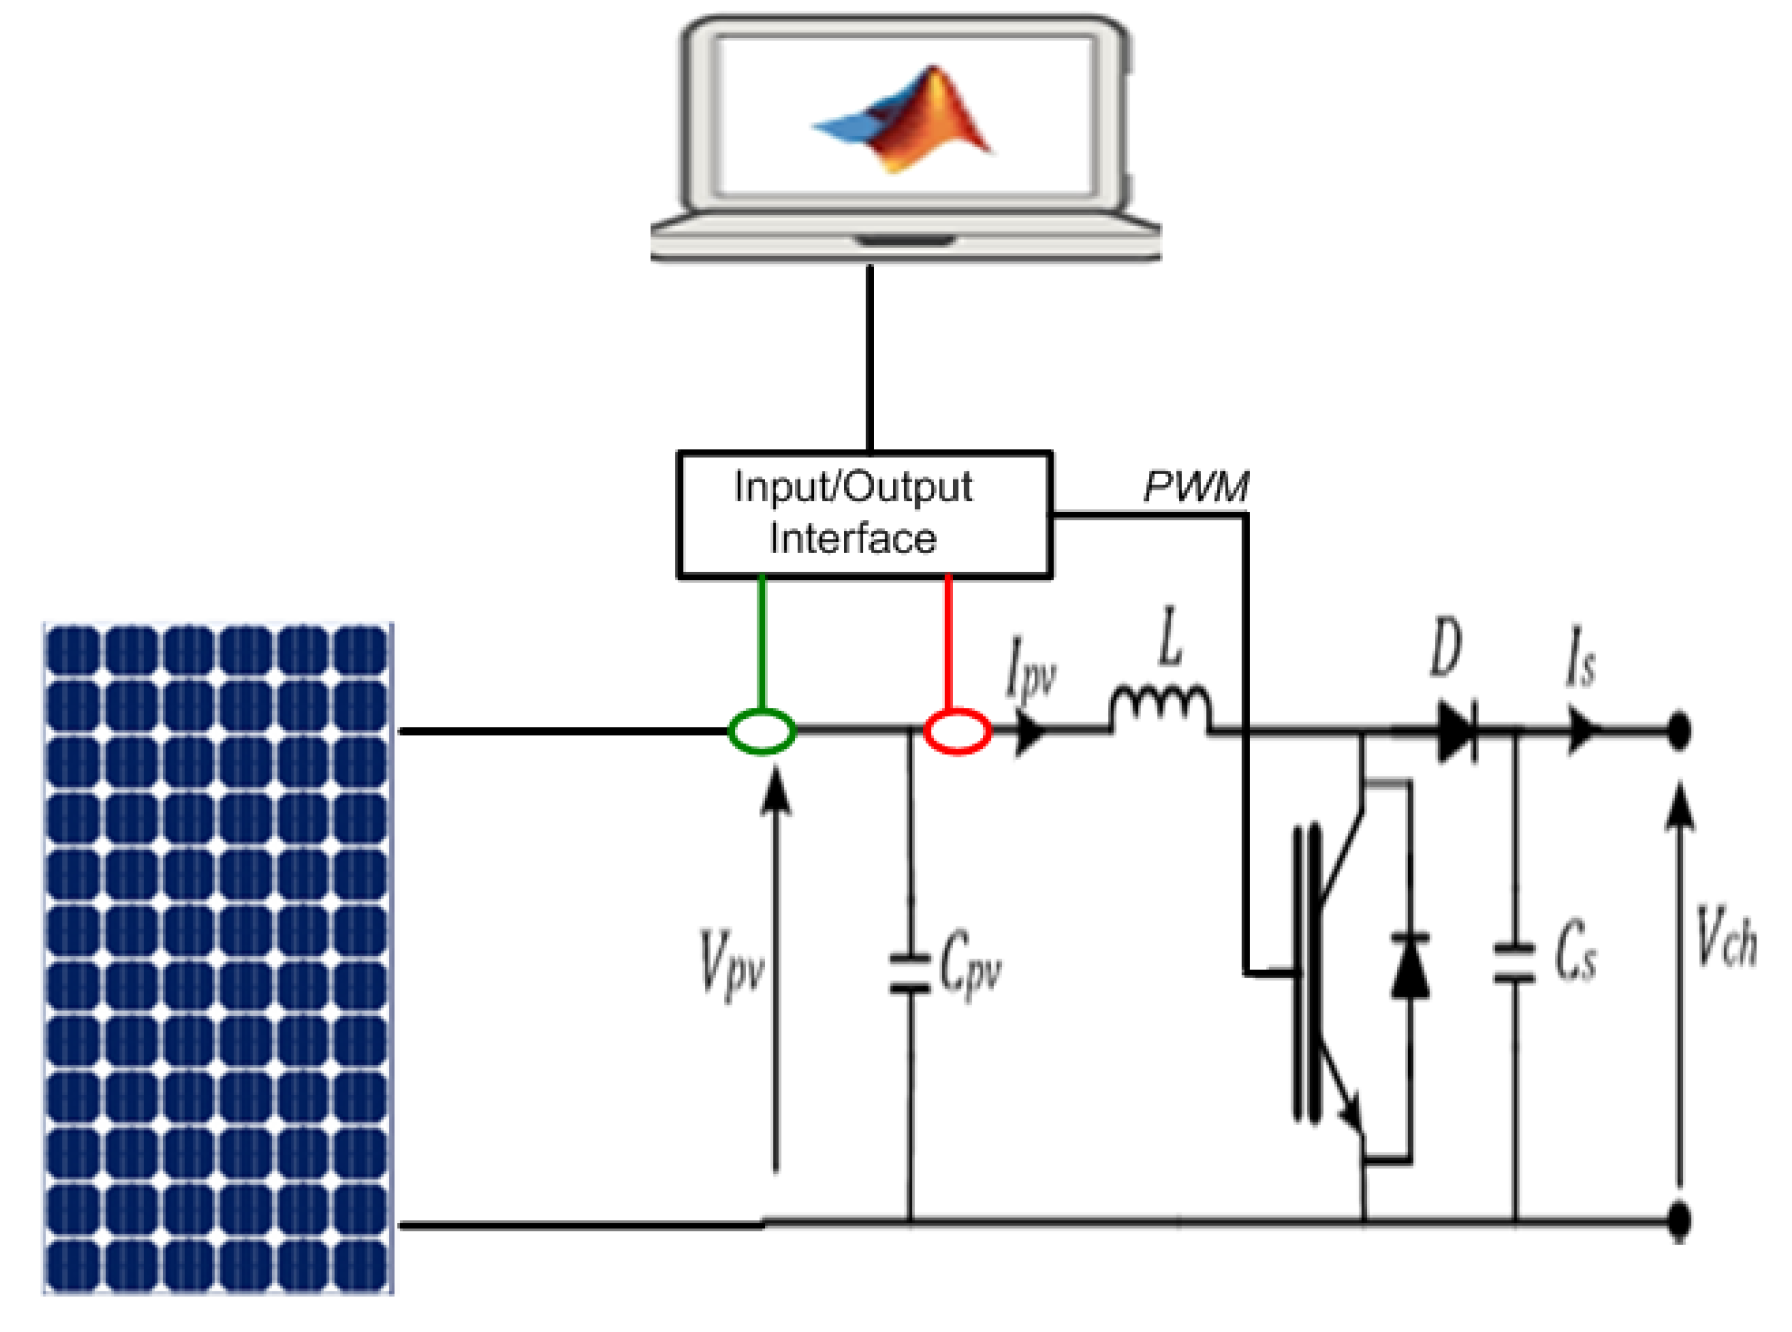
12], the method based on the open-circuit voltage and neural network FVCO, and the method based on the short circuit current and FCC neural network. These algorithms are widely used in photovoltaic systems because they are easily implemented. This paper is made up of four parts: the first describes the PV system, the PV model, and the DC/DC converter, the second part presents the declared MPPT algorithms, the third part focuses on the implementation of the system energy and the implementation of commands in the MATLAB/SIMULINK environment, and the last part of the study presents performance and practical results.

2. PV System Modeling

Photovoltaic systems represent non-polluting sources of production. Despite their costs, these systems are for the diet of the various structures of the electric network with advanced control techniques. The studied system consists of a photovoltaic generator and a DC/DC converter associated with the load. The block diagram of the independent photovoltaic system is shown in Figure 1.
The studied system consists of a photovoltaic generator and a DC/DC converter associated with the load. The PV system generates the electrical energy, the detailed characteristics of the panel under standard conditions are depicted in Table 1. The characteristics of the elements are described in Table 2. The DC/DC converter transforms the generated energy while exploiting the cited algorithms (P&O, INC, ANN, FVCO and FCC) in its command to extract maximum power.

2.1. Modeling and Characteristics of the PV Generator

The model of the photovoltaic generator is shown in Figure 2 below.
The current I p v delivered by the photovoltaic generator is described as follows:
I p v = I c c I 0 . ( e x p ( q . V p v + R s . I p v A . K . T ) 1 ) V p v + R s . I p v R s h
where I p v is current output, V p v is voltage output of the solar PV cell, the electron charge is ( q = 1.6 × 10 19 ), the constant the diode ideality (quality) factor and typically 1 < A < 2 , the Boltzmann constant is ( K = 1.38 × 10 23 J / K ), ( R s ) is the series resistance describing the resistive losses of the PV, and ( R s h ) is the shunt resistance that describes the leakage losses of the junction.
The short-circuit current I c c / G at sunshine G is governed by
I c c / G = G G 0 . I c c / G 0
where G 0 is the standard operating sunshine, which is, in our case, G 0 = 1000 W / m 2 .
The following figures show the characteristics of the photovoltaic panel.
The two graphs in Figure 3 and Figure 4 present the influence of the variation of the insolation, and, at a constant temperature on the behavior of the photovoltaic panel where the maximum power charged P m p p increases following the increase of the insolation, the V c o open circuit voltage is little influenced by this insolation variation, yet the short circuit current I c c is influenced, which is presented in Figure 4.
The characteristics of the panel under standard conditions G = 1000 W / m 2 and T = 25 °C are shown in Table 1.

2.2. DC/DC Converter Block Diagram

The synoptic diagram of the Boost converter is shown in the following Figure 5.
The DC/DC converter is constituted by:
  • A power switch T controlled by a PWM signal generated by the MPPT algorithms.
  • C p v and C s capacitor respectively allow the maintenance of the V p v input voltage input voltage and the output voltage V s .
  • Inductance L minimizes the ripple of the current debited at the load.
  • The diode D ensures the unidirectional continuity of the current of the photovoltaic source towards the load.

3. Overview of the MPPT Algorithms Offered

The best solution to extract the maximum MPPT power from PV arrays is to extract the maximum power by applying several algorithms proposed in this article, which include the P&O perturbation and observation algorithm and the IncCond incremental conductance algorithm, method on the basis of the ANN neural network, the open-circuit voltage-based method and FVCO neural network, and the short-circuit current method and FCC neural network.

3.1. MPPT Method Based on the P&O Algorithm

The method based on the P&O algorithm includes the disturbance of the voltage V p v and the observation of its influence on the direction of development of the power P p v , the analysis of the behavior of the photovoltaic generator, and the extraction maximum power as shown in Figure 6 by explaining the principle of the MPPT method based on the P&O algorithm described [2].

3.1.1. P&O Disturbance and Observation Method

The P&O method consists of varying the V p v voltage to obtain the V m p p voltage for extracting the maximum P m p p power. The method requires a measure of V p v voltage and the Ipv current; the implementation is relatively simple. The course of the P&O algorithm is described by the following steps:
  • Measure V ( k ) and I ( K ) .
  • Calculate P ( K ) = V ( K ) I ( K ) , Δ P ( k ) = P ( k ) P ( k 1 ) and Δ V ( k ) = V ( k ) V ( k 1 ) .
    Referring to Figure 6 is as follows.
  • If ( Δ P ( k ) > 0 ) & ( Δ V ( k ) > 0 ), we increase the duty cycle D.
  • If ( Δ P ( k ) > 0 ) & ( Δ V ( k ) < 0 ), we decrease the duty cycle D.
  • If ( Δ P ( k ) < 0 ) & ( Δ V ( k ) > 0 ), we decrease the duty cycle D.
  • If ( Δ P ( k ) < 0 ) & ( Δ V ( k ) < 0 ), we increase the duty cycle D.
The following Figure 7 describes the flowchart of the P&O algorithm [6].

3.1.2. MPPT Method Based on the INC Algorithm

The INC algorithm of the MPPT method consists of ensuring the minimization of the quantity I pv V pv + I pv V pv 0 .
  • Measure V ( k ) and I ( K ) .
    Calculate P ( K ) = V ( K ) I ( K ) , Δ I ( k ) = I ( k ) I ( k 1 ) and Δ V ( k ) = V ( k ) V ( k 1 ) .
  • If ( Δ V ( k ) 0 ) & ( Δ I ( k ) Δ V ( k ) + I ( k ) V ( k ) = 0 ), we keep the duty cycle D.
  • If ( Δ V ( k ) 0 ) & ( Δ I ( k ) Δ V ( k ) + I ( k ) V ( k ) 0 ) & Δ I ( k ) > 0 , we increase the duty cycle D.
  • If ( Δ V ( k ) 0 ) & ( Δ I ( k ) Δ V ( k ) + I ( k ) V ( k ) 0 ) & Δ I ( k ) < 0 , we decrease the duty cycle D.
  • If ( Δ V ( k ) = 0 ) & ( Δ I ( k ) = 0 ), we increase the duty cycle D.
  • If ( Δ V ( k ) = 0 ) & ( Δ I ( k ) 0 ), we decrease the duty cycle D.
The flowchart of the INC algorithm is presented in the following Figure 8 [1].

3.2. MPPT Methods Based on the Neural Network

The synoptic diagram of the MPPT controller based on the neural network is shown in the following Figure 9.

3.2.1. ANN Method

The ANN method controller reaches the Vmpp voltage corresponding to the maximum P m p p power:
  • Measure V ( k ) .
  • If ( V ( k ) V m p p 0 ), we increase the duty cycle D.
  • If ( V ( k ) V m p p < 0 ), we decrease the duty cycle D.
The flowchart of the neural networks based MPPT algorithm is depicted in the Figure 10 [13,14].

3.2.2. ANN FVCO Method

The ANN FVCO controller reaches the V m p p = K . V C O voltage to extract P m p p .
  • Measure V ( k ) .
  • If ( V ( k ) k . V c o 0 ), we increase the duty cycle D.
  • If ( V ( k ) k . V c o < 0 ), we decrease the duty cycle D.
The ANN FVCO method is described by the flowchart in the Figure 11 [13,15].

3.2.3. ANN FCC Method

The ANN FCC controller ensures P m p p extraction by feeding the load by the I m p p = K . I C C current:
  • Measure I ( k ) .
  • If ( I ( k ) k . I c c 0 ), we increase the duty cycle D.
  • If ( I ( k ) k . I c c < 0 ), we decrease the duty cycle D.
The ANN FCC method is described by the flowchart in the following Figure 12 [13,16].

4. Design and Implementation of the PV System

The PV system consists of a power unit that is a DC/DC converter supplying the load and a control unit consisting of an RS232 interface element connected to the computer via MATLAB/Simulink and an energy block consisting of the current sensor and voltage sensor.

4.1. Power Block

The test bench shown in the following Figure 13 is constituted by an interface circuit (two ARDINO cards), an ACS712 current sensor, a voltage sensor, a DC/DC converter, and a resistive load [16,17].
The synoptic of the power block of the synoptic test bench is presented in the following Figure 14 is represented by a DC/DC converter and the output interface.
The experimental test bench is represented in the synoptic architecture of the system by a solar panel, an interface card for acquiring the I p v current, V p v voltage, and receiving the PWM signal regulating the power switch of the DC/DC converter to extract P m p p power [18,19].
Table 2 illustrates the values of the elements of the converter.
The following equations describe the operation of the presented DC/DC converter.
C s . d v c h d t + v c h R = ( 1 α ) . i p v
The V p v described by
v p v = L d i p v d t + ( 1 α ) . V c h
α is the PWM duty cycle generated by the MATLAB interface. The switching frequency is f = 1 kHz.
The implemented MPPT methods control the power switch by providing the optimum duty cycle to ensure the delivery of the maximum power extracted from the photovoltaic panel to the load [19,20].

4.2. Energy Block

The energy block consists of the current sensor ACS712 and the voltage sensor designed by a voltage divider in PCB described by the following Figure 15.
The voltage of the photovoltaic panel is described by the following equation:
V p v = ( 1 + R 1 R 2 ) . V o u t

5. Performance and Results

The resistive load value is R = 25 Ω .
The study focuses on the study of the behavior of the photovoltaic system in five successive days in September and, each time we apply an MPPT control algorithm, we illustrate the results in the following Table 3, Table 4, Table 5, Table 6 and Table 7.
The measured results of the preceding tables will be represented by histograms presented in Figure 16 in order to facilitate the comparison of the different methods.

Visualization of PV System Characteristics

The characteristics of the generator ( P p v & V p v ) in a sunny condition such as G = 1100 W / m 2 and the temperature T = 27 °C. The visualizations are represented by the following Figure 17 and Figure 18.
In agreement with the simulation curves of the MPPT algorithms presented by the Figure 17 and Figure 18 clearly showing that all the algorithms mentioned converge towards the maximum desired power, we also note that the power P m p p varies according to the MPPT method applied to the converter command, we notice that 59 W P m p p 67 W; the power is of the order of 67 W when the P&O or INC or ANN methods are not applied, and it will be of the order of 59 W if the MPPT FVCO or FCC command is applied. The average time of reaching the permanent response of the PV system controlled by the algorithms P&O and INC is of the order of 0.3 s, while the algorithms based on the neuron network ensure a permanent response after 0.6 s. Moreover, it can be concluded that all algorithms converge, except the FCC algorithm presents the highest oscillations to reach the permanent response in power. We present a summary table allowing the comparison of the different algorithms applied.
The summary of the the comparison of the five methods presented in the Table 8.

6. Conclusions and Perspectives

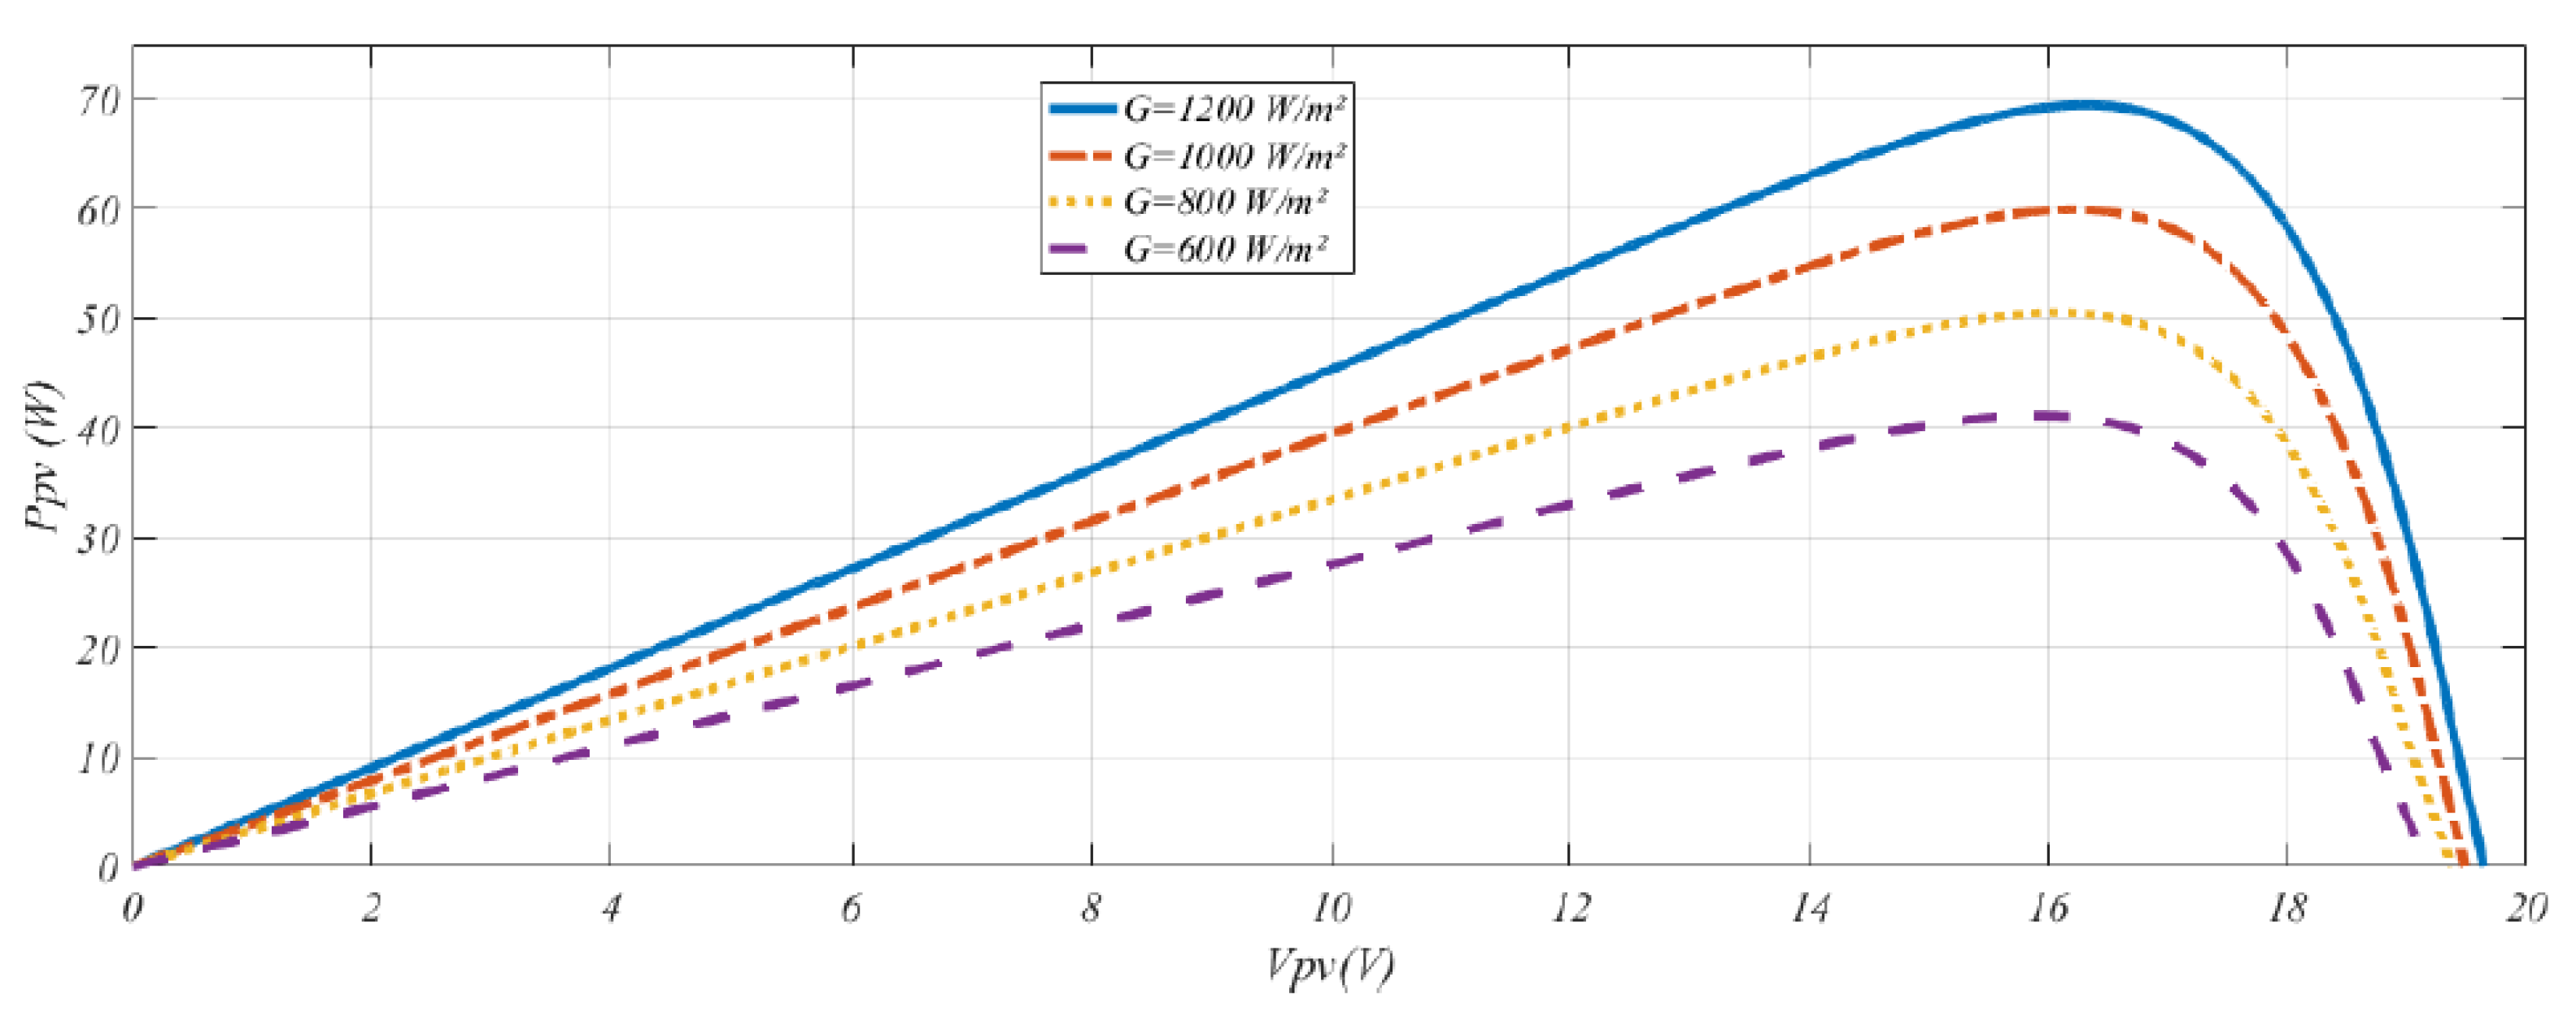
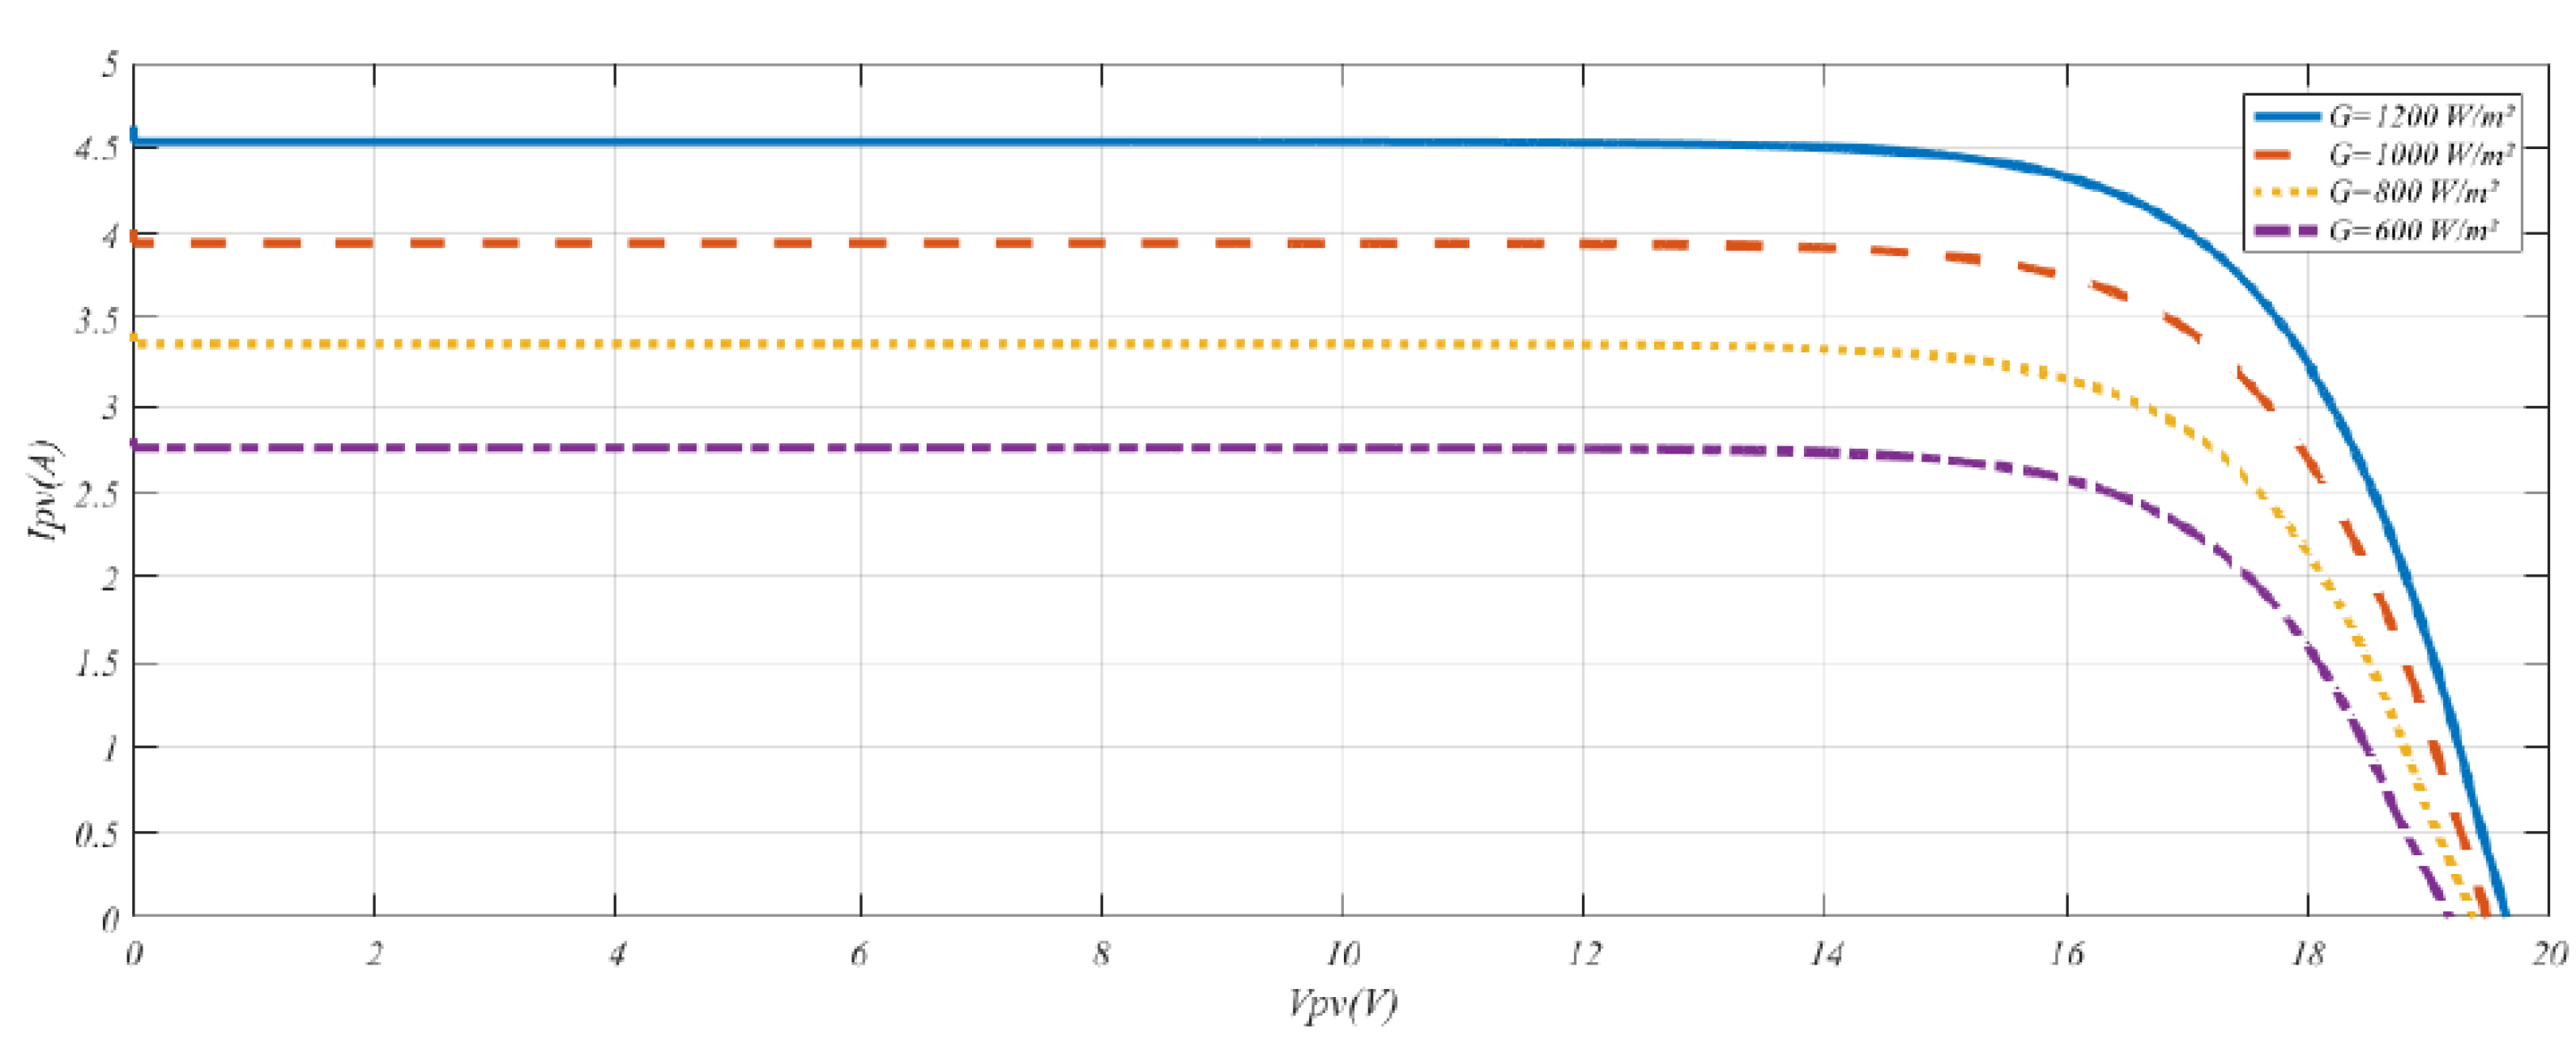
This article presents the model of the photovoltaic generator which uses different MPP tracking algorithms under different weather conditions in order to compare the behavior of the system (a photovoltaic panel and DC/DC converter).
Moreover, it was found that the FCC algorithm presents an oscillation solution with 1 s duration. As a conclusion, the choice of the appropriate algorithm to apply depends on the required speed and precision. This study was based on a realistic implementation to simulate the performance of these algorithms under real operating conditions.
As perspectives, the proposed algorithms will be implemented in control cards STM 32 of hybrid system converters to improve their performance compared to the application of conventional methods. Moreover, the reliability of these techniques will be tested under real weather conditions that highly affect the PV system performance. Furthermore, in future, the model will be improved by implementing the economic parameters so that the cost-effective technical study will be taken into account during algorithms comparison. In addition, we will study the efficiency of the injection of the power in the network by applying the proposed techniques.

Author Contributions

Conceptualization, H.J. and A.M.; investigation, F.T. and A.M.; methodology, F.T., N.B.K. and W.A.; project administration, H.J. and A.M.; software, F.T., N.B.K. and A.B.; supervision, A.M.; writing—original draft, F.T. and A.B.; writing—review and editing, H.J., N.B.K., W.A. and M.B. All authors have read and agreed to the published version of the manuscript.

Funding

This research was funded by Scientific Research Deanship at University of Ha’il Grant No. RG-21 056.

Institutional Review Board Statement

Not applicable.

Informed Consent Statement

Not applicable.

Data Availability Statement

Not applicable.

Conflicts of Interest

The authors declare no conflict of interest.

References

  1. Adebiy Abayomi, A.; Lazarus, I.J.; Saha, A.K.; Ojo, E.E. Performance analysis of grid-tied photovoltaic system under varying weather condition and load. Int. J. Electr. Comput. Eng. (IJECE) 2021, 11, 94–106. [Google Scholar] [CrossRef]
  2. Lodin, O.; Kaur, I.; Kaur, H. Predictive-P&O Mppt Algorithm for Fast and Reliable Tracking of Maximum Power Point in Solar Energy Systems. Int. J. Recent Technol. Eng. (IJRTE) 2019, 7, 264–268. [Google Scholar]
  3. Benabda, A.; Kelaiaia, M.S.; Labar, H.; Logerais, P.O.; Durastanti, J.F. Boost chopper MPP assessment based on solar irradiance and predictive duty cycle applied to a PV system. Int. J. Hydrogen Energy 2017, 42, 19403–19410. [Google Scholar] [CrossRef]
  4. Vadivel, S.; Sengodan, B.C.; Ramasamy, S.; Ahsan, M.; Haider, J.; Rodrigues, E.M.G. Social Grouping Algorithm Aided Maximum Power Point Tracking Scheme for Partial Shaded Photovoltaic Array. Energies 2022, 15, 2105. [Google Scholar] [CrossRef]
  5. Moutchou, M.; Jbari, A. Fast Photovoltaic IncCond-MPPT and Backstepping Control, Using DC-DC Boost Converter. Int. J. Electr. Comput. Eng. (IJECE) 2020, 10, 1101–1112. [Google Scholar] [CrossRef] [Green Version]
  6. Nabipour, M.; Razaz, M.; Seifossadat, S.G.; Mortazavi, S.S. A new MPPT scheme based on a novel fuzzy approach. Renew. Sustain. Energy Rev. 2017, 74, 1147–1169. [Google Scholar] [CrossRef]
  7. Amirullah, A.; Kiswantono, A. Power Quality Enhancement of Integration Photovoltaic Generator to Grid under Variable Solar Irradiance Level using MPPT-Fuzzy. Int. J. Electr. Comput. Eng. (IJECE) 2016, 6, 2629–2642. [Google Scholar] [CrossRef]
  8. Adullah, A.G.; Aziz, M.S.; Hamad, B.A. Comparison between neural network and P&O method in optimizing MPPT control for photovoltaic cell. Int. J. Electr. Comput. Eng. (IJECE) 2020, 10, 5083–5092. [Google Scholar]
  9. Yadav, I.; Maurya, S.K.; Gupta, G.K. A Literature Review on Industrially Accepted MPPT Techniques for Solar PV System. Int. J. Electr. Comput. Eng. (IJECE) 2020, 10, 2117–2127. [Google Scholar] [CrossRef]
  10. Yoganandini, A.P.; Anitha, G.S. A cost effective computational design of maximum power point tracking for photovoltaic cell. Int. J. Electr. Comput. Eng. (IJECE) 2019, 9, 851–860. [Google Scholar] [CrossRef]
  11. Elahi, M.; Ashraf, H.M.; Kim, C.H. An Improved Partial Shading Detection Strategy Based on Chimp Optimization Algorithm to Find Global Maximum Power Point of Solar Array System. Energies 2022, 15, 1549. [Google Scholar] [CrossRef]
  12. Ghenai, C.; Salameh, T.; Merabet, A. Technico-Economic Analysis of off Grid Solar PV/Fuel Cell Energy System for Residential Community in Desert Region. Int. J. Hydrogen Energy 2020, 45, 11460–11470. [Google Scholar] [CrossRef]
  13. Fathi, T.; Jouini, H.; Mami, A. Comparative Study of MPPT Algorithms of an Autonomous Photovoltaic Generator. In Proceedings of the SEAHF 2019: 1st International Conference on Smart Innovation, Ergonomics and Applied Human Factors, Madrid, Spain, 22–24 January 2019; pp. 393–400. [Google Scholar] [CrossRef]
  14. Bouselham, L.; Hajji, M.; Hajji, B.; Bouali, H. A New MPPT-based ANN for Photovoltaic System under Partial Shading Conditions. Energy Procedia 2017, 111, 924–933. [Google Scholar] [CrossRef]
  15. Lopez-Guede, J.M.; Ramos-Hernanz, J.A.; Zulueta, E.; Fernandez-Gamiz, U.; Azkune, G. Dual model oriented modeling of monocrystalline PV modules based on artificial neuronal networks. Int. J. Hydrogen Energy 2017, 42, 18103–18120. [Google Scholar] [CrossRef]
  16. Motahhir, S.; Chalh, A.; Ghzizal, A.; Sebti, S.; Derouich, A. Modeling of Photovoltaic Panel by using Proteus. J. Eng. Sci. Technol. Rev. 2017, 10, 8–13. [Google Scholar] [CrossRef]
  17. Rekioua, D.; Matagne, E. Optimization of Photovoltaic Power Systems, Green Energy and Technology; Springer: London, UK, 2012; ISBN 978-1-4471-2348-4/978-1-4471-2403-0. [Google Scholar]
  18. Rizzo, S.A.; Scelba, G. ANN based MPPT method for rapidly variable shading conditions. Appl. Energy 2015, 145, 124–132. [Google Scholar] [CrossRef]
  19. Han, Y.; Zhang, G.; Li, Q.; You, Z.; Chen, W.; Liu, H. Hierarchical Energy Management for PV/Hydrogen/Battery Island DC Microgrid. Int. J. Hydrogen Energy 2019, 44, 5507–5516. [Google Scholar] [CrossRef]
  20. Charles Lawrence Kamuyu, W.; Lim, J.R.; Won, C.S.; Ahn, H.K. Prediction Model of Photovoltaic Module Temperature for Power Performance of Floating PVs. Energies 2018, 11, 447. [Google Scholar] [CrossRef] [Green Version]
Figure 1. Topology of the studied system.
Mathematics 10 01080 g001
Figure 2. PV module real electrical circuit.
Mathematics 10 01080 g002
Figure 3. Ppv = f(Vpv) of the PV Generator.
Mathematics 10 01080 g003
Figure 4. Ipv = f(Vpv) of the PV Generator.
Mathematics 10 01080 g004
Figure 5. Block diagram of the Boost DC/DC converter.
Mathematics 10 01080 g005
Figure 6. Perturb and observe Method P&O.
Mathematics 10 01080 g006
Figure 7. Flowchart of the P&O algorithm of the MPPT method.
Mathematics 10 01080 g007
Figure 8. Flowchart of the INC algorithm of the MPPT method.
Mathematics 10 01080 g008
Figure 9. MPPT ANN controller block diagram.
Mathematics 10 01080 g009
Figure 10. Flowchart of the ANN algorithm of the MPPT method.
Mathematics 10 01080 g010
Figure 11. Flowchart of the ANN FVCO MPPT method algorithm.
Mathematics 10 01080 g011
Figure 12. Flowchart of the ANN FCC MPPT method algorithm.
Mathematics 10 01080 g012
Figure 13. The proposed photovoltaic circuit.
Mathematics 10 01080 g013
Figure 14. Synoptic of the system.
Mathematics 10 01080 g014
Figure 15. Divider voltage sensor.
Mathematics 10 01080 g015
Figure 16. Extracted power by different MPPT algorithms.
Mathematics 10 01080 g016
Figure 17. P p v at 3:00 p.m., third time of the day.
Mathematics 10 01080 g017
Figure 18. V p v at 3:00 p.m., third time of the day.
Mathematics 10 01080 g018
Table 1. MSC-60 solar PV module specification.
VariableValue
Maximum power P m a x 60 W
Voltage V m p p 16.25 V
Current I m p p 3.7 A
Short circuit current I c c 3.95 A
Open circuit voltage V o c 19.2 V
Open circuit temperature coefficient V c o   K v 80 mV/°C
Short-circuit temperature coefficient I c c   K i 24 mA/°C
Number of cells36
Table 2. DC/DC converter element table.
ElementSymbolValue
Coupling capacitor C p v 870 μ F
CoilL36 mH
Load coupling capacitorC 670 μ F
Junction diodeDRef:1N4148W
Power switch I G B T Ref:IGBT
Table 3. Control by the P&O algorithm.
TimeE (W/m 2 )T (°C) P pv (W) Direct Coupling V mpp (V) MPP Coupling P mpp (W) MPP Coupling
10 h7502514.2417.546
11 h10002714.3816.1558
13 h11002714.2415.8561
15 h9002714.081653
17 h7002514.1316.8542
Table 4. Control by the INC algorithm.
TimeE (W/m 2 )T (°C) P pv (W) Direct Coupling V mpp (V) MPP Coupling P mpp (W) MPP Coupling
10 h7502514.2416.7748
11 h10002714.3816.1458
13 h11002714.2416.6264
15 h9002714.0816.654
17 h7002514.1317.5541
Table 5. Control by the ANN algorithm.
TimeE (W/m 2 )T (°C) P pv (W) Direct Coupling V mpp (V) MPP Coupling P mpp (W) MPP Coupling
10 h7502514.2415.948
11 h10002714.3816.160
13 h11002714.2416.6263
15 h9002714.0816.6253.5
17 h7002514.1316.6445.8
Table 6. Control by the FVCO algorithm.
TimeE (W/m 2 )T (°C) P pv (W) Direct Coupling V mpp (V) MPP Coupling P mpp (W) MPP Coupling
10 h7502514.2415.9248
11 h10002714.3816.1260
13 h11002714.2416.6264
15 h9002714.0815.554
17 h7002514.1315.5446.3
Table 7. Control by the FCC algorithm.
TimeE (W/m 2 )T (°C) P pv (W) Direct Coupling V mpp (V) MPP Coupling P mpp (W) MPP Coupling
10 h7502514.241748
11 h10002714.3816.1460
13 h11002714.2416.6264
15 h9002714.0815.554
17 h7002514.1317.3346.3
Table 8. Summary table of the comparison of the five methods mentioned.
MPPT AlgorithmP&OINCANNFVCOFCC
Precision98%98%98%92%93%
Convergence speedFastFastModestModestSlow
Time of the convergence ( 90 % P m p p )0.2 s0.3 s0.8 s0.7 s0.7 s
Sensor typeVoltage and currentVoltage and currentVoltageVoltageCurrent
Identification of panel parametersNot necessaryNot necessaryvoltage V m p p Open circuit voltage V c o Short circuit current I c c
Publisher’s Note: MDPI stays neutral with regard to jurisdictional claims in published maps and institutional affiliations.

