Article

Boosting Ant Colony Optimization with Reptile Search Algorithm for Churn Prediction

1
Department of Computer Science, University of Hertfordshire, Hatfield AL10 9AB, UK
2
Department of Computer and Network Engineering, Jazan University, Jazan 82822-6649, Saudi Arabia
3
Department of Information Technology, College of Computer and Information Sciences, Princess Nourah bint Abdulrahman University, P.O. Box 84428, Riyadh 11671, Saudi Arabia
4
Faculty of Science & Engineering, Galala University, Suze 435611, Egypt
5
Artificial Intelligence Research Center (AIRC), College of Engineering and Information Technology, Ajman University, Ajman 346, United Arab Emirates
6
Department of Mathematics, Faculty of Science, Zagazig University, Zagazig 44519, Egypt
*
Author to whom correspondence should be addressed.
Mathematics 2022, 10(7), 1031; https://doi.org/10.3390/math10071031
Submission received: 28 February 2022 / Revised: 14 March 2022 / Accepted: 18 March 2022 / Published: 23 March 2022

Abstract

:
The telecommunications industry is greatly concerned about customer churn due to dissatisfaction with service. This industry has started investing in the development of machine learning (ML) models for churn prediction to extract, examine and visualize their customers’ historical information from a vast amount of big data which will assist to further understand customer needs and take appropriate actions to control customer churn. However, the high-dimensionality of the data has a large influence on the performance of the ML model, so feature selection (FS) has been applied since it is a primary preprocessing step. It improves the ML model’s performance by selecting salient features while reducing the computational time, which can assist this sector in building effective prediction models. This paper proposes a new FS approach ACO-RSA, that combines two metaheuristic algorithms (MAs), namely, ant colony optimization (ACO) and reptile search algorithm (RSA). In the developed ACO-RSA approach, an ACO and RSA are integrated to choose an important subset of features for churn prediction. The ACO-RSA approach is evaluated on seven open-source customer churn prediction datasets, ten CEC 2019 test functions, and its performance is compared to particle swarm optimization (PSO), multi verse optimizer (MVO) and grey wolf optimizer (GWO), standard ACO and standard RSA. According to the results along with statistical analysis, ACO-RSA is an effective and superior approach compared to other competitor algorithms on most datasets.

1. Introduction

The rapid evolution in the telecommunications industry has increased competition among service providers in the market, which has resulted in severe revenue losses because of churning [1]. Churner customers refer to those who leave a service provider and develop a new relationship with another provider in the market. It was confirmed that attracting new customer costs about five to six times the cost of retaining an existing one [2]. For this reason, telecommunications companies employ customer relationship management (CRM) as an integrated approach in their strategic plan to understand their customers’ needs, and ultimately reduce customer churn [3]. The customers’ historical data stored in such CRM systems can be transformed into valuable information with the help of ML. The results from these techniques can assist these companies in formulating new policies, detecting customers who have a high tendency to end their relationship with the company, and developing retention strategies for existing customers [4].
In ML techniques, data preprocessing is vitally essential, and feature selection (FS) is generally considered as a foremost preprocessing step. FS techniques aim to determine the optimum feature subsets (OFS) by removing redundant and irrelevant features from high dimensional data without changing the original data representation. It has been proven that the use of FS in the ML learning process has several benefits [5,6], such as that it reduces the amount of required data to achieve a good learning process and that it improves prediction performance and minimizes CT.
FS techniques have been successfully applied in different applications and delivered promising results. Among these techniques, metaheuristic algorithms (MAs) have shown significant success in several applications, such as vehicle routing [7], energy consumption [8], fuzzy control design [9], e-commerce [10], medical diagnosis [11] and others, mainly because of their capability to provide high-quality OFS [12]. MAs utilize two search principles: exploration, where the algorithm investigates different candidate regions in the search space, and exploitation, the algorithm searches around the obtained promising solutions to improve the existing ones.
According to [13], MAs can be grouped into (i) single solution-based algorithms and (ii) population-based algorithms based on their behaviors. The first group exploits prior search knowledge to expand the search space in some promising environments. Tabu search [14], greedy randomized adaptive search [15], and vector neighborhood search [16] are examples belonging to this group of algorithms. Population-based algorithms generate optimal solutions by exploring a new region in the search space via an iterative process for generating a new population through nature-inspired selection. GWO [17], cuckoo search algorithm [18], PSO [19], firefly algorithm (FFA) [20], crow search algorithm [21], dragonfly optimization algorithm [22], ACO [23], MVO [24], and RSA [25] are examples of the well-known MAs in this group.
In recent years, various researchers explored MAs for customer churn prediction. In [26], the customer churn prediction business intelligence using text analytics with metaheuristic optimization (CCPBI-TAMO) model is reported. The authors used pigeon inspired optimization (PIO) to select OFS from a customer churn dataset collected from a business sector and used that OFS as inputs to long short-term memory (LSTM) with a stacked autoencoder (LSTM-SAE) model. Their proposed model outperformed other existing models used in their work. In [27], FFA was applied on both classification and FS using a huge publicly available dataset of churn prediction and the authors reported that FFA performed well for this application. The potential of ACO to predict customer churn was investigated and discussed in [28]. The results reported that the ACO attained an effective performance compared to other MAs. In [29], combined multiobjective cost-sensitive ACO (MOCS-ACO) with genetic algorithm (GA) to improve classification results. The GA is employed to select OFS while the MOCS-ACO is used as a classification model. Experimental results reported that the combined model performed well when validated on a customer churn prediction dataset obtained from a company in Turkey. In [30], the authors employed ACO to identify OFS and the identified features are then fed to the gradient boosting tree (GBT) model. The results showed that the proposed ACO-GBT model produced good results in predicting customer churn.
In [31], the authors employed PSO to choose OFS and then the selected features were used by an extreme learning machine (ElM) classifier for churn prediction using a public dataset. In [32], the authors employed information gain and fuzzy PSO to determine OFS from two publicly available churn prediction datasets and then the selected features were used by divergence kernel-based support vector machine (DKSVM) to predict churners and nonchurners. In [33], a hybrid model based on PSO and feed-forward neural networks for churn prediction was reported to select OFS from one public dataset and another private dataset. In [34], three variants of PSO were reported for churn prediction using a public dataset. These variants comprise PSO incorporated with FS as a preprocessing step, PSO embedded with simulated annealing (SA), and PSO combined with FS and SA.
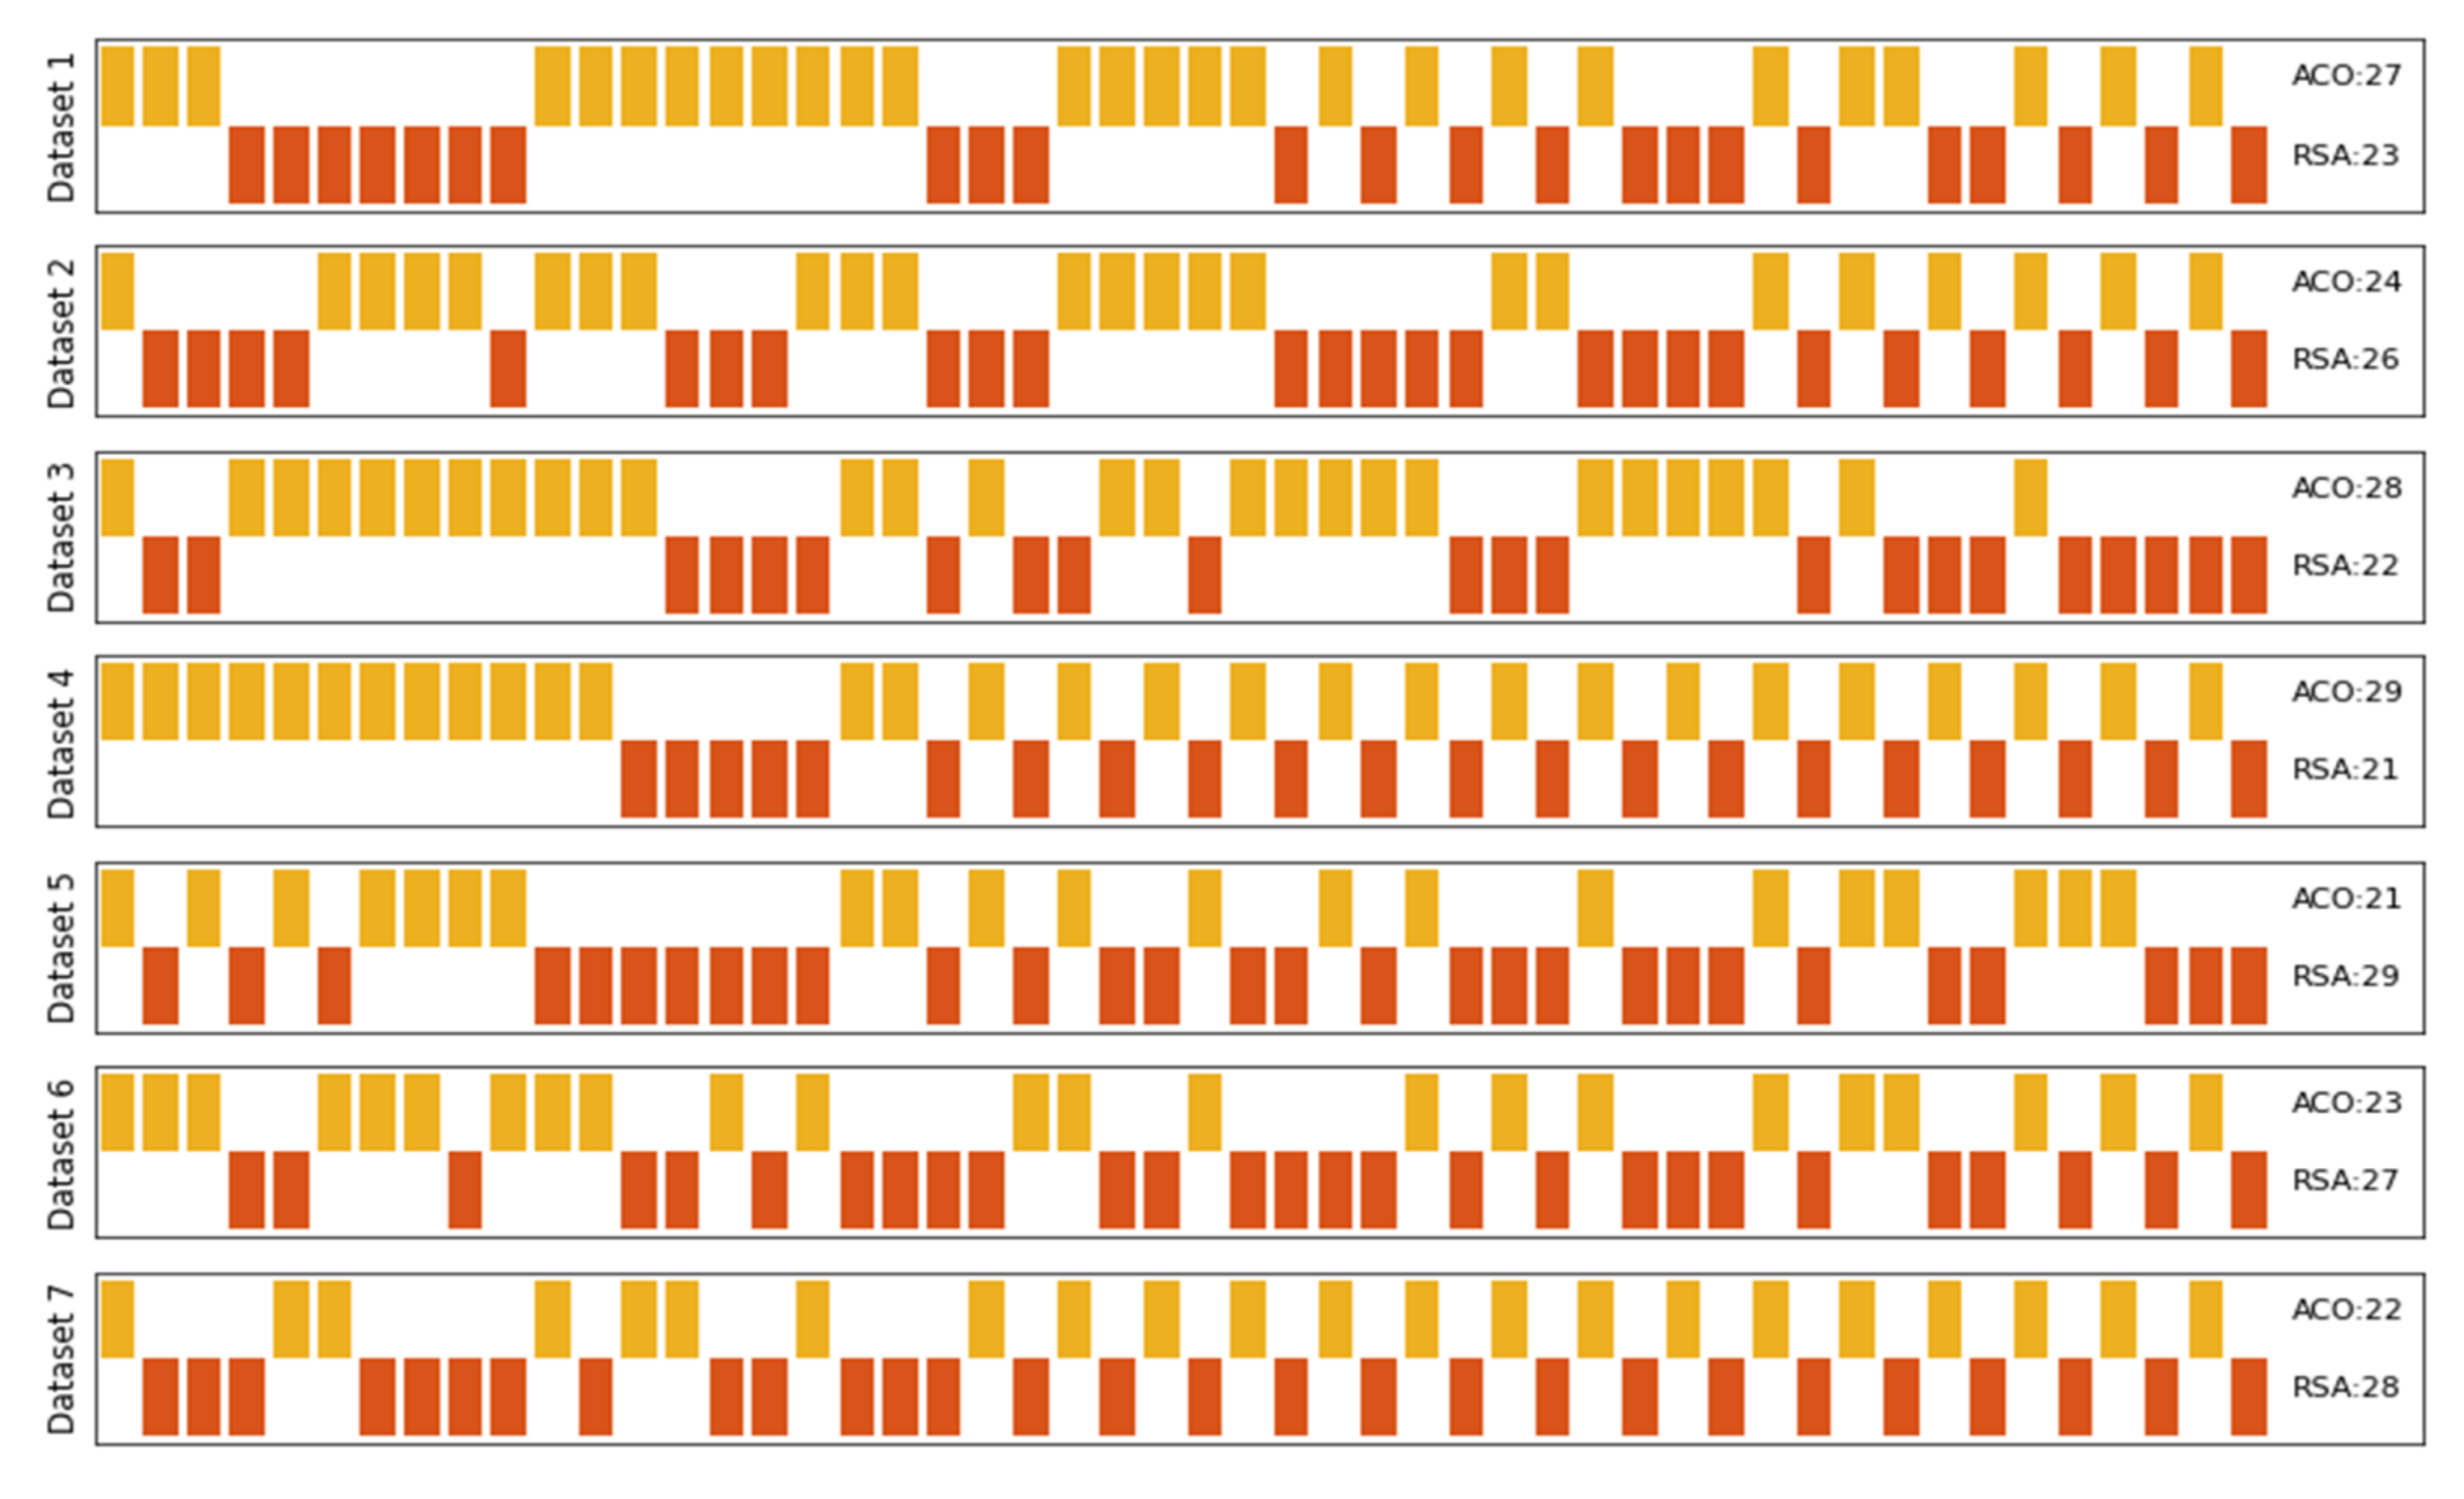
All these studies have reported promising results for using MAs to select the most informative features in churn prediction. Although most of these efforts have used MAs to select OFS, a quantitative analysis of methods’ capabilities in terms of accuracy, number of features in OFS, fitness values, and CT in this application is not reported. Thus, there is an imminent need for further works to propose new MAs for FS in this application. Most of these works are limited to using an individual MA. Therefore, combining Mas to produce a hybrid FS method for this application is worth being investigated, while selecting OFS in this application is very important for reliable and safe predictions to the customers who are going to end the relationship and develop a new one with another competitor. Motivated by these limitations, we propose a new metaheuristic-based approach called ACO-RSA that combines standard ACO and RSA in a serial collaborative manner to find the most appropriate features for churn prediction. The comparison with five popular Mas, including PSO, MVO, GWO, standard ACO, and standard RSA, validates the effectiveness of the ACO-RSA approach. The contributions of this paper can be summarized as follows:
  • A new metaheuristic-based approach, namely ACO-RSA, is proposed for churn prediction, the standard ACO and RSA are combined in a serial collaborative mechanism to achieve exploration-exploitation balance in the proposed ACO-RSA and avoid getting stuck in local optima.
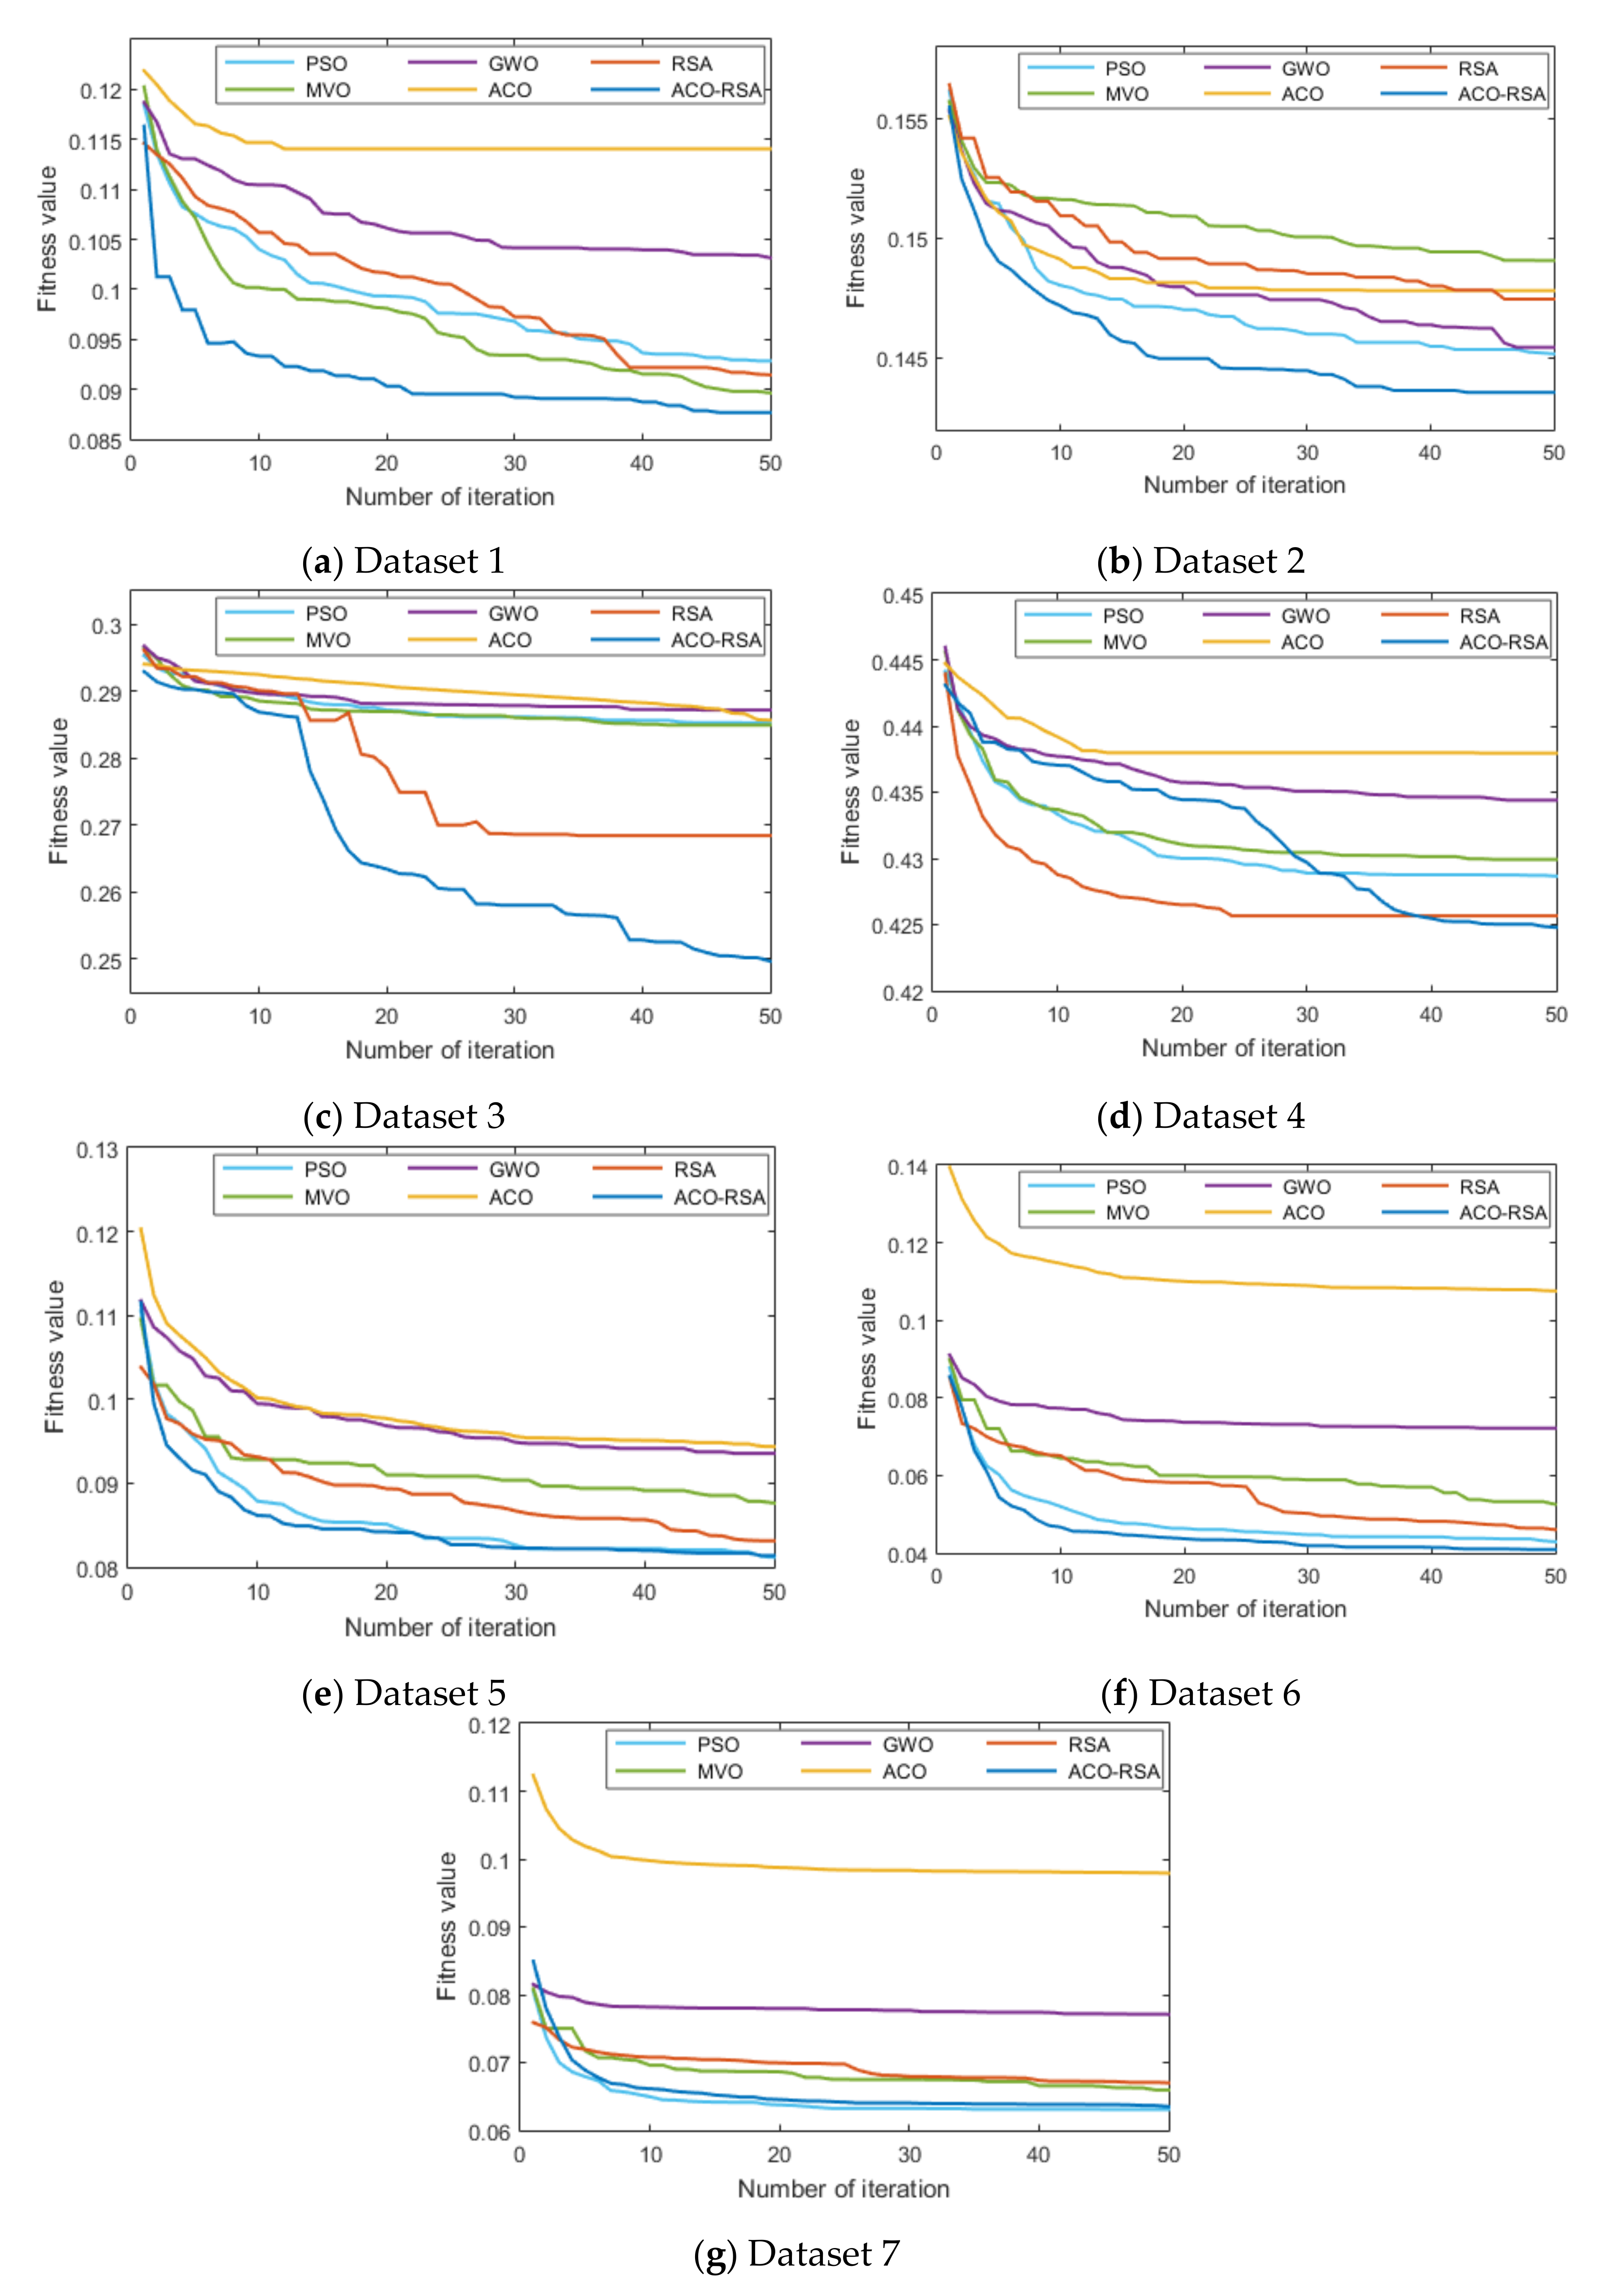
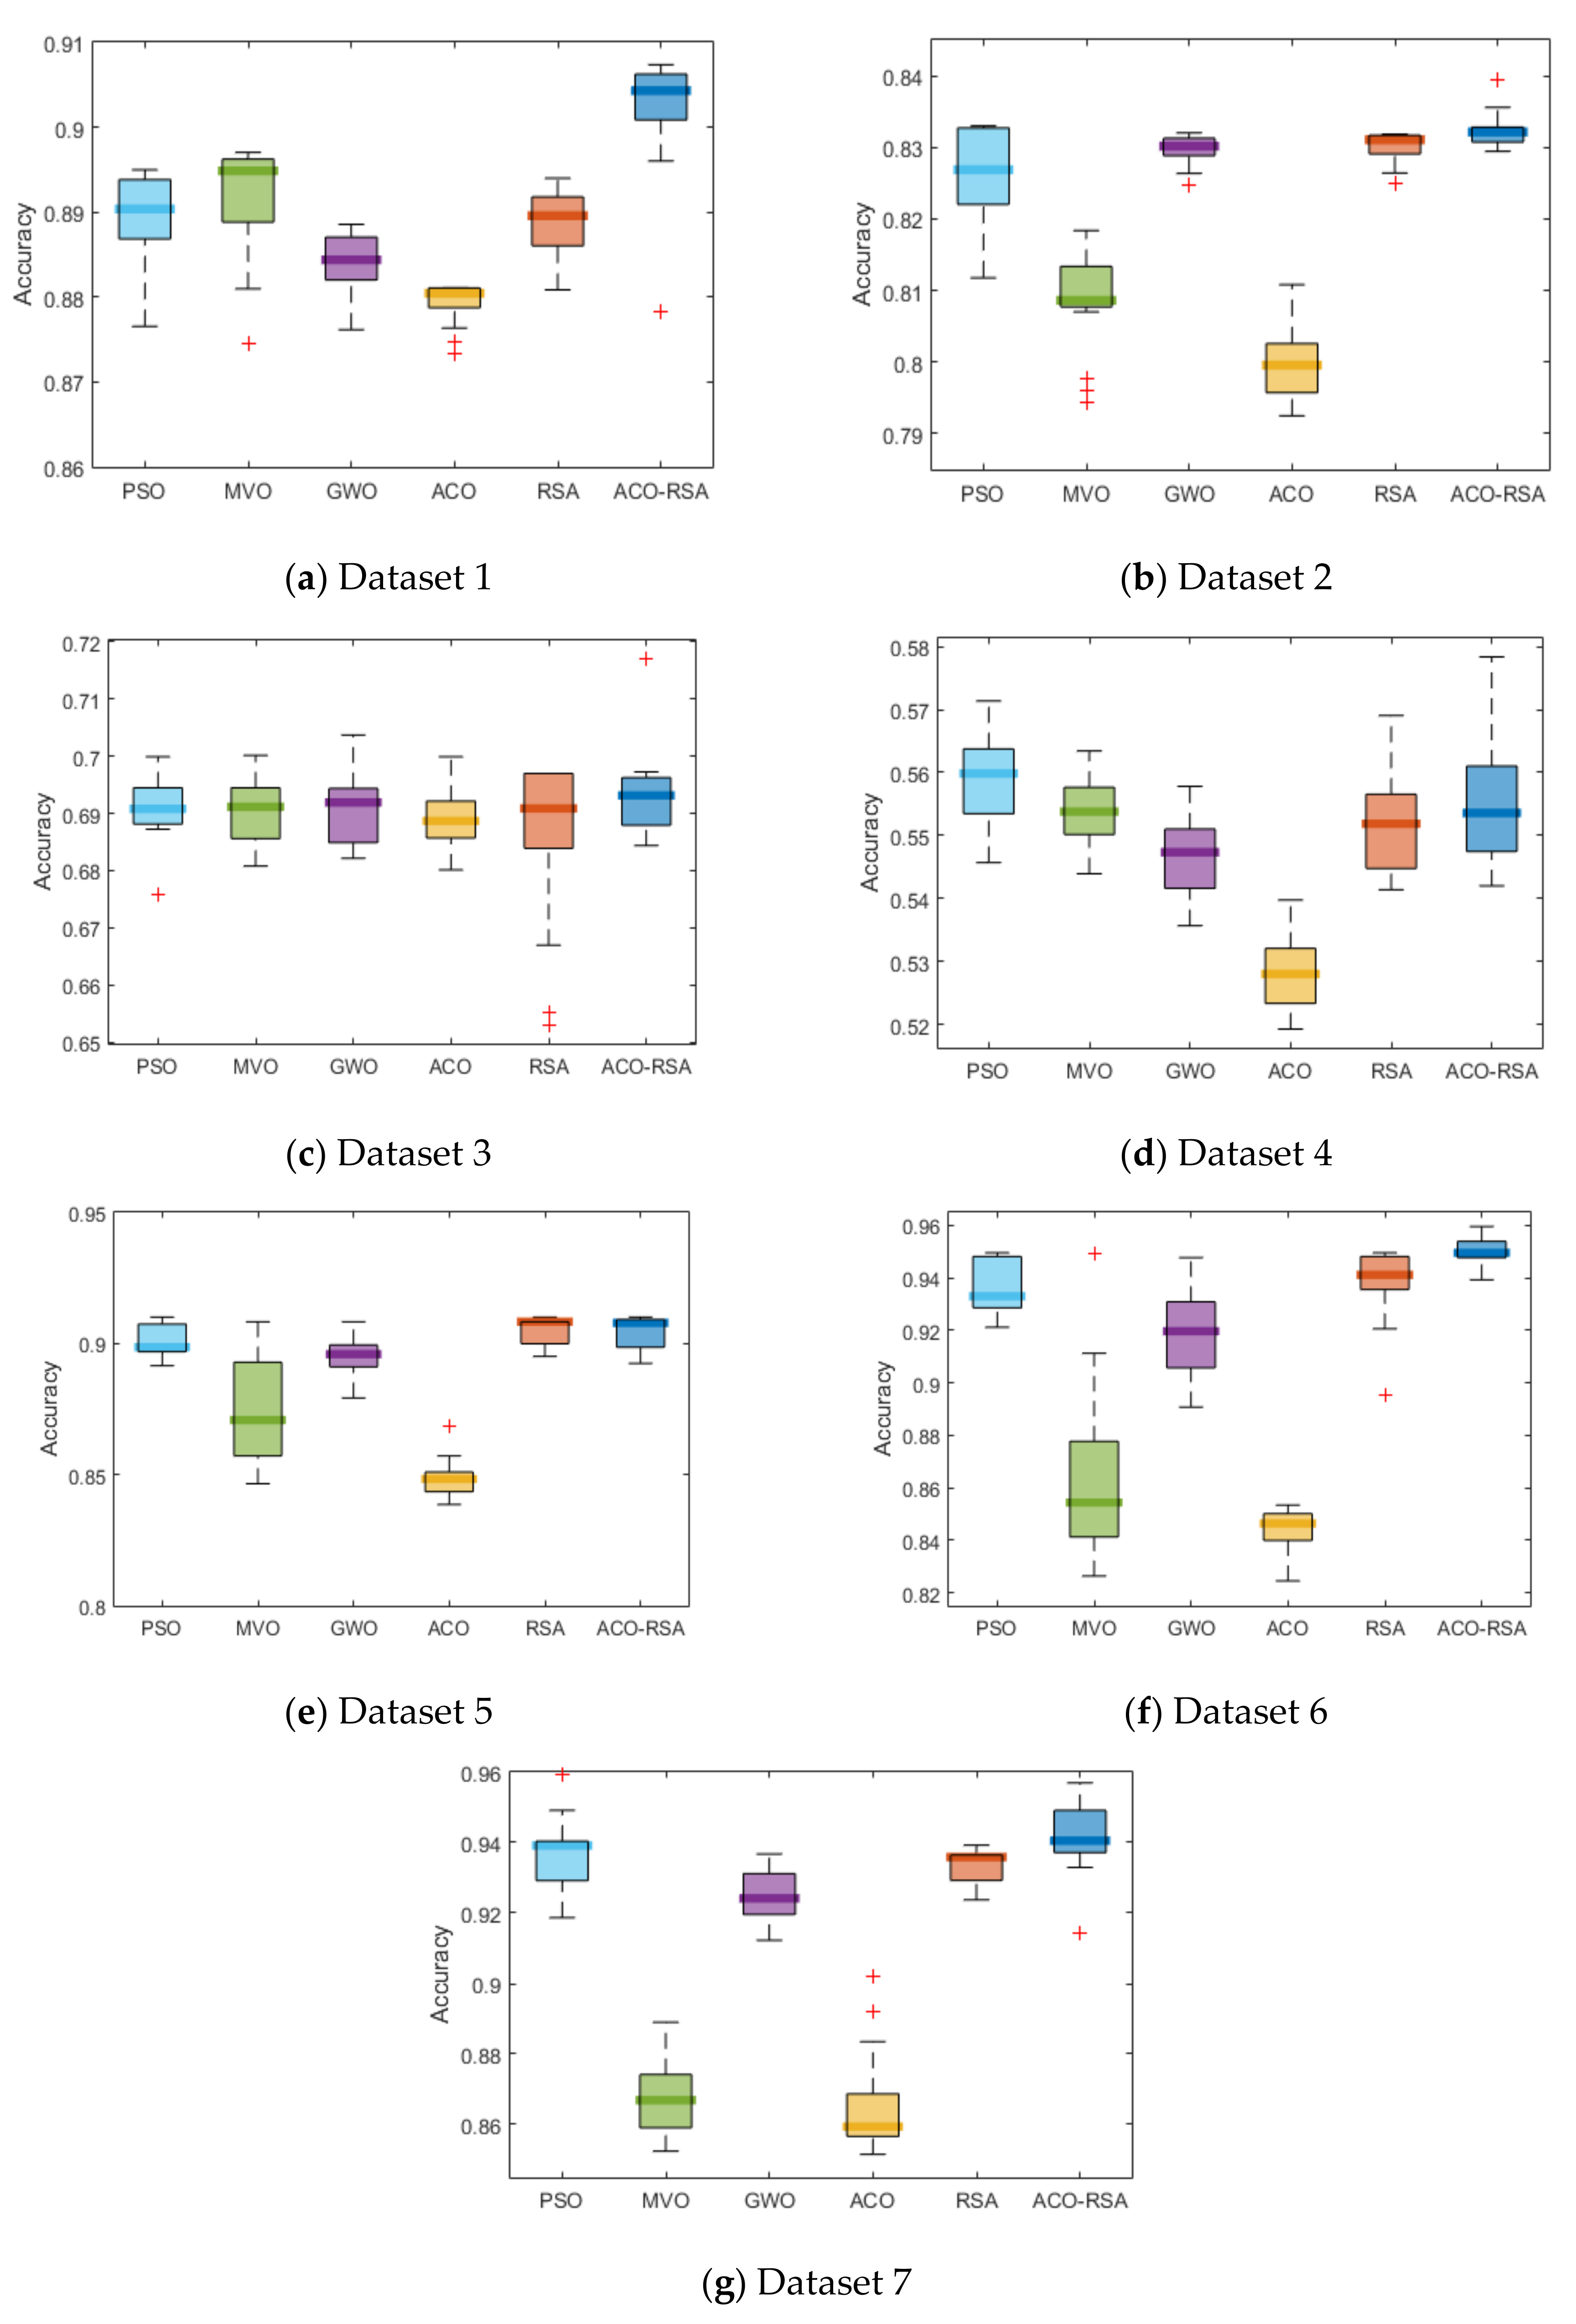
  • Seven publicly available benchmark customer churn datasets with different records and features and ten CEC 2019 test functions are utilized to check the stability of ACO-RSA performance.
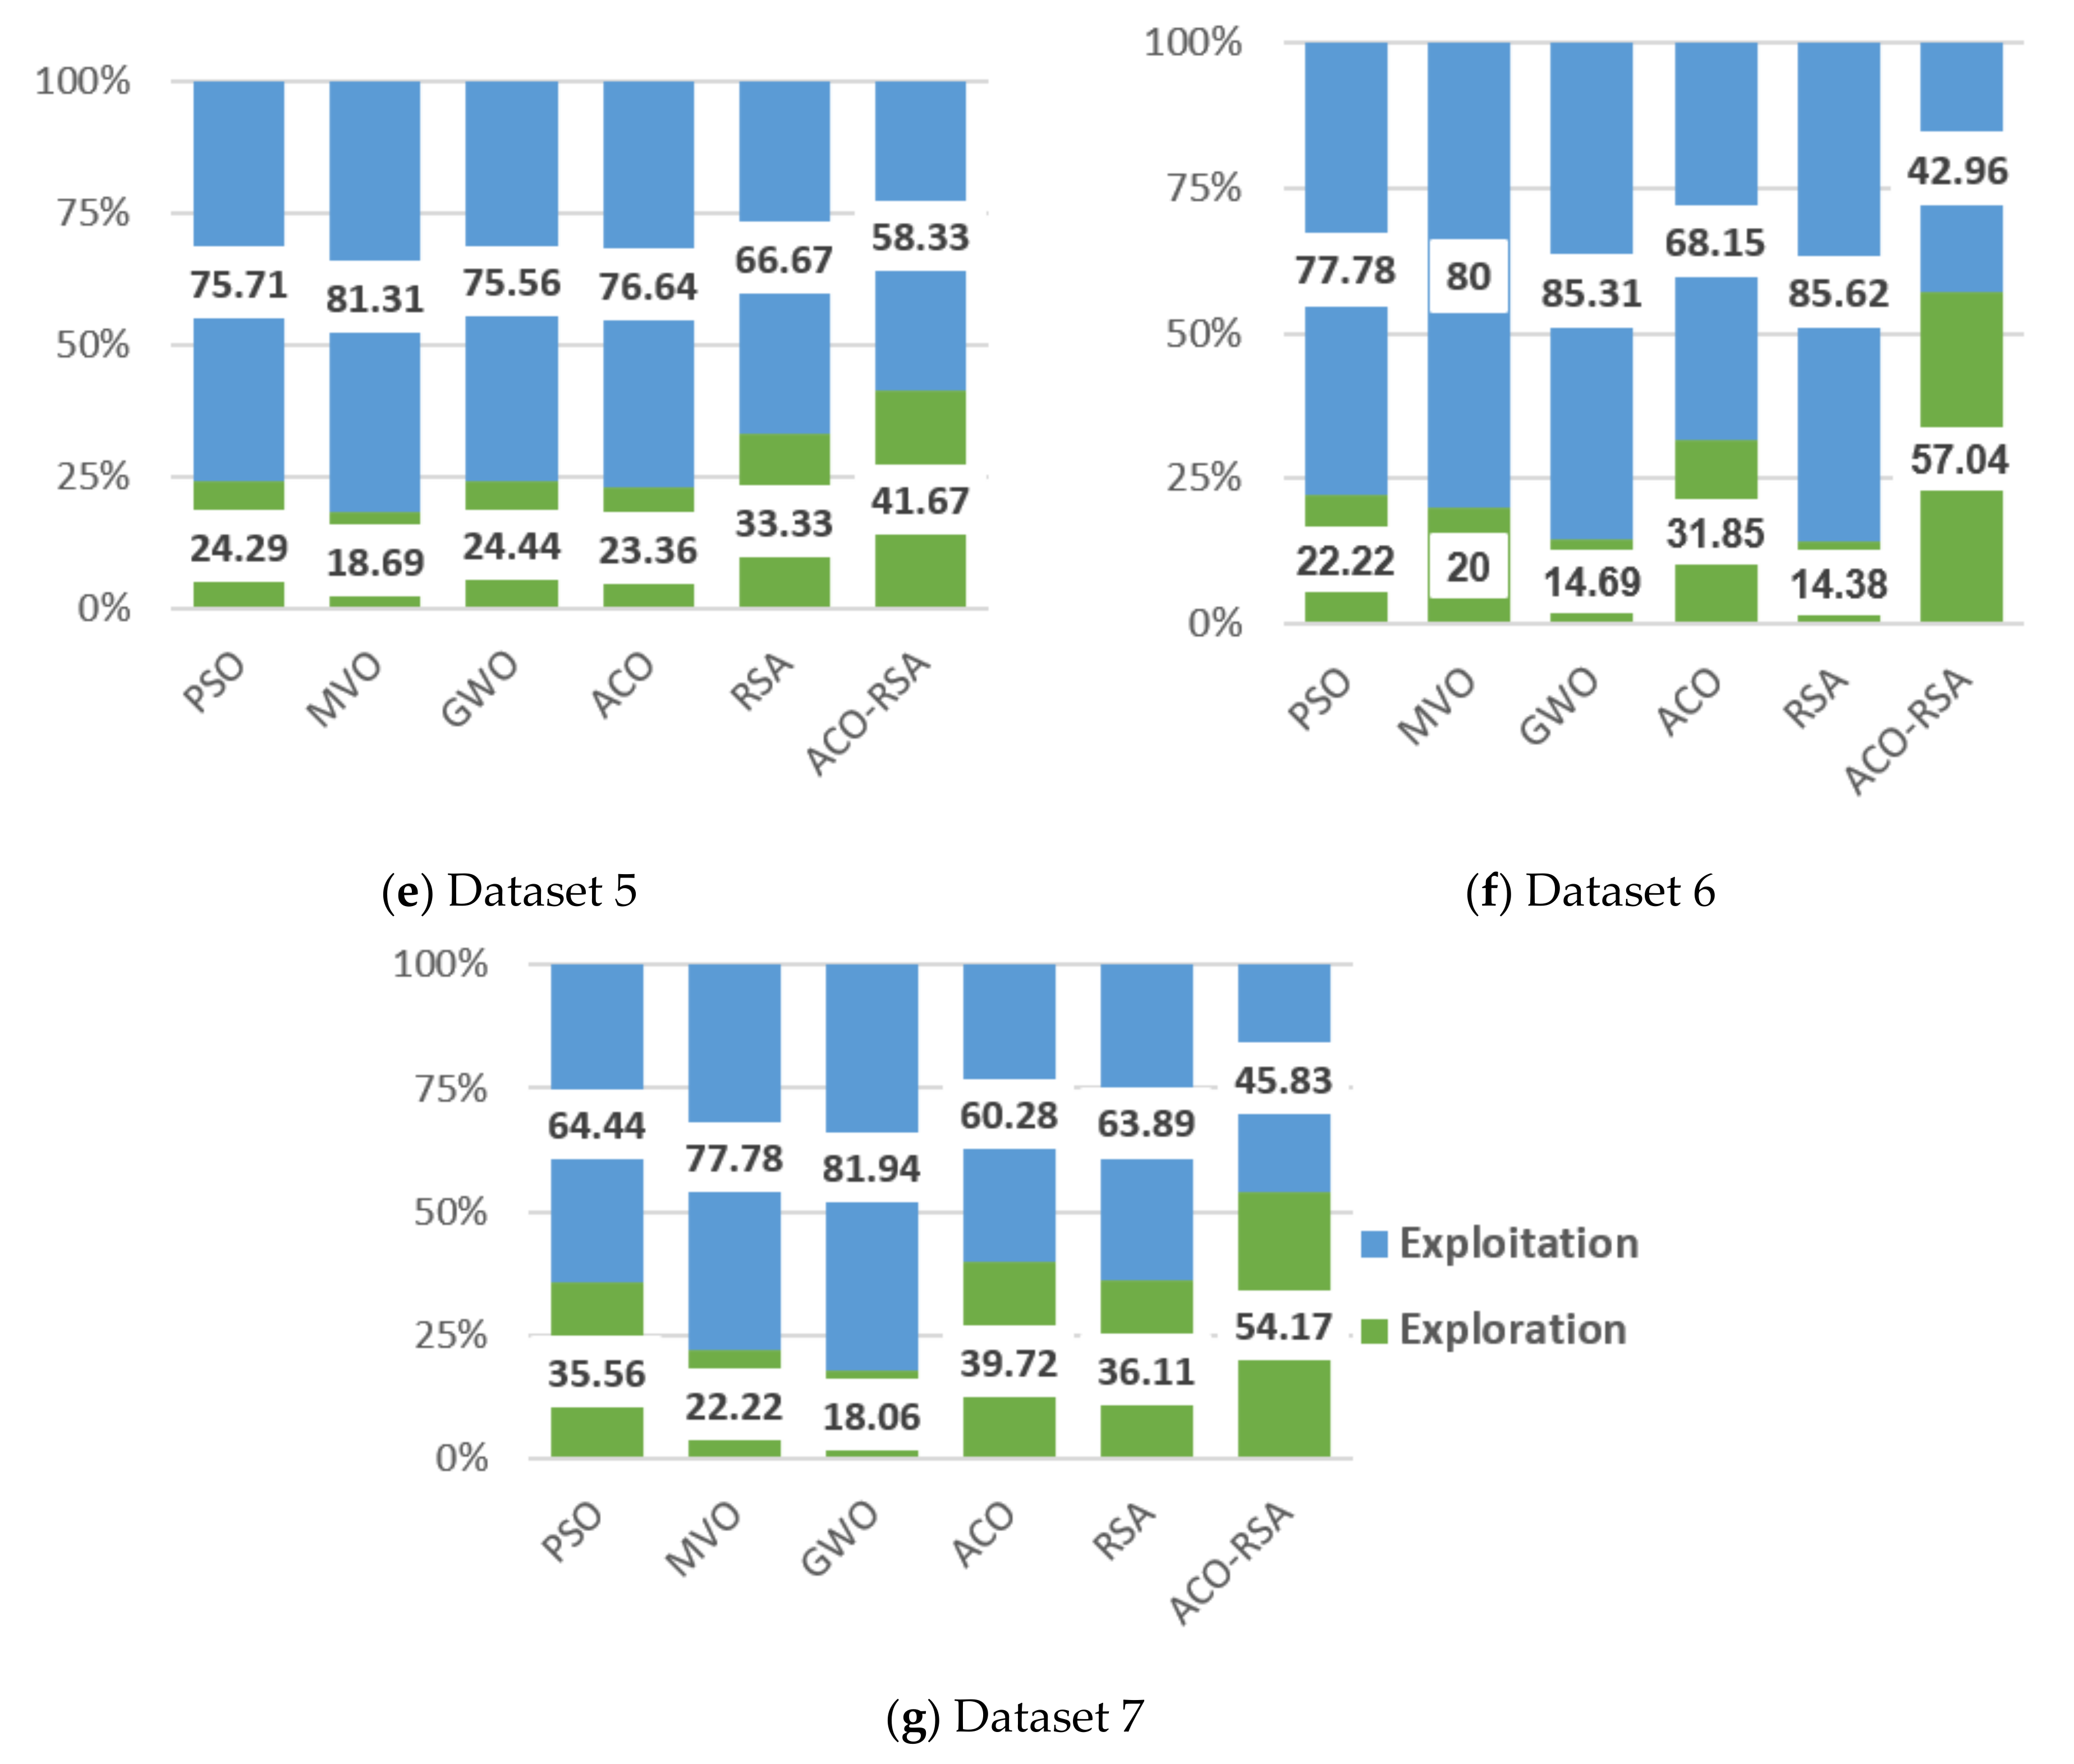
  • We also investigate the convergence behavior, statistical significance, and exploration-exploitation balance of the proposed ACO-RSA against the competitor MAs.
A brief overview of ACO and RSA is provided in the next section, followed by detailed explanations of the suggested ACO-RSA approach. The experimental results are discussed in Section 4. Finally, conclusions are noted in Section 5.

2. Materials and Methods

2.1. Ant Colony Optimization (ACO)

Ant colony optimization (ACO) is a nature-inspired MA that mimics ants’ searching process for food sources [23]. The characteristics of ACO make the model more sensible than other MAs as it supports parallel processing while avoiding the process dependency and it gives feedback on ants’ behaviors in the search space [35]. Ants are not blind when searching for food because they can find the shortest route between their nest and a food source. While moving, ants deposit a chemical material, known as a pheromone, along their trails. The pheromone is a medium for communication among ants and represents the shortest path to collect food. Ants move towards food by sensing the deposition of pheromone by other ants that have previously traveled the path, which subsequently increases the probability of other ants traversing via the same path.
ACO uses two factors: the pheromone trail and heuristic information to make probabilistic decisions. The ants update the pheromone level at any feature as they traverse a path. The more ants traverse a feature, the more pheromone deposition at that feature, resulting in a higher probability of the feature being part of the shortest path. The path with the highest pheromone level will be followed by the maximum number of ants and will be the shortest path. The pheromone value τ 0 = 1 is initialized at all M features, and ants are positioned randomly on a set of features with a predefined maximum number of generations T. At every generation g, the transition probability T P i k g of kth ant at ith feature is shown below [36,37]:
T P i k g = τ i g α η i β j j i k τ j g α η j β i f   j j i k 0 , o t h e r w i s e
where j i k is a set of possible neighbors of ith features that are not visited by the kth ant. The relative importance of pheromone level ( τ i ) and heuristic information ( η j ) for the ants’ movements are specified by non-negative parameters α and β , respectively.
After choosing the next feature in the ant’s path, a fitness function (FF) is employed to quantify the new set of selected features. The movement of kth ant is stopped if the improvement in the fitness value is not attained after adding any new feature. If the stopping criteria is not reached, the amount of pheromone level at next generation (g + 1) at ith feature is updated as [38]:
τ i g + 1 = 1 p τ i g + k = 1 N Δ τ i k g
where,
Δ τ i k g = F F S k g / S k g ) , i f   i S k g 0 , o t h e r w i s e
where p is the pheromone decay rate (0 ≤ p ≤ 1), N is the number of ants, S k g presents number of the selected features, and Δ τ i k represents the pheromone deposited by kth ant if ith feature is in the shortest path of the ant; otherwise, it is 0.
The stopping criteria are achieved when g reaches the predefined maximum T. The set of features with the highest pheromone level and smallest fitness value will be selected as an OFS. Figure 1 shows the overall process of the ACO.

2.2. Reptile Search Algorithm (RSA)

Reptile search algorithm (RSA) is another nature-inspired MA proposed by [25] in 2021 to simulate crocodiles’ encircling and hunting behavior. It is a gradient-free algorithm that starts by generating random solutions as follows:
x i , j = r a n d 0 , 1 × U B j L B j + L B j                 f o r     i 1 , , N   a n d   j 1 , , M
where, x i , j is the ith solution for jth input feature for total N solutions comprising M features, r a n d 0 , 1 is a random number distributed uniformly in the range [0, 1] (0, 1), and the jth feature has upper U B j and lower L B j boundaries.
Like the other nature-inspired MAs, RSA can be understood in two principles: exploration and exploitation. These principles are facilitated by crocodile movement while encircling the target prey. Total iterations of RSA are divided into four stages to take advantage of the natural behavior of crocodiles. In the first two stages, RSA achieves the exploration based on the encircling behavior comprising the high and the belly walking movements. Crocodiles begin their encircling to search the region, facilitating a more exhaustive search of the solution space. This behavior can be mathematically modeled as follows:
x i , j g + 1 = n i , j g   .   γ   . B e s t j g r a n d 1 , N   .   R i , j g , g T 4 E S g   .   B e s t j g   .   x r a n d 1 ,   N , j , g 2 T 4   a n d   g > T 4
where, B e s t j g is the best solution for jth feature, n i , j refers to the hunting operator for the jth feature in the ith solution (calculated as in Equation (6)), parameter γ controls the exploration accuracy throughout the length of iterations and is set as 0.1. The reduce function R i , j is used to reduce the search region and is computed as in Equation (9), r a n d 1 , N is a number between 1 to N used to randomly select one of the possible candidate solution, and evolutionary sense E S g stands for the probability ratio reducing from 2 to −2 over iterations, calculated as in Equation (10).
n i , j = B e s t j g × P i , j
where, P i , j indicates the percentage difference between the jth value of the best solution to its corresponding value in the current solution and is calculated as:
P i , j = θ + x i , j M x i B e s t j g × U B j L B j + ϵ
where θ denotes a sensitive parameter that controls the exploration performance, ϵ is a small floor value, and M x i refers to the average solutions and is defined as:
M x i = 1 n j = 1 n x i , j
R i , j = B e s t j g x r a n d 1 , N , j B e s t j g + ϵ
E S g = 2 × r a n d 1 , 1 × 1 1 T
where the value 2 acts as a multiplier to provide correlation values in the range [0, 2], and r a n d 1 , 1 is a random integer number between (−1, 1).
In the last two stages, RSA implements the exploitation (hunting) to search feature space for optimal solution using two ways: hunting coordination and cooperation. The solution can update its value during the exploitation using the following equation:
x i , j g + 1 = r a n d 1 , 1   .   B e s t j g   . P i , j g , g 3 T 4   a n d   g > 2 T 4 ϵ .   B e s t j g   .   n i , j g r a n d 1 , 1   .   R i , j g , g T   a n d   g > 3 T 4
The quality of candidate solutions at each iteration is measured using the predefined FF and the algorithm stops after T iteration and a candidate solution with least fitness value is selected as OFS. The process of the RSA is shown in Figure 2.

3. Proposed ACO-RSA Based FS Method

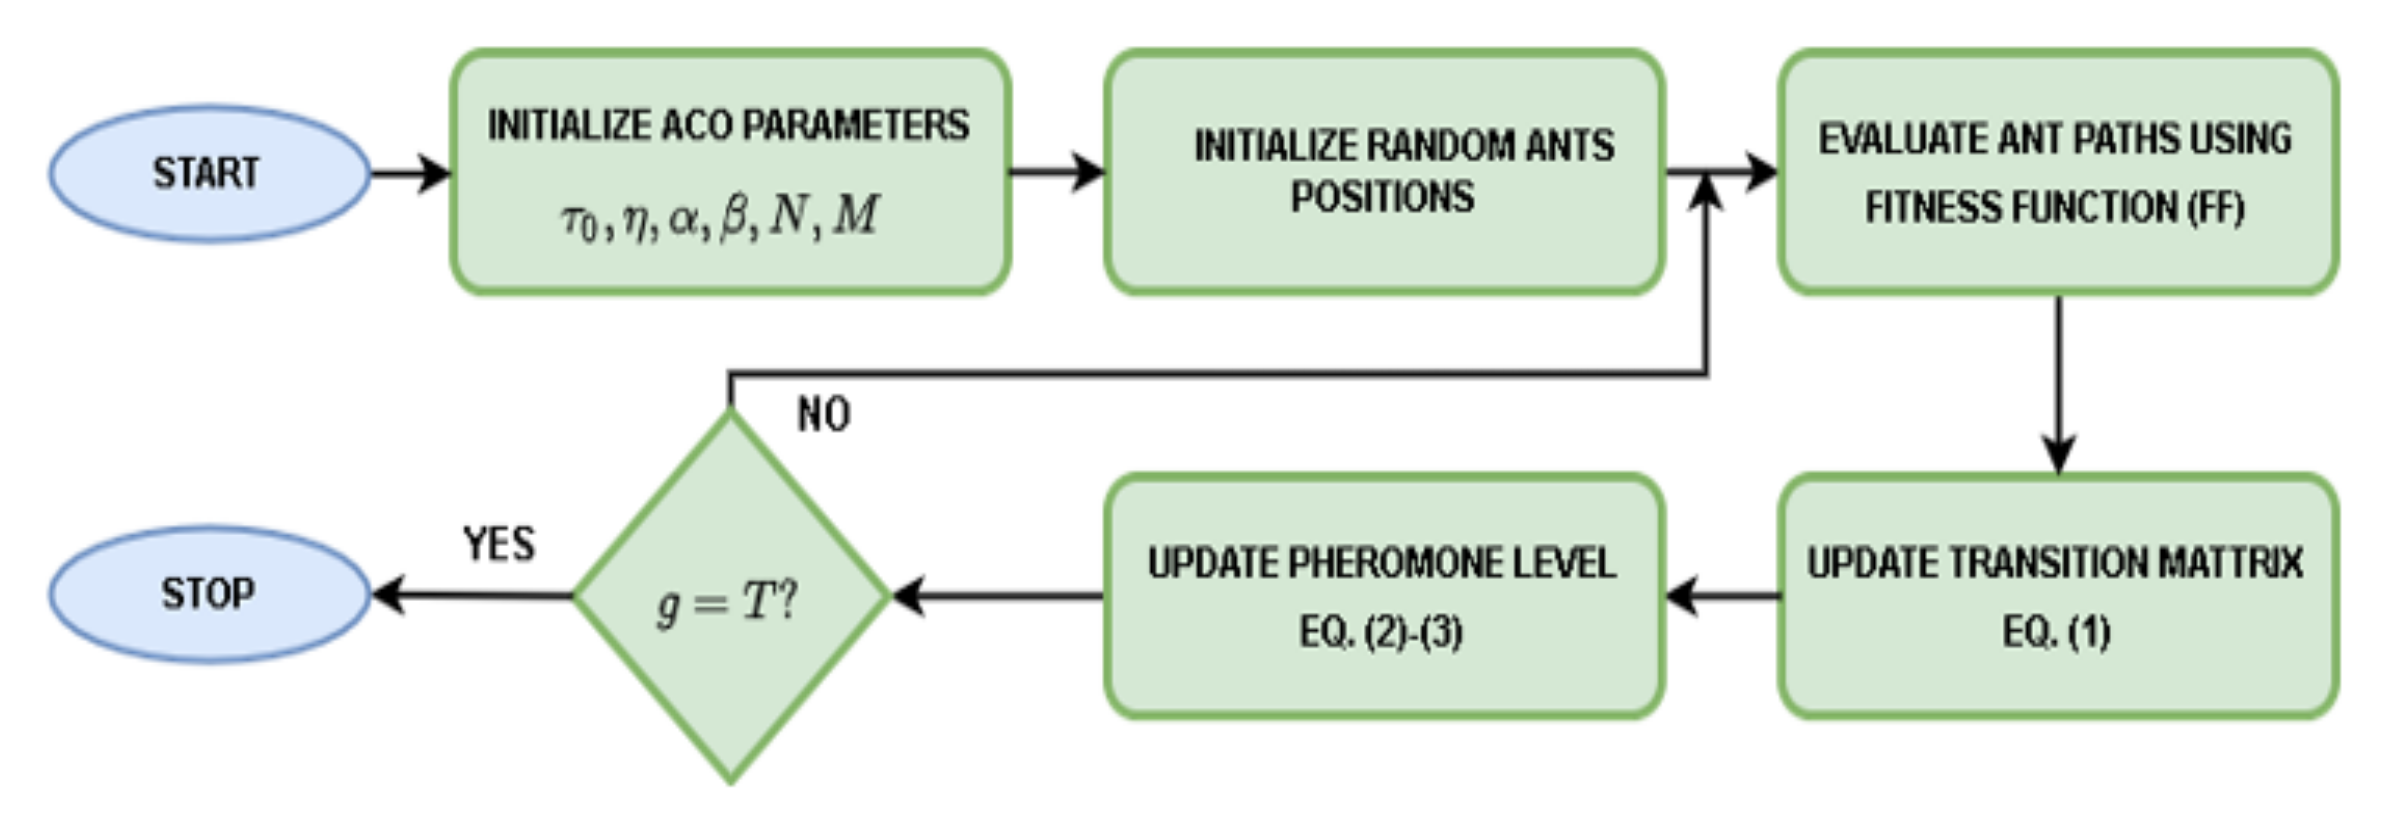
In ACO, a path with the highest pheromone level is the shortest path to transport the food from the source to the nest. Most ants will follow this path unless there is some obstruction and might limit ACO from exploring the quality of existing solutions by searching only within the current search space [38]. High exploration in MA reduces the quality of the optimum solutions, and fast exploitation prevents the algorithm from finding global optimum solutions [39]. RSA is the most recent MA, which shows superiority to solve several engineering problems and has an excellent exploration capability. It has an inbuilt exploration-exploitation balance that significantly enhances its performance [25]. Different MAs can be combined effectively to use the algorithm’s merits while maintaining exploration-exploitation balance and avoiding premature convergence in local optima.
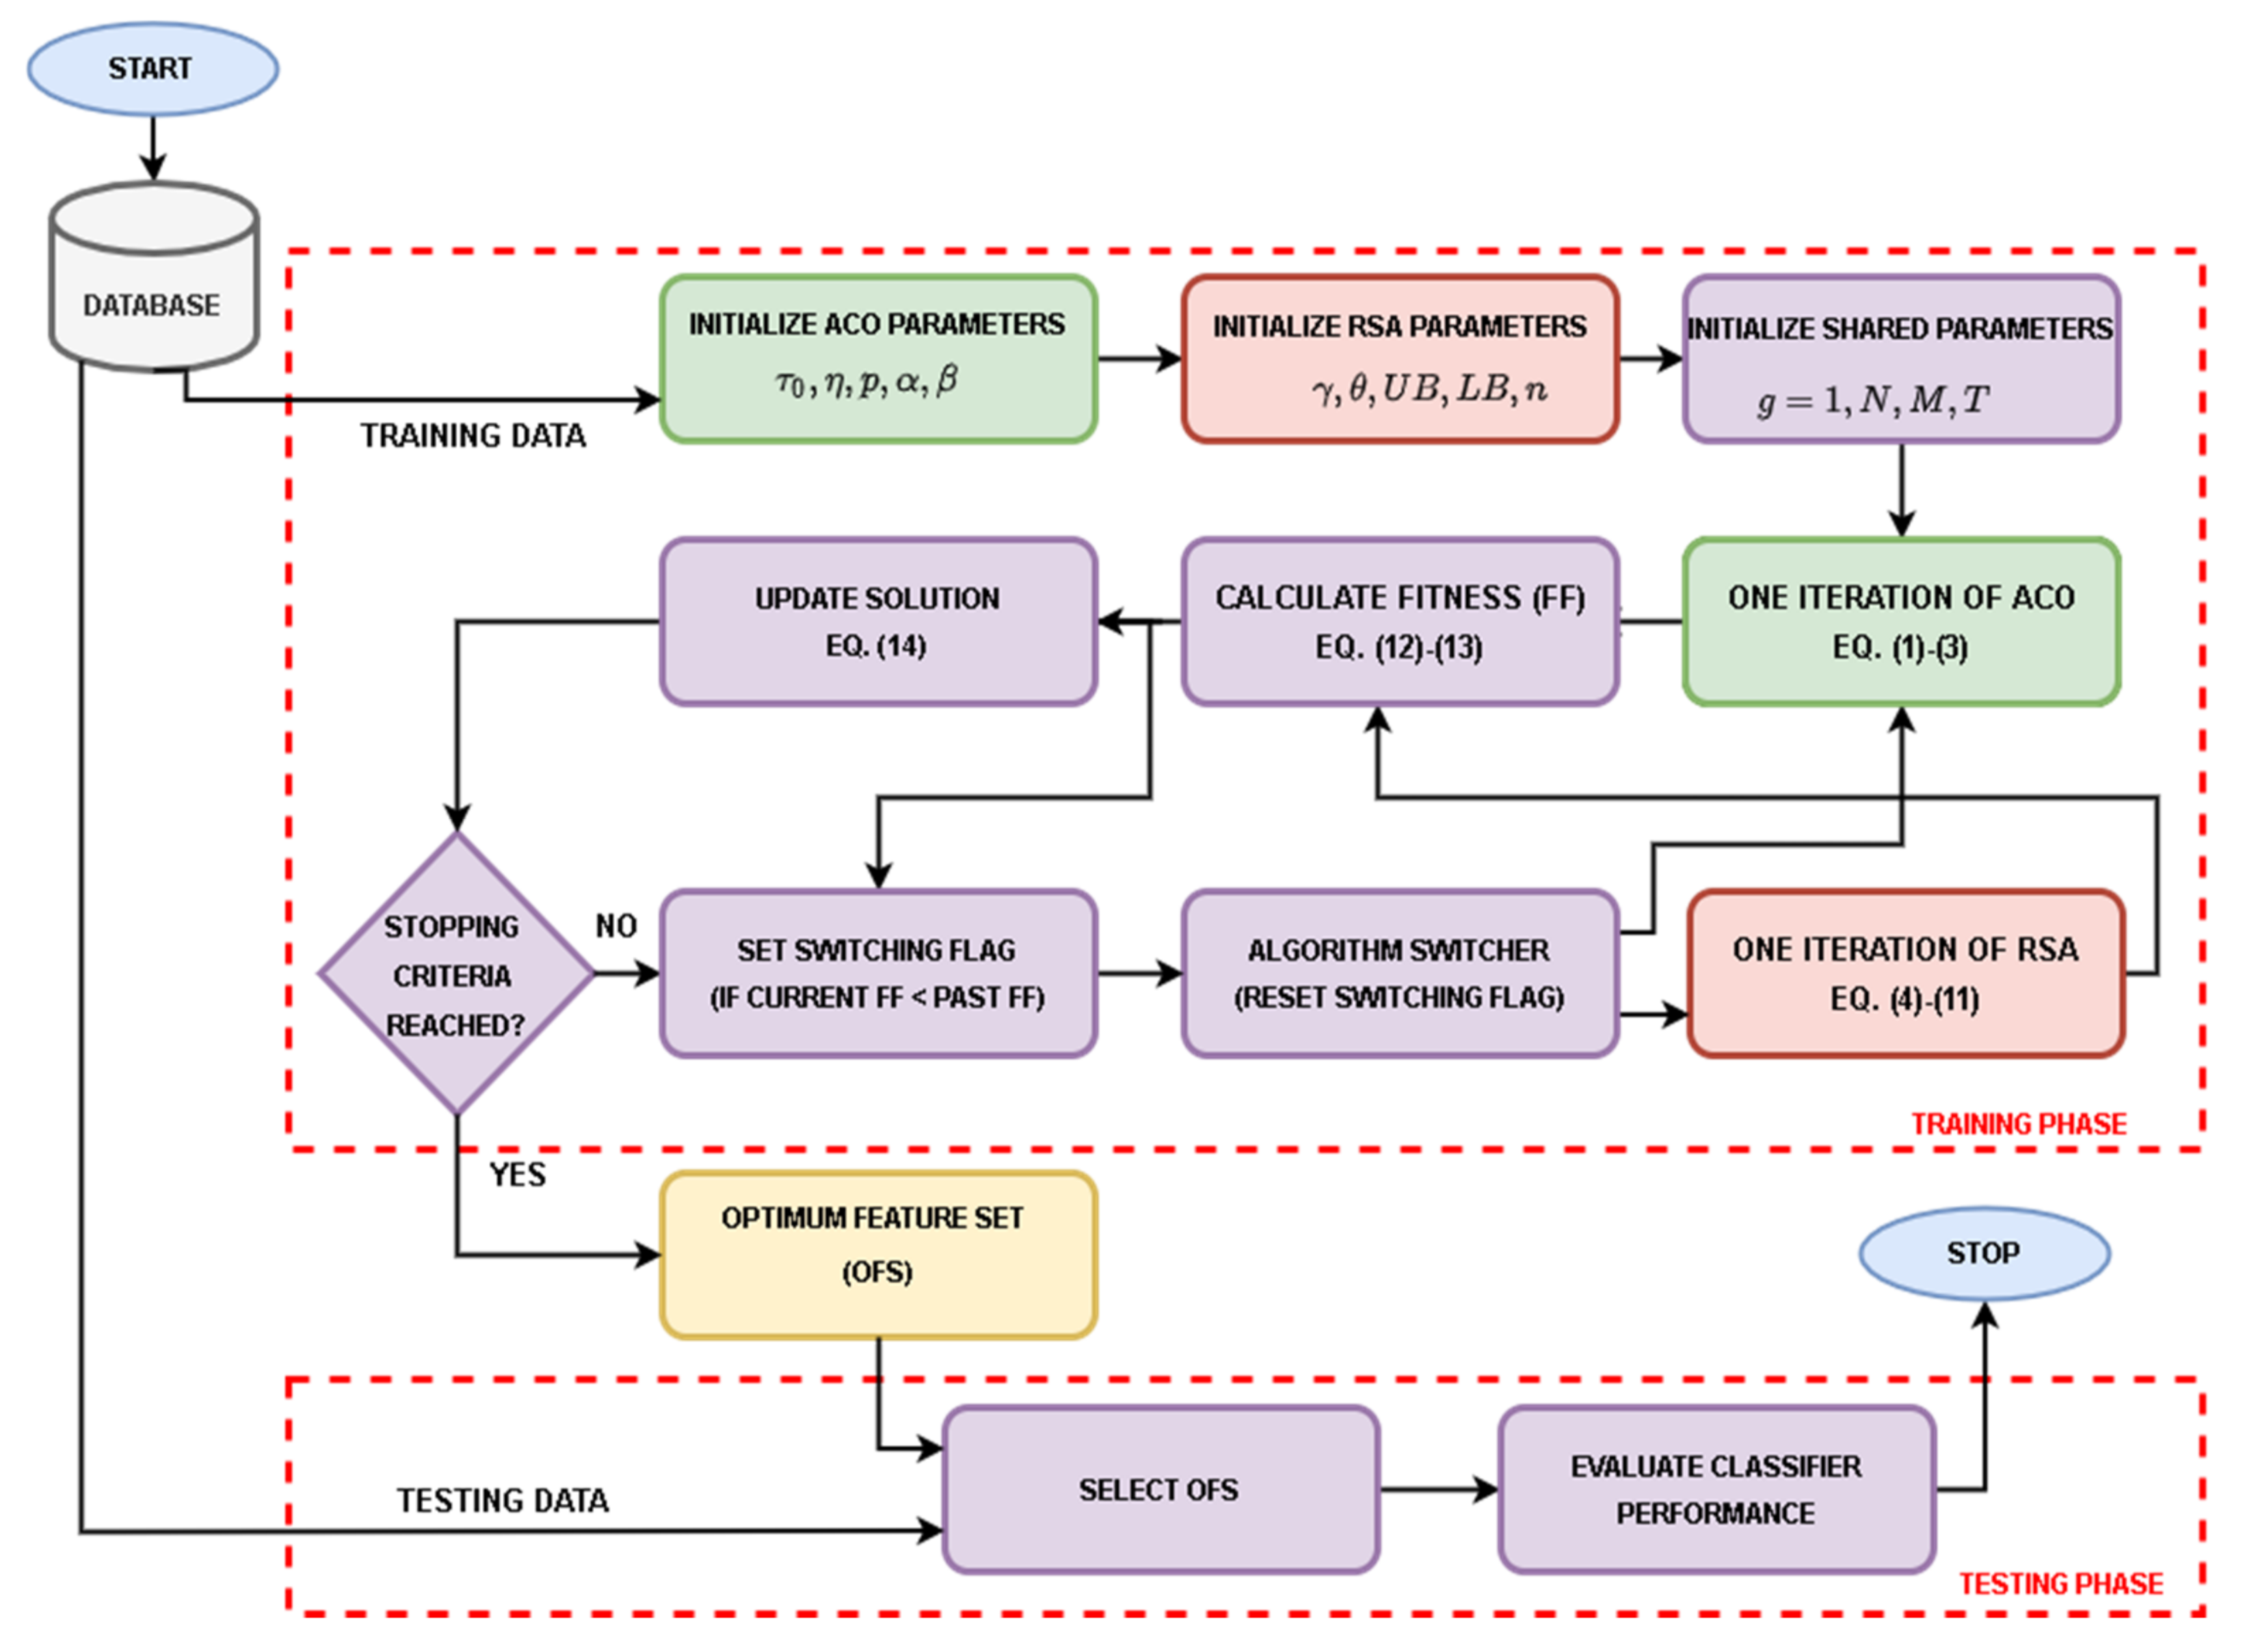
According to [40], there are several ways to hybrid Mas. High-level relay hybrid (HRH) strategy is one of these methods. In this strategy, two MAs can be executed in homogenous (i.e., same algorithms) or heterogeneous (i.e., different algorithms) sequences. The proposed ACO-RSA method uses the heterogeneous HRH strategy to achieve exploitation-exploration balance as in RSA with high exploitation as in ACO. Figure 3 illustrates the overall process of the ACO-RSA approach. At first, ACO, RSA, and shared parameters are initialized. A random number uniformly distributed in the range (−1, 1) initializes N candidate solutions { x i , j X 0   | 1 i N   and   1 j M } each for M-dimensional feature vectors. Then FF evaluates candidate solutions to judge the enhancement by comparing current solutions with the obtained solutions in the previous iteration. If the current solution is better than the previous solution, it will be accepted; otherwise, it will be rejected.
The threshold used to convert candidate solutions during the searching process for the informative features into binary vectors is set to 0.5, as recommended by [39,41], to produce a small number of features. K-nearest neighbor (KNN) is a widely used classifier due to its simplicity, fast, and flexibility to deal with noisy data [42]. KNN with a Euclidean distance measure (k = 5) is employed as the classifier. Hence, the FF is considered to achieve dimensionality reduction (by minimizing the number of the selected OFS) and maximum accuracy (by reducing classification error). Therefore, it is defined using the following equation:
F F = γ × 1 N c N + β × d i M
where, γ and β are weighted factors that vary in the range of (0, 1) (subject to γ + β = 1 ) to balance the number of features in OFS d i out of M features in the original dataset. The parameters γ and β are set to 0.99 and 0.01 respectively [41]. and the is the number of correctly classified instances N c out of total N instances in the original dataset by the KNN classifier. Each feature in the OFS follows:
d i = 1 i f   x i > 0.5 0 o t h e r w i s e
Then the best solution is determined and the current solution X 0 are assigned to the candidate solutions of the ACO. In addition, the ACO starts with assigning each candidate solution x i , j as an initial path for an ant in the colony. An ith ant initially traverses a subset of features initialized with a pheromone value x i , j greater than 0.5 and updates candidate solutions X n e w according to Equations (1)–(3). The FF evaluates the enhancement in the candidate solution, and it is updated only if its fitness value is decreased after the update. A candidate solution is updated according to the following equation:
x i g + 1 = x i n e w g , i f   F F x i g > F F x i g + 1 x i g , e l s e
In the next iteration, the set of candidate solutions X g + 1 are given as initial candidate solutions (after thresholding) to either ACO or RSA to extend the searching process into other promising regions in the feature space. If the least FF value in the current iteration is smaller than the smallest FF value in the previous iteration ( m i n F F x i | x i X g < m i n F F x i | x i X g 1 ), the same algorithm continues in the next iteration; otherwise, an algorithm switching flag is set to switch between the two algorithms. The main goal behind the switching between the two algorithms is that if the ACO could not improve the candidate solutions, it might get stuck in local optima. At this point, the RSA will be employed in the next iteration and will move the candidate solutions into another search region using Equations (4)–(11) to find some better solutions. This process is repeated until the maximum iterations T is reached. A candidate solution with the smallest FF value { m i n ( F F x i   |   x i X T } is used to extract OFS. During the testing phase, a reduced feature set is obtained by filtering only the selected features (i.e., OFS). This OFS is used to evaluate classifier performance metrics, as will be discussed later in Section 4.3. The steps of the ACO-RSA are shown in Algorithm 1.
Algorithm 1: Proposed ACO-RSA approach
1:
Form mutually exclusive and exhaustive training and testing subsets.
Training Phase
2:
Load training dataset
3:
Initialize ACO parameters τ 0 ,   η ,   p ,   α ,   β
4:
Initialize RSA parameters γ ,   θ ,   U B ,   L B ,   n
5:
Initialize shared parameters N ,   M ,   T
6:
for g = 1 to T do
7:
if first iteration
8:
Perform one iteration of ACO using Equations (1)–(3)
9:
else
10:
if switch flag = 1
11:
Perform one iteration of an alternate algorithm that was not executed in the previous iteration
ACO: Equations (1)–(3) or RSA: Equations (4)–(11)
12:
switch flag = 0
13:
else
14:
Continue the same algorithm as in the previous iteration
ACO: Equations (1)–(3) or RSA: Equations (4)–(11)
15:
end if
16:
end if
17:
Evaluate fitness function (FF) using Equation (13) for updated candidate solutions
18:
Update candidate solutions using Equation (12) and a threshold of 0.5
19:
if m i n F F n e w < m i n F F o l d
20:
switch flag = 1
21:
end if
22:
end for
23:
Extract OFS by applying a threshold of 0.5 to a candidate solution with the smallest FF.
Testing Phase
24:
Load testing dataset
25:
Select only optimum features as described in OFS
26:
Evaluate performance using KNN classifier

4. Experiments and Results

This section provides the experiments that are performed to assess the ACO-RSA and compare its performance with PSO, MVO, GWO, standard ACO, and standard RSA for FS on seven datasets.

4.1. Experimental Setup

All the experiments are implemented using Python and they are executed on a 3.13 GHz PC with 16 GB RAM and Windows 10 operating system.
The performance of the proposed ACO-RSA is validated by conducting experiments on publicly available benchmark datasets for customer churn. The characteristics of these datasets are presented in Table 1. It shows the number of classes, the number of features, the number of instances, and the dataset source. Each dataset is divided randomly into the ratio of 50% as a training set and the remaining as a test set.

4.2. Parameter Settings

The ACO-RSA approach is examined with several well-known MAs, and these algorithms include PSO [19], WOA [24], GWO [17], ACO [23], and RSA [25]. Parameter settings play a critical role in enhancing the performance of MAs. For all MAs, the population of 20 and the maximum iterations of 50 are selected empirically. Each algorithm is executed 20 times independently to obtain reliable analysis. In addition, the default parameter settings for each comparative algorithm are defined according to its implementations, and they are presented in Table 2.

4.3. Evaluation Measures

To assess the reliability and performance of the ACO-RSA approach against the other comparative MAs, a set of evaluation measures are used, and they include, accuracy, fitness function, number of selected OFS, and computational time.
  • Average accuracy (AvgACC) calculates the average of the accuracy for all runs. In this paper, the proposed ACO-RSA and the other MAs are executed 20 times ( N r = 20 ):
    A v g A C C = 1 N r k = 1 N r A C C b e s t k
  • Average fitness function (AvgFitF) metric quantifies the performance of the proposed ACO-RSA and the other MAs, which puts the relationship between maximizing classification accuracy and minimizing the number of the selected OFS. Its average is computed by using the following:
    A v g F i t F = 1 N r k = 1 N r F i t F b e s t k
  • Average OFS (Avgofs) represents the average number of the selected OFS to the total number of features in each dataset (D) at run number i:
    A v g o f s = 1 N r k = 1 N r d i D
  • Average computational time (AvgCT) measures the average CPU time in seconds for the proposed ACO-RSA and the other MAs at the run number i:
    A v g C T = 1 N r k = 1 N r C T i

4.4. Results and Analysis

In this subsection, the performance results of ACO-RSA and the comparative MAs are demonstrated not only using the measurements of performance mentioned in the previous Section 4.3, but also based on the convergence behavior, boxplots graphs, statistical analysis and exploration and exploitation effects.

4.4.1. Performance Results

The performance of the ACO-RSA and the other MAs on seven open-source customer churn datasets are given in Table 3, Table 4, Table 5 and Table 6. Each MA is executed 20 times independently to obtain reliable analysis and conclusions. Table 3 compares all the algorithms in terms of the average (Avg) testing accuracy and the number of OFS. Table 4 reports the best and worst fitness values obtained by the ACO-RSA and other MAs, while the Avg and standard deviation (Std) of the fitness values are summarized in Table 5. The average CT in seconds for the ACO-RSA and other MAs on all seven datasets are provided in Table 6.
The testing accuracy varies in the range of 0–1; where, 0 means a total misdetection while 1 means a perfect detection. The number of features in OFS varies from 1 to the total number of features in the respective dataset. A good MA should maximize classification accuracy and minimize the number of selected OFS. In Table 3, the ACO-RSA gained better accuracy than the other MAs on five out of seven datasets. Comparing OFS for each dataset, ACO-RSA required the least number of informative features than the other MAs. This proves the capability of the ACO-RSA in reducing the selected OFS while obtaining a higher accuracy result.
The fitness value is a singular measure that varies from 0 to 1, with a preference for the value closer to 0 (an ideal value that cannot be achieved), indicating better detection with fewer features. In Table 4, the best fitness value for the ACO-RSA arrived at the minimum value in five out of seven datasets, while the worst fitness value for ACO-RSA is the smallest in six datasets. Although RSA scored the smallest fitness value in datasets 2 and 6, the ACO-RSA has better testing accuracy than standard RSA. Similarly, the PSO achieved the smallest worst-case fitness for dataset 7, but Table 3 confirms slightly superior performance of ACO-RSA than the PSO. The ACO-RSA and standard RSA obtained the first and second rank in the best and worst fitness value range, respectively.
Table 5 provides the Avg and Std of the fitness values for all the MAs and datasets over 20 independent runs. A good MA should have a smaller Avg and Std of fitness values to signify the stability and consistency. As shown in Table 4, the ACO-RSA has the smallest Avg fitness value in six out of seven datasets and the smallest Std in five out of seven datasets. The PSO and MVO have the least Avg and Std for datasets 5 and 7, respectively. In Table 5, it can be observed that ACO-RSA approach is more stable than the other comparative algorithms which has the smallest Std in five out of seven datasets. Although the Std values of the PSO and the standard RSA are smaller than those corresponding to ACO-RSA for datasets 3 and 4, the Avg fitness values of ACO-RSA are slightly smaller in both cases.
The number of features in each dataset and its size (i.e., samples) affecting the CT. For instance, a greater number of features and size as in the case of datasets 3, 4, and 7, the algorithms take more CT to find OFS. Table 6 provides the Avg results in terms of the CT. As per Table 6, the standard RSA gets the smallest CT, followed by the ACO-RSA, to finish the job compared to other MAs. It can be observed that for small datasets, the difference in CT between the standard RSA and the proposed ACO-RSA is not significant, while the CT increases to a significant value for large datasets. It should be noted that CT is essential only during the training phase for practical applications and is independent for the FS algorithm in the testing phase. Hence, ACO-RSA would still be suitable for most real-time implementations of the application of churn prediction.
Figure 4 presents the switching behavior of the proposed ACO-RSA during 50 exploitation-exploration iterations for all the seven datasets. The total number of iterations for the ACO and RSA are displayed in each switching behaviors in the last column in Figure 4. In datasets 3 and 4, ACO uses slightly more iterations than RSA to exploit many features. The iterative design of ACO requires more than one iteration to build confidence in the estimated shortest path. Hence, Table 6 shows a significantly higher CT for these datasets. On the other hand, datasets 1, 2, 5, and 6 have comparatively fewer features, and therefore, more iterations are used by the RSA, resulting in a very close CT to the one obtained using the proposed ACO-RSA. For dataset 7, a very higher number of training examples causes a larger delay for each iteration of ACO. This results in a significant impact on the CT of the proposed ACO-RSA than the fastest RSA algorithm.

4.4.2. Convergence Behavior

Figure 5 demonstrates convergence behavior of the ACO-RSA and the other comparative MAs for all datasets over the defined number of iterations on the x-axis and the fitness values on the y-axis. It presents the average convergence behavior obtained by executing each algorithm 20 times. In these convergence curves, the method with the rapid convergence is the best one.
Although the standard RSA converges faster than ACO-RSA in dataset 4, the final fitness value of the ACO-RSA is slightly smaller than the RSA. It is clearly observed in Figure 5 that ACO-RSA shows a faster convergence rate and finds OFS in the least iterations for datasets 1, 2, 3, 5, and 6. This proves that the proposed ACO-RSA is suitable for churn prediction compared to others comparative methods.

4.4.3. Boxplots Graphs

Figure 6 demonstrates the boxplots which is used to visualize the distribution of classification accuracy for the ACO-RSA and the comparative MAs. In this figure, the x-axis represents the MAs and the y-axis represents the average accuracy.
In the boxplots, a small degree of dispersion (the gap between the best, the median, and the worse) refers to the algorithm’s robustness that achieves the same results in the experiment. It can be seen from Figure 6 that the ACO-RSA is more robust than the other comparative MAs on most the datasets. This indicates the efficacy and robustness of the ACO-RSA approach compared to the PSO, MVO, GWO, standard ACO, and standard RSA methods.

4.4.4. Statistical Analysis

To show the significance results of the ACO-RSA, Friedman test is performed, which is a widely used nonparametric two-way analysis of variances by ranks [44], on seven datasets for 20 independent runs. In this test, the null hypothesis H 0 affirms the equal behavior of the comparative methods, while the alternative hypothesis H 1 indicates the difference in behaviors of the comparative methods. In the Friedman test, the higher (lower) rank refers to the best measure algorithm assuming the larger (smaller) value is preferred. In the current scenario, H 0 points out that all the MAs have the same behaviors, while H 1 points out that there is a significant difference in the MAs behaviors.
Table 7 provides the Avg ranking for each algorithm in terms of accuracy, the number of features in OFS, and fitness value. The significance level (α = 0.05) is employed to reveal the statistically reliable results. The highest p-value calculated using Friedman’s test for all seven datasets is 0.0026, which is less than α. The lower the p-value, the greater the statistically significant difference, and therefore, the results are statistically significant. For the classification accuracy metric, the higher value is better, indicating that the method with the highest rank has better performance, while for the OFS and fitness value metrics, the method with the lower rank is preferred. In Table 6, the proposed ACO-RSA gained the best results of accuracy, OFS, and fitness value metrics than the results produced by the PSO, MVO, GWO, standard ACO, and standard RSA in five out of seven datasets. However, in the case of OFS, the RSA achieved slightly better results than the proposed ACO-RSA for datasets 5 and 7.
Holm’s procedure is used as a post hoc method to statistically confirm the differences in the behavior between the controlled algorithm and the other methods. In Holm’s test, p-values are adjusted to control the probability of false positives. The controlled and alternate hypotheses are evaluated using pairwise comparison of p-values. The alternate hypothesis is rejected if the adjusted p-value is smaller than the original p-value. A hypothesis is rejected if there is a significant difference between the controlled method and comparative methods; otherwise, it is not rejected.
In the current work, ACO-RSA is employed as the controlled algorithm. The results of Holm’s procedure in terms of fitness values for the controlled method and other comparative algorithms are given in Table 8. Based on Table 8, there is a significant difference between the controlled method and other MAs in most cases. However, the controlled method shows no significant results than the standard ACO and standard RSA in dataset 3 and the MVO in dataset 5. The overall performance results of the ACO-RSA approach are significantly different from the rest of MAs. These results prove the superiority of the ACO-RSA approach as a FS method for customer churn prediction.

4.4.5. Exploration and Exploitation Effects

As mentioned earlier, exploration and exploitation are the two main principles in any search algorithm. These phases are obtained using the dimension-wise diversity measurement presented in [45]. In this approach, the exploration can be measured during the search process by the increased mean value of distance within dimensions of the population and exploitation phase by the reduced mean value, where search agents are in a concentrated region.
Figure 7 provides exploration-exploitation ratios during the searching process for all MAs on each dataset for 50 iterations. From the bar charts in Figure 7, ACO-RSA maintains better balance between exploration and exploitation for all the seven datasets. Although PSO balanced exploration-exploitation for the first four datasets, it fails to maintain the balance (has high exploitation) for the remaining three datasets. Most other algorithms have shown high exploitation which can either be confirmed through the literature or by analyzing the algorithm design. In standard ACO, ants travel the path iteratively to bring out the best solution, representing higher exploitation than exploration. Standard RSA achieved this balance by splitting the total iteration into four stages, but it failed for four out of seven datasets.

4.4.6. CEC 2019 Test Functions

To show the capability of the ACO-RSA compared to standard ACO and standard RSA, ten standard well-known test functions from CEC 2019 test functions with dimension 50 and search range as in the work of [25], which have been widely used in recent years, are chosen. Table 9 provides a summary of these functions.
To achieve the simulation criteria, i.e., the Avg and Std values, the algorithm for each function of CEC 2019 has been performed by each algorithm 20 independent runs and the results are given in Table 10.
It can be observed that ACO-RSA achieved better performance in three out of ten functions than standard ACO and standard RSA. For functions F1, F2, F4 and F9 both ACO-RSA and RSA achieved the best Avg and Std results. For functions F5 and F8, ACO and RSA reported the best average performance, respectively.

5. Conclusions and Future Work

In the telecommunication sector, churn prediction models are broadly employed to analyze and discover patterns in massive data using ML, so that past customers’ behavior can be used to predict the ones likely to join other operators. FS is a typical preprocessing problem in ML, concerning discrimination of salient and redundant features from each dataset’s complete set of features. This paper presented a new FS approach by combing the standard ACO and standard RSA for customer churn prediction. The combined method, ACO-RSA, utilized a serial mechanism to balance exploration and exploitation while avoiding traps in local optima. The efficiency of the proposed ACO-RSA is evaluated using seven public benchmark datasets form churn prediction application and ten CEC 2019 test functions. The reliability and performance of the ACO-RSA are compared with the standard ACO, the standard RSA and three other MAs: PSO, MVO, and GWO. The results showed that the ACO-RSA approach has higher accuracy with the minimum number of features over the other comparative methods. Statistical analysis also confirmed the superiority of the ACO-RSA in terms of various measures. Therefore, the proposed ACO-RSA provides high reliability FS approach for the application of churn prediction. The main limitation of the proposed approach is the slightly high CT requirement during the training phase to specify the best combination of the tested element. We will apply the standard ACO and standard RSA in a parallel manner to reduce the CT in the training phase. In future, we would like to apply ACO-RSA approach to various classification, regression, or clustering applications in renewal energy, internet of things and signal processing.

Author Contributions

Conceptualization, I.A.-S., S.A. and M.A.E.; methodology, I.A.-S.; software, I.A.-S.; validation, I.A.-S., N.H. and Y.S.; formal analysis, I.A.-S., N.H., Y.S. and M.A.E.; resources, I.A.-S.; writing—original draft preparation, I.A.-S.; writing—review and editing, I.A.-S., N.H., Y.S., S.A. and M.A.E.; supervision, N.H., Y.S. and M.A.E.; funding acquisition, S.A.; Y.S. All authors have read and agreed to the published version of the manuscript.

Funding

Princess Nourah bint Abdulrahman Researchers Supporting Project number (PNURSP2022R197), Princess Nourah bint Abdulrahman University, Riyadh, Saudi Arabia.

Acknowledgments

Princess Nourah bint Abdulrahman Researchers Supporting Project number (PNURSP2022R197), Princess Nourah bint Abdulrahman University, Riyadh, Saudi Arabia.

Conflicts of Interest

All authors declare that they have no conflict of interest.

References

  1. Li, Y.; Hou, B.; Wu, Y.; Zhao, D.; Xie, A.; Zou, P. Giant fight: Customer churn prediction in traditional broadcast industry. J. Bus. Res. 2021, 131, 630–639. [Google Scholar] [CrossRef]
  2. Kim, S.; Chang, Y.; Wong, S.F.; Park, M.C. Customer resistance to churn in a mature mobile telecommunications market. Int. J. Mob. Commun. 2020, 18, 41–66. [Google Scholar] [CrossRef]
  3. Ascarza, E.; Hardie, B.G. A joint model of usage and churn in contractual settings. Mark. Sci. 2013, 32, 570–590. [Google Scholar] [CrossRef]
  4. Ascarza, E.; Iyengar, R.; Schleicher, M. The perils of proactive churn prevention using plan recommendations: Evidence from a field experiment. J. Mark. Res. 2016, 53, 46–60. [Google Scholar] [CrossRef] [Green Version]
  5. Hassani, Z.; Hajihashemi, V.; Borna, K.; Sahraei, D.I. A Classification Method for E-mail Spam Using a Hybrid Approach for Feature Selection Optimization. J. Sci. Islamic Repub. Iran 2020, 31, 165–173. [Google Scholar]
  6. Manochandar, S.; Punniyamoorthy, M. Scaling feature selection method for enhancing the classification performance of Support Vector Machines in text mining. Comput. Ind. Eng. 2018, 124, 139–156. [Google Scholar] [CrossRef]
  7. Rajput, U.; Kumari, M. Mobile robot path planning with modified ant colony optimization. Int. J. Bio-Inspired Comput. 2017, 9, 106–113. [Google Scholar] [CrossRef]
  8. Manjhi, Y.; Dhar, J. Forecasting energy consumption using particle swarm optimization and gravitational search algorithm. In Proceedings of the 2016 International Conference on Advanced Communication Control and Computing Technologies (ICACCCT), Ramanathapuram, India, 25–27 May 2016. [Google Scholar]
  9. Chrouta, J.; Chakchouk, W.; Zaafouri, A.; Jemli, M. Modeling and control of an irrigation station process using heterogeneous cuckoo search algorithm and fuzzy logic controller. IEEE Trans. Ind. Appl. 2018, 55, 976–990. [Google Scholar] [CrossRef]
  10. Al-Shourbaji, I.; Zogaan, W. A new method for human resource allocation in cloud-based e-commerce using a meta-heuristic algorithm. Kybernetes 2021. ahead of print. [Google Scholar] [CrossRef]
  11. Oladele, T.O.; Olorunsola, B.J.; Aro, T.O.; Akande, H.B.; Olukiran, O.A. Nature-Inspired Meta-heuristic Optimization Algorithms for Breast Cancer Diagnostic Model: A Comparative Study. FUOYE J. Eng. Technol. 2021, 6, 26–29. [Google Scholar] [CrossRef]
  12. Hussain, K.; Salleh, M.N.M.; Cheng, S.; Shi, Y. Metaheuristic research: A comprehensive survey. Artif. Intell. Rev. 2019, 52, 2191–2233. [Google Scholar] [CrossRef] [Green Version]
  13. Agrawal, P.; Abutarboush, H.F.; Ganesh, T.; Mohamed, A.W. Metaheuristic Algorithms on Feature Selection: A Survey of One Decade of Research (2009–2019). IEEE Access 2021, 9, 26766–26791. [Google Scholar] [CrossRef]
  14. Fred, G. Tabu Search—Part 1. ORSA J. Comput. 1989, 1, 190–206. [Google Scholar]
  15. Feo, T.A.; Resende, M.G.C. A probabilistic heuristic for a computationally difficult set covering problem. Oper. Res. Lett. 1989, 8, 67–71. [Google Scholar] [CrossRef]
  16. Mladenović, N.; Hansen, P. Variable neighborhood search. Comput. Oper. Res. 1997, 24, 1097–1100. [Google Scholar] [CrossRef]
  17. Mirjalili, S.; Mirjalili, S.M.; Lewis, A. Grey wolf optimizer. Adv. Eng. Softw. 2014, 69, 46–61. [Google Scholar] [CrossRef] [Green Version]
  18. Gandomi, A.H.; Yang, X.S.; Alavi, A.H. Cuckoo search algorithm: A metaheuristic approach to solve structural optimization problems. Eng. Comput. 2013, 29, 17–35. [Google Scholar] [CrossRef]
  19. Kennedy, J.; Eberhart, R. Particle swarm optimization. In Proceedings of the International Conference on Neural Networks (ICNN), Perth, WA, Australia, 27 November–1 December 1995. [Google Scholar]
  20. Yang, X.S. Nature-Inspired Metaheuristic Algorithms, 2nd ed.; Luniver Press: Beckington, UK, 2008. [Google Scholar]
  21. De Souza, R.C.T.; dos Santos Coelho, L.; De Macedo, C.A.; Pierezan, J. A V-shaped binary crow search algorithm for feature selection. In Proceedings of the 2018 IEEE Congress on Evolutionary Computation, Rio de Janeiro, Brazil, 8–13 July 2018; pp. 1–8. [Google Scholar]
  22. Mirjalili, S. Dragonfly algorithm: A new meta-heuristic optimization technique for solving single-objective, discrete, and multi-objective problems. Neural Comput. Appl. 2016, 27, 1053–1073. [Google Scholar] [CrossRef]
  23. Dorigo, M.; Birattari, M.; Stutzle, T. Ant colony optimization. IEEE Comput. Intell. Mag. 2006, 1, 28–39. [Google Scholar] [CrossRef]
  24. Mirjalili, S.; Mirjalili, S.M.; Hatamlou, A. Multi-verse optimizer: A nature-inspired algorithm for global optimization. Neural Comput. Appl. 2016, 27, 495–513. [Google Scholar] [CrossRef]
  25. Abualigah, L.; Abd Elaziz, M.; Sumari, P.; Geem, Z.W.; Gandomi, A.H. Reptile Search Algorithm (RSA): A nature-inspired meta-heuristic optimizer. Expert Syst. Appl. 2021, 191, 116158. [Google Scholar] [CrossRef]
  26. Pustokhina, I.V.; Pustokhin, D.A.; Aswathy, R.H.; Jayasankar, T.; Jeyalakshmi, C.; Díaz, V.G.; Shankar, K. Dynamic customer churn prediction strategy for business intelligence using text analytics with evolutionary optimization algorithms. Inf. Process. Manag. 2021, 58, 102706. [Google Scholar] [CrossRef]
  27. Ahmed, A.A.; Maheswari, D. Churn prediction on huge telecom data using hybrid firefly-based classification. Egypt. Inform. J. 2017, 18, 215–220. [Google Scholar] [CrossRef]
  28. Sivasankar, K. Effective Customer Churn Prediction on Large Scale Data using Metaheuristic Approach. Indian J. Sci. Technol. 2016, 9, 33. [Google Scholar] [CrossRef]
  29. Özmen, M.; Aydoğan, E.K.; Delice, Y.; Toksarı, M.D. Churn prediction in Turkey’s telecommunications sector: A proposed multiobjective–cost-sensitive ant colony optimization. Wiley Interdiscip. Rev. Data Min. Knowl. Discov. 2020, 10, 1338. [Google Scholar] [CrossRef]
  30. Venkatesh, S.; Jeyakarthic, M. Metaheuristic based Optimal Feature Subset Selection with Gradient Boosting Tree Model for IoT Assisted Customer Churn Prediction. J. Seybold Rep. 2020, 15, 334–351. [Google Scholar]
  31. Li, K.G.; Marikannan, B.P. Hybrid particle swarm optimization-extreme learning machine algorithm for customer churn prediction. J. Comput. Theor. Nanosci. 2019, 16, 3432–3436. [Google Scholar] [CrossRef]
  32. Praseeda, C.K.; Shivakumar, B.L. Fuzzy particle swarm optimization (FPSO) based feature selection and hybrid kernel distance based possibilistic fuzzy local information C-means (HKD-PFLICM) clustering for churn prediction in telecom industry. SN Appl. Sci. 2021, 3, 613. [Google Scholar] [CrossRef]
  33. Faris, H. A hybrid swarm intelligent neural network model for customer churn prediction and identifying the influencing factors. Information 2018, 9, 288. [Google Scholar] [CrossRef] [Green Version]
  34. Vijaya, J.; Sivasankar, E. An efficient system for customer churn prediction through particle swarm optimization-based feature selection model with simulated annealing. Clust. Comput. 2019, 22, 10757–10768. [Google Scholar] [CrossRef]
  35. Wu, Y.; Gong, M.; Ma, W.; Wang, S. High-order graph matching based on ant colony optimization. Neurocomputing 2019, 328, 97–104. [Google Scholar] [CrossRef]
  36. Dorigo, M.; Stützle, T. Ant colony optimization: Overview and recent advances. In Handbook of Metaheuristics; Springer: Cham, Switzerland, 2019; pp. 311–351. [Google Scholar]
  37. Kanan, H.R.; Faez, K.; Taheri, S.M. Feature selection using ant colony optimization (ACO): A new method and comparative study in the application of face recognition system. In Industrial Conference on Data Mining; Springer: Berlin/Heidelberg, Germany, 2007. [Google Scholar]
  38. Beer, C.; Hendtlass, T.; Montgomery, J. Improving exploration in ant colony optimization with antennation. In Proceedings of the 2012 IEEE Congress on Evolutionary Computation, Brisbane, QLD, Australia, 10–15 June 2012. [Google Scholar]
  39. Ibrahim, R.A.; Abd Elaziz, M.; Ewees, A.A.; El-Abd, M.; Lu, S. New feature selection paradigm based on hyper-heuristic technique. Appl. Math. Model. 2021, 98, 14–37. [Google Scholar] [CrossRef]
  40. Talbi, E.G. A taxonomy of hybrid metaheuristics. J. Heuristics 2002, 8, 541–564. [Google Scholar] [CrossRef]
  41. Wang, A.; An, N.; Chen, G.; Li, L.; Alterovitz, G. Accelerating wrapper-based feature selection with K-nearest-neighbor. Knowl.-Based Syst. 2015, 83, 81–91. [Google Scholar] [CrossRef]
  42. AlShourbaji, I.; Helian, N.; Sun, Y.; Alhameed, M. A novel HEOMGA Approach for Class Imbalance Problem in the Application of Customer Churn Prediction. SN Comput. Sci. 2021, 2, 464. [Google Scholar] [CrossRef]
  43. Pustokhina, I.V.; Pustokhin, D.A.; Nguyen, P.T.; Elhoseny, M.; Shankar, K. Multi-objective rain optimization algorithm with WELM model for customer churn prediction in telecommunication sector. Complex Intell. Syst. 2021, 1–13. [Google Scholar] [CrossRef]
  44. Martin, L.; Leblanc, R.; Toan, N.K. Tables for the Friedman rank test. Can. J. Stat. 1993, 21, 39–43. [Google Scholar] [CrossRef]
  45. Hussain, K.; Salleh, M.N.M.; Cheng, S.; Shi, Y. On the exploration and exploitation in popular swarm-based metaheuristic algorithms. Neural Comput. App. 2019, 31, 7665–7683. [Google Scholar] [CrossRef]
Figure 1. Flow diagram of the ACO.
Mathematics 10 01031 g001
Figure 2. The flow diagram of the RSA.
Mathematics 10 01031 g002
Figure 3. The flow diagram of the ACO-RSA approach.
Mathematics 10 01031 g003
Figure 4. Switching behavior of proposed ACO-RSA for sample runs using all seven datasets.
Mathematics 10 01031 g004
Figure 5. The convergence curves of the ACO-RSA and the other MAs.
Mathematics 10 01031 g005
Figure 6. The boxplot graphs of each MA for each dataset.
Mathematics 10 01031 g006
Figure 7. Exploration and exploitation ratio maintained by MAs on each dataset.
Mathematics 10 01031 g007aMathematics 10 01031 g007b
Table 1. The characteristics of the open-source customer churn datasets.
DatasetSourceNo. of InstancesNo. of FeaturesNo. of Class
Dataset 1[42,43]3333212
Dataset 2[42,43]7043212
Dataset 3[32]71,047582
Dataset 4[42,43]100,0001002
Dataset 5https://www.kaggle.com/barun2104/telecom-churn (accessed on 26 January 2022)3333112
Dataset 6https://www.kaggle.com//barun2104/telecom-churnhttps://www.kaggle.com/barun2104/telecom-churn (accessed on 26 January 2022)3150162
Dataset 7https://www.kaggle.com//mehmetsabrikunt/internet-service-churnhttps://www.kaggle.com/barun2104/telecom-churn (accessed on 26 January 2022)50,375102
Table 2. Parameter settings.
AlgorithmParameters
PSOIndividual acceleration factor ( c 1 ) increases, global acceleration factor ( c 2 ) decreases linearly in the range (0.5–2.5), and inertia weight linearly decreases in the range (0.9–0.4)
MVO W E P m i n (wormhole existence probability) = 0.2, W E P m a x = 1, p = 6, variable (α) linearly decreases in the range (2–0)
GWOVariable (α) linearly decreases in the range (2–0), variable (C) is a random value in the range (0,2), variable (A) decreases linearly from 1 to −1
ACO τ 0 = 1 ,   p = 0.95 ,   α = 1.2 ,   β = 0.5
RSAUB and LB vary according to feature in the dataset γ = 0.9 ,   θ = 0.5
Table 3. The average results obtained by different algorithms in terms of the accuracy and OFS.
DatasetMetricPSOMVOGWOACORSAACO-RSA
Dataset 1ACC0.89630.88360.88420.84340.89890.9036
OFS12910884
Dataset 2ACC0.83120.81270.83120.80840.83190.8330
OFS665454
Dataset 3ACC0.69100.69060.69070.68930.69220.6923
OFS353228272625
Dataset 4ACC0.55860.55340.54680.52910.55190.5538
OFS454238381515
Dataset 5ACC0.90080.87240.89480.84840.90520.9047
OFS556543
Dataset 6ACC0.93610.86460.91850.84370.93820.9471
OFS1098774
Dataset 7ACC0.93850.86540.92480.85630.93420.9390
OFS444332
Table 4. The best and worst fitness values of the ACO-RSA and the other MAs.
DatasetMetricPSOMVOGWOACORSAACO-RSA
Dataset 1Best0.08270.07970.09060.17730.07880.0746
Worst0.10080.10060.11750.19520.10500.0958
Dataset 2Best0.14260.14350.14620.14460.13990.1420
Worst0.14950.15340.15440.15720.15320.1489
Dataset 3Best0.28030.27850.27960.31870.24110.2386
Worst0.28940.28890.29180.32870.28770.2837
Dataset 4Best0.42390.42080.42840.42860.41900.4179
Worst0.43560.43370.43920.44680.42950.4326
Dataset 5Best0.07550.08040.08180. 09150.07450.0728
Worst0.09040.09270.10460.17370.09660.0894
Dataset 6Best0.03470.03820.04380.10020.02910.0368
Worst0.09080.05990.04650.18660.06570.0501
Dataset 7Best0.06090.06360.06690.12190.06150.0605
Worst0.06470.07040.08050.09970.07370.0651
Table 5. The Avg and Std of fitness values of the ACO-RSA and the other MAs.
DatasetMetricPSOMVOGWOACORSAACO-RSA
Dataset 1Avg0.09280.08960.10320.11400.09140.0877
Std0.00570.00640.00540.00410.00810.0041
Dataset 2Avg0.14520.14910.14540.14780.14750.1436
Std0.00210.00300.00220.00320.00350.0016
Dataset 3Avg0.28530.28490.28720.32410.26840.2496
Std0.00230.00240.00330.00290.01550.0125
Dataset 4Avg0.42870.42990.43440.43800.42570.4248
Std0.00290.00270.00350.00550.00240.0040
Dataset 5Avg0.08120.08760.09350.11860.08310.0814
Std0.00480.00430.00620.00860.00690.0038
Dataset 6Avg0.04290.05250.07220.10670.04600.0409
Std0.00430.00640.01400.01260.00820.0038
Dataset 7Avg0.06590.06310.07710.10400.06700.0635
Std0.00110.00170.00730.01860.00320.0010
Table 6. The Avg CT of the ACO-RSA and the other MAs.
DatasetPSOMVOGWOACORSAACO-RSA
Dataset 126.650726.608728.061825.879316.097216.4592
Dataset 297.332094.740494.791293.762245.126646.4270
Dataset 3472.8719469.9067473.3237474.1874143.6752175.6912
Dataset 41062.65251080.83911060.75341060.2647316.8873351.1655
Dataset 522.621123.638922.635022.630011.796814.4268
Dataset 622.319922.918522.085821.755315.282116.0060
Dataset 7355.7554441.0723424.72541498.0671202.5721268.2194
Table 7. Friedman ranking results for the ACO-RSA and the other MAs across all metrics.
DatasetMetricPSOMVOGWOACORSAACO-RSA
Dataset 1ACC4.004.752.051.003.255.95
OFS5.454.753.903.102.651.15
Fitness3.242.144.986.003.621.02
Dataset 2ACC4.101.903.801.154.455.60
OFS4.054.503.152.353.953.00
Fitness2.185.863.203.705.021.04
Dataset 3ACC1.552.804.054.552.405.65
OFS5.404.603.953.951.601.50
Fitness2.543.404.965.962.881.26
Dataset 4ACC3.603.503.352.953.653.95
OFS5.054.052.852.354.602.10
Fitness3.762.924.885.762.621.06
Dataset 5ACC3.903.401.105.002.455.15
OFS3.803.354.704.552.152.45
Fitness3.851.95.006.002.601.65
Dataset 6ACC5.051.853.101.354.405.25
OFS4.754.954.153.002.801.35
Fitness3.952.155.006.002.851.05
Dataset 7ACC4.702.651.053.852.955.80
OFS3.304.204.403.602.303.20
Fitness3.205.006.003.801.951.05
Highlight (bold) denotes the best performance of the corresponding metric.
Table 8. Significant tests of the controlled method (ACO-RSA) and other MA using Holm’s test.
DatasetAlgorithmp-ValueAdjusted p-ValueHypothesis
Dataset 1PSO1.7845 × 10−281.7845 × 10⁻²⁷Rejected
MVO1.3164 × 10−195.2655 × 10⁻¹⁹Rejected
GWO1.9346 × 10−442.9019 × 10−43Rejected
ACO2.7827 × 10−433.8958 × 10−42Rejected
RSA5.4055 × 10−213.2433 × 10⁻²⁰Rejected
Dataset 2PSO2.5520 × 10−333.5728 × 10⁻³²Rejected
MVO7.7200 × 10−328.4920 × 10⁻³¹Rejected
GWO2.0184 × 10−322.6239 × 10⁻³¹Rejected
ACO9.4165 × 10−267.5332 × 10⁻²⁵Rejected
RSA5.0025 × 10−407.5038 × 10−39Rejected
Dataset 3PSO7.5939 × 10−21.5188 × 10⁻¹Rejected
MVO8.1198 × 10−18.1198 × 10⁻¹Rejected
GWO1.3254 × 10−103.976 × 10⁻⁸Rejected
ACO1.9803 × 10−149.9012 × 10⁻¹⁵Not rejected
RSA5.5713 × 10−112.2286 × 10⁻¹¹Not rejected
Dataset 4PSO3.2151 × 10−162.5721 × 10⁻¹⁵Rejected
MVO1.2848 × 10−158.9933 × 10⁻¹⁵Rejected
GWO1.9558 × 10−161.7602 × 10⁻¹⁵Rejected
ACO1.1534 × 10−171.2687 × 10⁻¹⁶Rejected
RSA7.9148 × 10−189.4978 × 10⁻¹⁷Rejected
Dataset 5PSO1.2760 × 10−137.656 × 10⁻¹³Rejected
MVO5.1020 × 10−15.1020 × 10⁻¹Not rejected
GWO3.5554 × 10−183.5554 × 10⁻¹⁷Rejected
ACO1.0817 × 10−271.5144 × 10⁻²⁶Rejected
RSA1.7354 × 10−35.2063 × 10⁻³Rejected
Dataset 6PSO5.2644 × 10−124.7380 × 10⁻¹¹Rejected
MVO6.0216 × 10−103.0108 × 10⁻⁹Rejected
GWO8.7912 × 10−116.1539 × 10⁻¹⁰Rejected
ACO1.9293 × 10−252.3152 × 10⁻²⁴Rejected
RSA2.8887 × 10−45.7774 × 10⁻⁴Rejected
Dataset 7PSO2.0999 × 10−122.0999 × 10⁻¹¹Rejected
MVO5.34510 × 10−93.7416 × 10⁻⁸Rejected
GWO6.3569 × 10−327.0121 × 10⁻³¹Rejected
ACO1.8961 × 10−77.5843 × 10⁻⁷Rejected
RSA2.9728 × 10−78.9185 × 10⁻⁷Rejected
Highlight (bold) denotes that there is a significant difference.
Table 9. CEC 2014 test functions.
Nu.Functions F i * = F i X *
F1Storn’s Chebyshev Polynomial Fitting Problem1
F2Inverse Hilbert Matrix Problem1
F3Lennard-Jones Minimum Energy Cluster1
F4Rastrigin’s Function1
F5Griewangk’s Function1
F6Weierstrass Function1
F7Modified Schwefel’s Function1
F8Expanded Schaffer’s F6 Function1
F9Happy Cat Function1
F10Ackley Function1
Table 10. Avg and Std results using CEC 2019 test functions.
Func.MetricACORSAACO-RSA
F1Avg2.6843 × 10−1500
Std6.4655 × 10−800
F2Avg9.8746 × 10−2300
Std7.4512 × 10−600
F3Avg1.5476 × 10−2106.8764 × 10−28
Std6.5241 × 10−903.6481 × 10⁻⁹
F4Avg000
Std000
F5Avg1.6784 × 1024.9000 × 1022.6818 × 102
Std4.7864 × 10−36.5260 × 10−33.4510 × 10−3
F6Avg2.5420 × 1011.2382 × 1011.0307 × 10−1
Std3.6857 × 10−27.1253 × 10−21.0541 × 10−2
F7Avg3.5407 × 10−31.9745 × 10−32.5438 × 10−4
Std2.6743 × 10−46.6287 × 10−37.6842 × 10−5
F8Avg−6.8741 × 10³−7.1505 × 10³−4.8366 × 10³
Std5.6874 × 1036.8674 × 1026.8133 × 102
F9Avg2.6845 × 10−3800
Std8.6451 × 10−3900
F10Avg9.6872 × 10−128.8818 × 10−166.8766 × 10⁻¹⁶
Std2.6851 × 10−1200
Publisher’s Note: MDPI stays neutral with regard to jurisdictional claims in published maps and institutional affiliations.

