Article

Identifying the Association of Time-Averaged Serum Albumin Levels with Clinical Factors among Patients on Hemodialysis Using Whale Optimization Algorithm

1
Department of Electronic Engineering, National Kaohsiung University of Science and Technology, Kaohsiung 80778, Taiwan
2
Ph. D. Program in Biomedical Engineering, Kaohsiung Medical University, Kaohsiung 80708, Taiwan
3
School of Dentistry, Kaohsiung Medical University, Kaohsiung 80708, Taiwan
4
Center of Cancer Program Development, E-Da Cancer Hospital, I-Shou University, Kaohsiung 82445, Taiwan
5
Department of Internal Medicine, Division of Nephrology, Kaohsiung Chang Gung Memorial Hospital, Chang Gung University College of Medicine, Kaohsiung 833401, Taiwan
6
Biotechnology and Chemical Engineering, I-Shou University, Kaohsiung 84004, Taiwan
*
Authors to whom correspondence should be addressed.
Mathematics 2022, 10(7), 1030; https://doi.org/10.3390/math10071030
Submission received: 9 February 2022 / Revised: 15 March 2022 / Accepted: 21 March 2022 / Published: 23 March 2022

Abstract

:
Time-averaged serum albumin (TSA) is commonly associated with clinical outcomes in hemodialysis (HD) patients and considered as a surrogate indicator of nutritional status. The whale optimization algorithm-based feature selection (WOFS) model could address the complex association between the clinical factors, and could further combine with regression models for application. The present study aimed to demonstrate an optimal multifactor TSA-associated model, in order to interpret the complex association between TSA and clinical factors among HD patients. A total of 829 HD patients who met the inclusion criteria were selected for analysis. Monthly serum albumin data tracked from January 2009 to December 2013 were converted into TSA categories based on a critical value of 3.5 g/dL. Multivariate logistic regression was used to analyze the association between TSA categories and multiple clinical factors using three types of feature selection models, namely the fully adjusted, stepwise, and WOFS models. Five features, albumin, age, creatinine, potassium, and HD adequacy index (Kt/V level), were selected from fifteen clinical factors by the WOFS model, which is the minimum number of selected features required in multivariate regression models for optimal multifactor model construction. The WOFS model yielded the lowest Akaike information criterion (AIC) value, which indicated that the WOFS model could achieve superior performance in the multifactor analysis of TSA for HD patients. In conclusion, the application of the optimal multifactor TSA-associated model could facilitate nutritional status monitoring in HD patients.

1. Introduction

The assessment of clinical status in hemodialysis (HD) patients commonly relies on longitudinal clinical observations, such as on-schedule laboratory tests or physical examinations [1,2,3]. Previous studies have demonstrated that various clinical assessment parameters in HD patients, such as functional status, inflammation, hospitalization, and mortality, are directly or indirectly associated with nutritional status [4,5,6,7]. Serum albumin level is a common index used to monitor nutritional status in HD patients [8,9,10]. Previous studies have reported that low time-averaged serum albumin (TSA) levels are potentially associated with poor survival outcomes [3,11]. Therefore, TSA can be considered as a surrogate indicator of changes in nutritional status and survival outcomes [12]. However, TSA may be simultaneously influenced by multiple clinical factors [8,13,14].
The association between TSA and clinical factors is commonly evaluated using statistical approaches such as regression models [13,15]. Regression models have been extensively applied in the evaluation of associations between clinical factors, and have exhibited robust model performance and promising results [16,17,18]. However, feature selection procedures in regression analyses are often limited by complex multifactor interactions [19,20,21,22]. The optimization algorithms have been widely used in biomedicine problems [23,24,25]. The whale optimization algorithm (WOA) is an optimization algorithm that simulates humpback whale predation behavior and has been adopted in multifactor feature selection activities due to its high compatibility and merits with regard to complex trait computation [26,27,28]. The WOA may accelerate the convergence of complex trait interactions among multiple factors [29,30,31]. Therefore, the use of a combination of the WOA and a regression model is feasible and may enhance model performance.
Although previous studies have explored the association between TSA and clinical factors [3,11], discussions on the optimal multifactor model associated with TSA are lacking. The aim of the present study was to develop an optimal multifactor TSA-associated model that could facilitate the interpretation of the association between TSA and clinical factors in HD patients using a whale optimization algorithm-based feature selection (WOFS) model. The tool could be applied in optimal multifactor modeling and facilitate malnutrition prevention in HD patients.

2. Methods

2.1. Datasets

A total of 874 patients who were continuing to receive HD treatment (three times per week) at Kaohsiung Chang Gung Memorial Hospital in Taiwan were selected, and 829 patients who met the study inclusion criteria were analyzed. The inclusion criteria were patients aged over 20 years and obtaining complete data in the study period. All data were retrospectively collected using an approved data protocol (201800595B0) with a waiver of informed consent from patients. All patients were tracked from 1 January 2009 to 31 December 2013. The serum albumin data were collected monthly and converted into a TSA value. The patients were divided into high-TSA (≥3.5 g/dL) and low-TSA (<3.5 g/dL) categories based on their TSA values. Data on the baseline characteristics and TSA-associated factors, including dialysis vintage, age, gender, and diabetes mellitus (DM) status, were also collected. In addition, the baseline laboratory parameters of hemoglobin, blood urea nitrogen (BUN), creatinine, potassium, calcium, phosphate, intact parathyroid hormone (iPTH), ferritin, HD adequacy index (Kt/V score, Daugirdas), urea reduction ratio (URR), and cardiothoracic ratio measured in chest radiography were measured.

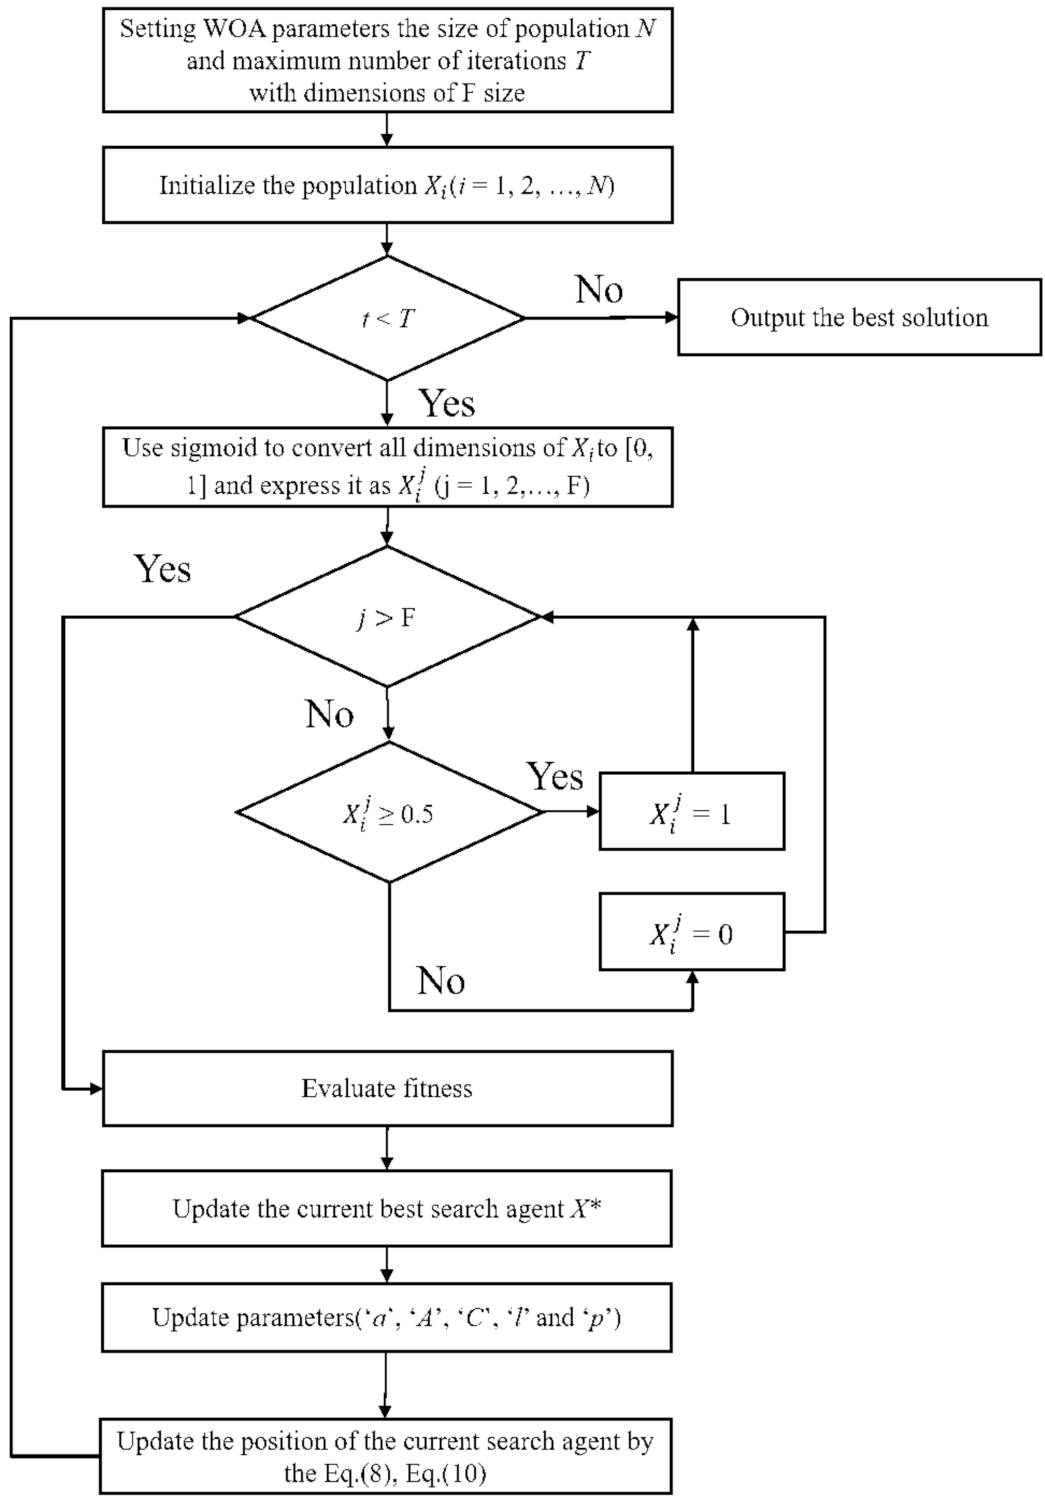
2.2. Whale Optimization-Based Feature Selection Model

Mirjalili and Lewis proposed an optimization algorithm base on whales’ special hunting method in 2016 [26]. Lu and Ma proposed a modified whale optimization algorithm to predict software reliability [32]. The WOFS model was used to accelerate convergence and determine the factors mostly associated with TSA in HD patients. A schematic of the WOFS model is illustrated in Figure 1. The model is divided into two phases, namely the exploitation phase and the exploration phase, executed in that order. The procedures were executed as follows.
The exploitation phase applies a local search approach, which is divided into two behavior patterns, namely a shrinking encircling mechanism and a spiral updating procedure. The shrinking encircling mechanism is used to update the current position based on the current best solutions, which are presented in Equations (1)–(6):
D   = C   .   X t X   t
X   t + 1 = X t A   .   D  
where t is the current iteration, X   t is the current position vector solution, X   t is the best solution of the current position vector, X   t + 1 is the updated position vector of the solution, || is the absolute value, and A and C are coefficient vectors. A and C are defined in Equations (3) and (4):
A   = 2 a   .   r   a  
C   = 2 r    
where r is a random vector in the range [0, 1]. The current position vector is updated according to Equation (2). The values of A and C influence the range of the area over which the current position vector can be moved. The calculation of a is shown in Equation (5):
a   = 2 t 2 M a x I t e r
where MaxIter is the maximum number of allowed iterations. According to Equation (5), a decreases linearly from 2 to 0 over the iterations, which, in turn, reduces the movable range of the shrinking encircling mechanism within the iterations. Therefore, X   t and X t are used to establish a spiral equation to simulate the spiral movement of humpback whales to update the current best position. The spiral movement updating procedures are shown in Equations (6)–(8):
X   t + 1 = D   · e b l · c o s 2 π l + X   t
D = X   t X   t
where l is a random number in the range [−1, 1], b is a constant defining the shape of the spiral, and D is the distance between the whale X   t and the prey. The trigger probability (p) of Equation (8) is set to 0.5 in the simulation process:
X t + 1 = X t A   .   D   D .   e b l .   cos 2 π l + X t   i f   p < 0.5 i f   p 0.5
where p is a random number in [0, 1]. When A   < 1 , Equation (8) is used to update the position.
The exploration phase mainly involves global search. When A   1 enters the exploration stage, this could result in updating the current individual’s position vector with a randomly selected whale. Since A   must be greater than 1 at this stage, according to Equation (10), the updated position will deviate from the reference whale position, and the purpose of global search would be achieved.
D = C   · X r a n d   X  
X   t + 1 = X r a n d   A   · D  
where X r a n d is a random whale position vector selected from the current population.
y k = 1 1 + e v i k t
X i d = 1   i f   S x i k t + 1 0.5 0   o t h e r w i s e
where S indicates the sigmoid conversion, and x i k t + 1 indicates the ith whale in the vector of the kth dimension in the (t + 1) iteration. A threshold of 0.5 is set to fit the binary trait. When the dimension k is 1, this means that the feature is selected; otherwise, the feature is excluded. Afterwards, the computed value is mapped using the sigmoid function and converted into an integer of 1 or 0.

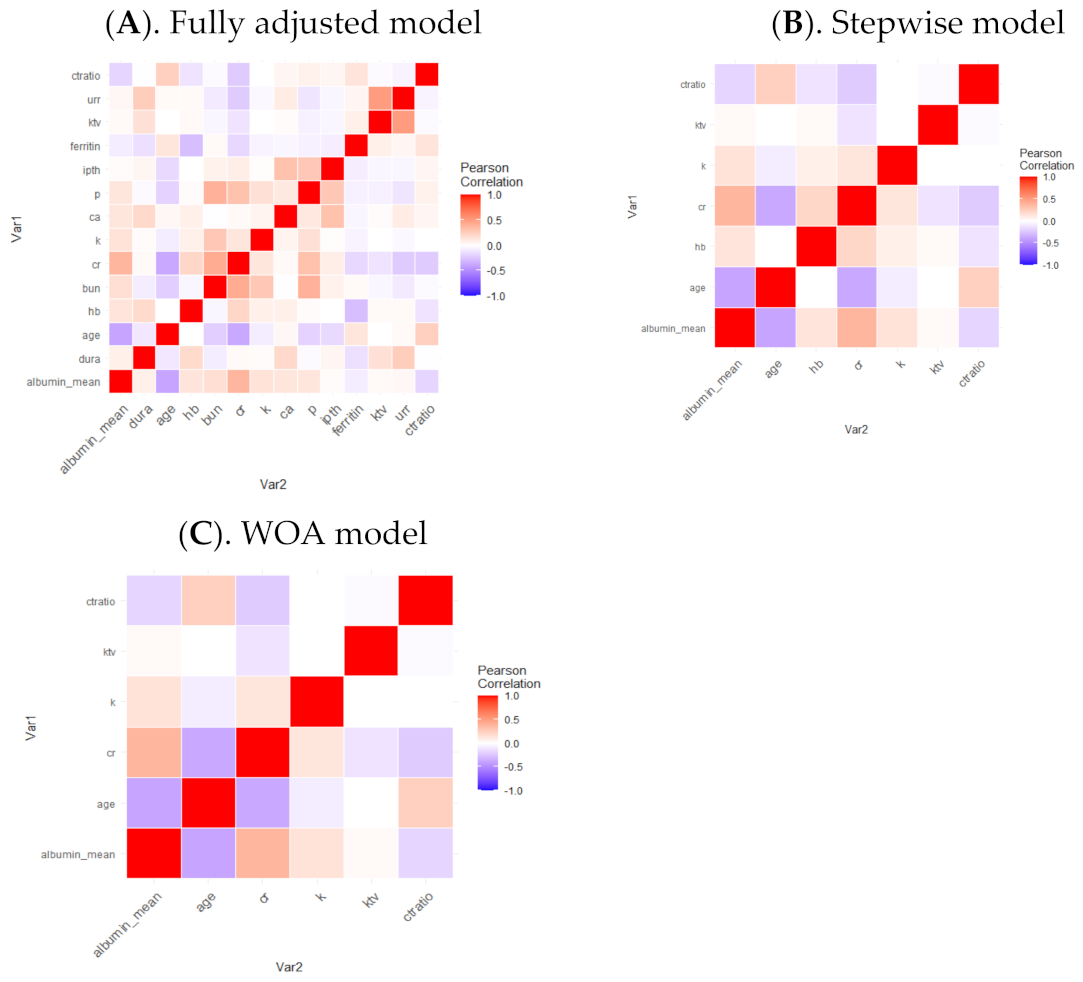
2.3. Statistical Models

The distributions of baseline characteristics and TSA-associated factors of HD patients were summarized into median (interquartile range), mean (standard deviation), or frequency (percentage) according to the TSA categories. The differences between the TSA categories were estimated using an independent two-sample t-test or a chi-squared test, as appropriate. Pearson’s correlation analysis was performed to draw a correlation plot and correlation heatmap to evaluate the collinearity between TSA and clinical factors. The associations between TSA categories and individual factors were analyzed using univariate logistic regression analysis. Multivariate logistic regressions were used to analyze the associations between TSA categories and multiple factors using three types of feature selection models. The fully adjusted model included all factors, the stepwise model used a critical p-value of 0.2 to include associated factors, and the WOFS model included factors through a WOA algorithm. The odds ratios (ORs) and 95% confidence intervals (CIs) were computed. The performance of the multivariate logistic regression models was compared according to the Akaike information criterion (AIC), and a low AIC value indicated a low prediction error of the corresponding model. All p-values were two-tailed, and a p-value less than 0.05 was considered statistically significant. All analyses were performed using R v3.6.1 (R Development Core Team 2013).

3. Results

Table 1 summarizes the baseline characteristics of both TSA categories. A total of 735 high-TSA individuals with a median dialysis vintage of 5.74 (2.85–10.31) years, and 94 low-TSA individuals with a median dialysis vintage of 4.49 (2.17–9.20) years, were analyzed. The low-TSA category consisted of significantly older individuals (p < 0.001) and a higher proportion of individuals with DM (p = 0.013) when compared with the high-TSA category. In laboratory measurements, the low-TSA category also had significantly low baseline hemoglobin (p = 0.014), albumin (p < 0.014), BUN (p = 0.001), creatinine (p < 0.001), potassium (p < 0.001), calcium (p = 0.039), and phosphate (p = 0.010) values when compared with the high-TSA category. In addition, the low-TSA category had a significantly higher proportion of cardiothoracic ratios ≥ 0.5 (p < 0.001) when compared with the high-TSA category.
The univariate logistic regression analysis results are presented in Table 2. According to the univariate results, HD patients who were in the low-TSA category were relatively old (OR = 1.07, 95% CI 1.05–1.09, p < 0.001), had relatively low hemoglobin levels (OR = 0.78, 95% CI = 0.66–0.91, p = 0.002), low BUN levels (OR = 0.97, 95% CI = 0.96–0.99, p < 0.001), low creatinine levels (OR = 0.66, 95% CI = 0.59–0.73, p < 0.001), low potassium levels (OR = 0.54, 95% CI = 0.39–0.74, p < 0.001), low calcium levels (OR = 0.75, 95% CI = 0.58–0.97, p = 0.029), and low phosphate levels (OR = 0.81, 95% CI = 0.69–0.95, p = 0.009). Cardiothoracic ratios ≥ 0.50 (OR = 2.59, 95% CI = 1.63–4.24, p < 0.001) were more likely in the low-TSA category.
The multivariate logistic regression analysis results of the fully adjusted, the stepwise, and the WOFS models with a critical p-value of <0.2 are listed in Table 3.
According to the results of the fully adjusted model, relatively old HD patients (OR = 1.07, 95% CI 1.05–1.09, p < 0.001) and patients with relatively low creatinine levels (OR = 0.72, 95% CI = 0.62–0.83, p < 0.001) and low potassium levels (OR = 0.69, 95% CI = 0.49–0.97, p = 0.033) were more likely to be in the low-TSA category. The stepwise and WOFS models revealed similar results, where four out of six factors selected using the stepwise model and four out of five factors selected using the WOFS model were significantly associated with the low-TSA category. In the stepwise model, relatively old HD patients (OR = 1.04, 95% CI 1.02–1.07, p < 0.001) and patients with low creatinine levels (OR = 0.72, 95% CI = 0.62–0.823, p < 0.001) and low potassium levels (OR = 0.70, 95% CI = 0.50–0.96, p = 0.027) were more likely to be in the low-TSA category, whereas HD patients with Kt/V ≥ 1.70 (OR = 0.58, 95% CI = 0.35–0.94, p = 0.029) were less likely to be in the low-TSA category. In the WOFS model, relatively old HD patients (OR = 1.04, 95% CI 1.02–1.06, p = 0.001) and patients with low creatinine levels (OR = 0.71, 95% CI = 0.63–0.80, p < 0.001) and low potassium levels (OR = 0.68, 95% CI = 0.49–0.93, p = 0.016) were more likely to be in the low-TSA category, whereas HD patients with Kt/V ≥ 1.70 (OR = 0.57, 95% CI = 0.35–0.91, p = 0.021) were less likely to be in the low-TSA category. The optimal AIC values of the fully adjusted, stepwise, and WOFS models were 511.96, 499.25, and 499.14, respectively. The results indicated that the WOFS model had the lowest AIC value, which indicates superior performance in multifactor analysis when compared with the fully adjusted and stepwise models. In addition, the WOFS model could more accurately select the TSA-associated factors when compared with the stepwise model.
According to Pearson’s correlation analysis, Figure 2 shows the correlation heatmap of clinical factors in TSA category.
The strong and weak correlations and differences between albumin and clinical variables can be clearly seen in Figure 2. The factors selected were shown by the WOFS model in Figure 2C. It was obvious from the color depth that the factors in the lower left corner were strongly correlated, and in the upper right corner were uncorrelated. For the WOFS model (Figure 2C) compared to the fully adjusted model (Figure 2A) and the stepwise model (Figure 2B), the non-significant correlation can be effectively reduced. The correlation network between clinical factors is shown in Figure 3.
The important features selected based on the WOFS model had a certain correlation that could be seen from the correlations including age, creatinine, potassium, Kt/V, and cardiothoracic ratio. TSA had a strong negative correlation with age, and a significant positive correlation with creatinine. The age and creatinine showed a strong negative correlation. In addition, there was a correlation with bun and potassium. The cardiothoracic ratio was corrected with TSA, age, and creatinine. The Kt/V had a strongly positive correlation with URR and a negative correlation with dialysis vintage.
We found that significant features included in the optimal multifactor TSA-associated model were age, serum creatinine and potassium levels, and Kt/V scores. Commonly, aging results in somewhat physiological and physical function regression. It is reasonable to assume that aged HD patients are exposed to a greater risk of disability and limitation in oral intake. Consequently, these conditions result in protein malnutrition and lower serum albumin levels. This finding in HD patients has also been reported in the previous studies [32,33,34]. Serum creatinine level could be an indicator of muscle mass and reflects a healthy nutritional status. Our results also showed that higher serum creatinine levels were associated with higher TSA levels. Figure 4 shows the differences of albumin, age, creatinine, potassium levels, and Kt/V in TSA categories. In an earlier study, combined serum albumin and creatinine levels were associated with a lower risk of death in HD patients [9]. Taken together, good nutritional status could enhance muscle mass in HD patients and consequently avoid the risk of death.
For HD patients, restriction of potassium intake is often advised [35]. However, excessive limitations in potassium intake in HD patients may result in untoward effects, such as weakness, constipation, cardiac arrhythmia, and malnutrition. We found that higher serum potassium levels exhibited a smaller risk for lower TSA levels in HD patients. One of the plausible explanations is more free access to dietary intake in this HD cohort. Nevertheless, a more detailed study is needed to define the association between TSA and potassium levels in HD patients.

4. Discussion

Nutritional status plays a critical role in clinical outcomes in dialysis patients. Clinically, nutritional assessment can be carried out using anthropometry, biochemical/biophysical methods, clinical methods, and dietary methods. Among these methods, testing serum albumin levels has been recognized as a useful and convenient method to examine the nutritional condition. Considering its dynamic changes, clinical observational studies have used baseline levels, mean levels in a defined period, time-varying levels, and time-averaged levels to predict clinical outcomes [3,36,37,38,39]. Accordingly, these peer-reviewed studies constantly demonstrate that serum albumin level is a strong predictor on clinical outcomes among patients on dialysis. However, there still exists a controversial view on analytic methods. Given this concern, we attempted to use multifactor models to overcome unrecognized confounding factors in statistical analysis. In this retrospective observational study in HD patients, we used the fully adjusted model, the stepwise model, and the WOFS model to investigate the association of TSA levels and clinical factors among patients on HD. The WOFS model employed a swarm optimization technique that has been adopted in exploration and exploitation phases to accelerate the convergence from local search to global search. The search strategy could make the WOFS model a powerful tool for feature selection, especially when handling complex traits that require taking into account potential multifactor interactions [29,31]. Our results demonstrated that the WOFS model could accurately select significant features from 15 clinical factors and exhibited model performance superior to that observed for the fully adjusted and stepwise models.
The adequacy of HD, indicated by Kt/V and URR, has been reported as a critical factor to reduce morbidity and mortality [40,41]. Moreover, adequate dialysis also shows a positive association with serum albumin levels in HD patients [3]. It is well-recognized that inadequate HD can result in inadequate nutrition, inflammation, and metabolic acidosis [41]. Consequently, it causes decreased albumin synthesis and hypoalbuminemia [42]. Our study is consistent with previous reports that an adequate Kt/V index showed a positive association with serum albumin levels in an HD population.
The present study has several limitations. First, the inclusion of covariates such as detailed comorbidities and drug intake history were limited because of the retrospective nature of the study. Second, the binary characteristics of the TSA categories may have led to a classification bias. Third, the study was a single-institution study. Although the highlighted shortcomings may have limited the reliability and generalizability of the findings of the study, the study nevertheless facilitates the development of optimal multifactor TSA-associated models by combining a WOFS-based feature selection approach with a logistic regression model. According to the results, age, creatinine levels, potassium levels, and Kt/V scores were the key factors identified by the optimal multifactor TSA-associated model. In future research, we might consider investigating the contributions of more clinical factors in time-averaged serum albumin levels in hemodialysis patients, such as comorbidities, relevant drugs in clinical practice, and hemodialysis-related parameters (e.g., hemodialyzer category, dialysate composition, and types of vascular access). Thus, the reliability of this study could be enhanced, and the feasibility improved in clinical practice.

5. Conclusions

To fit into clinical situations, an appropriate analytic model is urgently required to identify the complex interaction between serum albumin and clinical factors in HD patients. In this study, an optimal multifactor TSA-associated model based on the whale optimization algorithm-based feature selection (WOFS) model was proposed for HD patients. A total of 829 HD patients were analyzed from 2009 to 2013. According to the study results, the WOFS model could select five features from fifteen clinical factors, which is the minimum number of selected features required in a multivariate regression model for optimal multifactor model construction. The five significant features, including albumin, age, creatinine, potassium, and HD adequacy index (Kt/V level), associated with TSA in HD patients, were identified by the optimal WOFS model. Furthermore, the optimal AIC (equivalent to prediction error rate) values of the fully adjusted, stepwise, and WOFS models were 511.96, 499.25, and 499.14, respectively. The results showed that the WOFS model had the lowest AIC value, which indicated that the WOFS model had superior performance in multifactor analysis compared with the fully adjusted and stepwise models. In summary, the proposed WOFS model can be precisely applied in clinical practice to assess the trajectory of serum albumin in HD patients.

Author Contributions

Conceptualization, C.-H.Y. and J.-B.C.; methodology, C.-H.Y. and S.-H.M.; validation, Y.-S.C.; formal analysis, J.-B.C.; resources, J.-B.C.; writing—original draft preparation, S.-H.M. and Y.-S.C.; writing—review and editing, L.-Y.C. and S.-H.M.; visualization, Y.-S.C.; supervision, C.-H.Y. and L.-Y.C. All authors have read and agreed to the published version of the manuscript.

Funding

This work was partly supported by the Ministry of Science and Technology, R.O.C. (108-2221-E-992-031-MY3), Taiwan.

Institutional Review Board Statement

Not applicable.

Informed Consent Statement

Not applicable.

Data Availability Statement

Not applicable.

Acknowledgments

We would like to thank the reviewers for their valuable comments, which helped us to improve our paper. And we thank Ching-Yi Yu and Li-Chueh Kuo for their assistance in data management.

Conflicts of Interest

The authors declare no conflict of interest.

References

  1. Chen, J.B.; Cheng, B.C.; Liu, W.H.; Liao, S.C.; Fu, M.M.; Moi, S.H.; Yang, C.H. Longitudinal analysis of cardiac structure and function in incident-automated peritoneal dialysis: Comparison between icodextrin solution and glucose-based solution. BMC Nephrol. 2018, 19, 109. [Google Scholar] [CrossRef]
  2. Beberashvili, I.; Erlich, A.; Azar, A.; Sinuani, I.; Feldman, L.; Gorelik, O.; Stav, K.; Efrati, S. Longitudinal study of serum uric acid, nutritional status, and mortality in maintenance hemodialysis patients. Clin. J. Am. Soc. Nephrol. 2016, 11, 1015–1023. [Google Scholar] [CrossRef] [PubMed] [Green Version]
  3. Chen, J.-B.; Cheng, B.-C.; Yang, C.-H.; Hua, M.-S. An association between time-varying serum albumin level and the mortality rate in maintenance haemodialysis patients: A five-year clinical cohort study. BMC Nephrol. 2016, 17, 117. [Google Scholar] [CrossRef] [PubMed] [Green Version]
  4. Snaedal, S.; Qureshi, A.R.; Lund, S.H.; Germanis, G.; Hylander, B.; Heimbürger, O.; Carrero, J.J.; Stenvinkel, P.; Bárány, P. Dialysis modality and nutritional status are associated with variability of inflammatory markers. Nephrol. Dial. Transpl. 2016, 31, 1320–1327. [Google Scholar] [CrossRef] [PubMed] [Green Version]
  5. Chen, J.B.; Lee, W.C.; Cheng, B.C.; Moi, S.H.; Yang, C.H.; Lin, Y.D. Impact of risk factors on functional status in maintenance hemodialysis patients. Eur. J. Med. Res. 2017, 31, 22. [Google Scholar] [CrossRef] [PubMed]
  6. Kang, S.S.; Chang, J.W.; Park, Y. Nutritional status predicts 10-year mortality in patients with end-stage renal disease on hemodialysis. Nutrients 2017, 9, 399. [Google Scholar] [CrossRef]
  7. Giglio, J.; Kamimura, M.A.; Lamarca, F.; Rodrigues, J.; Santin, F.; Avesani, C.M. Association of sarcopenia with nutritional parameters, quality of life, hospitalization, and mortality rates of elderly patients on hemodialysis. J. Ren. Nutr. 2018, 28, 197–207. [Google Scholar] [CrossRef]
  8. Eriguchi, R.; Obi, Y.; Streja, E.; Tortorici, A.R.; Rhee, C.M.; Soohoo, M.; Kim, T.; Kovesdy, C.P.; Kalantar-Zadeh, K. Longitudinal associations among renal urea clearance–corrected normalized protein catabolic rate, serum albumin, and mortality in patients on hemodialysis. Clin. J. Am. Soc. Nephrol. 2017, 12, 1109–1117. [Google Scholar] [CrossRef]
  9. Wang, J.; Streja, E.; Soohoo, M.; Chen, J.L.; Rhee, C.M.; Kim, T.; Molnar, M.Z.; Kovesdy, C.P.; Mehrotra, R.; Kalantar-Zadeh, K. Concurrence of serum creatinine and albumin with lower risk for death in twice-weekly hemodialysis patients. J. Ren. Nutr. 2017, 27, 26–36. [Google Scholar] [CrossRef] [Green Version]
  10. Nakazato, Y.; Kurane, R.; Hirose, S.; Watanabe, A.; Shimoyama, H. Aging and death-associated changes in serum albumin variability over the course of chronic hemodialysis treatment. PLoS ONE 2017, 12, e0185216. [Google Scholar] [CrossRef] [Green Version]
  11. Shimoda, T.; Matsuzawa, R.; Yoneki, K.; Harada, M.; Watanabe, T.; Yoshida, A.; Takeuchi, Y.; Matsunaga, A. Combined contribution of reduced functional mobility, muscle weakness, and low serum albumin in prediction of all-cause mortality in hemodialysis patients: A retrospective cohort study. J. Ren. Nutr. 2018, 28, 302–308. [Google Scholar] [CrossRef] [PubMed]
  12. Tsur, N.; Menashe, I.; Haviv, Y.S. Risk Factors Before Dialysis Predominate as Mortality Predictors in Diabetic Maintenance Dialysis patients. Sci. Rep. 2019, 9, 10633. [Google Scholar] [CrossRef] [PubMed]
  13. Inaguma, D.; Koide, S.; Takahashi, K.; Hayashi, H.; Hasegawa, M.; Yuzawa, Y. Relationship between serum calcium level at dialysis initiation and subsequent prognosis. Ren. Replace. Ther. 2017, 3, 2. [Google Scholar] [CrossRef] [Green Version]
  14. Noppakun, K.; Kasemset, T.; Wongsawad, U.; Ruengorn, C.; Thavorn, K.; Sood, M.M.; Nochaiwong, S. Changes in serum albumin concentrations during transition to dialysis and subsequent risk of peritonitis after peritoneal dialysis initiation: A retrospective cohort study. J. Nephrol. 2020, 3, 1–13. [Google Scholar] [CrossRef] [PubMed]
  15. Hao, N.; Cheng, B.C.; Yang, H.T.; Wu, C.H.; Lei, Y.Y.; Chao, M.C.; Wang, P.Y.; Kuo, L.C.; Moi, S.H.; Yang, C.H.; et al. Time-varying serum albumin levels and all-cause mortality in prevalent peritoneal dialysis patients: A 5-year observational study. BMC Nephrol. 2019, 20, 254. [Google Scholar] [CrossRef] [PubMed] [Green Version]
  16. Zhang, D.; Ren, N.; Hou, X. An improved logistic regression model based on a spatially weighted technique (ILRBSWT v1. 0) and its application to mineral prospectivity mapping. Geosci. Model Dev. 2018, 11, 2525. [Google Scholar] [CrossRef] [Green Version]
  17. Rigoni, M.; Torri, E.; Nollo, G.; Zarantonello, D.; Laudon, A.; Sottini, L.; Guarrera, G.M.; Brunori, G. Survival and time-to-transplantation of peritoneal dialysis versus hemodialysis for end-stage renal disease patients: Competing-risks regression model in a single Italian center experience. J. Nephrol. 2017, 30, 441–447. [Google Scholar] [CrossRef] [Green Version]
  18. Suzuki, M.N.; Fregonesi, B.M.; Machado, C.S.; Zagui, G.S.; Kusumota, L.; Suzuki, A.K.; da Costa, J.A.C.; Llopart, J.S.; Nadal, M.; Domingo, J.L. Hemodialysis Water Parameters as Predisposing Factors for Anemia in Patients in Dialytic Treatment: Application of Mixed Regression Models. Biol. Trace Elem. Res. 2019, 190, 30–37. [Google Scholar] [CrossRef]
  19. Yang, C.H.; Chuang, L.Y.; Lin, Y.D. An improved fuzzy set-based multifactor dimensionality reduction for detecting epistasis. Artif. Intell. Med. 2020, 102, 30–37. [Google Scholar] [CrossRef]
  20. Yang, C.H.; Lin, Y.D.; Chuang, L.Y. Multiple-Criteria Decision Analysis-Based Multifactor Dimensionality Reduction for Detecting Gene-Gene Interactions. IEEE J. Biomed. Health 2019, 23, 416–426. [Google Scholar] [CrossRef]
  21. Yang, C.-H.; Chuang, L.-Y.; Lin, Y.-D. CMDR based differential evolution identifies the epistatic interaction in genome-wide association studies. Bioinformatics 2017, 33, 2354–2362. [Google Scholar] [CrossRef] [PubMed]
  22. Ritchie, M.D.; Van Steen, K. The search for gene-gene interactions in genome-wide association studies: Challenges in abundance of methods, practical considerations, and biological interpretation. Ann. Transl. Med. 2018, 6, 157. [Google Scholar] [CrossRef] [PubMed]
  23. Yang, C.H.; Kao, Y.K.; Chuang, L.Y.; Lin, Y.D. Catfish Taguchi-Based Binary Differential Evolution Algorithm for Analyzing Single Nucleotide Polymorphism Interactions in Chronic Dialysis. IEEE Trans. NanoBiosci. 2018, 17, 291–299. [Google Scholar] [CrossRef] [PubMed]
  24. Chuang, L.Y.; Moi, S.H.; Lin, Y.D.; Yang, C.H. A comparative analysis of chaotic particle swarm optimizations for detecting single nucleotide polymorphism barcodes. Artif. Intell. Med. 2016, 73, 23–33. [Google Scholar] [CrossRef]
  25. Yang, C.H.; Lin, Y.D.; Chuang, L.Y.; Chang, H.W. Double-Bottom Chaotic Map Particle Swarm Optimization Based on Chi-Square Test to Determine Gene-Gene Interactions. Biomed. Res. Int. 2014, 2014, 172049. [Google Scholar] [CrossRef]
  26. Mirjalili, S.; Lewis, A. The whale optimization algorithm. Adv. Eng. Soft. 2016, 95, 51–67. [Google Scholar] [CrossRef]
  27. Mohammed, H.M.; Umar, S.U.; Rashid, T.A. A Systematic and Meta-Analysis Survey of Whale Optimization Algorithm. Comput. Intell. Neurosci. 2019, 2019, 8718571. [Google Scholar] [CrossRef] [Green Version]
  28. Zhang, C.J.; Nie, H.H. An adaptive enhancement method for breast X-ray images based on the nonsubsampled contourlet transform domain and whale optimization algorithm. Med. Biol. Eng. Comput. 2019, 57, 2245–2263. [Google Scholar] [CrossRef]
  29. Tawhid, M.A.; Ibrahim, A.M. Feature selection based on rough set approach, wrapper approach, and binary whale optimization algorithm. Int. J. Mach. Learn. Cyb. 2020, 11, 573–602. [Google Scholar] [CrossRef]
  30. Tubishat, M.; Abushariah, M.A.M.; Idris, N.; Aljarah, I. Improved whale optimization algorithm for feature selection in Arabic sentiment analysis. Appl. Intell. 2019, 49, 1688–1707. [Google Scholar] [CrossRef]
  31. Mafarja, M.M.; Mirjalili, S. Hybrid Whale Optimization Algorithm with simulated annealing for feature selection. Neurocomputing 2017, 260, 302–312. [Google Scholar] [CrossRef]
  32. Lu, K.; Ma, Z. A modified whale optimization algorithm for parameter estimation of software reliability growth models. J. Algorithms Comput. Technol. 2021, 15, 17483026211034442. [Google Scholar] [CrossRef]
  33. Serigne, G.; Meryam, A.; Souad, D.; Clement, K.; Illiassou, S.; Etienne, G. Nutritional assessment of hemodialysis patients aged over 65 years: Outcome of a cross-sectional survey conducted in the well-equipped hemodialysis center of the Cahors hospital, France. J. Nephrol. Ther. 2018, 8, 305. [Google Scholar] [CrossRef]
  34. Katkov, A.; Sinuani, I.; Azar, A.; Shapiro, G.; Efrati, S.; Beberashvili, I. Age modifies the association between serum obestatin, appetite and nutritional status in maintenance hemodialysis patients. Eur. J. Clin. Nutr. 2018, 72, 1007–1018. [Google Scholar] [CrossRef] [PubMed]
  35. St-Jules, D.E.; Goldfarb, D.S.; Sevick, M.A. Nutrient Non-equivalence: Does Restricting High-Potassium Plant Foods Help to Prevent Hyperkalemia in Hemodialysis Patients? J. Ren. Nutr. 2016, 26, 282–287. [Google Scholar] [CrossRef] [Green Version]
  36. Iseki, K.; Kawazoe, N.; Fukiyama, K. Serum albumin is a strong predictor of death in chronic dialysis patients. Kidney Int. 1993, 44, 115–119. [Google Scholar] [CrossRef] [Green Version]
  37. Kalantar-Zadeh, K.; Kilpatrick, R.D.; Kuwae, N.; McAllister, C.J.; Alcorn, H., Jr.; Kopple, J.D.; Greenland, S. Revisiting mortality predictability of serum albumin in the dialysis population: Time dependency, longitudinal changes and population-attributable fraction. Nephrol. Dial. Transplant. 2005, 20, 1880–1888. [Google Scholar] [CrossRef] [Green Version]
  38. Amaral, S.; Hwang, W.; Fivush, B.; Neu, A.; Frankenfield, D.; Furth, S. Serum albumin level and risk for mortality and hospitalization in adolescents on hemodialysis. Clin. J. Am. Soc. Nephrol. 2008, 3, 759–767. [Google Scholar] [CrossRef] [Green Version]
  39. Mutsert, R.; Grootendorst, D.C.; Indemans, F.; Boeschoten, E.W.; Krediet, R.T.; Dekker, F.W. Association between serum albumin and mortality in dialysis patients is partly explained by inflammation, and not by malnutrition. J. Ren. Nutr. 2009, 19, 127–135. [Google Scholar] [CrossRef]
  40. Owen, W.F., Jr.; Lew, N.L.; Liu, Y.; Lowrie, E.G.; Lazarus, J.M. The urea reduction ratio and serum albumin concentration as predictors of mortality in patients undergoing hemodialysis. N. Engl. J. Med. 1993, 329, 1001–1006. [Google Scholar] [CrossRef]
  41. Combe, C.; Chauveau, P.; Laville, M.; Fouque, D.; Azar, R.; Cano, N.; Canaud, B.; Roth, H.; Leverve, X.; Aparicio, M. Influence of nutritional factors and hemodialysis adequacy on the survival of 1610 French patients. Am. J. Kidney Dis. 2001, 37, S81–S88. [Google Scholar] [CrossRef] [PubMed]
  42. Kaysen, G.A. Biological basis of hypoalbuminemia in ESRD. J. Am. Soc. Nephrol. 1998, 9, 2368–2376. [Google Scholar] [CrossRef] [PubMed]
Figure 1. WOFS model flowchart.
Mathematics 10 01030 g001
Figure 2. Comparison of correlation heatmaps of clinical factors in fully adjusted, stepwise, and WOFS models. The blocks represent the correlation levels between clinical factors. The blue and red colors are the positive and negative correlation, respectively.
Mathematics 10 01030 g002
Figure 3. The correlation network between clinical factors. The significant correlations between clinical factors are connected by lines. The thicker and thinner lines represent the higher and lower correlations between clinical factors. The blue and red colors are the positive and negative correlations, respectively.
Mathematics 10 01030 g003
Figure 4. Boxplot of albumin, age, creatinine, and potassium levels in different TSA categories. (A) Albumin, (B) age, (C) creatinine, (D) potassium levels, and (E) Kt/V.
Mathematics 10 01030 g004
Table 1. Baseline characteristics of hemodialysis patients in different time-averaged serum albumin (TSA) categories (n = 829).
CharacteristicsHigh-TSA Category
(≥3.5 g/dL)
Low-TSA Category
(<3.5 g/dL)
p
Dialysis vintage (years) a5.74 (2.85–10.31)4.49 (2.17–9.20)0.176
Age58.47 ± 12.0467.20 ± 11.38<0.001
Gender (n, %) 0.116
Male341 (46.39)35 (37.23)
Female394 (53.61)59 (62.77)
DM (n, %) 0.013
No554 (75.37)59 (62.77)
Yes181 (24.63)35 (37.23)
Laboratory measurements
Hemoglobin (g/dL)10.69 ± 1.2810.24 ± 1.710.014
Albumin (g/dL)3.93 ± 0.273.38 ± 0.33<0.001
BUN (mg/dL)69.70 ± 16.5662.70 ± 18.090.001
Creatinine (mg/dL)10.75 ± 2.348.72 ± 2.32<0.001
Potassium (meq/L)4.99 ± 0.724.68 ± 0.77<0.001
Calcium (mg/dL)9.24 ± 0.859.04 ± 0.900.039
Phosphorus (mg/dL)4.89 ± 1.424.48 ± 1.430.010
iPTH (pg/mL) a206.70 (78.20–490.35)202.20 (98.50–422.18)0.597
Ferritin (ng/mL) a404.50 (233.05–615.85)420.75 (287.05–719.38)0.087
Kt/V (n, %)
≥1.7331 (45.04)37 (39.36)0.351
<1.7404 (54.97)57 (60.64)
URR (n, %)
≥0.65699 (95.10)87 (92.55)0.422
<0.6536 (4.90)7 (7.45)
Cardiothoracic ratio (n, %)
≥0.5369 (50.20)68 (72.34)<0.001
<0.5366 (49.80)26 (27.66)
a Median (interquartile range). p-value was estimated using an independent two-sampled t-test or chi-squared test, as appropriate. TSA: time-averaged serum albumin, DM: diabetes mellitus, BUN: blood urine nitrogen, iPTH: intact parathyroid hormone, URR: urea reduction ratio.
Table 2. Univariate logistic regression analysis for time-averaged serum albumin (TSA) category.
CharacteristicsComparisonUnadjusted
OR95% CIp
Dialysis vintageyears0.970.93–1.010.173
Ageyears1.071.05–1.09<0.001
GenderFemale vs. Male1.460.94–2.290.094
DMYes vs. No1.821.15–2.840.009
Blood analysis
Hemoglobing/dL0.780.66–0.910.002
BUNmg/dL0.970.96–0.99<0.001
Creatininemg/dL0.660.59–0.73<0.001
Potassiummeq/L0.540.39–0.74<0.001
Calciummg/dL0.750.58–0.970.029
Phosphorusmg/dL0.810.69–0.950.009
iPTHpg/mL0.99990.9994–1.00030.630
Ferritinng/mL1.00050.99996–1.000950.059
Kt/V≥1.70 vs. <1.700.790.51–1.220.298
URR≥0.65 vs. <0.650.640.29–1.610.298
Cardiothoracic ratio≥0.50 vs. <0.502.591.63–4.24<0.001
DM: diabetes mellitus, BUN: blood urea nitrogen, iPTH: intact parathyroid hormone, URR: urea reduction ratio.
Table 3. Multivariate logistic regression analysis for time-averaged serum albumin (TSA) category based on different feature selection approaches.
CharacteristicsComparisonFully Adjusted ModelStepwise ModelWOFS Model
OR95% CIpOR95% CIpOR95% CIp
Dialysis vintageyears1.030.97–1.080.322
Ageyears1.051.02–1.07<0.0011.041.02–1.07<0.0011.041.02–1.060.001
GenderFemale vs. Male0.940.54–1.660.832
DMYes vs. No1.110.64–1.890.708
Blood analysis
Hemoglobing/dL0.870.72–1.060.1690.880.73–1.060.172
BUNmg/dL1.000.98–1.020.877
Creatininemg/dL0.720.62–0.83<0.0010.720.64–0.82<0.0010.710.63–0.80<0.001
Potassiummeq/L0.690.49–0.970.0330.700.50–0.960.0270.680.49–0.930.016
Calciummg/dL0.780.57–1.050.103
Phosphorusmg/dL1.040.85–1.270.685
iPTHpg/mL1.000.99–1.000.371
Ferritinng/mL0.990.99–1.000.645
Kt/V≥1.70 vs. <1.700.630.39–1.090.1010.580.35–0.940.0290.570.35–0.910.021
URR≥0.65 vs. <0.650.550.22–1.560.232
Cardiothoracic ratio≥0.50 vs. <0.501.610.94–2.800.0861.600.96–2.720.0791.671.01–2.840.051
Optimal AIC 511.96499.25499.14
WOFS: whale optimization algorithm-based feature selection model, AIC: Akaike information criterion, DM: diabetes mellitus, BUN: blood urea nitrogen, iPTH: intact parathyroid hormone, URR: urea reduction ratio.
Publisher’s Note: MDPI stays neutral with regard to jurisdictional claims in published maps and institutional affiliations.

