Article

Estimating the Conditional Density in Scalar-On-Function Regression Structure: k-N-N Local Linear Approach

1
Department of Mathematics, College of Science, King Khalid University, Abha 62529, Saudi Arabia
2
Statistical Research and Studies Support Unit, King Khalid University, Abha 62529, Saudi Arabia
3
Laboratoire AGEIS, Université Grenoble Alpes (France), EA 7407, AGIM Team, UFR SHS, BP. 47, CEDEX 09, F38040 Grenoble, France
*
Author to whom correspondence should be addressed.
Mathematics 2022, 10(6), 902; https://doi.org/10.3390/math10060902
Submission received: 4 February 2022 / Revised: 27 February 2022 / Accepted: 5 March 2022 / Published: 11 March 2022
(This article belongs to the Section Probability and Statistics)

Abstract

:
In this study, the problem of conditional density estimation of a scalar response variable, given a functional covariable, is considered. A new estimator is proposed by combining the k-nearest neighbors (k-N-N) procedure with the local linear approach. Then, the uniform consistency in the number of neighbors (UNN) of the proposed estimator is established. Such result is useful in the study of some data-driven rules. As a direct application and consequence of the conditional density estimation, we derive the UNN consistency of the conditional mode function estimator. Finally, to highlight the efficiency and superiority of the obtained results, we applied our new estimator to real data and compare it to its existing competitive estimator.

1. Introduction

Functional data analysis (FDA) has acquired a great deal of consideration in the last few years. We cite, for instance, some precursor contributions developed by [1,2,3], as well as some recent advances published in the special issues [4,5]. In this data analysis area, the nonparametric fitting is actually in intensive development (see, for examples, [6,7], among others). While many of the works in this field consider nonparametric estimation of the functional models by employing the kernel estimation method, we are interested in estimating the conditional density using the method of local linear (L-L) estimation smoothed by the k-nearest neighbors procedure (k-N-N).
The subject of this paper is an intersection between three emergent fields in statistical mathematics: functional statistics, local linear modeling, and the nearest number neighborhood. The first axis regarding the functional statistics analysis is in a colossal development. Indeed, to cite a few recent advances in this year, we refer to [8], who proposed to estimate the mean and the covariance function using the full quasi-likelihood and the kernel method. Ref. [9] used the functional Horvitz–Thompson estimator to approximate the confidence bands for the mean of curves. As a real-life application, they used their approach to fit the tourists’ daily expenditure in the Majella National Park in Italy. We refer to [10] for the quantile estimation in multivariate functional data. They constructed a new estimator obtained by combining nonparametric techniques, the time-varying coefficient model, and basic functions. Such an estimator is employed in air pollution forecasting and is used for estimation and prediction. For practical purposes, [11] provided a new clustering algorithm, allowing them to proceed without the normality assumption of the random function. Concerning the local linear analysis, a recent advance can be found in [12]. They studied an estimation of the volume under an ROC surface using a semiparametric regression model. In this cited work, the local linear approach is used to estimate the nonparametric competence of the location-scale regression models. Ref. [13] considered the local linear estimator of the derivative of the quantile regression. Estimation of semi-varying coefficient models for longitudinal data was studied by [14]. They established the asymptotic property of the estimator whose nonparametric component is obtained by the local linear approach. The third axis of this paper concerns the estimation of the nearest number neighborhood. The latter has been developed as a flexible tool for many practical issues in applied statistics. In particular, it was used in clustering analysis in [15], in classification by [16], and in learning machine by [17], among others.

1.1. Related Works

On one hand, among the wide existing literature in nonparametric functional statistics, we cite, for instance, [18], that considers the nonparametric estimation of the generalized regression function when the regressors are sampled from a continuous time process valued in semimetric space. They established the suboptimal rate of the L 2 consistency of the constructed estimator. Ref. [19] investigated another nonparametric functional model. They studied the recursive version of the kernel estimator of the density function without condition. They stated the asymptotic properties of the constructed estimator when the functional observations are spatially correlated. We return to [20] for an exhaustive overview in spatio-functional data analysis and its feasibility as an attractive approach in spatial big data modeling. Considering the ergodicity structure, [21] show the uniform consistency of the nonparametric estimator of functional modal regression. For recent results, Ref. [22] have established the asymptotic properties of the conditional density for continuous time processes valued in functional space. As application, they derived the convergence of the conditional mode and the conditional expectation. An alternative estimation of the conditional density was studied by [23]. They used Galerkin algorithm to provide an efficient cross-validation procedure for the bandwidth parameter choice. Their estimator was constructed using B-spline basis. We refer to [24] for new ideas on the nonparametric estimation in functional statistics. In particular, he combined the Bayesian procedure with nonparametric approach to estimate the regression function when the error is correlated. For the same regression function, [25] investigated another nonparametric technique based on recursive procedure with two timescales. He states the stochastic property of the constructed estimator and he compares it to the single timescale recursive estimator through simulated data. For practical issues, the functional statistics ideas have been used to model some clinical data by [26]. More precisely, they used the functional smoothing to analyze the dynamics of COVID-19 in different French departments. To this end, let us refer the reader interested by the recent advances in nonparametric functional data analysis to some survey papers or some special issues [7,27,28], among others.
On the other hand, motivated by its small bias property, the local linear estimation method has earned great attention in the FDA literature. In fact, this interest was started by [29] who established the mean quadratic consistency of the L-L estimator (L-L-E) of the regression operator, assuming that the regressor is valued in a Hilbert space. Next, the almost complete (a.co.) consistency of an alternative version of this estimator, based on covariate values in a Banach space, was proven by [30]. After that, Ref. [31] studied the strong consistency of a functional L-L-E of the conditional density and then gave its leading term in the mean square error in [32]. Furthermore, the k-N-N smoothing method has been introduced, in the field of FDA, by [33]. Since this pioneering work, many authors have become concerned with the nonparametric estimation method of the functional models based on the k-N-N approach (see, for example, the recent works [34,35] and references therein). It is well known that this smoothing method is well adapted to functional data because this approach has a sophisticated bandwidth selection method. In fact, the smoothing parameters are locally chosen concerning the vicinity of the functional data, allowing their local structure exploration.

1.2. Contribution

In this paper we wish to take the benefit of both methods in order to develop a sophisticated and comprehensive estimator of the conditional density. The idea is, therefore, to combine the two approaches, starting from the advantages of the two techniques. Thus, the novelty of this study is to proposed a new estimator of the functional conditional density by combining both the L-L approach and the k-N-N smoothing method. Such a combination allows us to obtain an attractive estimator with a small bias and overcome the bandwidth selection problem. However, there are two big challenges which are related to this new estimator: (i) in contrast to the kernel approach, where the smoothing parameter is a fixed scalar, the chosen bandwidth parameter is a random variable, making the study of the asymptotic properties of the k-N-N method more challenging than in the kernel approach, and (ii) the number of neighbors that define the bandwidth parameter is deterministic, whereas, in practice, the optimal one varies with respect to the data. Thus, traditional asymptotic properties obtained with a fixed number of neighbors are insufficient to cover the practical case. Therefore, the main objective of this study is to establish the a.co. consistency of the built estimator uniformly, concerning the number of neighbors, which allows us to incorporate the practical case.

1.3. Organization

In the remainder of this paper, we present our built estimator in Section 2, and our main results are presented in Section 3. Then, in Section 4, we emphasize the direct impact of our results in nonparametric functional data analysis. Finally, a practical implementation of the constructed estimator is studied in Section 5. The proof of the intermediate results is given in the Appendix.

2. Methodology: Notations and Necessary Background Knowledge

2.1. Model and Its Estimator

Assume n couple of sequence X i , Y i i = 1 , 2 , , n taken from the random variables ( X , Y ) . The latter pair is valued in the functional space F × , where F is assumed to be a semi-metric space equipped with a semi-metric d. In the sequel, denote by X a fixed curve in F , X a neighborhood of X , and set by B ( X , r ) the closed ball in the semi-metric space ( F , d ) . The X and r are, respectively, the center and the radius of the ball B ( X , r ) . Further, we assume that the distribution of Y given X is absolutely continuous and has a conditional probability density (CPD) f ( · | X ) such that:
There exist b 1   b 2   ( 0 , 1 ] such that, for all ( X 1 , X 2 ) X × X and ( y 1 , y 2 ) 2 ,
| f ( y 1 | X 1 ) f ( y 2 | X 2 ) | C d b 1 ( X 1 , X 2 ) + | y 1 y 2 | b 2 .
The present paper aims to estimate the CPD using the L-L algorithm. The idea of this algorithm is based on linear approximation of the function f ( · | X ) . The L-L algorithm is performed in vectorial case under the Taylor expansion of f ( · | X ) . Such expansion is not available in FDA. Instead, we suppose that:
For all X 0 X , and for all y ,
  y ,     f ( y | X 0 ) = a ( y | X ) + b ( y | X ) d ( X 0 , X ) + o ( d ( X 0 , X ) ) .
Observe that both regularity Assumptions (1) and (2) are standard condition in this context of functional local linear analysis. They are verified for many class of conditional density function. For example, it is verified when the conditional density of Y given X is exponential distribution with parameter λ = R ( X ) , when R ( · ) is Gateaux differentiable. Now, the L-L-k-N-N estimators of the functionals a ( y | X ) and b ( y | X ) are minimizers of
min ( a , b ) 2 i = 1 n l 1 K ( l 1 ( y Y i ) ) a b d ( X i , X ) 2 K ( k 1 d ( X , X i ) ) ,
where K is a real function of class C 1 supported within the interval (0, 1/2) and ( k , l ) are the k-N-N smoothing parameters defined by
k = min { + ,   s u c h   t h a t   i = 1 n   𝟙 B ( X , ) ( X i ) = k } , a n d l = min { + ,   s u c h   t h a t   i = 1 n   𝟙 ( y ,   y + ) ( Y i ) = l } .
Taking X 0 X one obtains f ( · | X ) = a ( y | X ) . Then b ( y | X ) is a kind of derivative of f ( · | X ) with respect to X . Thus, (3) estimates f ( · | X ) and b ( y | X ) . Both estimators can be explicitly expressed. Indeed, we have
L t = 1 , 1 , , 1 d ( X 1 , X ) , d ( X n , X ) , K = K ( k 1 d ( X , X 1 ) ) , 0 , , 0 0 , , 0 , K ( k 1 d ( X , X n ) ) ) , a n d Υ = l 1 K ( l 1 ( y Y 1 ) ) l 1 K ( l 1 ( y Y n ) ) .
Using the partial derivative to show that the minimizers of (3) are zeros of
L t K Y K L a ^ ( y | X ) b ^ ( y | X ) = 0 .
It follows that a ^ ( y | X ) b ^ ( y | X ) = ( t L K L ) 1 ( t L K Y ) . Hence, a ^ ( y | X ) = ( 1 , 0 ) ( t L K L ) 1 ( t L K Y ) . Therefore, the L-L-k-N-N estimator of f ( y | X ) is
f ˜ ( y | X ) = i , j = 1 n W i j ( X ) K ( l 1 ( y Y j ) ) l i , j = 1 n W i j ( X ) ,
where
W i j X = d ( X i , X ) d ( X i , X ) d ( X j , X ) × K ( k 1 d ( X , X i ) ) K ( k 1 d ( X , X j ) ) ,

2.2. Functional Statistics Framework: General Assumptions

Our primary goal in this study is to establish the a.co. consistency of f ˜ ( y | X ) uniformly with respect to the numbers of neighbors ( k , l ) ( k 1 , n , k 2 , n ) × ( l 1 , n , l 2 , n ) . To achieve this, we use C and C′ to denote some strictly positive generic constants, S a compact subset of , and we introduce the following class of functions, for ι = 0 , 1 , 2     a n d     κ = 0 , 1 ,
K ι , κ = · 1 , · 2 γ ι K ( γ 1 d ( X , · 1 ) ) d ι · , X × λ κ K κ ( λ 1 ( y · 2 ) ) ,   γ > 0 , λ > 0 .
Throughout this paper, we denote by N ( ϵ , C , . L 2 ( Q ) ) the minimal number of open balls (with radius ϵ ) which is essential to cover the set of functions C with respect to the L 2 ( Q ) metric. Moreover, for any application ψ : C I R , we set ψ C = sup g C | ψ ( g ) | . The basic assumptions which are needed to establish the results are commented on in the rest of this section.
Assumption 1.
Functional Regressor Condition
r > 0 , P X B ( X , r ) : = ζ X ( r ) > 0   a n d   s ( 0 , 1 ) , lim r 0 ζ X ( s r ) ζ X ( r ) = τ X ( s ) s u c h   t h a t   K ( 1 / 2 ) τ X ( 1 / 2 ) 0 1 / 2 K ( s ) τ X ( s ) d s > 0 , a n d   ( 1 / 4 ) K ( 1 / 2 ) τ X ( 1 / 2 ) 0 1 / 2 ( s 2 K ( s ) ) τ X ( s ) d s > 0 ,
Such condition is classic in the asymptotic theory of nonparametric functional statistics. Indeed, the first part of this condition is a fundamental tool in this setting (cf. [2] for a deeper discussion and more comments on this hypothesis). Recall that all the asymptotic results, in this topic, are expressed together with this quantity. The second part is also considered in many papers treating the nonparametric functional statistics (cf., for instance, [36]). The reader will find in [36] several examples on the small ball probability function, for which Assumption 1 is verified.
Assumption 2.
Measurability Condition
For ι = 0, 1, 2 and κ = 0, 1, the class of functions K ι , κ are pointwise measurable classes. Notice that this weak condition of measurability is very important in our context. In fact, it allows us to express our claimed results in their usual form under the classical definition of the probability notion and then to avoid the complicated notion of outer probability or outer expectation (cf. [37]).
Assumption 3.
Entropy Condition
sup Q 0 1 1 + log N ( ϵ F ι , κ L 2 ( Q ) , K ι , κ , . L 2 ( Q ) ) d ϵ <
where F ι , κ is the envelope function of the class K ι , κ and . L 2 ( Q ) is the L 2 ( Q ) norm. We point out that the supremum takes all probability measures Q in the functional space F with Q ( F 2 ) < . Elsewhere, it is well known that the asymptotic uniformity is closely linked to the notions of entropy and of compactness. The UNN consistency will then be obtained under a uniform entropy integral condition. Indeed, the uniform entropy integral condition is used to characterize the Donsker classes of functions (cf. [37]) in order to derive the uniform low limit or to evaluate the moment of the empirical processes. Notice that this consideration is frequently used in some similar contexts where one can find several versions. Moreover, it is more general than the VC-class condition (cf. [38]).
Assumption 4.
The Smoothing Parameter Condition
The sequences k 1 , n ,   k 2 , n ,   l 1 , n ,   a n d   l 2 , n verify: l 2 , n n 0 ,     ζ X 1 k 2 , n n 0 and
n log n l 1 , n min n ζ X 1 k 1 , n n , k 1 , n , n ϑ 1 l 1 , n ,
for some ϑ > 0.
All these general assumptions are sufficiently weak relative to the different objects involved in the statement of our uniform consistency results. They cover and exploit the principal axes of this contribution, which are the topological structure of the functional variables, the probability measure in this functional space, the measurability concept on the class of function, and the uniformity controlled by the entropy propriety

3. Main Result and Proof

Then, the UNN consistency of f ˜ ( · | X ) is stated with its proofs in Theorem 1, below.
Theorem 1.
Based on Assumptions (1–4), we obtain sup k 1 , n k k 2 , n sup l 1 , n l l 2 , n sup y S | f ˜ ( y | X ) f ( y | X ) | = O ζ X 1 k 2 , n n b 1 + O l 2 , n n b 2 + O a . c o . n log n l 1 , n k 1 , n .
Proof of Theorem 1.
Set, for a fixed α ] 0 , 1 [ , that
z n = ζ X 1 k 2 , n n b 1 + l 2 , n n b 2 + n log n l 1 , n k 1 , n ,
where
4 a n = ζ X 1 α k 1 , n n , b n = ζ X 1 k 2 , n n α , c n = α l 1 , n n   a n d   d n = l 2 , n n α .
Thus, for all ϵ > 0, we obtain
P sup k 1 , n k k 2 , n sup l 1 , n l l 2 , n sup y S | f ˜ ( y | X ) f ( y | X ) | ϵ z n P sup k 1 , n k k 2 , n sup l 1 , n l l 2 , n sup y S | f ˜ ( y | X ) f ( y | X ) | × 1 𝟙 a n k ζ X 1 k 2 , n n α , α l 1 , n n l l 2 , n n α ϵ z n 2 + P k ζ X 1 α k 1 , n n , ζ X 1 k 2 , n n α + P l α l 1 , n n , l 2 , n n α .
The last two probabilities have been evaluated in [35]. Therefore, it suffices to examine the first one. This latter is mainly a consequence of the two lemmas below. □
Lemma 1.
Based on the assumptions of Theorem 1, we obtain
sup c n d n sup a n b n E f ˜ N ( y | X ) f ( y | X ) E f ˜ D ( X ) E f ˜ D ( X ) = O ( b n b 1 ) + O ( d n b 2 ) ,
where
f ˜ N ( y | X ) = 1 n ( n 1 ) ) 2 ζ X 2 ( ) i j W i j ( X , ) K ( 1 ( y Y j ) ) ,
and
f ˜ D ( X ) = 1 n ( n 1 ) ) 2 ζ X 2 ( ) i j W i j ( X , ) .
with W i j ( X , ) = d ( X i , X ) d ( X i , X ) d ( X j , X ) K ( 1 d ( X , X i ) ) K ( 1 d ( X , X j ) ) ,
Lemma 2.
Based on the Theorem 1 assumptions, we have
sup y S sup c n d n sup a n h b n 1 f ˜ D ( X ) | f ˜ N ( y | X ) E [ f ˜ N ( y | X ) ] | = O a . c o . log n n c n ζ X ( a n ) .

4. Discussion on the Impact of the Main Result and Its Usefulness

  • UNN consistency vs. fixed number neighborhood consistency. As discussed in the introduction, kNN smoothing is an important estimation algorithm in nonparametric statistics. Concerning the functional L-L-E of the conditional density, the literature is limited; only the authors of [34] have proposed an estimator based on the Hilbertian version of the local linear approach introduced by [33]. They derived the almost -consistency for the fixed number neighborhood of the proposed estimator. Alternatively, we use here the fast version, which can be adapted for semi-metric space and applied even if the functional variables are discontinuous, unlike the Hilbertian version that requires oversmoothing curves to use the Fourier decomposition. Moreover, we state here the uniform consistency with respect to the number of the neighborhood, which allows us to derive the asymptotic property of the estimator even if this number is random. This last statement has a significant impact in practice. In particular, it covers the realistic situation where the best estimator (that corresponds to the best smoothing parameters, according to the criterion (5)), has a random number neighborhood. Indeed, usually, the best estimator of the conditional density is obtained by using the following cross-validation criterion,
    ( k ˜ C V , l ˜ C V ) = arg min k ( k 1 , n , k 2 , n ) , l ( l 1 , n , l 2 , n ) C V ( k , l ) ,
    where
    C V ( k , l ) = 1 n i = 1 n W 1 ( X i ) f ˜ ( i ) 2 ( y | X i ) W 2 ( y ) d y 2 n i = 1 n f ˜ ( i ) ( Y i | X i ) W 1 ( X i ) W 2 ( Y i )
    with f ˜ ( k ) ( y | X k ) = i , j = 1 i k , j k n W i j ( X k ) K ( 1 l ( y Y i ) ) l i , j = 1 n W i j ( X k ) is the leave-out-one estimator of the conditional density. We point out that this criterion is inspired by the local constant estimation method (see [39] for the vectorial case or [40] for the functional case). Moreover, this rule was also used for the local linear estimator, in the nonfunctional case, by [41]. However, still now there is no mathematical support to justify the optimality of selected parameters by this rule. In fact, all the previous studies fail to guarantee the convergence of the best estimator which is associated with the values of k ˜ and l ˜ because they only treat the simple case when k and l are deterministic, unlike the optimal case k ˜ and l ˜ , which are random variables. Then, the determined uniform consistency result offers the opportunity to derive asymptotic properties of the built estimator even if the smoothing parameter is a random variable. Precisely, we obtain the following corollary.
Corollary 1.
If ( k ˜ C V , l ˜ C V ) ( k 1 , n , k 2 , n ) × ( l 1 , n , l 2 , n ) and if the assumptions of Theorem 1 hold, then we obtain
| f o p t ^ ( y | X ) f ( y | X ) | = O ζ X 1 k 2 , n n b 1 + O l 2 , n n b 2 + O a . c o . n log n l 1 , n k 1 , n ,
where
f o p t ^ ( y | X ) = i j W i j ( X , k ˜ C V ) K ( l ˜ C V 1 ( y Y j ) ) l ˜ C V i j W i j ( X , k ˜ C V )
Notice that this result has at least one practical interest since it gives a mathematical justification to the previous cross-validation selection rule.
  • Local linear estimator vs. classical kernel estimator. The second advantage of our proposed estimator is the fact that the estimator for the conditional density is constructed by combining two excellent algorithms: the k-N-N smoothing technique and the L-L approach. Such consideration permits accumulation of the advantages of the two approaches. In particular, the k-N-N method allows obtaining flexibility in the bandwidth selection, which is adapted to the local structure of the functional data. Precisely, the smoothing parameter is locally selected with respect to the vicinity at the conditioning point, which allows to take into account the local behavior of the data. Despite the practical interest of this approach in functional statistics, it is not fully explored in this field. The first result on the functional conditional mode estimation was determined by [42]. They study the asymptotic properties of the kNN version of the functional Nadraya–Watson estimator. As an alternative, we use in this paper the L-L estimation method. Note that the bias that produced by the L-L method is smaller that that for the standard kernel method. This merit is also produced in the UNN consistency. Indeed, if we replace the regularity Assumption (2), for all Z X , by f ( y | Z ) = f ( y | X ) + b d ( Z , X ) + c d 2 ( X , Z ) + o ( d 2 ( X , Z ) ) , and then use i , j = 1 n d ( X j , x ) W i j ( X ) = 0 , to reformulate the estimator f ˜ x bias term as follows:
    E f ˜ ( y | X ) f ( y | X ) = E i , j = 1 n W i j ( X ) 1 K ( 1 ( y Y j ) ) f ( y | X j i , j = 1 n W i j ( X ) + E i , j = 1 n W i j ( X ) f X j y ) f ( y | X ) + b d ( X j , d ( X , Z ) ) i , j = 1 n W i j ( X ) .
Thus, using the same ideas that we used to prove Theorem 1, we obtain
sup a n b n sup c n d n E f ˜ ( y | X ) f ( y | X ) = O ζ X 1 k 2 , n n 2 + O l 2 , n n 2 .
Significantly, this bias term is better than the standard kernel estimator when one supposes the same regularity assumption.

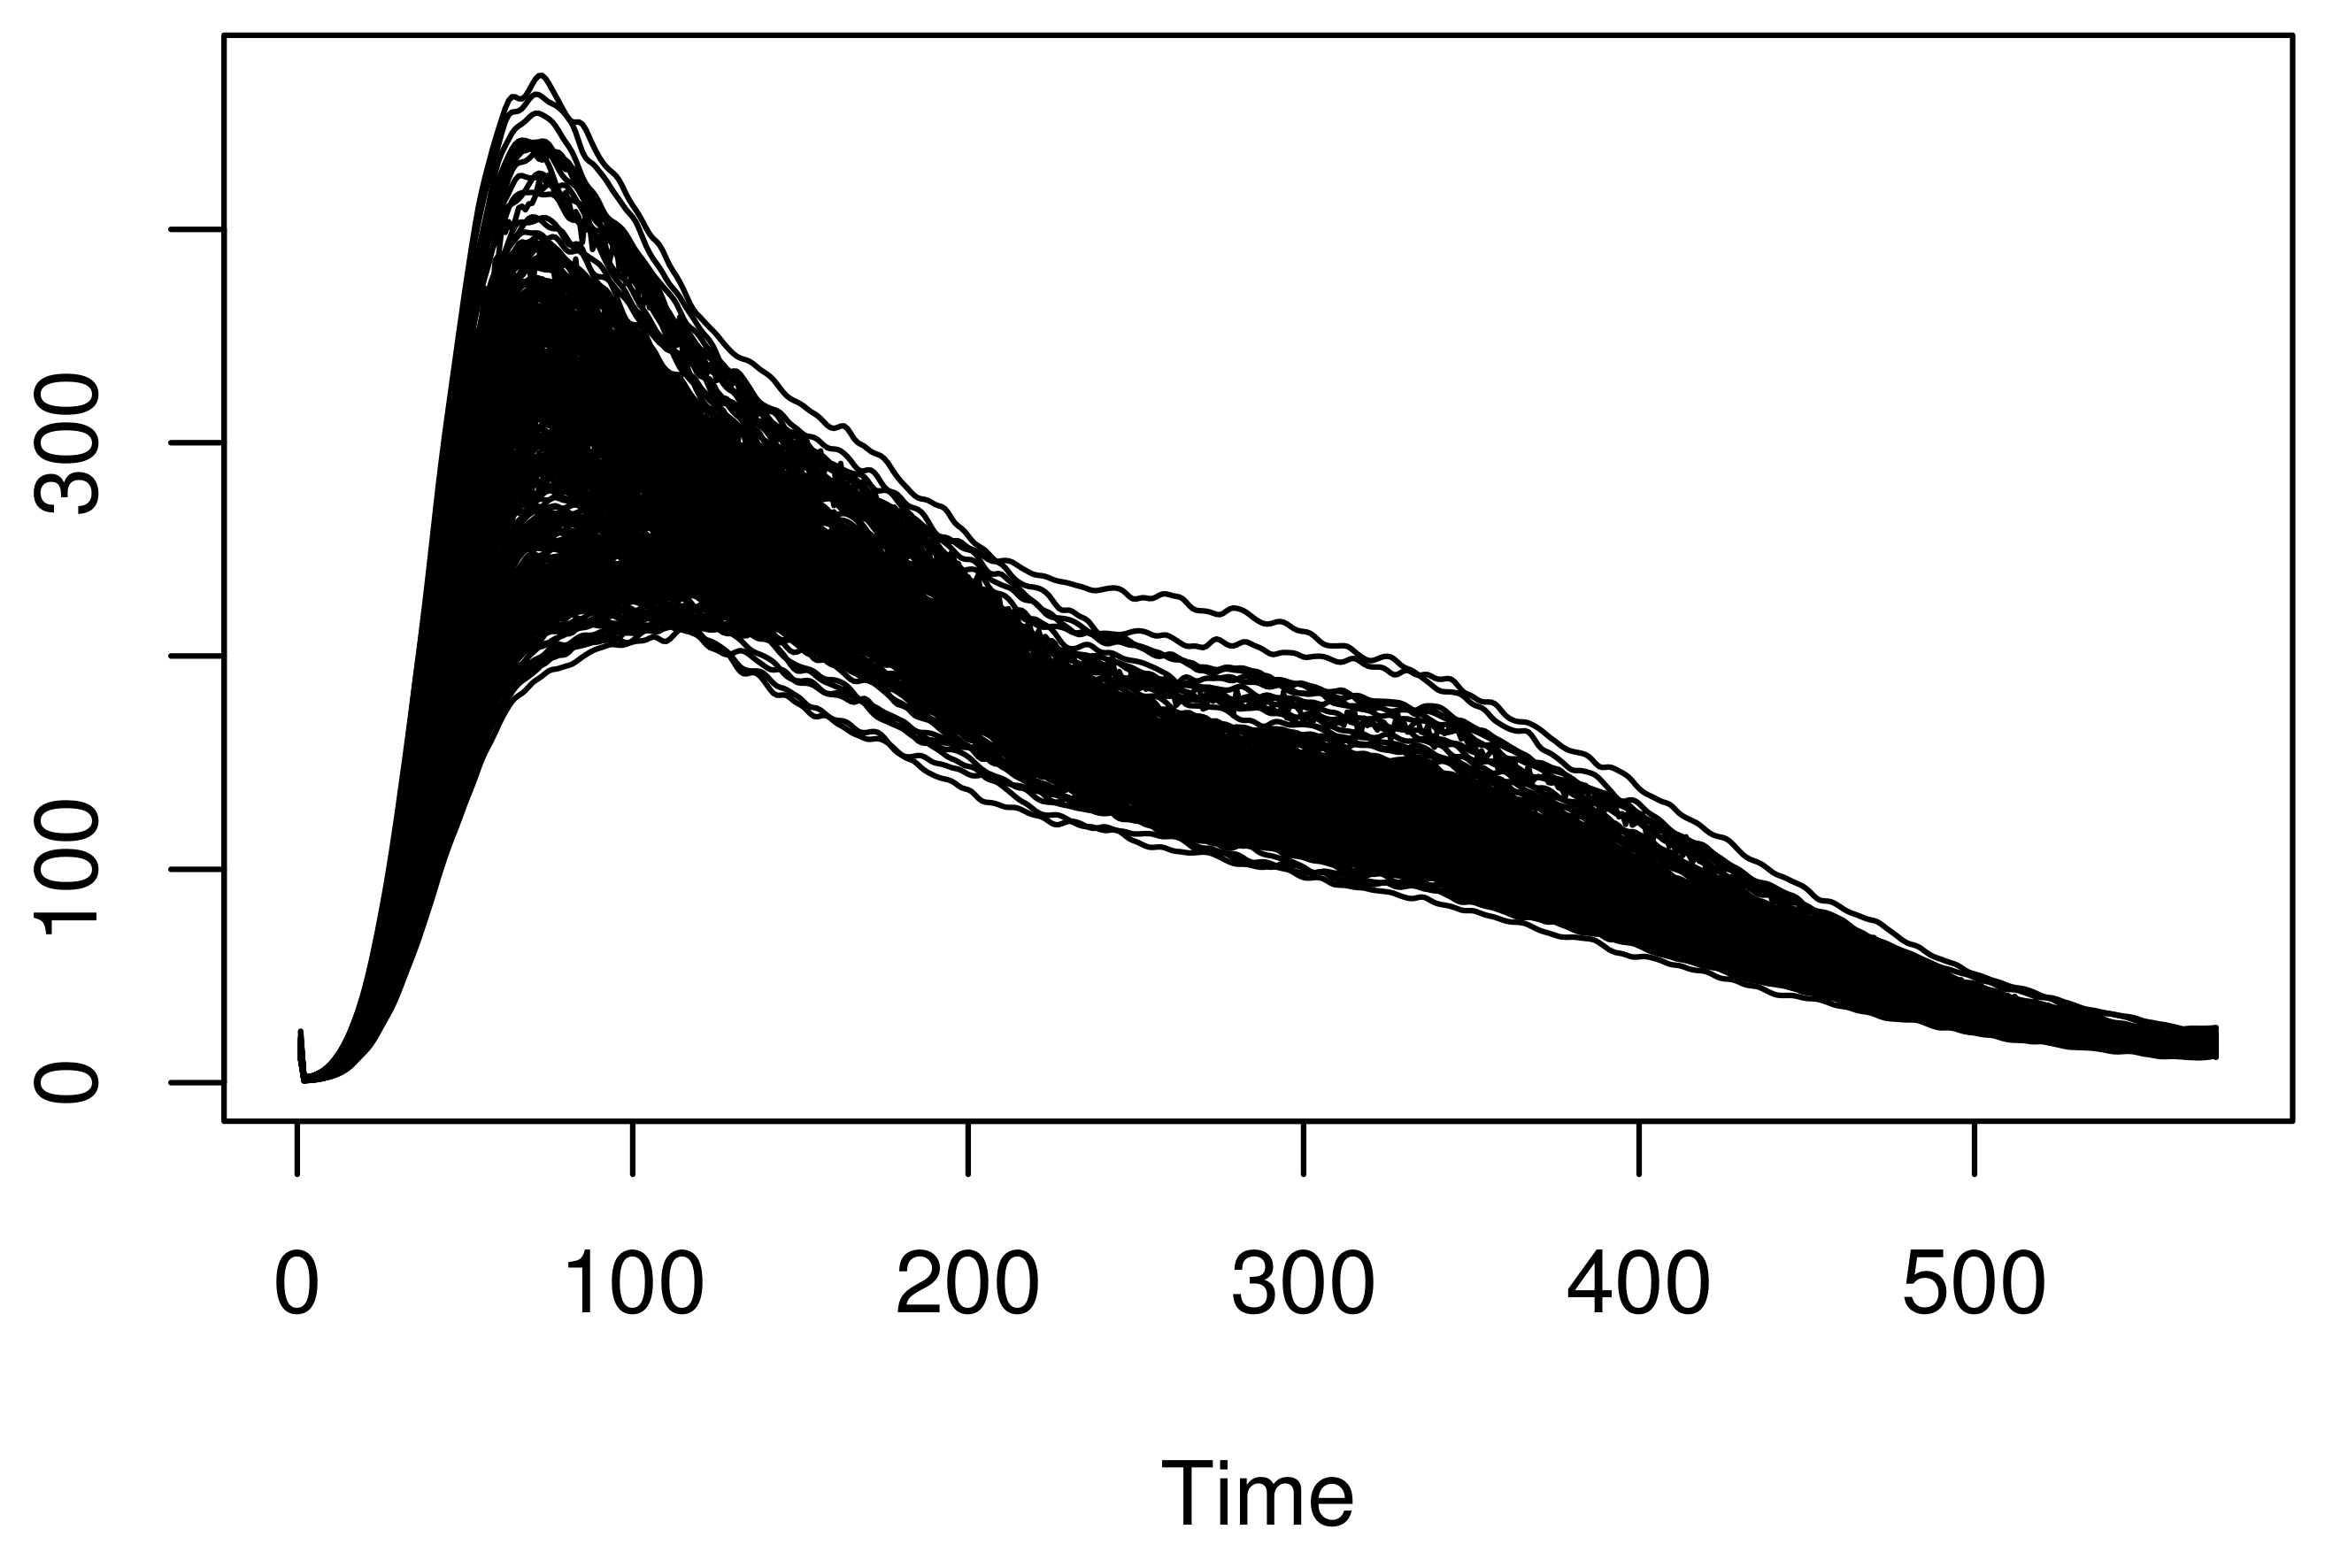
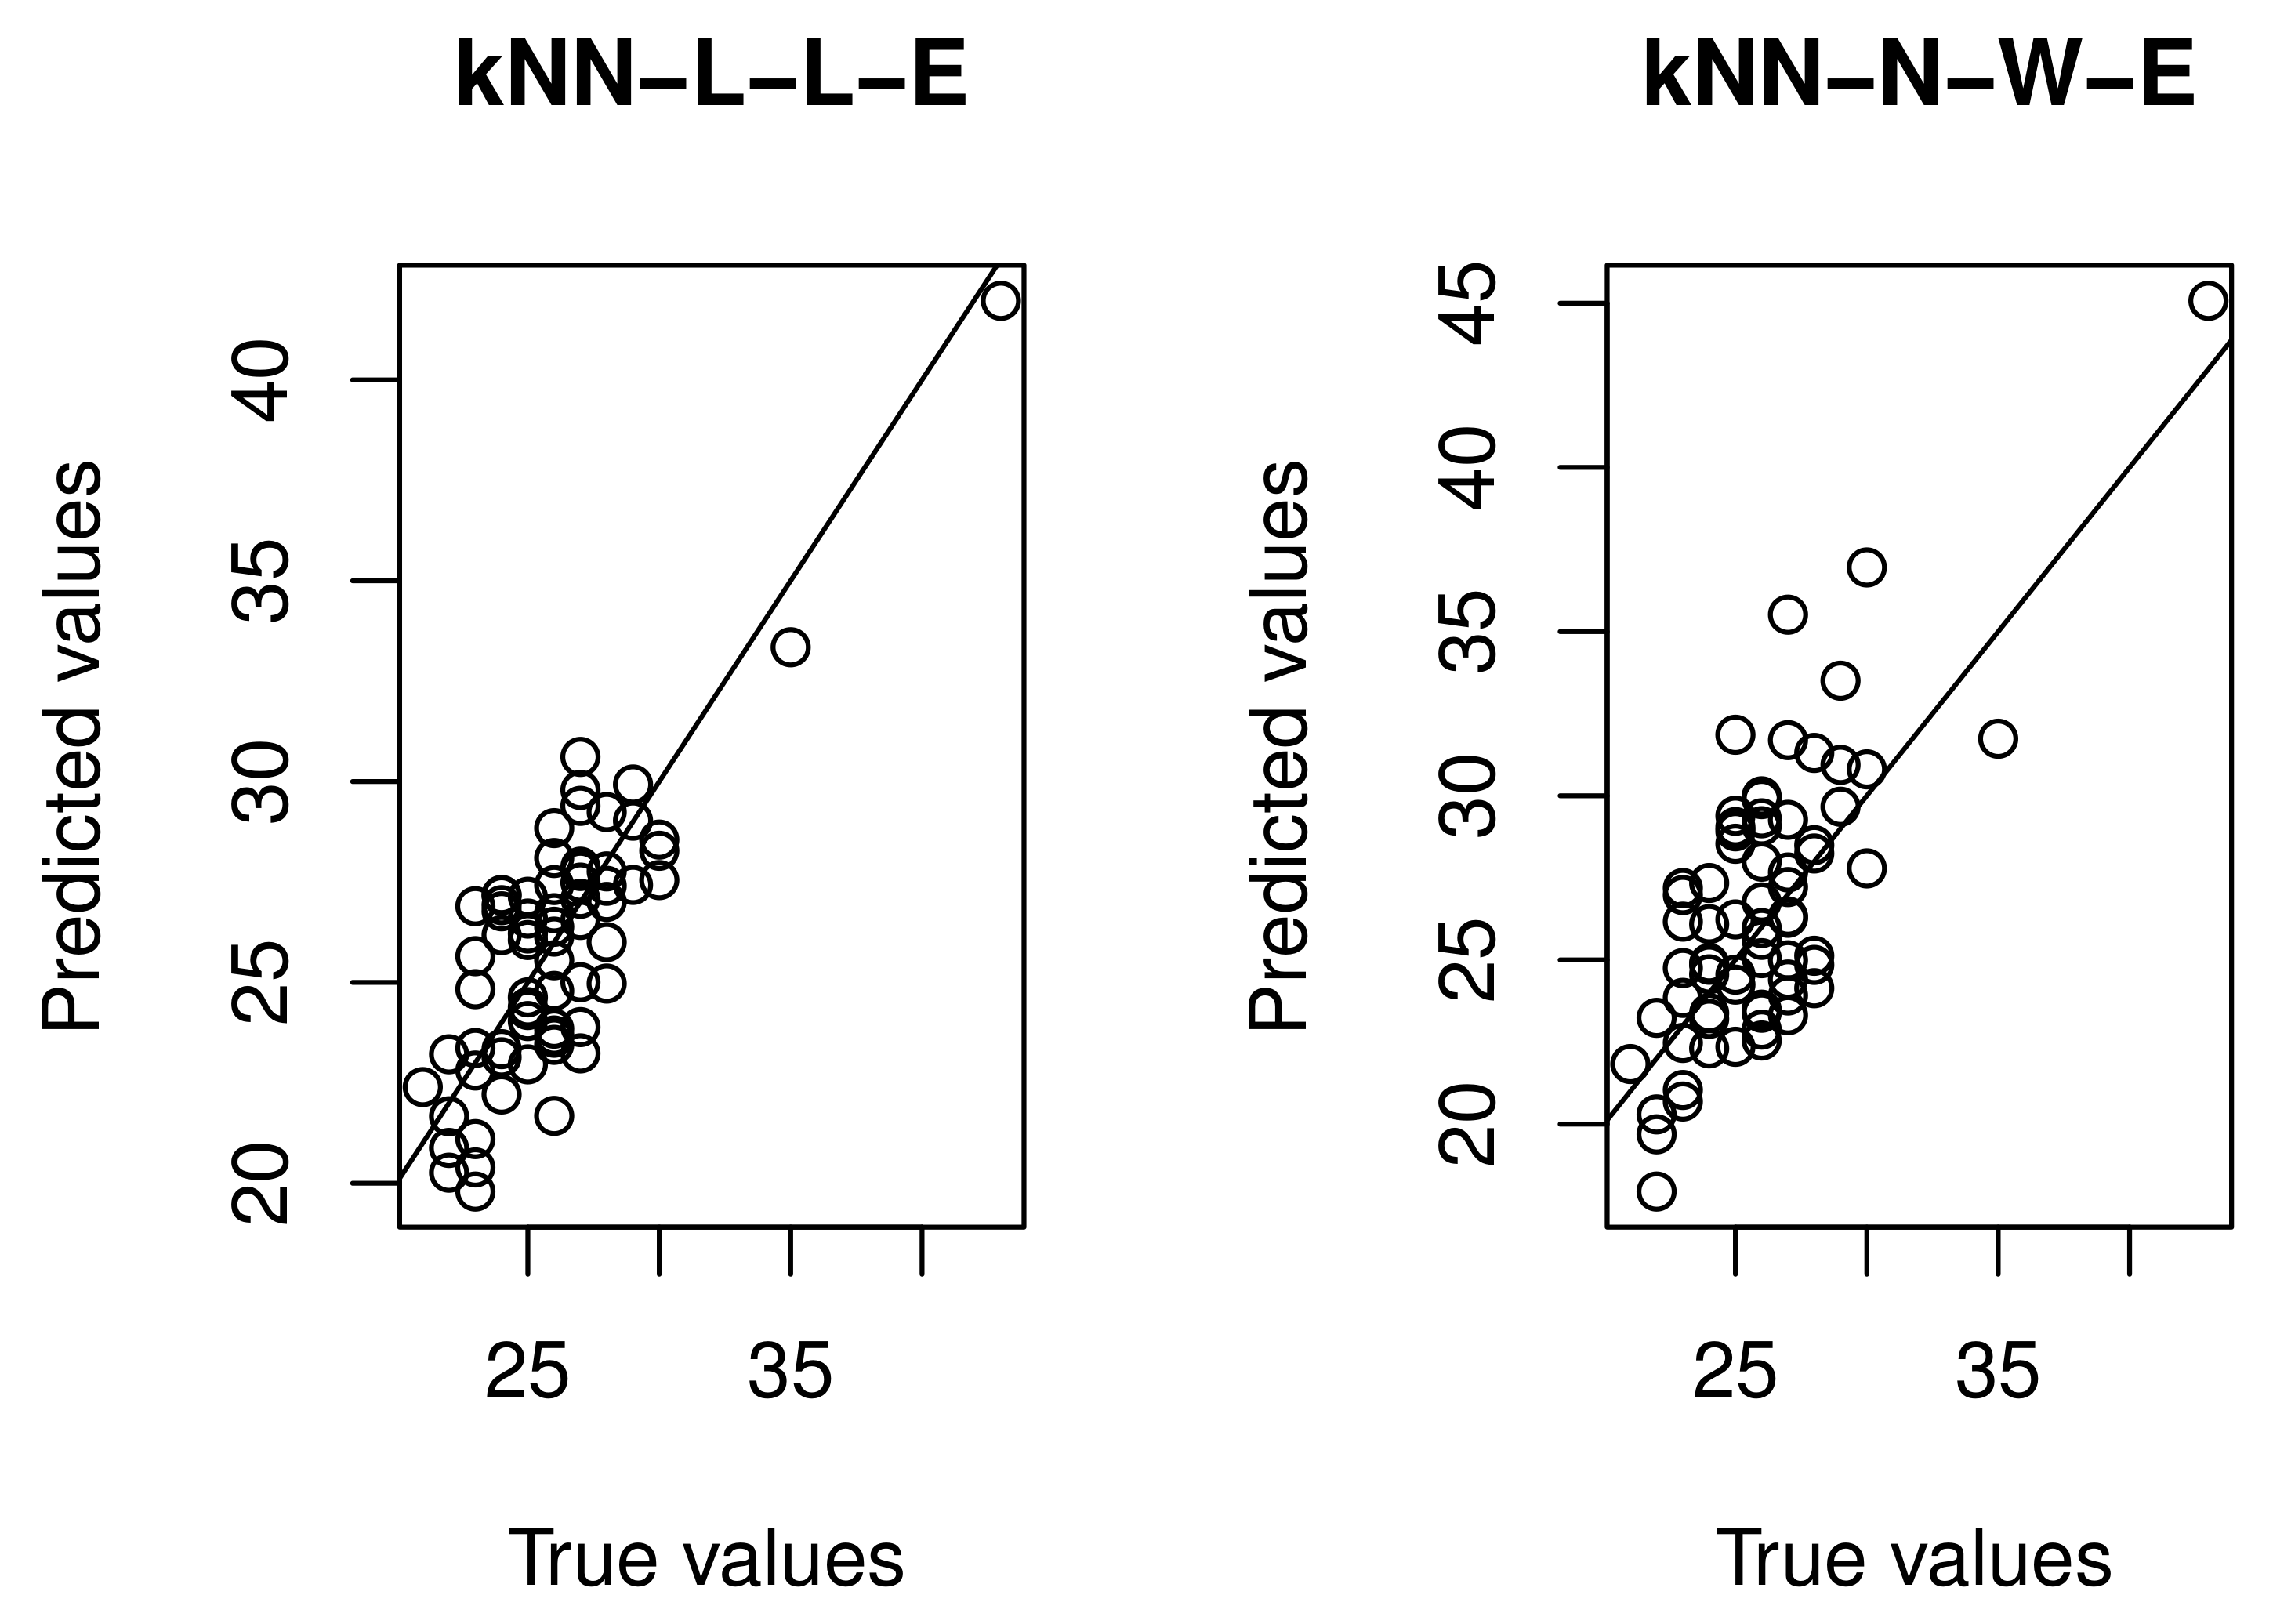
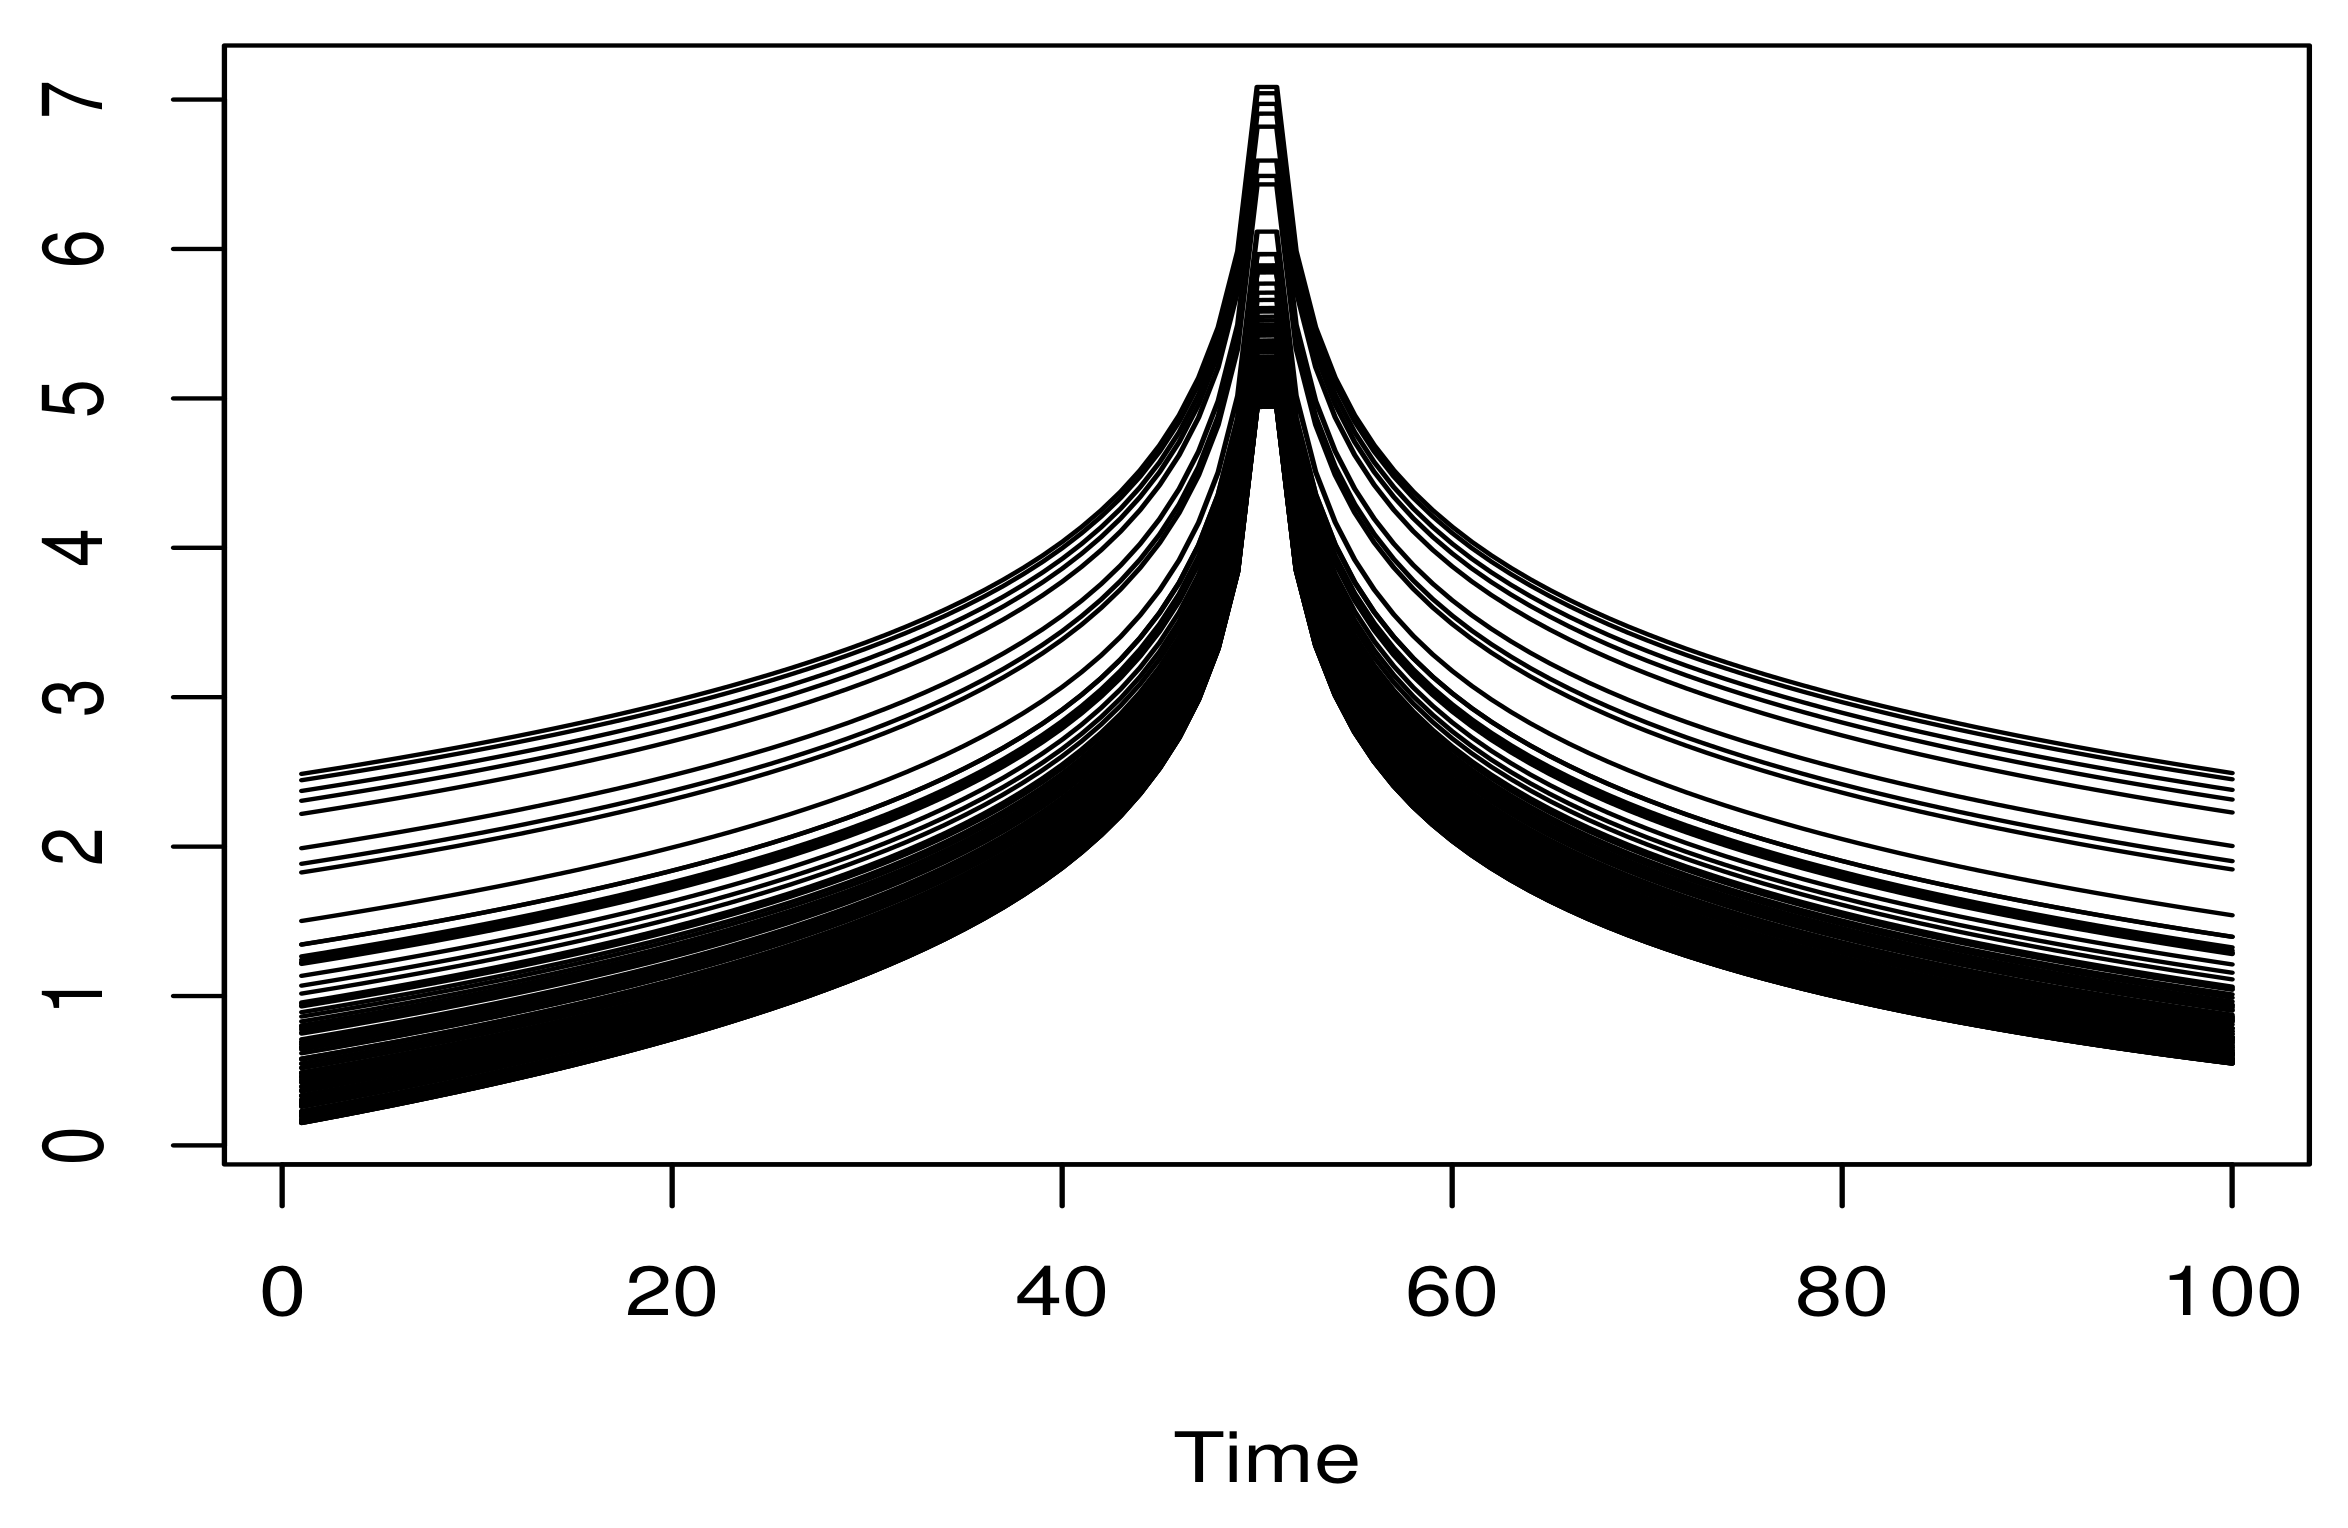
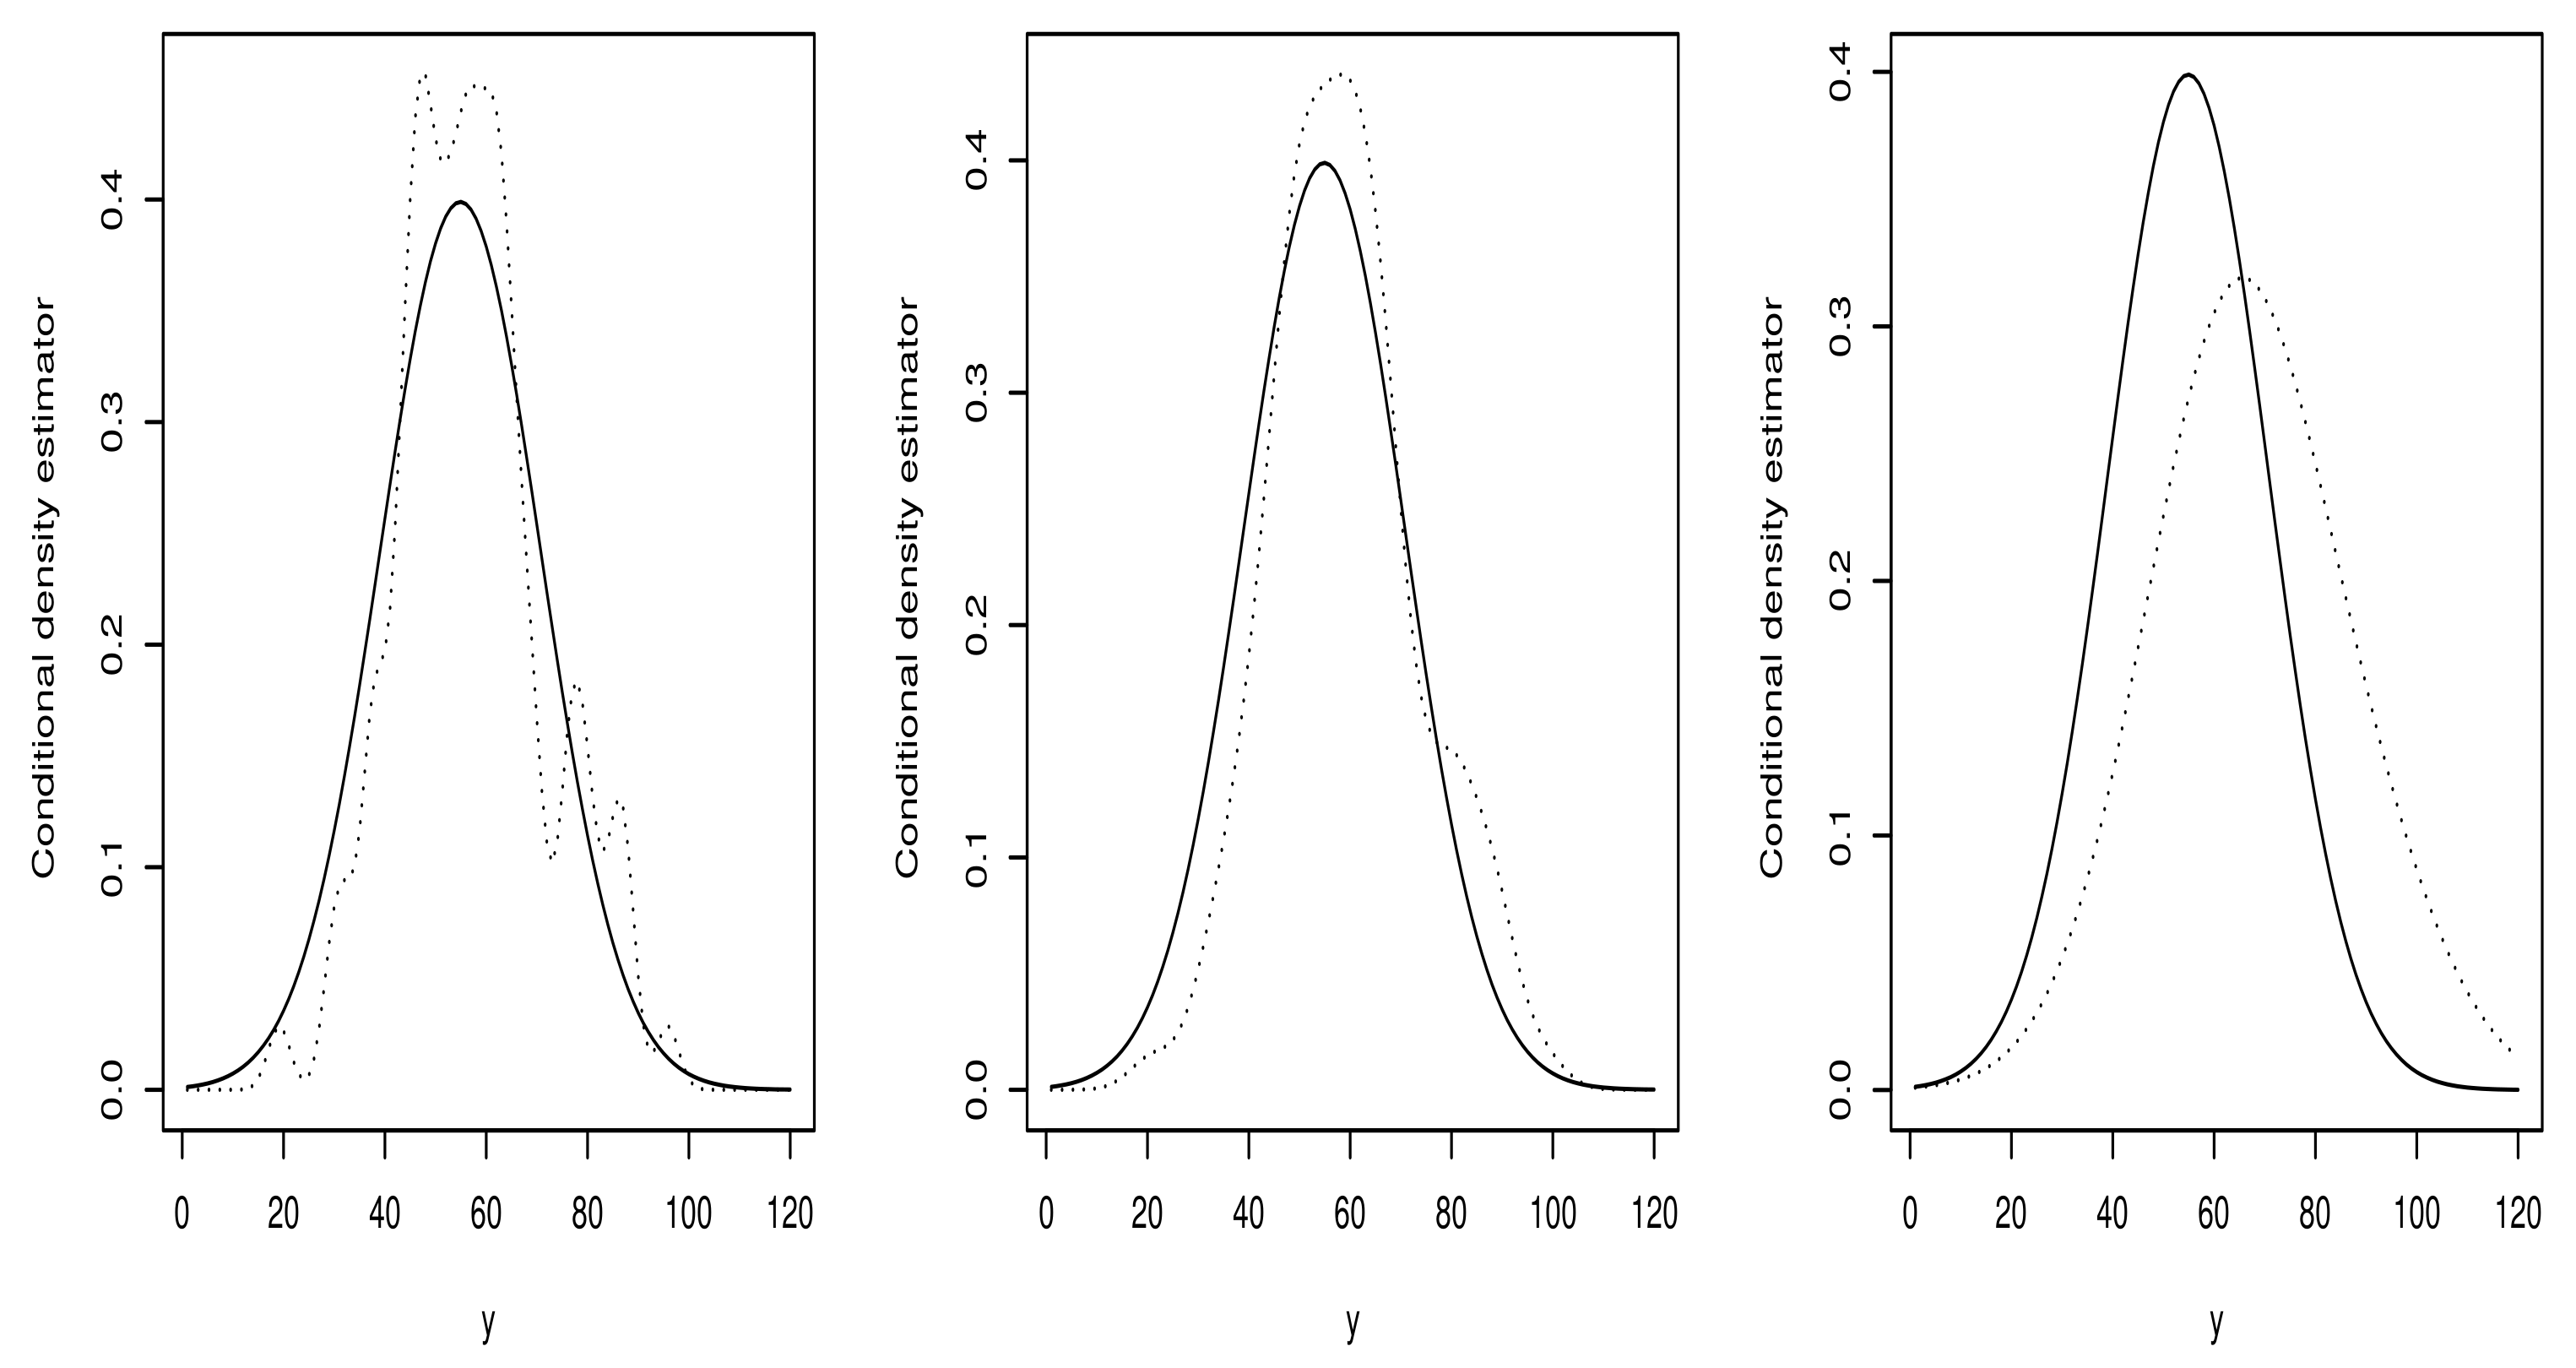
4.1. Empirical Analysis and Simulation Study

This section is devoted to emphasizing the ability to compute the estimator f ˜ ( · | · ) in practice. As mentioned in Section 4, the number of neighborhood (k, l) is the principal element in the estimator f ˜ ( · | · ) . Thus, we focus in this section on evaluation of the impact of this element in the behavior of this estimator. To do that we conduct a Monte Carlo study using artificial data drawn by the following regression model
Y = 1 1 e x p 1 1 + X 2 ( t ) d t + ϵ ,
where ϵ is generated from standard normal distribution N (0, 1). Such consideration permits to explicitly express the conditional density of Y given X by
f ( y | X ) = 1 2 π exp y 1 1 e x p 1 1 + X 2 ( t ) d t 2 2 .
Concerning the functional covariate X , we sampled from the following random curves
X ( t ) = 0.5 l o g ( W t 2 ) + 0.4 W t .   W U n i f o r m ( 0 , 0.5 ) .
All the random curves X i s are discretized 100 equispaced measurements in (−1, 1). The functional curves are plotted in Figure 1.
As discussed in Section 4, the smoothing parameter (k, l) choice is one of the principal issues resolved by the present contribution. Thus, to highlight the importance of the selector Procedure (5) we compare the optimal estimator f o p t ^ ( y | X ) to an arbitrary one obtained by adding an arbitrary number (ı, j) to k ˜ C V , l ˜ C V . This optimal estimator f o p t ^ ( y | X ) is associated with the exact optimal number k ˜ C V , l ˜ C V selected from {5, 10, 15, 20, 25, ⋯ n/2}. Furthermore, the estimator f ˜ ( · | · ) is computed by a quadratic kernel supported within (0, 1) and by considering the L2 metric. The efficiency of the estimator is examined by the Mean Absolute Error (MAE) expressed by M A E = 1 n i = 1 n f ( Y i | X i ) f ˜ ( Y i | X i ) . In Table 1, we compare the MAE of the optimal estimator f o p t ^ ( y | X ) to a different arbitrary one obtained by replacing k ˜ C V , l ˜ C V by k ˜ C V + ı , l ˜ C V + j . The additional number (ı, j) is arbitrary chosen.
Foe more readability of the impact of the selection of the optimal neighborhood number (k, l) we plot the conditional density function f ( · | · ) versus their estimators for the three cases (small values (k, l), optimal values k ˜ C V , l ˜ C V ) , and large values (k, l) and for fixed n = 100.. All these functions are plotted at arbitrary conditioning curves X 0 (randomly choosing).
The MAE presented in Table 1 as well as Figure 2 shows that the choice of the optimal number of neighborhood significantly impacts the efficiency of the estimator f ˜ ( · | · ) . Small value underestimates the function f ( · | · ) giving a rough estimator, while large value overestimates the true conditional density, giving an oversmooth estimator. Finally, and unsurprisingly, even if the efficiency of the optimal estimator decreases with respect to the sample-size n, it has satisfactory finite sample performance for a moderate sample size, n = 500, as well as a large one, n = 200.

4.2. Real Data Application

In this part, we conduct an empirical study based on real data example to compare the behavior of the local linear procedure to the Nadaraya–Watson using the k-N-N smoothing approach. This example studies the sugar quality using near-infrared spectroscopy data. More precisely, we compare the estimator θ ^ to its competitive one proposed by [42], which is defined by θ ¯ ( x ) = arg max i = 1 n K ( h k 1 d ( X , X i ) ) K ( l 1 ( y Y i ) ) l i = 1 n K ( h k 1 d ( X , X i ) ) . Of course, our main goal is to the show the easy implantation of our estimator and to compare the performance of the L-L approach to the Nadaraya–Watson in the prediction setting. For this reason, we use the near-infrared dataset; the data link is provided in the “Data Availability Statement” section. The spectrometric data of this data sample is obtained by PELS50B fluorescence spectrometer using spectra emission from 275–560 nm measured in 0.5 nm intervals at seven excitation wavelengths. For sake of shortness, we use only the last excitation wavelengths. Formally, for this application, we consider as functional regressor X (·) the spectrometry data associated with the 571 emission measurements for the last excitation wavelength (230 nm). The data curves are plotted in Figure 3.
Concerning the choice of the real response variable Y, we point out that there exist lots of parameters to control the sugar quality, such as the sucrose content, ash content, moisture content, or its color in solution. The ash content is the most commonly used. It is determined by conductivity and gives the percentage of the inorganic impurities in refined sugar. Thus, for this prediction issue, we take Y to be the ash content.
Now, to make an equitable comparison between the estimators θ ¯ and θ ^ = arg max f ˜ ( y | X ) , we must deal with both estimators on the same conditions, in the sense that we use the same kernels and the same bandwidth selection rule. In this application study, we used the same rules discussed in [2] and available at http://www.math.univ-toulouse.fr/~ferraty/online-resources.html (accessed on 20 December 2021). Specifically, we used the quadratic kernel on (0, 1), and took d equal to the L 2 metric between the curves. We are certain that the numbers k and I were selected from the subset {5, 15, 25 ⋯, 75, 85, 90}. They were selected by splitting the data into subsets (input sample and output samples (200 + 65). The 200 observations of the input sample (learning sample) were used to select the best k and l by the same cross-validation rule used in [2]. The prediction results are shown in Figure 4, where we display the predicted values versus the actual values for the two estimators.
The two estimators θ ^ and θ ¯ behavior is evaluated by using the Mean square Error (MSE) defined by M S E ( θ ) = 1 65 k = 1 65 ( Y i θ ˙ ( X i ) ) 2 , where ( X i , Y i ) represents the output observations (testing sample) and θ ˙ refers to either θ ^ and θ ¯ . The prediction result shows that the L-L approach has significant superiority over the Nadaraya–Watson method. Such superiority is confirmed by the MSE 3.78 of θ ^ against 5.14 for θ ¯ . This statement is, of course, not surprising because the main aim of the L-L method is to reduce the bias of the Nadaraya–Watson.

5. Conclusions and Perspectives

This new contribution deals with the L-L-k-N-N estimation of the CPD function of a real random variable in scalar-on-function regression structure. The new considered fitting approach is achieved by combining the L-L approach with those employed by the k-N-N weighting procedure. Of course, this idea allows improving the estimator’s efficiency in practice by reducing the bias term of the estimator and overcoming the problem of the selection of the smoothing parameter. Furthermore, the asymptotic results proved in this contribution greatly impact practice. In particular, it gives mathematical support to justify the use of the different cross-validation selectors rules (see Corollary 1).
It should be noted that the estimation of the conditional density is also very useful in practice. In particular, it offers more precious information on the link between the input and the output variables. Indeed, unlike the classical regression that analyzes the central tendency of the data, the conditional density describes the behavior of the center as well as the behavior extremes of the data. Moreover, it has a pivotal role in statistical modelings such as prediction by conditional mode function, interval predictive by shortest conditional modal interval, risk analysis by shortfall expectation model, or association testing. Finally, let us point out that the significance of this contribution is also highlighted by the numerous open questions offered by the present work. We list, for instance, the treatment of the functional time-series case and/or the surface time-series case. Furthermore, the asymptotic distribution of the L-L-k-N-N estimation of the CPD is also an essential prospect of the present contribution.
In addition to the listed prospects, we add some open questions related to the correlation of the functional data. In particular, for the functional time series analysis, it will be very interesting to study the asymptotic properties of this kind of estimator when the data exhibits some correlation assumptions such as the strong mixing structure, the quasi-association dependency, and the ergodicity correlation. Moreover, the L-L-k-N-N estimation of the conditional density in the spatial structure is also an essential prospect of the present contribution. It would be useful in surface time series via the conditional mode or the predictive region. Finally, let us point out that using the L-L-k-N-N estimation to approximate other alternative models is also very beneficial to open tracks for the future. These alternative models include expectile regression, relative error regression, robust regression, median expected shortfall, and regression structure, such as single index model, semi-palatial linear regression, additive regression model, etc.

6. Proofs of the Intermediate Results

Proof of Lemma 1.
By the linearity of the expectation, we have, for all ( a n , b n ) and ( c n , d n ) ,
E f ˜ N ( y | X ) f ( y | X ) E f ˜ D ( X ) = 1 2 ζ X 2 ( ) E W 12 ( X , ) E H 2 ( y ) | X 2 f ( y | X ) ,
where H 2 ( y ) = 1 K ( 1 ( y Y 2 ) ) . Next, we use (1), uniformly on y S , ( a n , b n ) and ( c n , d n ) , to get
𝟙 B ( X , h ) ( X 2 ) | E [ H 2 ( y ) | X 2 ] f ( y | X ) | R K ( t ) b 1 + | t | b 2 b 2 d t .
.
Thus, the claimed result of the above lemma is a consequence of the stationarity of the sample. □
Proof of Lemma 2.
First, start with the compactness property of the subset S that permits to write a sequence ( t k ) k in S. Hence, we have S k = 1 s n ( t k l n ,   t k + l n ) , with l n = n 3 ϑ 2 1 2 a n d s n = O ( l n 1 ) .
Next, for all y S , we place t y = arg min t { t 1 , , t s n } | y t | , and we use the Lipschitz’s condition on the kernel K to obtain
sup a n b n sup c n d n sup y S f ˜ N ( y | X ) f ˜ N ( t y | X ) f ˜ D ( X ) = O log n n d n ζ X ( a n ) .
and
sup a n b n sup c n d n sup y S E [ f ˜ N ( y | X ) ] E [ f ˜ N ( t y | X ) ] f ˜ D ( X ) = log n n d n ζ X ( a n ) .
Thus, to complete the proof, we have to evaluate the quantity
s n max t y { t 1 , , t s n } P sup a n b n sup c n d n f ˜ N ( t y | X ) E [ f ˜ N ( t y | X ) ] > η log n n d n ζ X ( a n ) ,
for some η > 0.
To do that, we place for all t y { t 1 , , t s n } ,   ι = 0 , 1 , 2 ,   κ = 0 , 1 , , Δ i ι , κ = 1 ι κ K ( 1 d ( X , X 1 ) ) d ι ( X 1 , X ) K κ ( 1 ( t y Y 1 ) ) , E K 1 d X , X 1 d ι X 1 , X K κ 1 t y Y 1 ) and we define S ι , κ = 1 n ζ X ( ) i = 1 n Δ i ι , κ . Thus, using similar ideas to those used by [31] to prove that the claimed result is a direct consequence of the below three intermediate results:
n s n P sup a n b n sup c n d n n d n ζ X ( a n ) log n S ι , κ E [ S ι , κ ] > η < ,
sup a n b n sup c n d n C o v ( S 0 , 1 , S 2 , 0 ) = o log n n ζ X ( a n ) ,
sup a n b n sup c n d n C o v ( S 1 , 1 , S 1 , 0 ) = o log n n ζ X ( a n ) .
Proof of (9).
We follow similar ideas to those in [38] to evaluate this quantity. In particular, it is based on the Bernstein’s inequality applied to the empirical process, where α n ι , κ ( K ) = 1 n i = 1 n Δ i ι , κ for ι = 0, 1, 2 and κ = 0, 1. To achieve that, we place h j = 2 j a n , j = 2 j c n and we define the following class of functions: G K , j , j ι , κ = ( z , t ) K ( 1 d ( X , X 1 ) ) d ι ( X 1 , X ) , K κ ( 1 ( t y Y 1 ) ) , , h j 1 γ h j , j 1 δ j . Therefore,
P sup a n b n sup c n d n n c n ζ X ( a n ) log n S ι , κ E [ S ι , κ ] η L ( n ) L ( n ) P max 1 k n k α k ι , κ ( K ) G K , j , j > η n j ζ X ( h j / 2 ) log n ,
where L ( n ) = max j : h j 2 b 0 and L = max j : j 2 d 0 . Applying the Bernstein’s inequality to the empirical process α n ι , κ ( K ) , with the envelop function of the G K , j , j , such that G ( z , t ) C 𝟙 B X , h j / 2 ( z ) 𝟙 t y j / 2 , t y t . It follows that σ 2 : = E G K , j , j 2 X , Y = O j ξ X ( h j / 2 ) and E G K , j , j p X , Y C p σ 2 , β n = E n α n K G K , H , J = O n h H , j ζ X h j / 2 . Furthermore, for t = η n j , ζ X h j / 2 log n β , we obtain
P max 1 k n k α k ι , κ ( K ) G K , j , j > β + t exp η 2 log n 8 + C log n n n j ζ X ( h j / 2 ) n C η 2 .
Since L (n) ≤ 2 log n and L’ (n) ≤ 2 log n we obtain
P sup a n b n sup c n d n n c n ζ X ( a n ) log n S ι , κ E [ S ι , κ ] η log 2 n n C η 2 .
Hence, combining this last result with the definition of sn to conclude (9). □
Proof of (10) and (11)).
We write that
sup a n b n sup c n d n C o v ( S 0 , 1 , S 2 , 0 ) = 1 n 2 ζ X 2 ( ) i C o v Δ i 0 , 1 , Δ i 2 , 0 .
and
sup a n b n sup c n d n C o v ( S 1 , 1 , S 1 , 0 ) = 1 n 2 ζ X 2 ( ) i C o v Δ i 1 , 1 , Δ i 1 , 0 .
By simple algebra, we prove that, for k′ = 0, 1 and l′ = 1, 2, C o v k K ( 1 d ( X , X 1 ) ) d k ( X 1 , X ) K ( 1 ( t y Y 1 ) ) , l K ( 1 ( t y Y 1 ) ) C ζ X ( / 2 ) . Consequently,
sup a n b n sup c n d n C o v ( S 0 , 1 , S 2 , 0 ) = O 1 n ζ X ( a n ) = o log n n c n ζ X ( a n ) ,
and
sup a n b n sup c n d n C o v ( S 1 , 1 , S 1 , 0 ) = O 1 n ζ X ( a n ) = o log n n c n ζ X ( a n ) .

Author Contributions

The authors contributed equally to this work. Formal analysis, Z.K.; Methodology, M.R.; Validation, M.R.; Writing—review and editing, I.M.A. and A.L. All authors have read and agreed to the published version of the manuscript.

Funding

This research was funded by the Deanship of Scientific Research at King Khalid University through the Research Groups Program under grant number R.G.P. 1/177/43.

Data Availability Statement

The data used in this study are available through the link http://www.models.life.ku.dk/Sugar_Process (accessed on 20 December 2021).

Acknowledgments

The authors thank and extend their appreciation to the Deanship of Scientific Research at King Khalid University for funding this work.

Conflicts of Interest

The authors declare no conflict of interest.

References

  1. Bosq, D. Linear Processes in Function Spaces Theory and Applications; Lecture Notes in Statistics; Springer: Berlin, Germany, 2000; Volume 149. [Google Scholar]
  2. Ferraty, F.; Vieu, P. Nonparametric Functional Data Analysis. Theory and Practice; Springer Series in Statistics; Springer: New York, NY, USA, 2006. [Google Scholar]
  3. Ramsay, J.O.; Silverman, B.W. Functional Data Analysis, 2nd ed.; Springer: New York, NY, USA, 2005. [Google Scholar]
  4. Aneiros, G.; Cao, R.; Fraiman, R.; Genest, C.; Vieu, P. Recent advances in functional data analysis and high-dimensional statistics. J. Multivar. Anal. 2019, 170, 3–9. [Google Scholar] [CrossRef]
  5. Aneiros Pérez, G.; Cao, R.; Vieu, P. Editorial on the special issue on functional data analysis and related topics. Comput. Statist. 2019, 34, 447–450. [Google Scholar] [CrossRef] [Green Version]
  6. Geenens, G. Curse of dimensionality and related issues in nonparametric functional regression. Stat. Surv. 2001, 5, 30–43. [Google Scholar] [CrossRef]
  7. Ling, N.; Vieu, P. Nonparametric modelling for functional data: Selected survey and tracks for future. Statistics 2018, 52, 934–949. [Google Scholar] [CrossRef]
  8. Tengteng, X.; Zhang, R. Estimation of the nonparametric mean and covariance functions for multivariate longitudinal and sparse functional data. Comm. Stat. Theory Methods 2022, 1–24. [Google Scholar] [CrossRef]
  9. Gattone, S.A.; Fortuna, F.; Evangelista, A.; Battista, D. Simultaneous confidence bands for the functional mean of convex curves. Econom. Stat. 2022. [Google Scholar] [CrossRef]
  10. Agarwal, G.; Tu, W.; Sun, Y.; Kong, L. Flexible quantile contour estimation for multivariate functional data: Beyond convexity. Comput. Stat. Data Anal. 2022, 168, 107400. [Google Scholar] [CrossRef]
  11. Jiang, J.; Lin, H.; Peng, H.; Fan, G.; Li, Y. Cluster analysis with regression of non-Gaussian functional data on covariates. Can. J. Stat. 2021, 50, 221–240. [Google Scholar] [CrossRef]
  12. To, D.; Adimari, G.; Chiogna, M. Estimation of the volume under a ROC surface in presence of covariates. Comput. Statist. Data Anal. 2022, 107–434. [Google Scholar] [CrossRef]
  13. Zhou, X.; Gao, X.; Zhang, Y.; Yin, X.; Shen, Y. Efficient Estimation for the Derivative of Nonparametric Function by Optimally Combining Quantile Information. Symmetry 2021, 13, 2387. [Google Scholar] [CrossRef]
  14. Zhao, Y.Y.; Lin, J.; Zhao, J.; Miao, Z. Estimation of semi-varying coefficient models for longitudinal data with irregular error structure. Comput. Stat. Data Anal. 2022, 169, 107389. [Google Scholar] [CrossRef]
  15. Zhou, Z.; Si, G.; Sun, H.; Qu, K.; Hou, W. A robust clustering algorithm based on the identification of core points and KNN kernel density estimation. Expert Syst. Appl. 2022, 195, 116573. [Google Scholar] [CrossRef]
  16. Shi, H.; Chen, L.; Wang, X.; Wang, G.; Wang, Q. A Nonintrusive and Real-Time Classification Method for Driver’s Gaze Region Using an RGB Camera. Sustainability 2022, 14, 508. [Google Scholar] [CrossRef]
  17. Cengiz, E.; Babagiray, M.; Aysal, E.F.; Aksoy, F. Kinematic viscosity estimation of fuel oil with comparison of machine learning methods. Fuel 2022, 316, 123422. [Google Scholar] [CrossRef]
  18. Chesneau, C.; Maillot, B. Superoptimal Rate of Convergence in Nonparametric Estimation for Functional Valued Processes. Int. Sch. Res. Not. 2014, 2014, 1–9. [Google Scholar] [CrossRef]
  19. Amiri, A.; Dabo-Niang, S.; Yahaya, M. Nonparametric recursive density estimation for spatial data. Comptes Rendus Math. 2016, 354, 205–210. [Google Scholar] [CrossRef]
  20. Giraldo, R.; Dabo-Niang, S.; Martínez, S. Statistical modeling of spatial big data: An approach from a functional data analysis perspective. Stat. Probab. Lett. 2018, 136, 126–129. [Google Scholar] [CrossRef] [Green Version]
  21. Chaouch, M.; Laïb, N.; Louani, D. Rate of uniform consistency for a class of mode regression on functional stationary ergodic data. Stat. Meth. Appl. 2017, 26, 19–47. [Google Scholar]
  22. Maillot, B.; Chesneau, C. On the conditional density estimation for continuous time processes with values in functional spaces. Stat. Probab. Lett. 2021, 178, 109179. [Google Scholar] [CrossRef]
  23. Kirkby, J.L.; Leitao, A.; Nguyen, D. Nonparametric density estimation and bandwidth selection with B-spline bases: A novel Galerkin method. Comput. Stat. Data Anal. 2021, 159, 107202. [Google Scholar] [CrossRef]
  24. Megheib, M. A Bayesian approach for nonparametric regression in the presence of correlated errors. Comm. Stat. Theory Methods 2021, 1–10. [Google Scholar] [CrossRef]
  25. Slaoui, Y. Two-time-scale nonparametric recursive regression estimator for independent functional data. Comm. Stat. Theory Methods 2021, 1–33. [Google Scholar] [CrossRef]
  26. Oshinubi, K.; Ibrahim, F.; Rachdi, M.; Demongeot, J. Functional Data Analysis: Transition from Daily Observation of COVID-19 Prevalence in France to Functional Curves. AIMS Math. 2022, 7, 5347–5385. [Google Scholar] [CrossRef]
  27. Aneiros, G.; Horová, I.; Hušková, M. Special Issue on Functional Data Analysis and related fields. J. Multivar. Anal. 2022, 104908. [Google Scholar] [CrossRef]
  28. Yang, Y.; Yao, F. Online Estimation for Functional Data. J. Amer. Stat. Ass. 2021, 1–35. [Google Scholar] [CrossRef]
  29. Burba, F.; Ferraty, F.; Vieu, P. k-nearest neighbor method in functional non-parametric regression. J. Nonparametr. Stat. 2009, 21, 453–469. [Google Scholar] [CrossRef]
  30. Barrientos-Marin, J.; Ferraty, F.; Vieu, P. Locally Modelled Regression and Functional Data. J. Nonparametr. Stat. 2010, 22, 617–632. [Google Scholar] [CrossRef]
  31. Demongeot, J.; Laksaci, A.; Madani, F.; Rachdi, M. Functional data: Local linear estimation of the conditional density and its application. Statistics 2013, 4, 26–44. [Google Scholar] [CrossRef]
  32. Demongeot, J.; Laksaci, A.; Rachdi, M.; Rahmani, S. On the local linear modelization of the conditional distribution for functional data. Sankhya A 2014, 76, 328–355. [Google Scholar] [CrossRef]
  33. Baìllo, A.; Grané, A. Local linear regression for functional predictor and scalar response. J. Multivar. Anal. 2009, 100, 102–111. [Google Scholar] [CrossRef] [Green Version]
  34. Chikr-Elmezouar, Z.; Almanjahie, I.M.; Laksaci, A.; Rachdi, M. FDA: Strong consistency of the kNN local linear estimation of the functional conditional density and mode. J. Nonparametr. Stat. 2019, 31, 175–195. [Google Scholar] [CrossRef]
  35. Kara-Zaitri, L.; Laksaci, A.; Rachdi, M.; Vieu, P. Data-driven k-N-N estimation in nonparametric functional data analysis. J. Multiv. Anal. 2017, 153, 176–188. [Google Scholar] [CrossRef]
  36. Attouch, M.; Laksaci, A.; Ould Saïd, E. Asymptotic normality of a robust estimator of the regression function for functional time series data. J. Korean Stat. Soc. 2010, 39, 489–500. [Google Scholar] [CrossRef]
  37. Van der Vaart, A.W.; Wellner, J.A. A local maximal inequality under uniform entropy. Electron. J. Stat. 2011, 5, 192–203. [Google Scholar] [CrossRef] [PubMed]
  38. Einmahl, U.; Mason, D. Uniform in bandwidth consistency of kernel-type function estimators. Ann. Stat. 2005, 33, 1380–1403. [Google Scholar] [CrossRef] [Green Version]
  39. Youndjé, E. Propriétés de convergence de l’estimateur à noyau de la densité conditionnelle. Rev. Roum. Math. Pures Appl. 1996, 41, 535–566. [Google Scholar]
  40. Laksaci, A.; Madani, F.; Rachdi, M. Kernel conditional density estimation when the regressor is valued in a semi-metric space. Comm. Stat. Theory Methods 2013, 42, 3544–3570. [Google Scholar] [CrossRef]
  41. Yao, Q.; Tong, H. Cross-validatory bandwidth selections for regression estimation based on dependent data. J. Stat. Plann. Inference 1998, 68, 387–415. [Google Scholar] [CrossRef] [Green Version]
  42. Attouch, M.; Bouabca, W. The k-nearest neighbors estimation of the conditional mode for functional data. Rev. Roum. Math. Pures Appl. 2013, 58, 393–415. [Google Scholar]
Figure 1. A sample of 100 curves.
Mathematics 10 00902 g001
Figure 2. Comparison of different choice of (ı, j): Left plot: (ı, j) = (−3, −4). Middle plot: optimal case (ı, j) = (0, 0). Right plot: (ı, j) = (3, 4). Dashed line: curve of f ˜ ( · | X 0 ) . Continuous line curve of f ( · | X 0 ) .
Mathematics 10 00902 g002
Figure 3. The functional curves.
Mathematics 10 00902 g003
Figure 4. The prediction results.
Mathematics 10 00902 g004
Table 1. MAE of the conditional density estimation with respect to the number neighborhood.
Sample SizeThe Optimal Case(ı, j) =
(−3, −4)
(ı, j) = (−3, 4)(ı, j) = (3, 4)
n = 500.180.540.340.29
n = 1000.110.420.380.24
n = 1500.080.330.220.20
n = 2000.060.190.150.17
Publisher’s Note: MDPI stays neutral with regard to jurisdictional claims in published maps and institutional affiliations.

