
Regressive and Big-Data-Based Analyses of Rock Drillability Based on Drilling Process Monitoring (DPM) Parameters


Abstract
:1. Introduction
2. Methodology
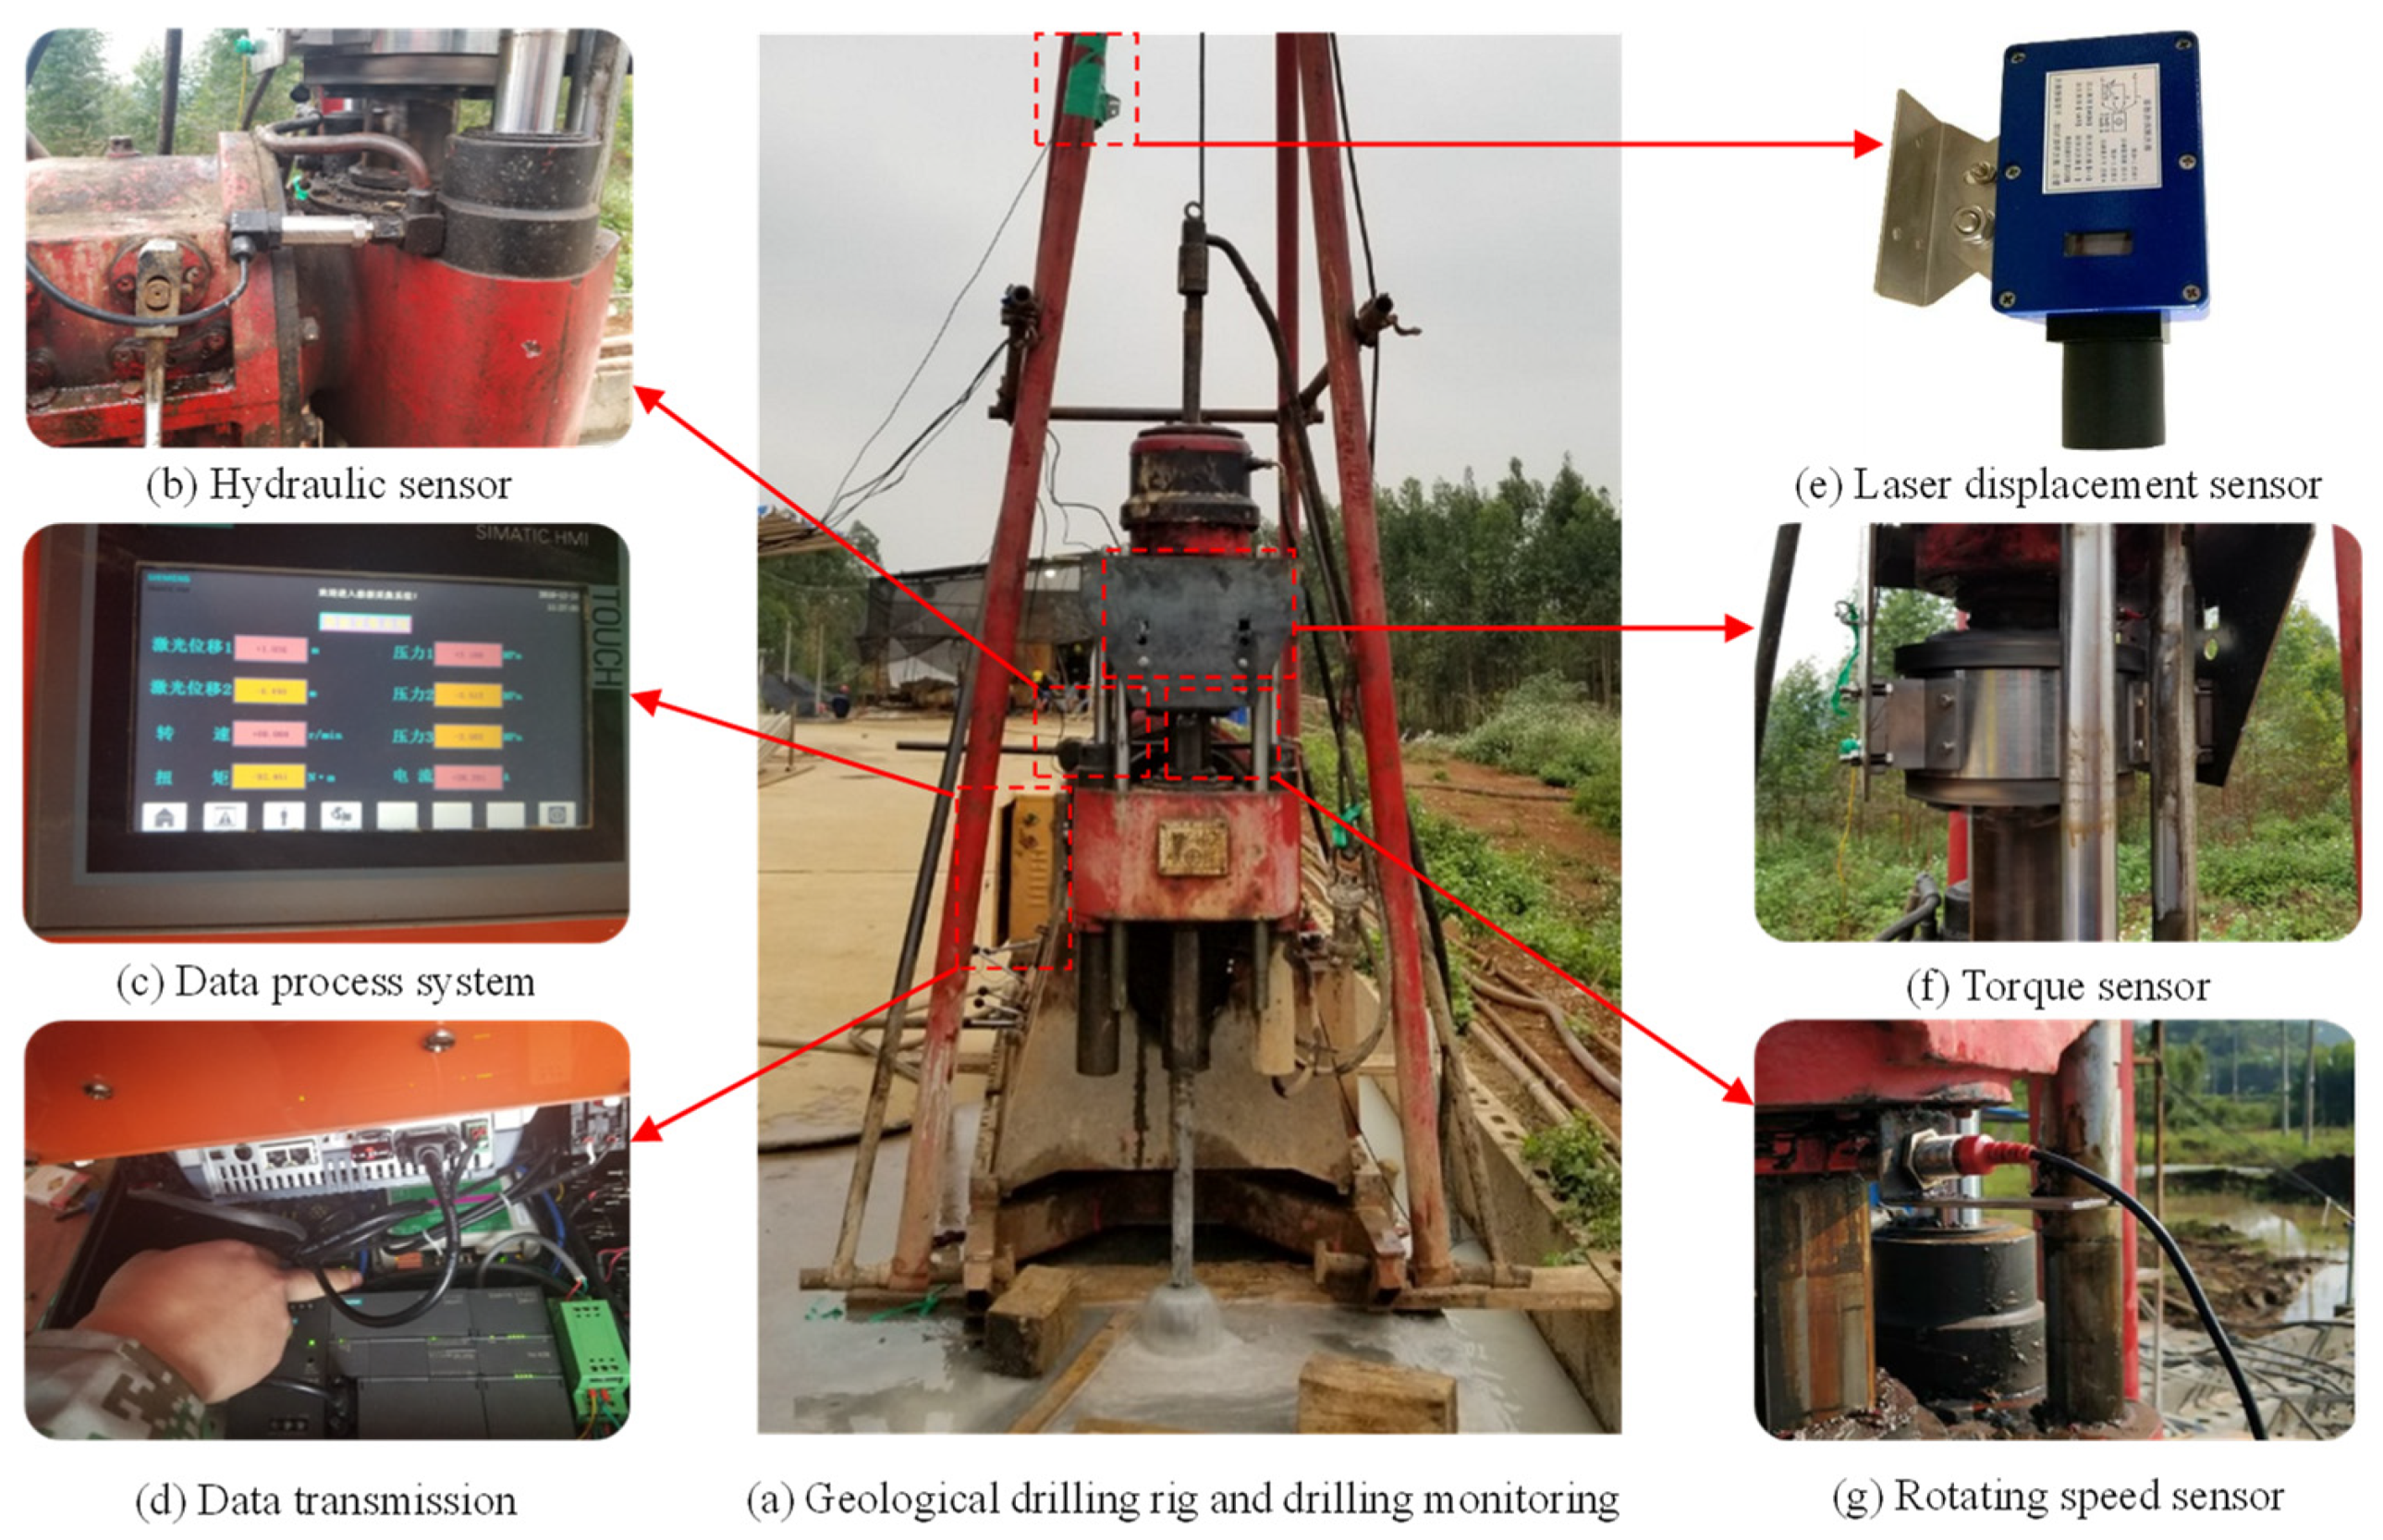
2.1. Drilling Process Monitoring (DPM) Parameters
2.2. Drilling Conditions
2.3. DPM Data
3. Regression Analysis
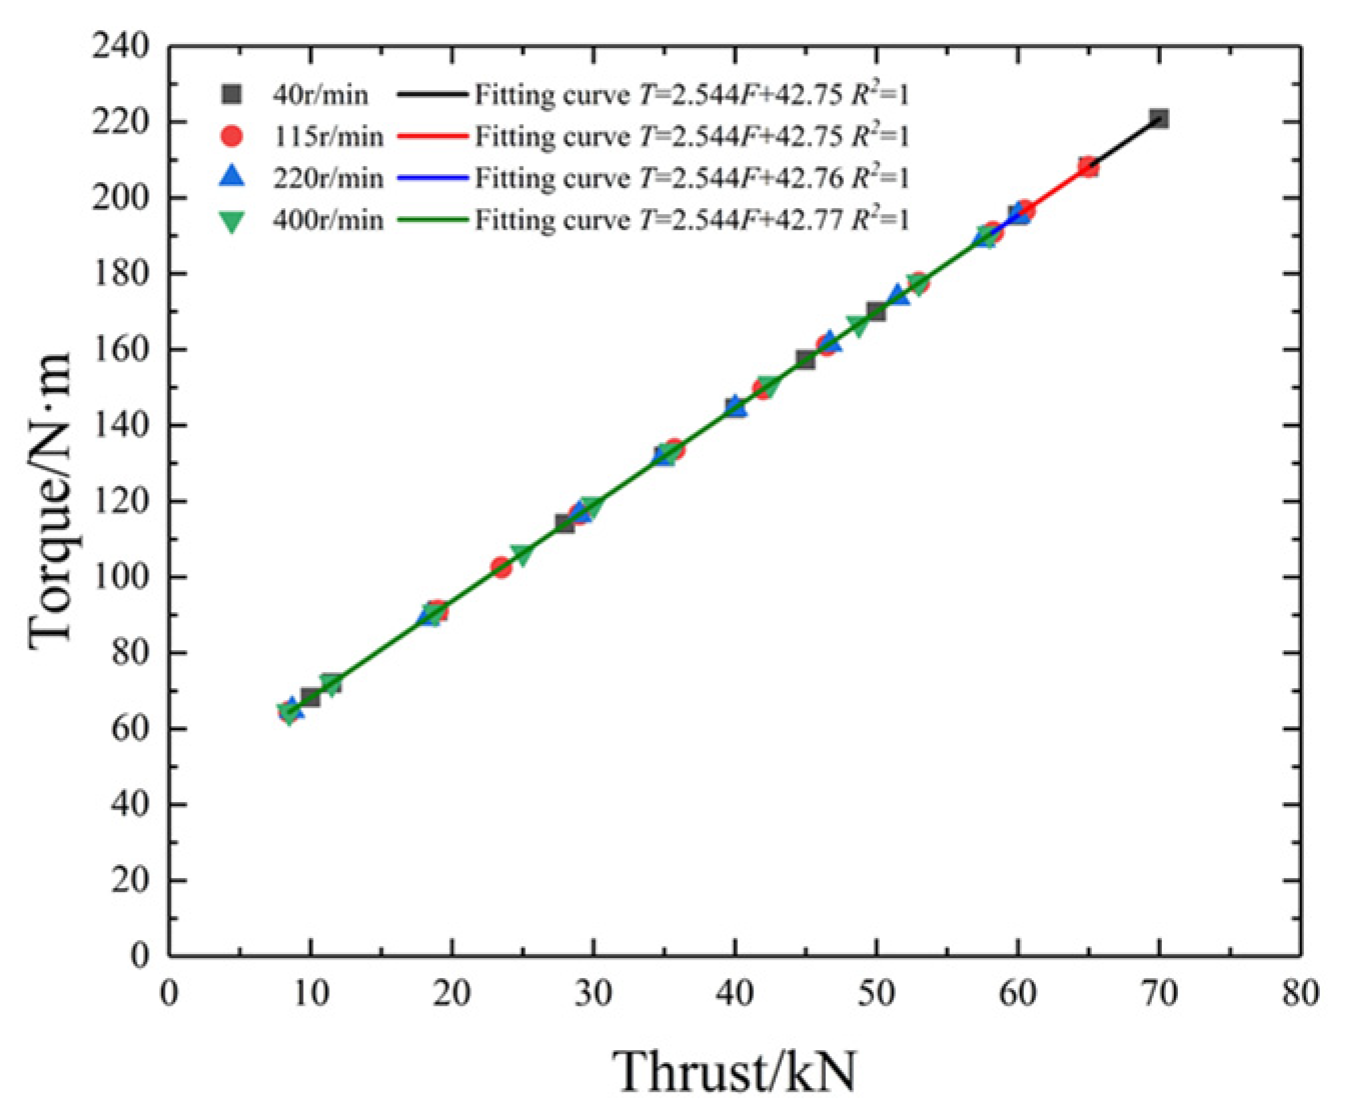
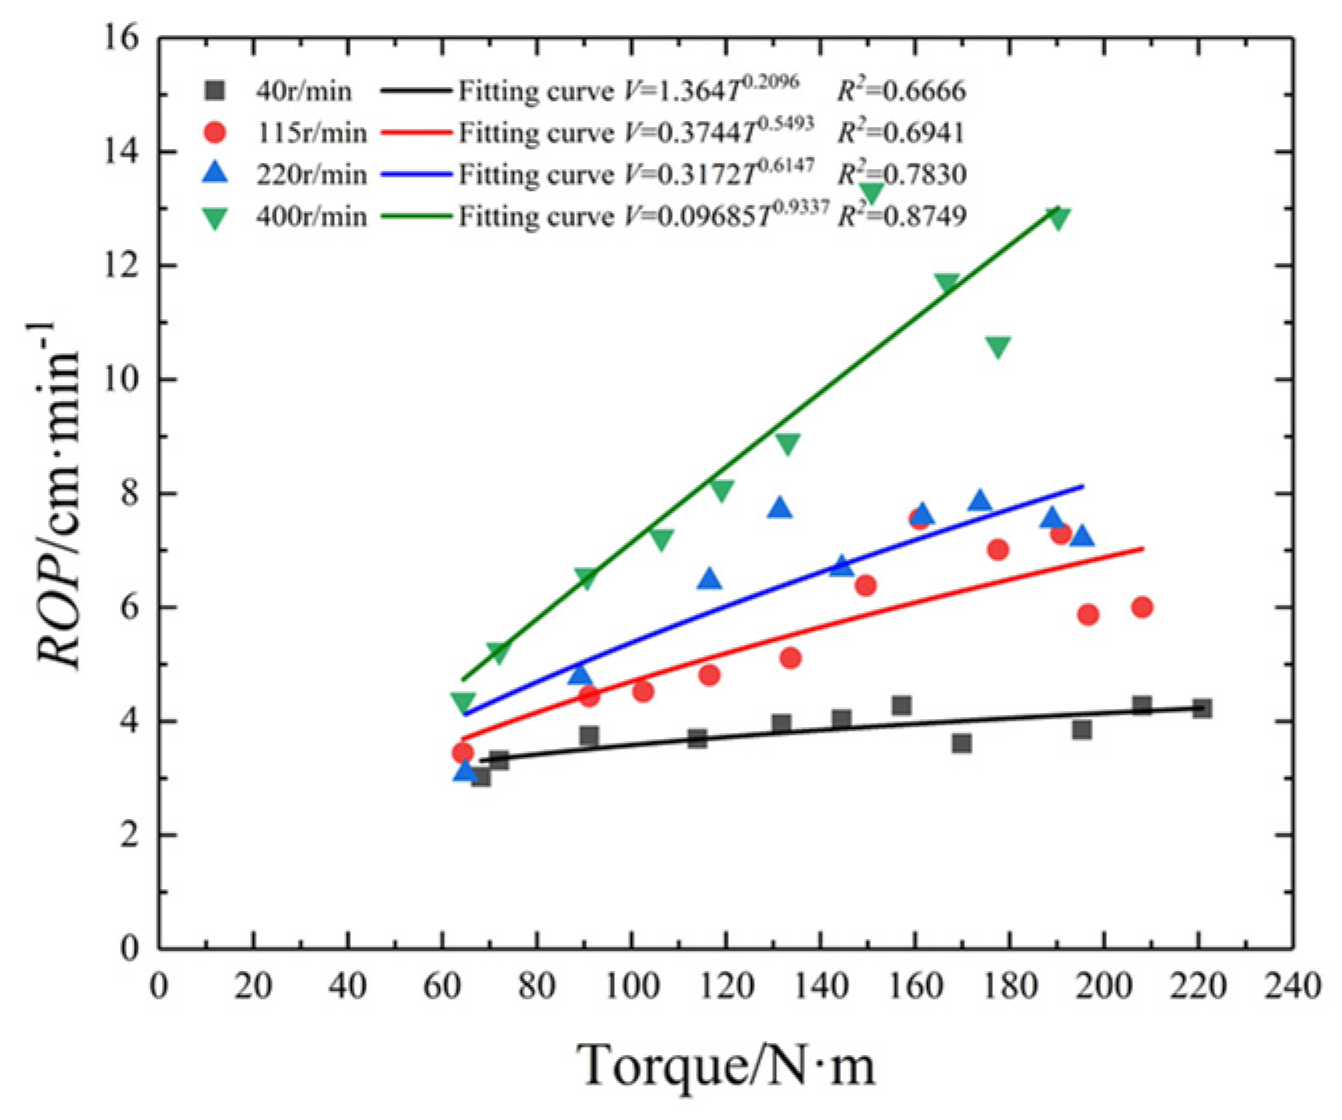
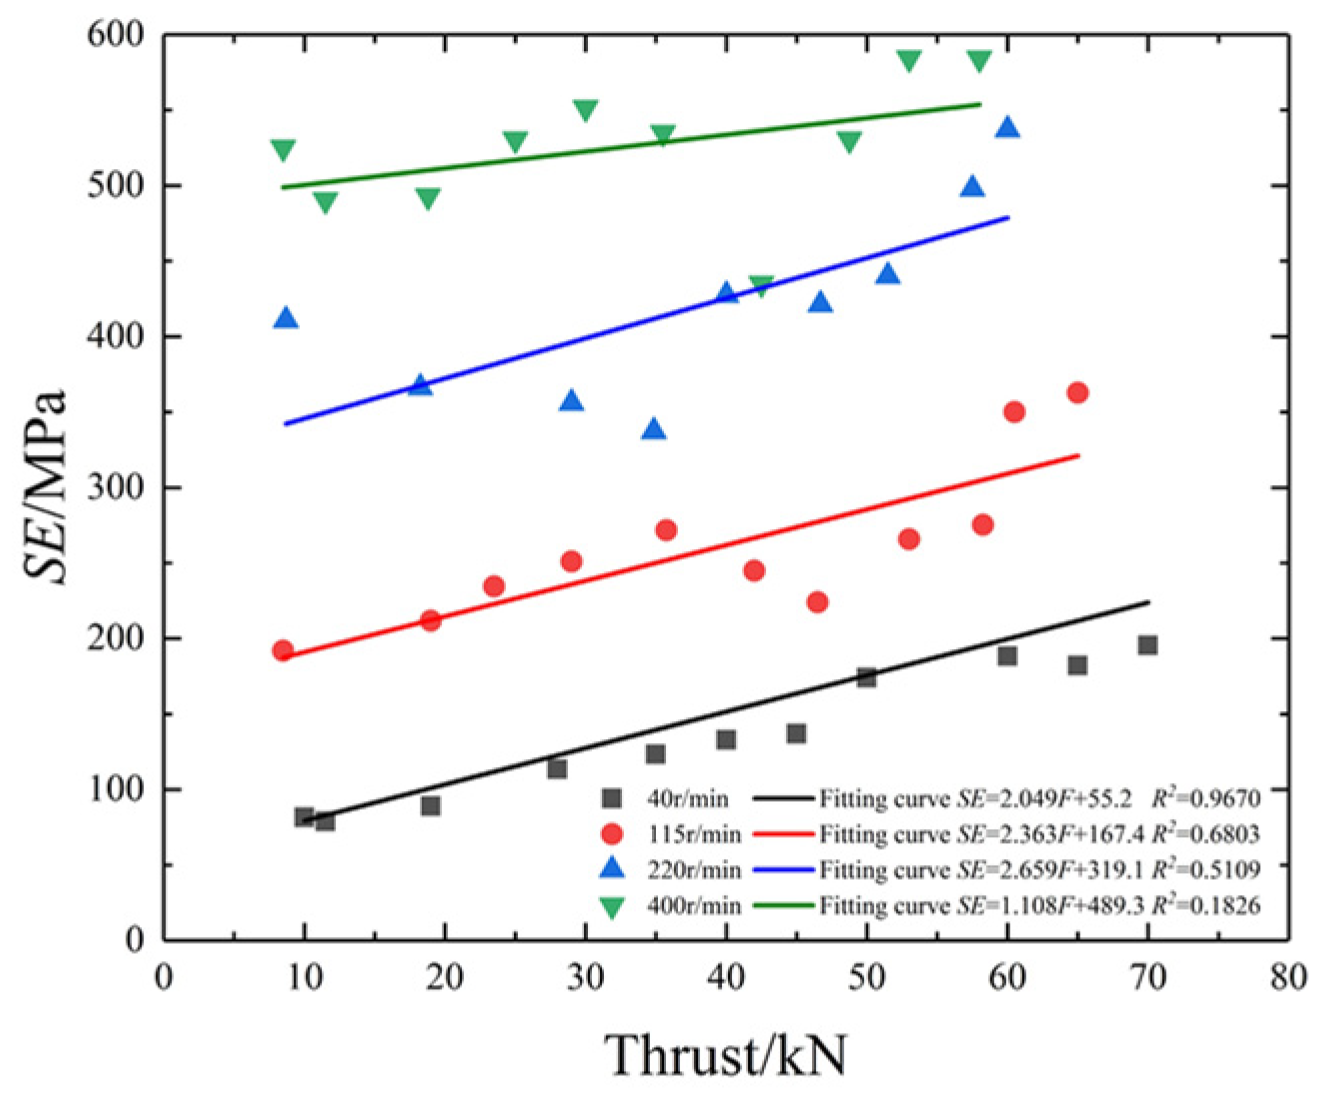
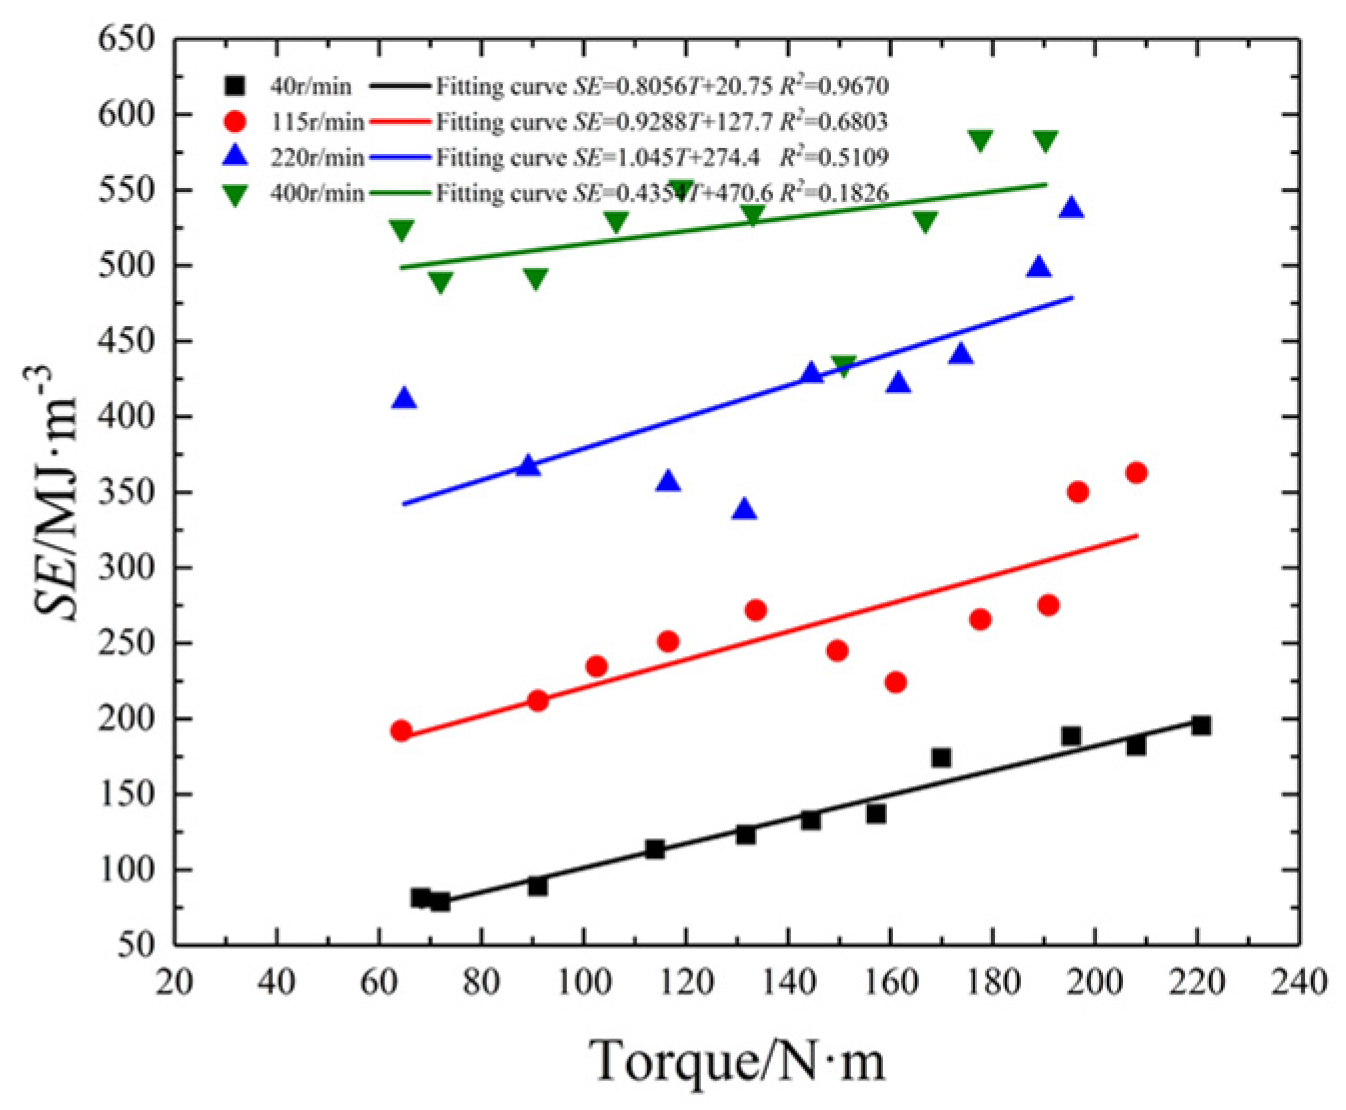
3.1. Two-Dimensional Regression Analysis
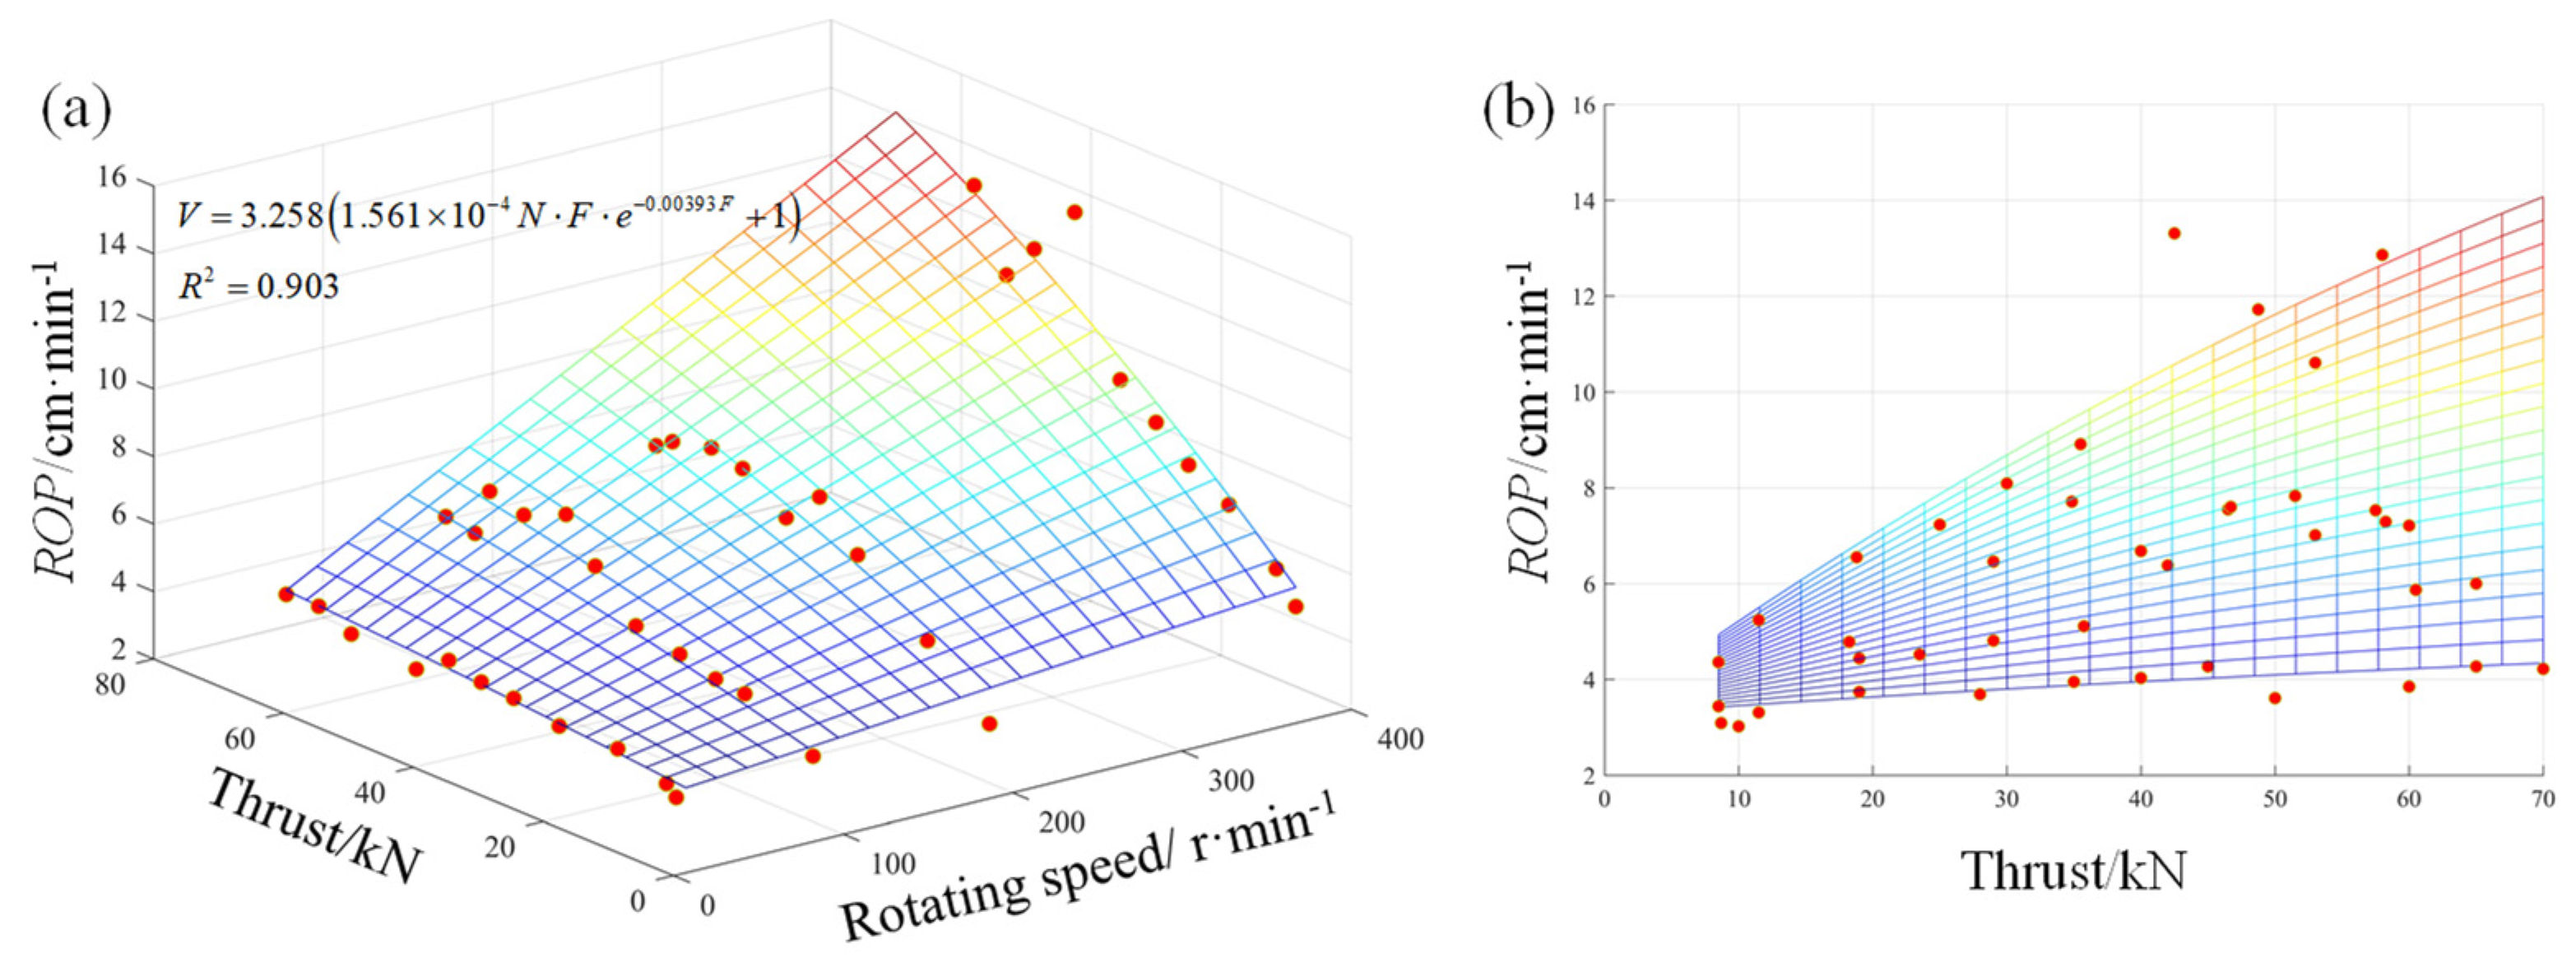
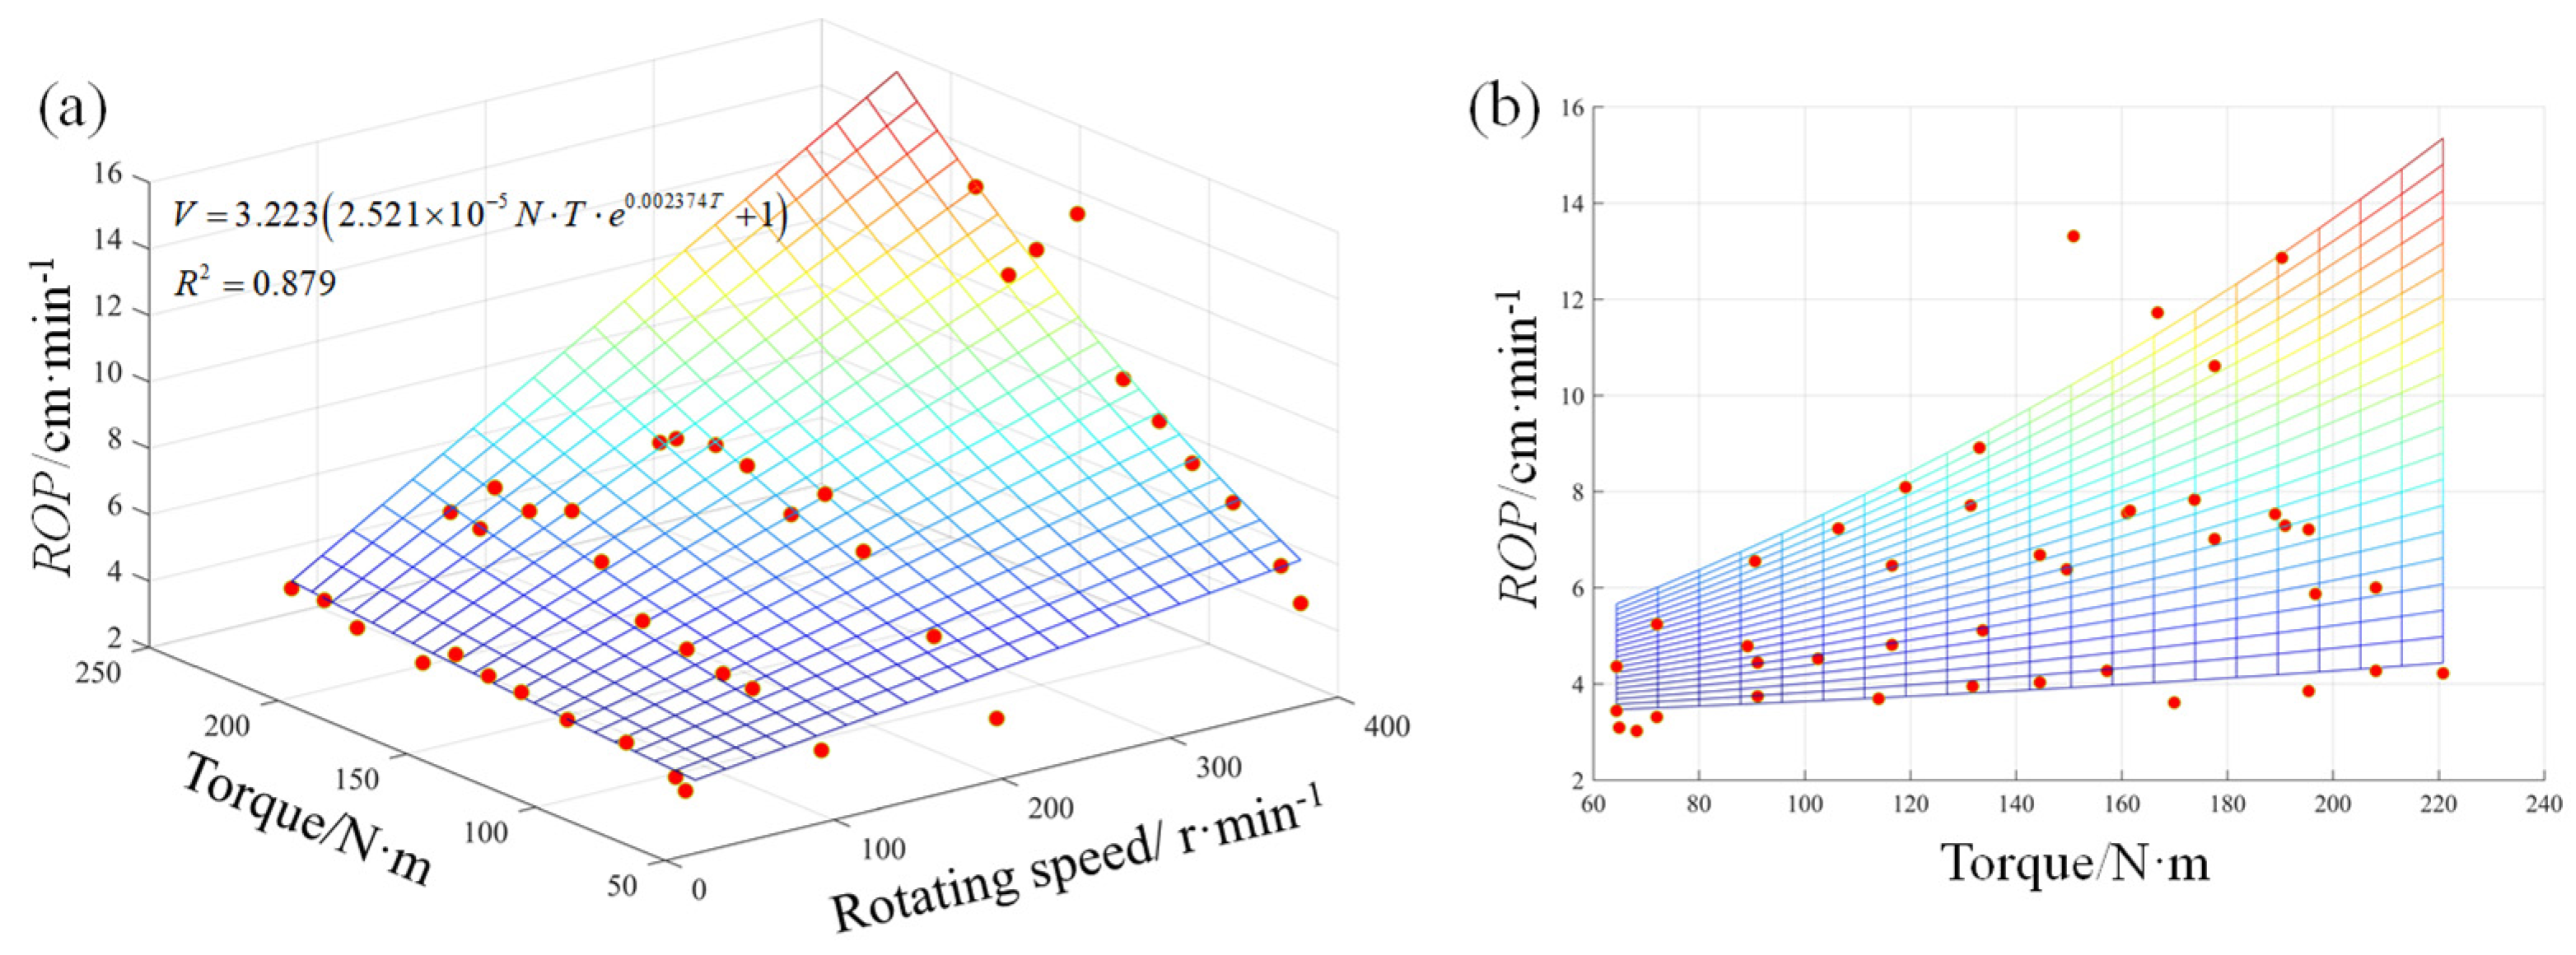
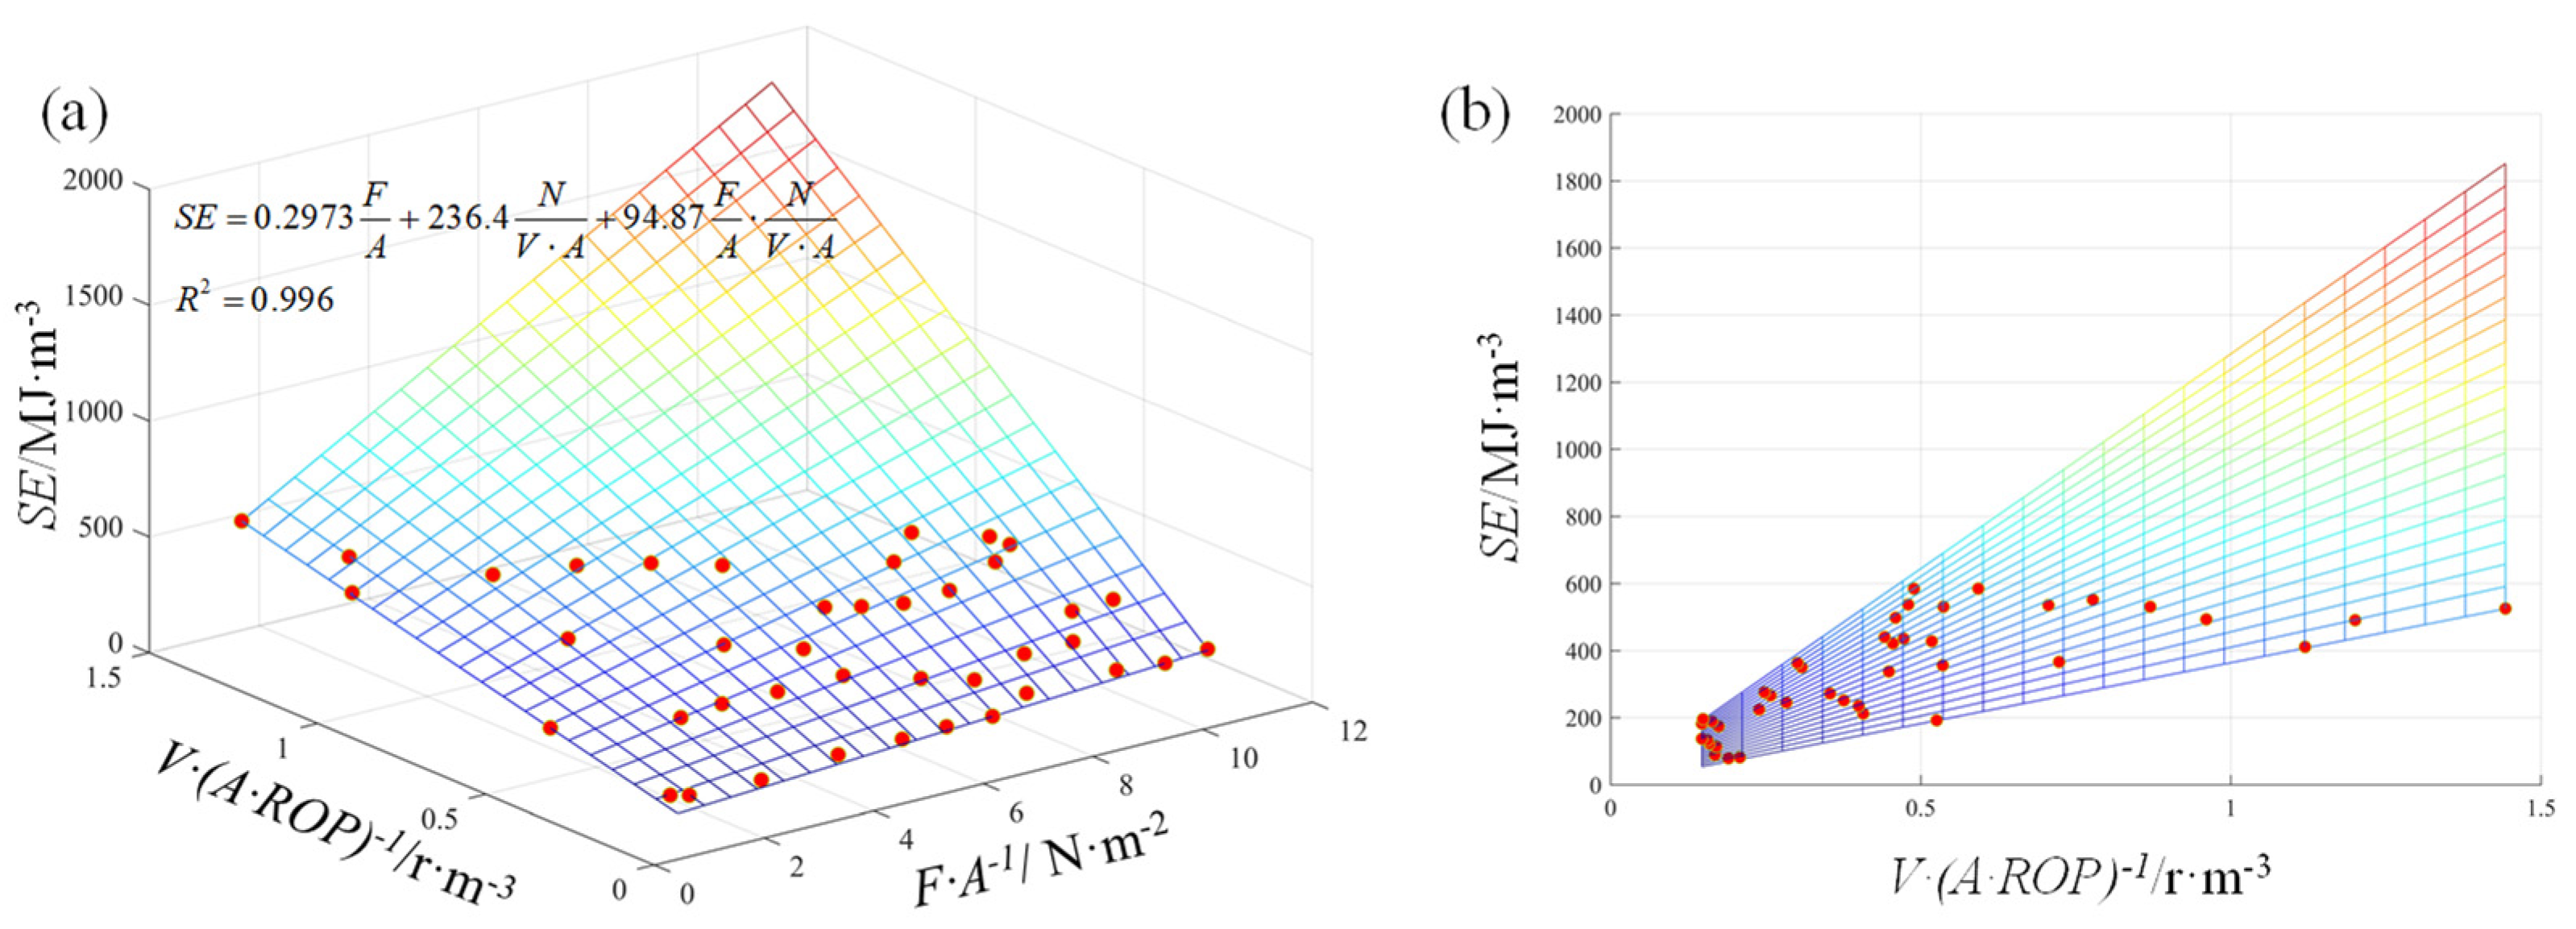
3.2. Three-Dimensional Regression Analysis
3.3. Regression Model Evalution
4. Analyses Using Machine Learning Methods
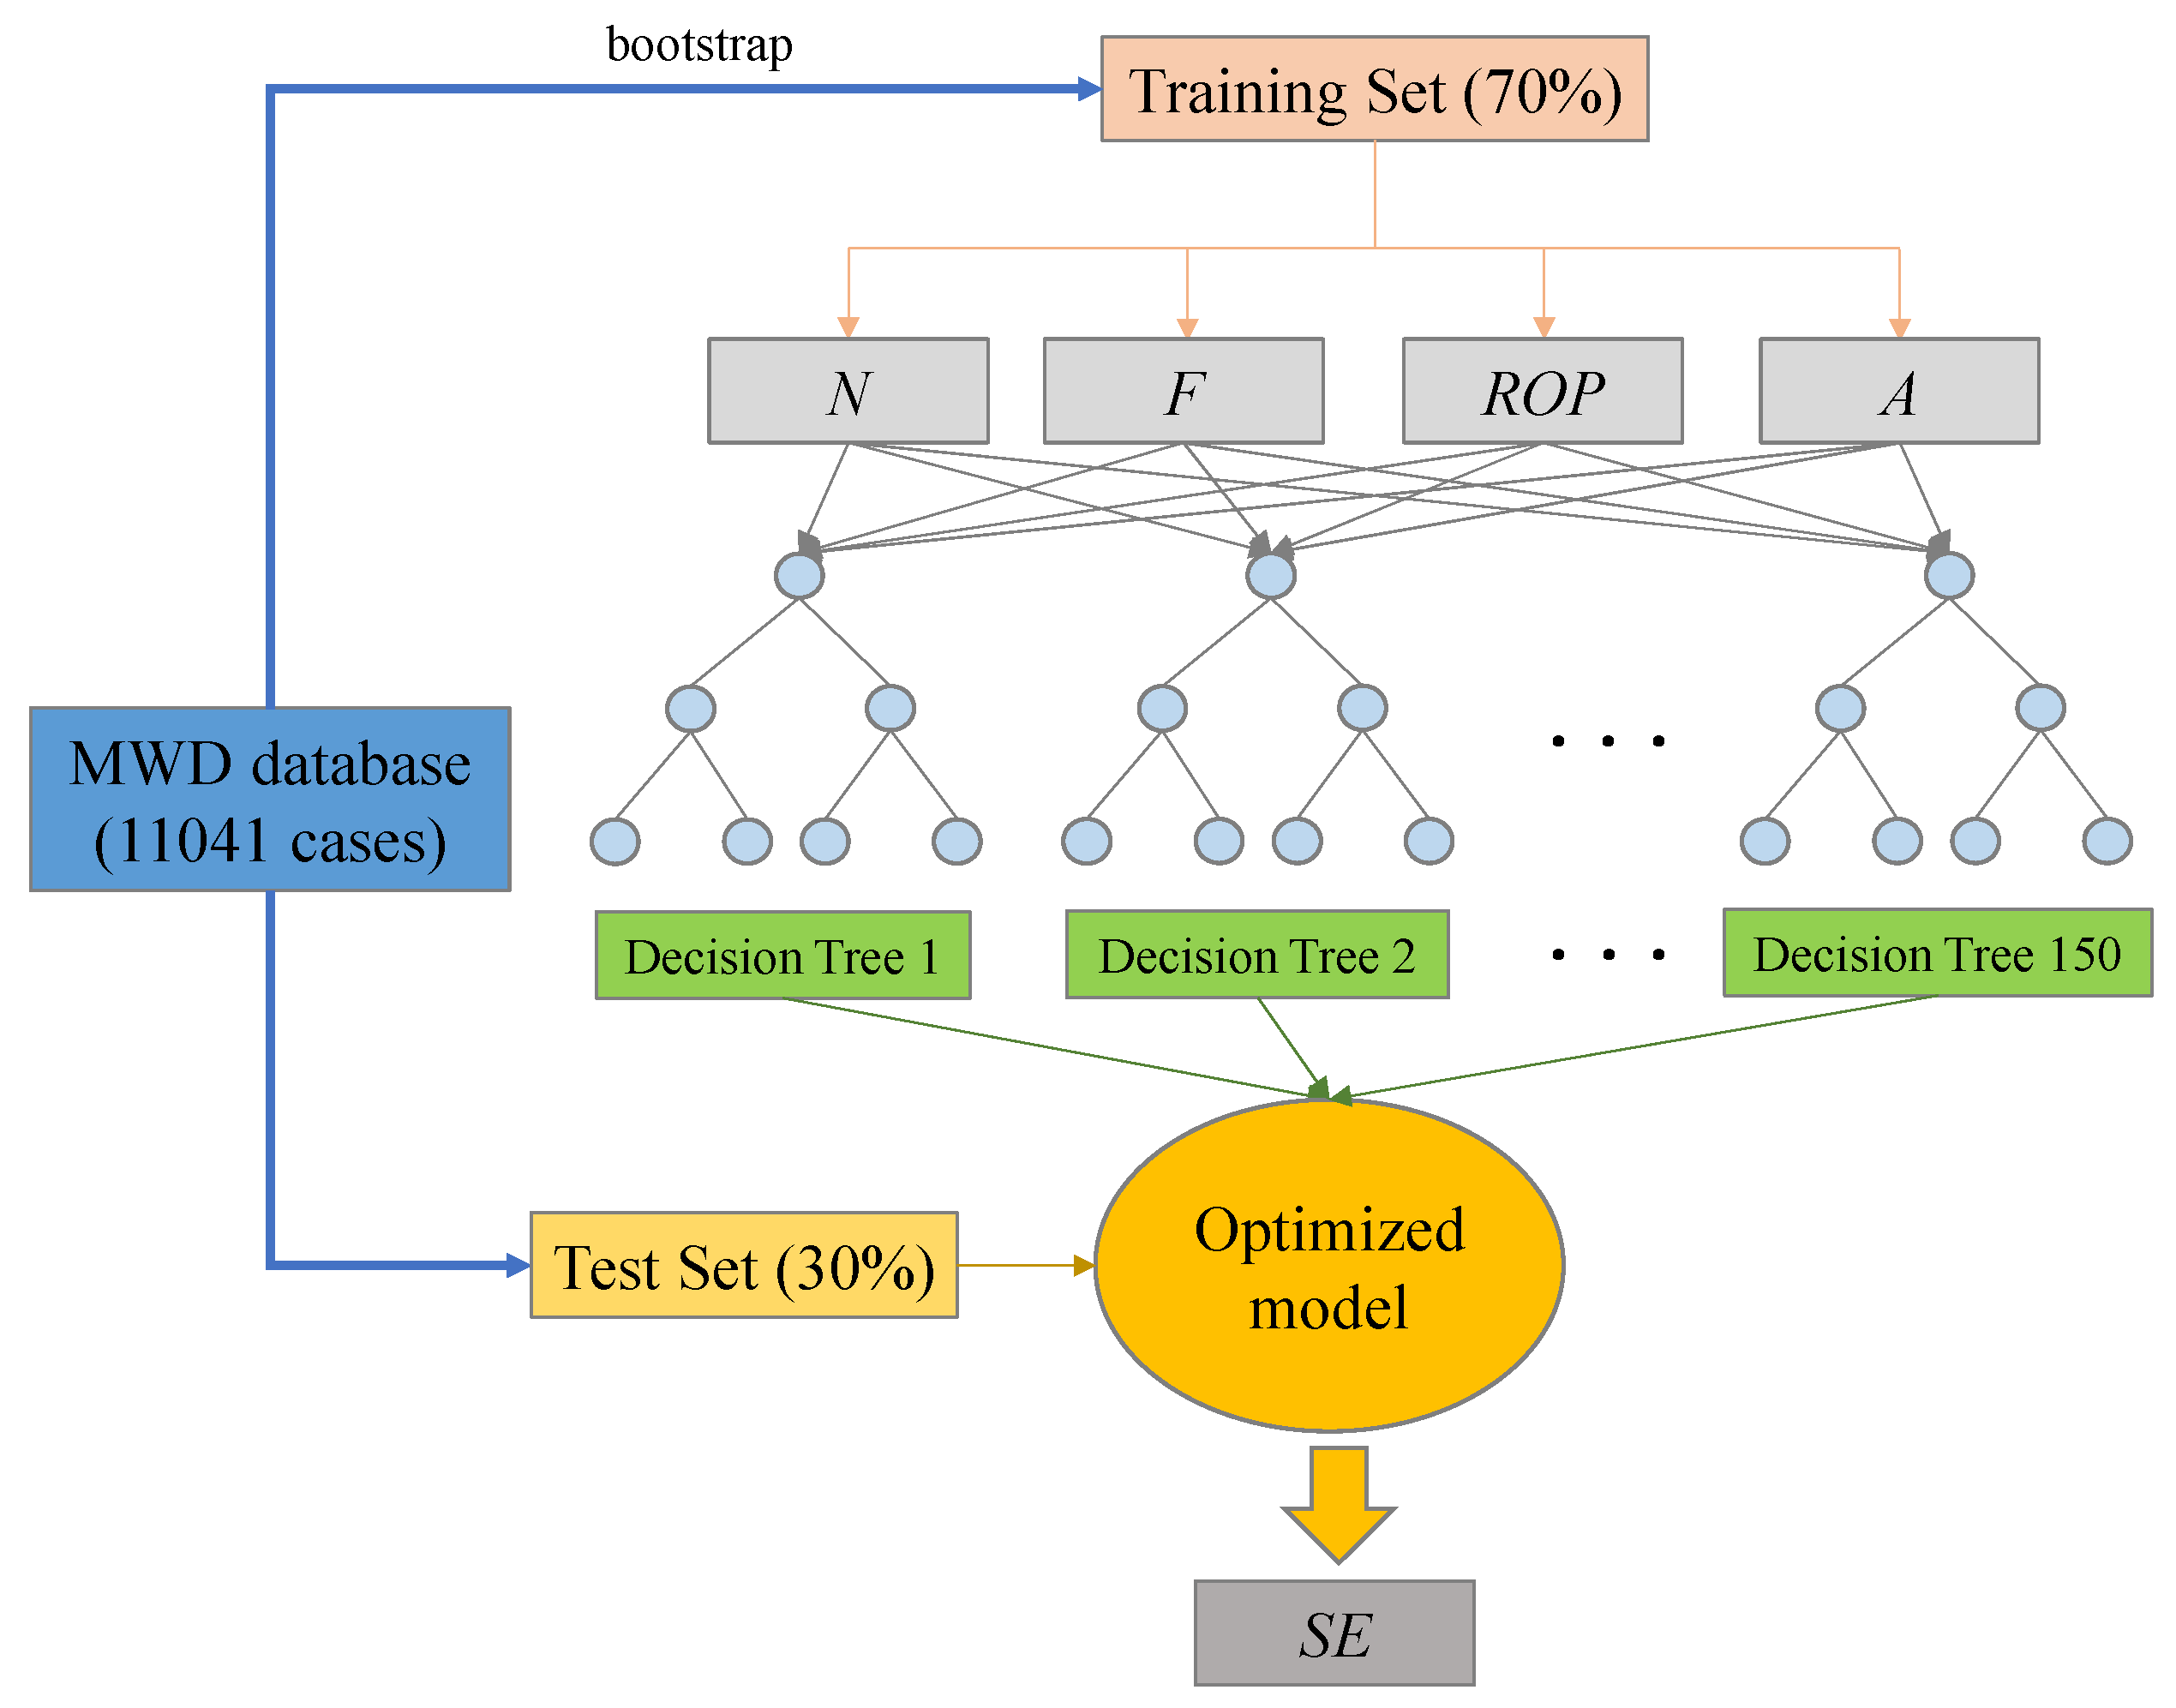
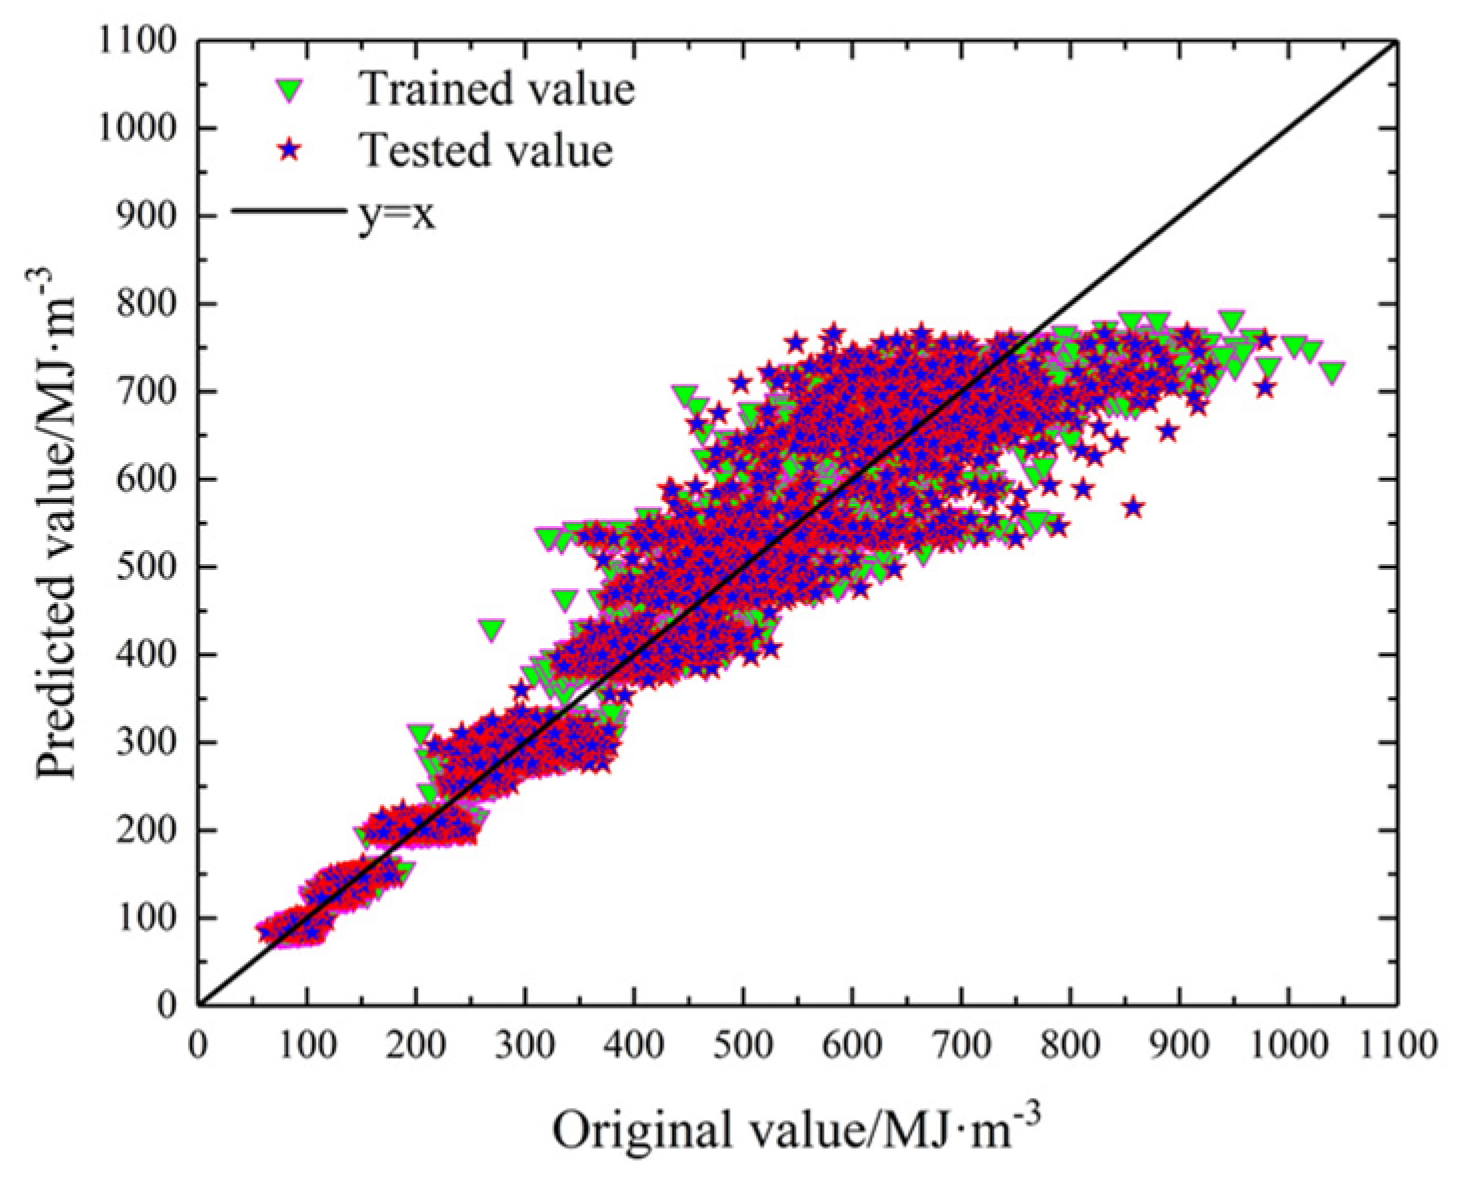
4.1. Random Forest
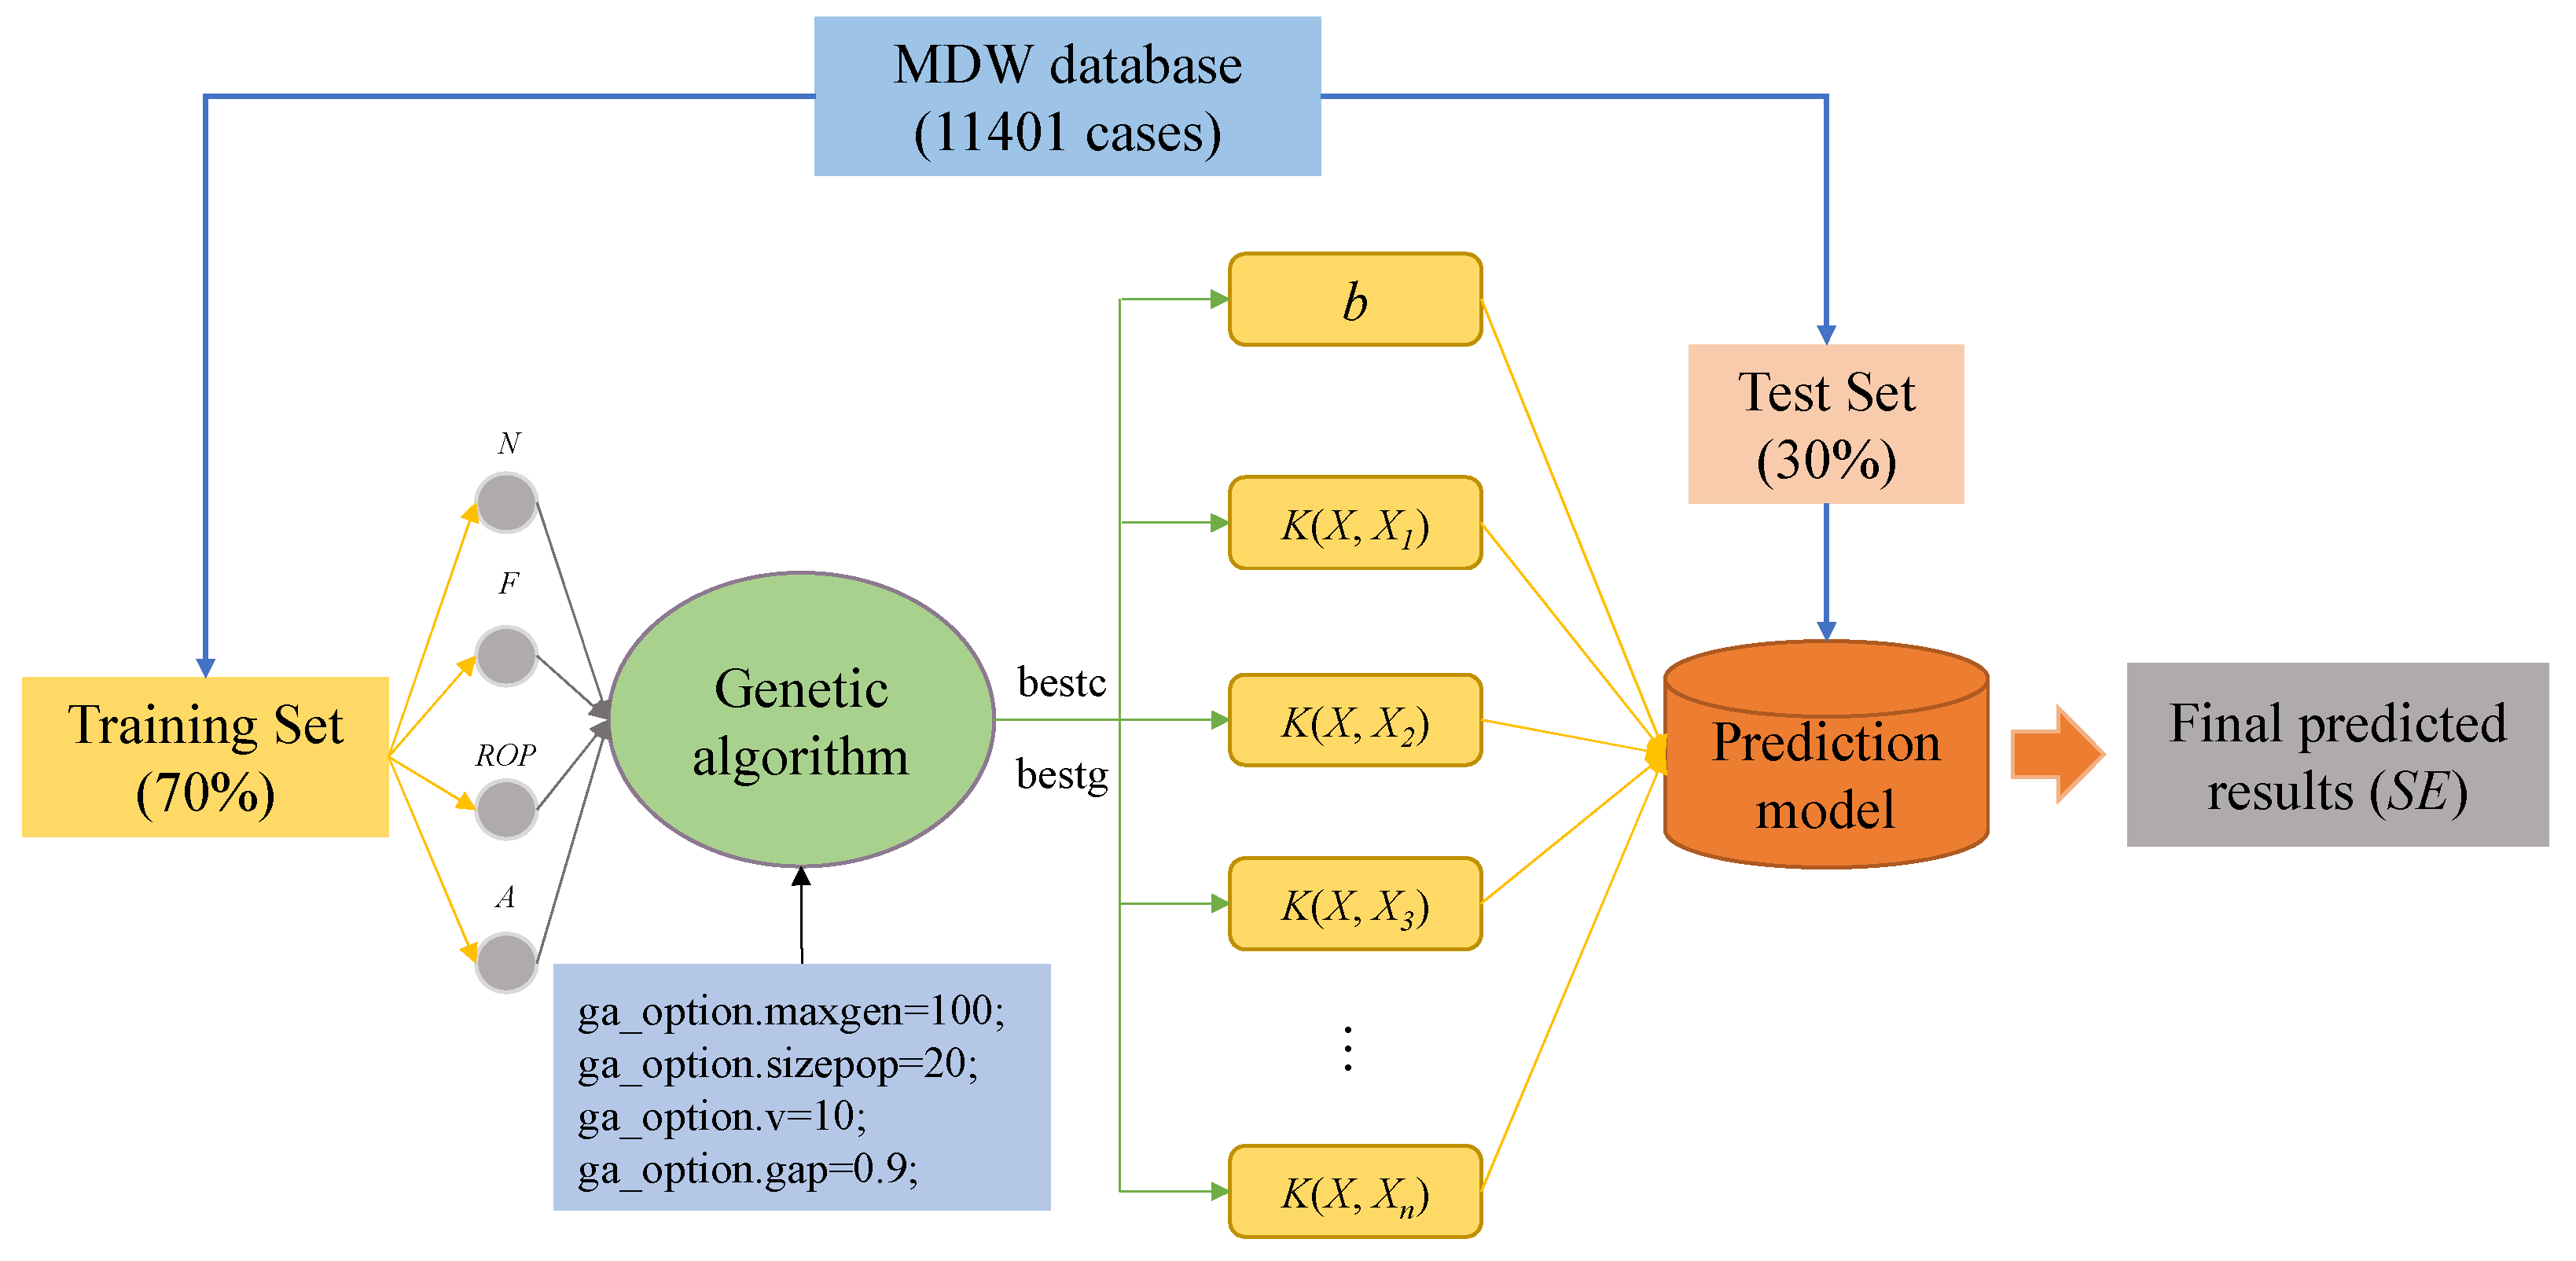
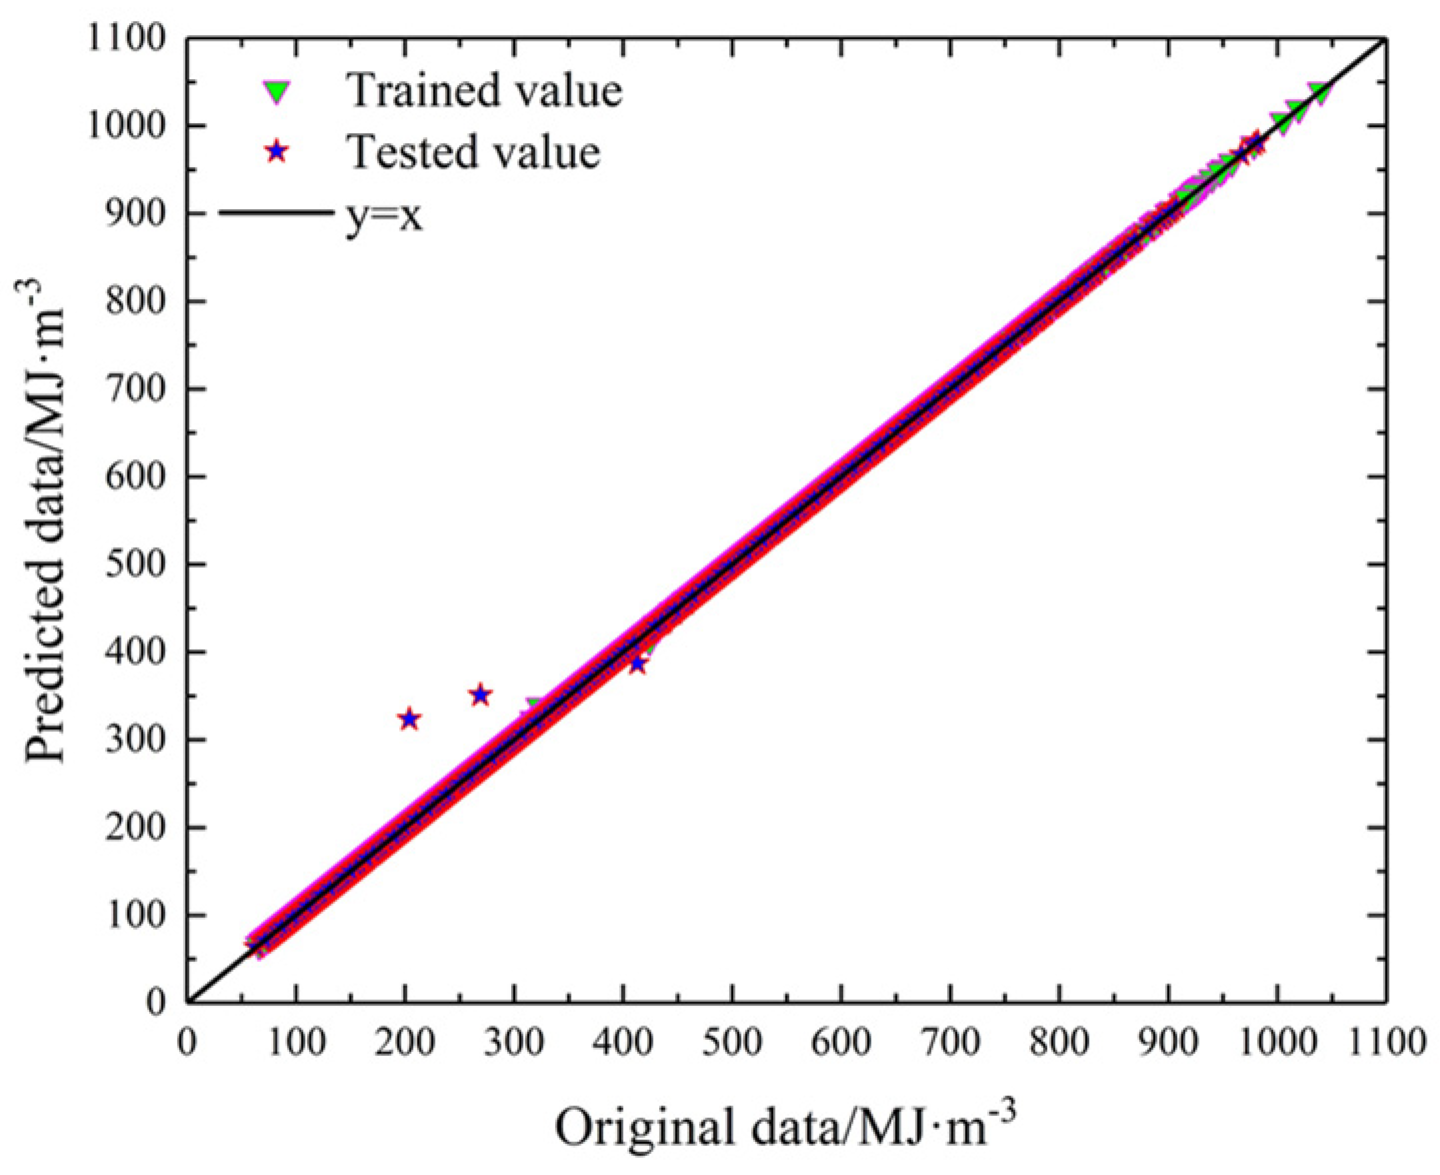
4.2. GA-SVM
5. Relationships between Rock Properties and DPM Parameters
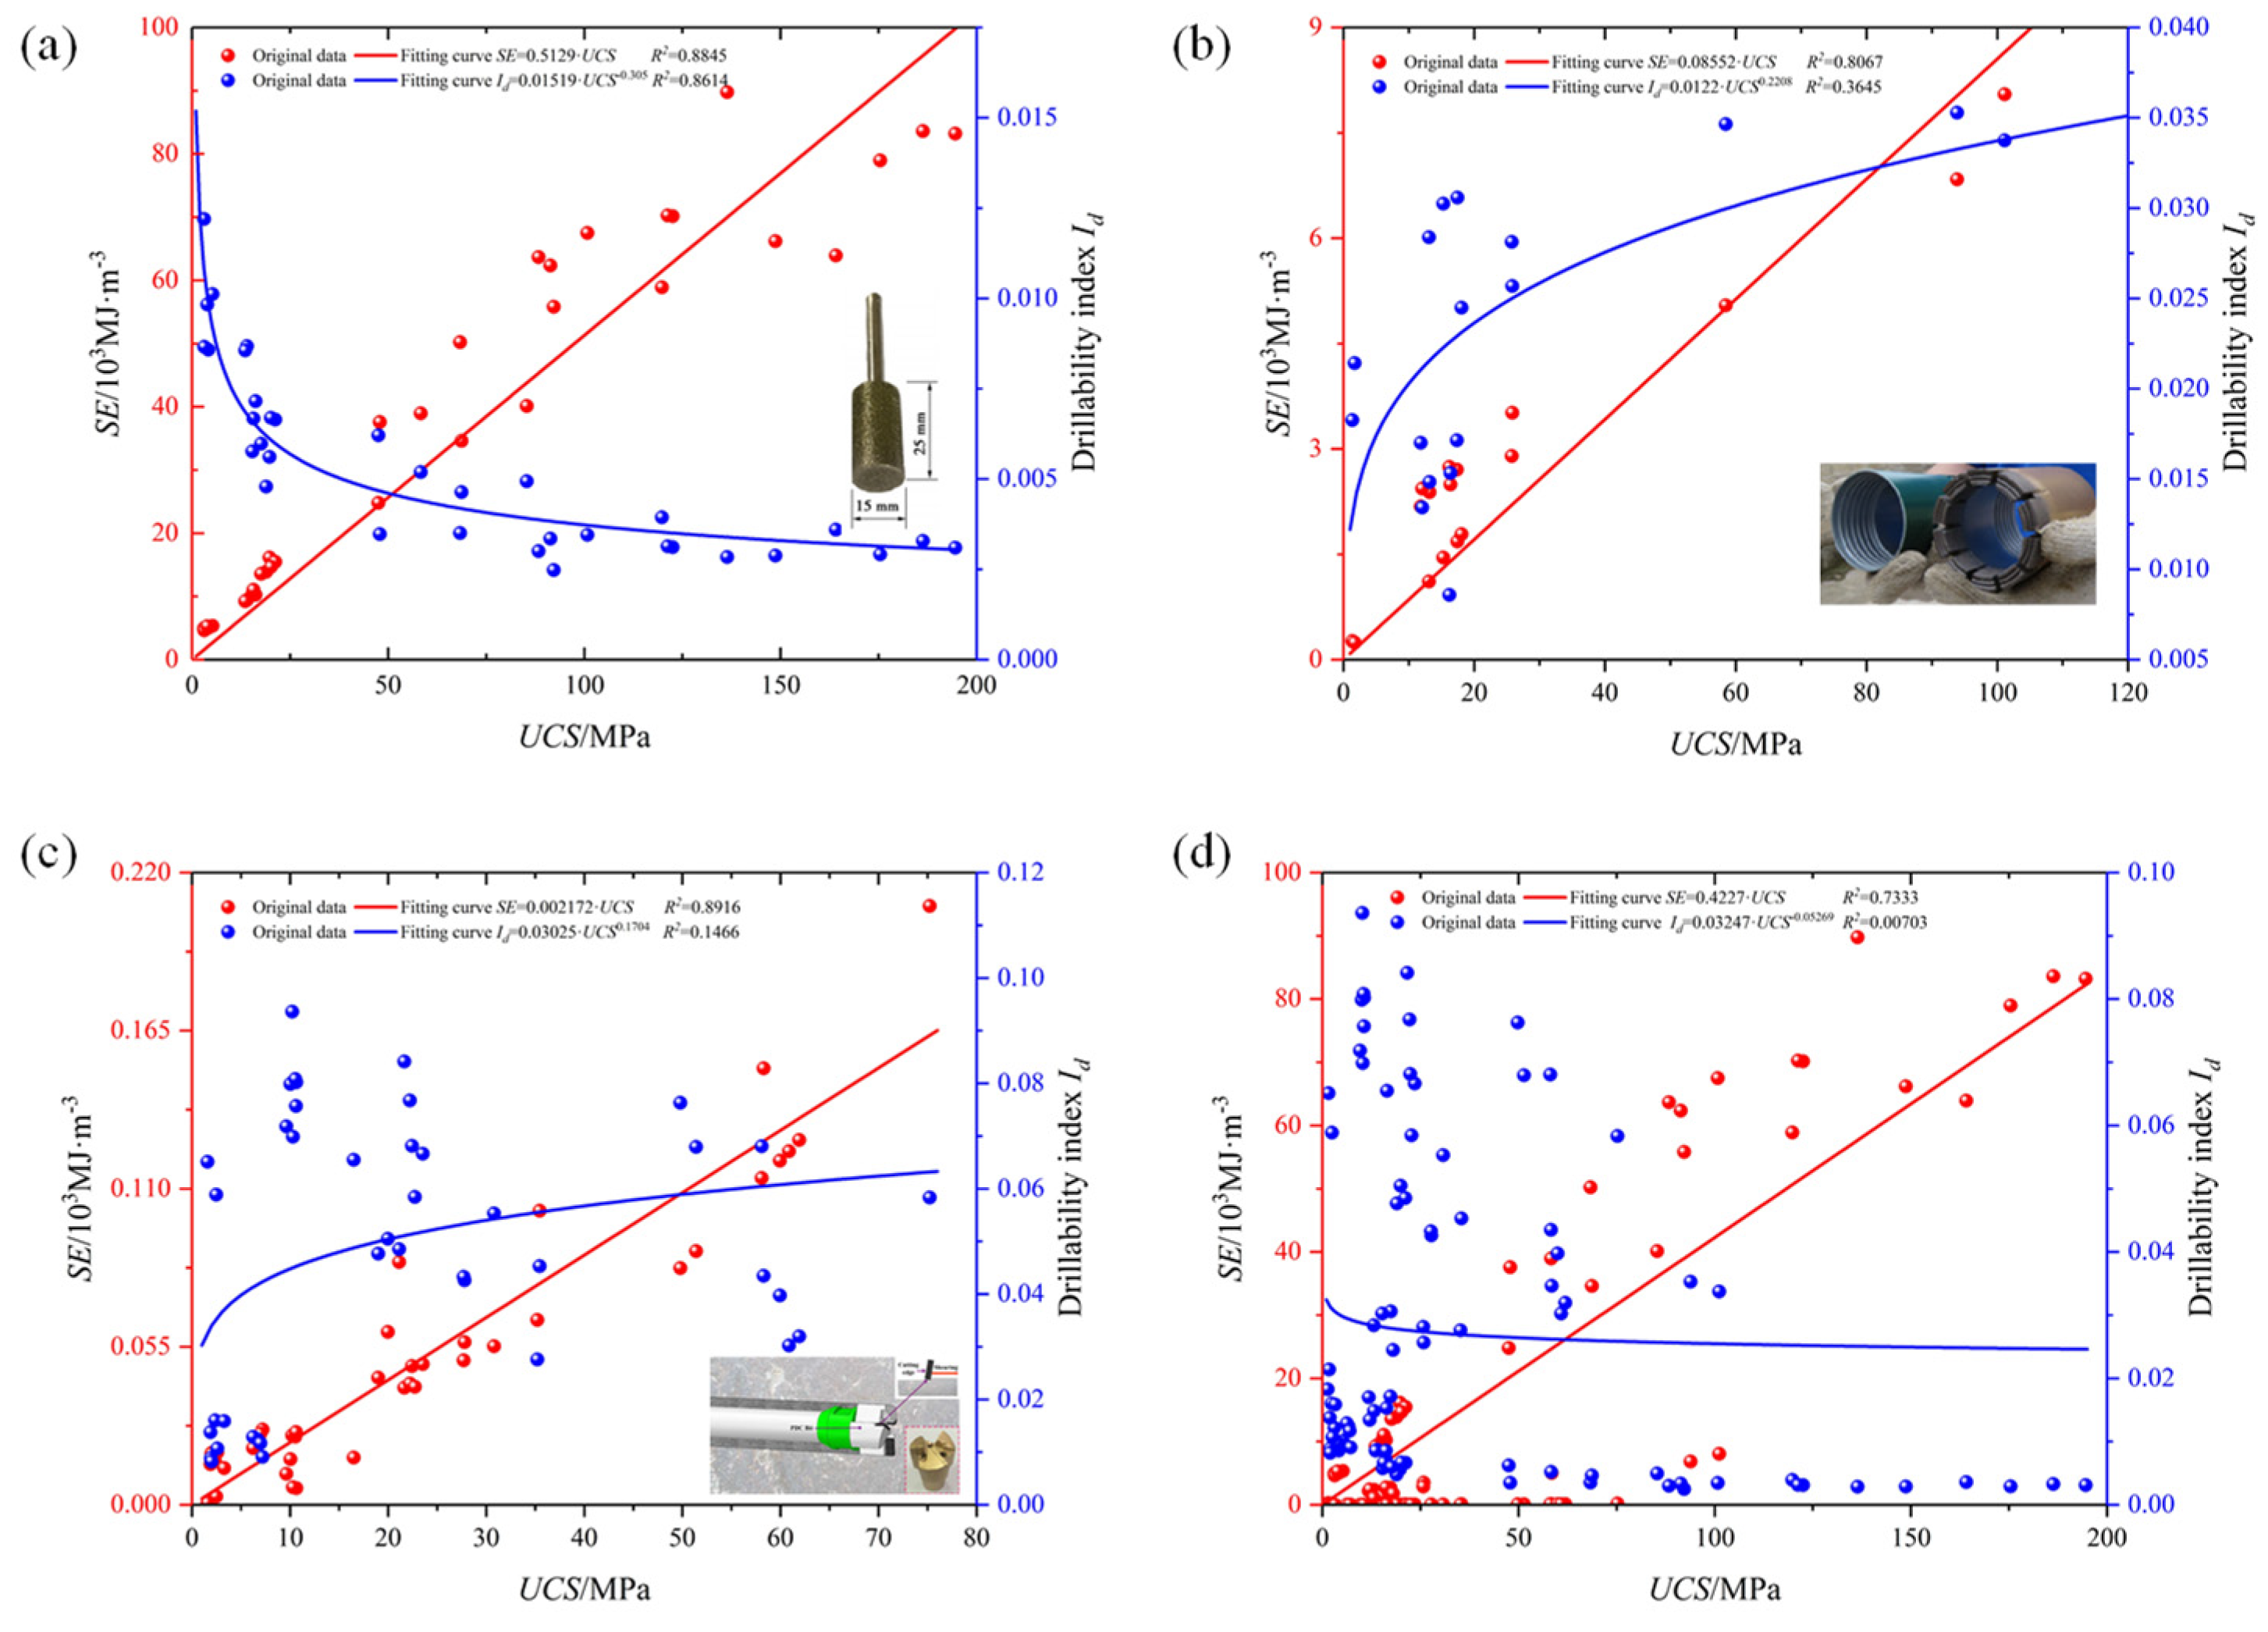
5.1. Univariate Model of UCS
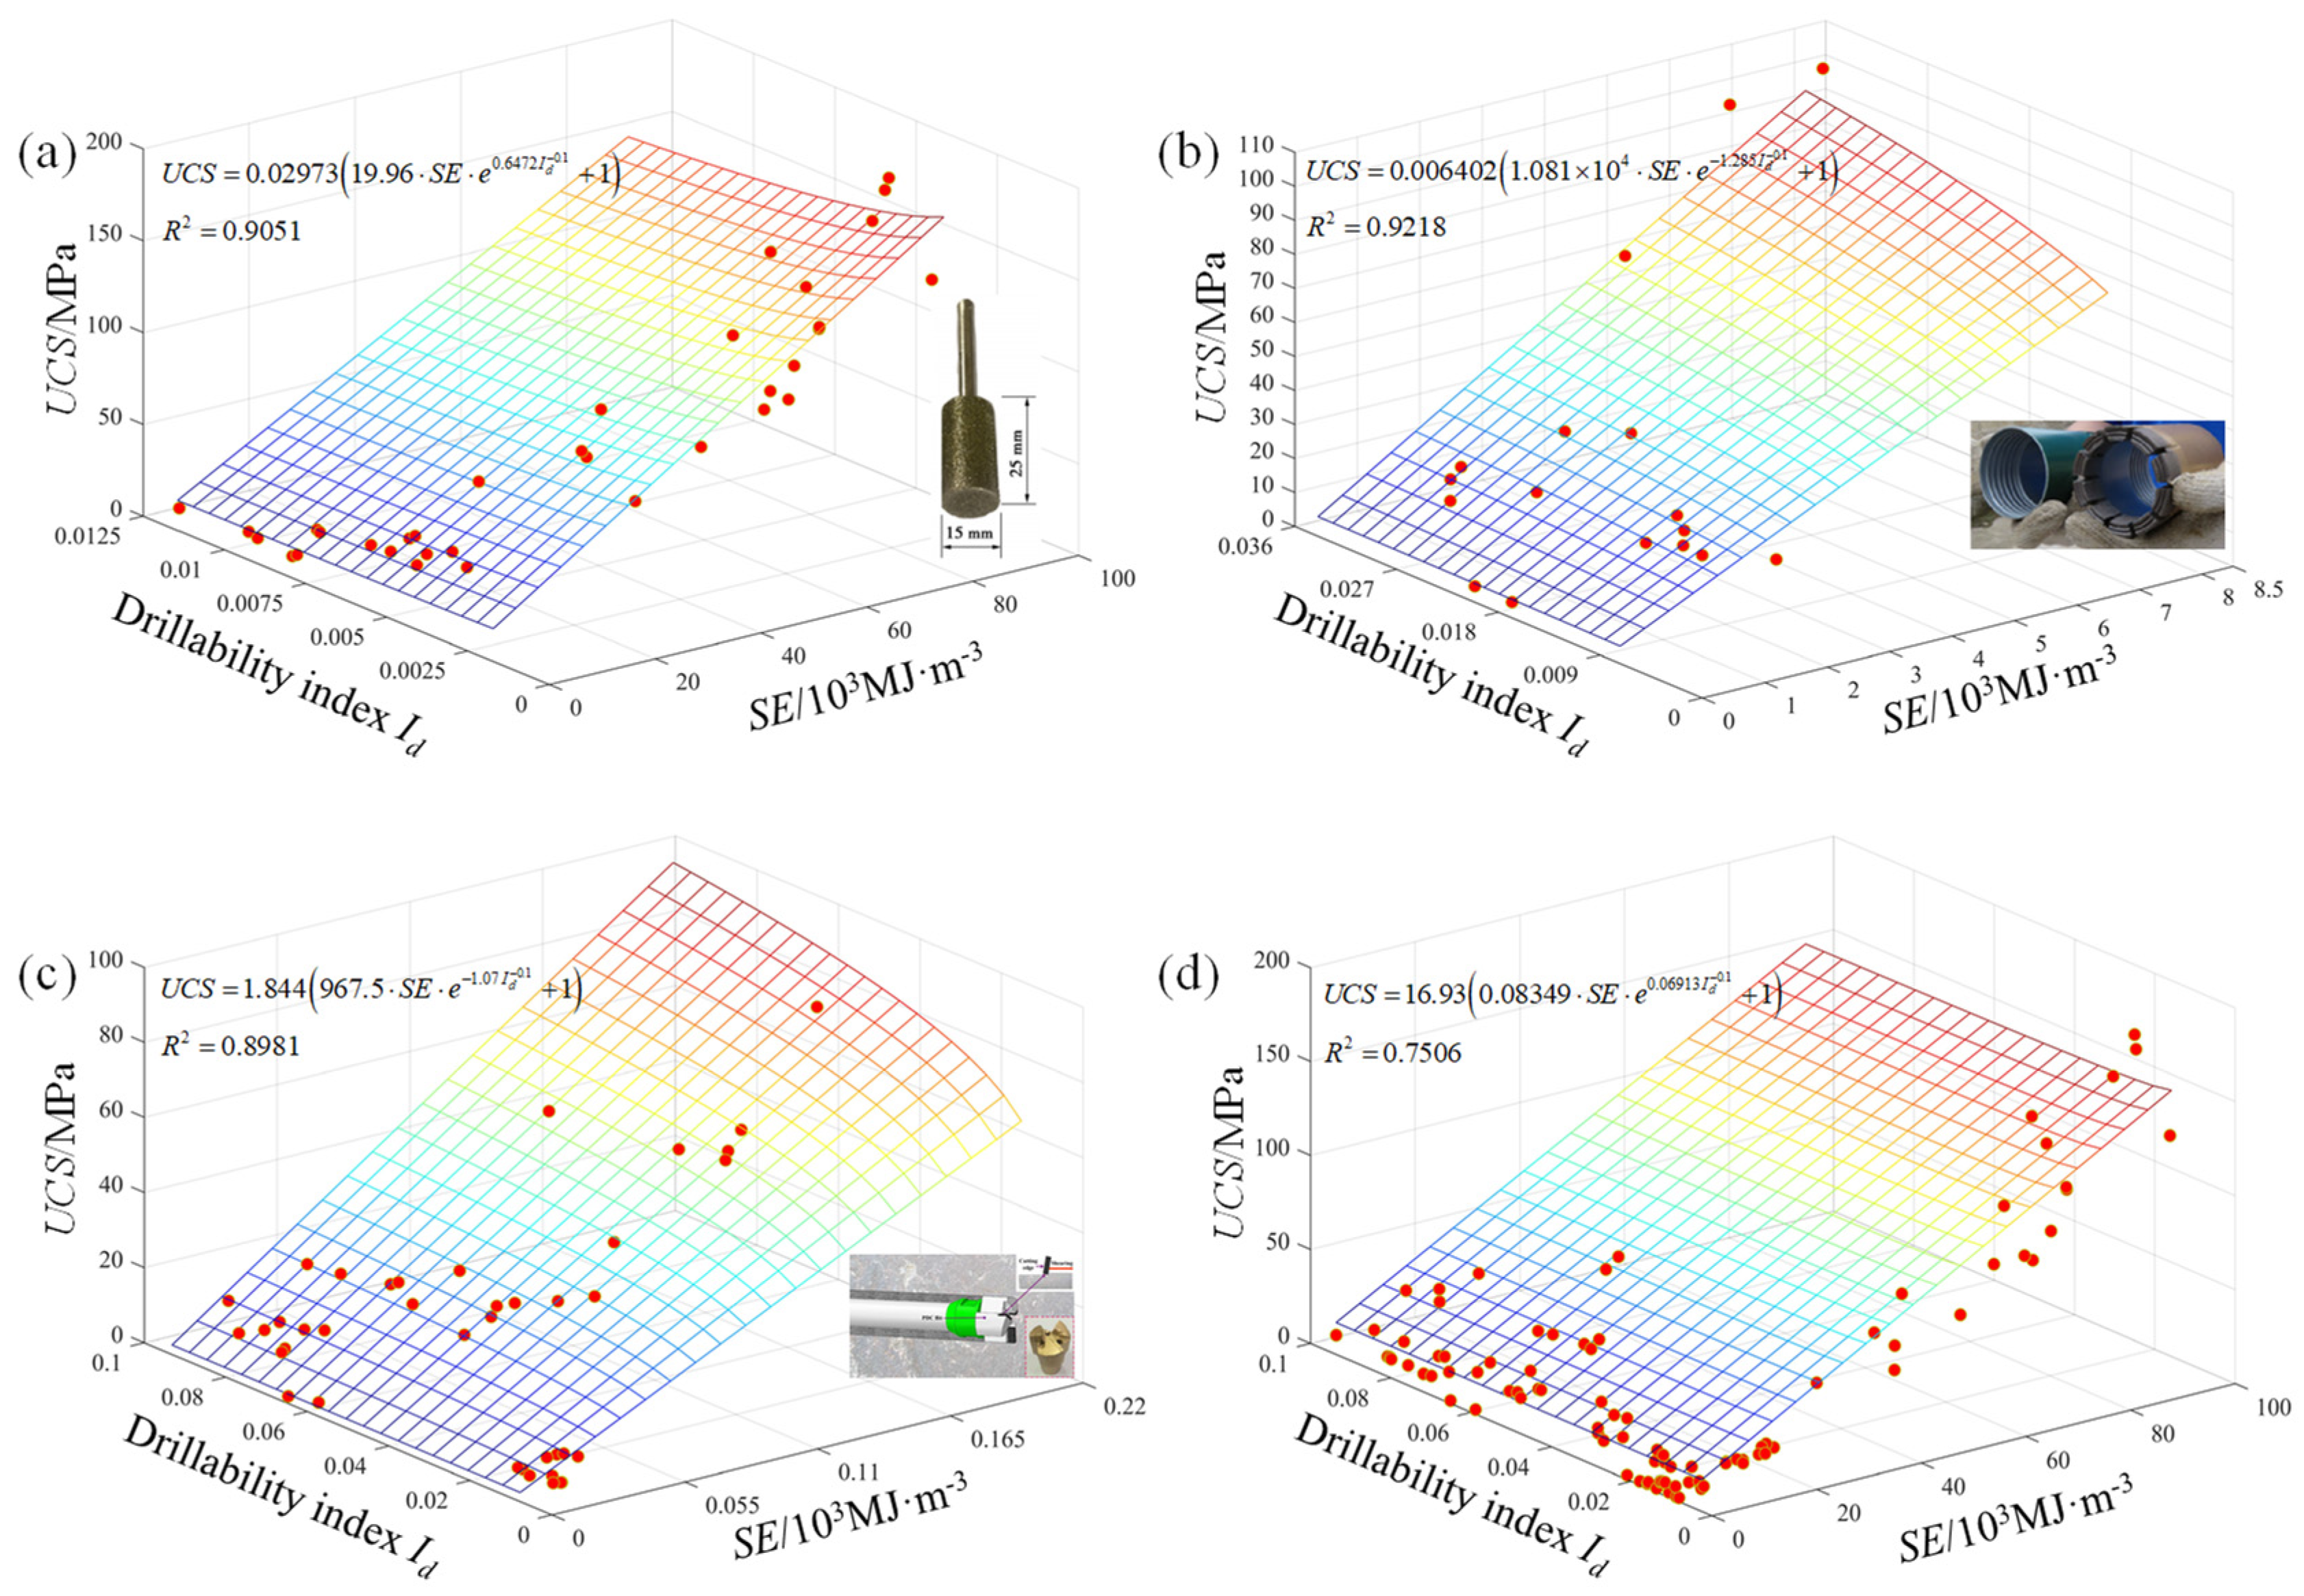
5.2. Two-Variate Model of UCS
5.3. Evaluation of UCS Prediction Models
6. Discussion
6.1. The Key DPM Parameters
6.2. UCS Prediction Model
7. Conclusions
Author Contributions
Funding
Institutional Review Board Statement
Informed Consent Statement
Data Availability Statement
Conflicts of Interest
References
- Jan, Y.M.; Campbell, R.L.J. Borehole correction of MWD gamma ray and resistivity logs. In SPWLA 25th Annual Logging Symposium; Society of Professional Well Log Analysts Inc.: Houston, TX, USA, 1984; pp. 189–197. [Google Scholar]
- Howarth, D.F.; Adamson, W.R.; Berndt, J.R. Correlation of model tunnel boring and drilling machine performances with rock properties. Int. J. Rock Mech. Min. Sci. Geomech. Abstr. 1986, 23, 171–175. [Google Scholar] [CrossRef]
- Zacas, M.; Kavadas, M.; Mihalis, I. The use of recording drilling parameters in rock mass classification. In Proceedings of the 8th ISRM Congress, Tokyo, Japan, 25–29 September 1995; International Society for Rock Mechanics: Salzburg, Austria, 1995; Volume 3, pp. 1121–1124. [Google Scholar]
- Gui, M.-W.; Soga, K.; Bolton, M.D.; Hamelin, J.P. Instrumented borehole drilling for subsurface investigation. J. Geotech. Geoenviron. 2002, 128, 283–291. [Google Scholar] [CrossRef] [Green Version]
- Schunnesson, H. RQD predictions based on drill performance parameter. Tunn. Undergr. Space Tech. 1996, 11, 345–351. [Google Scholar] [CrossRef]
- Yue, Z.Q.; Chen, J.; Gao, W. Automatic drilling process monitoring (DPM) for in-situ characterization of weak rock mass strength with depth. In 1st Canada-US Rock Mechanics Symposium (Rock Mechanics: Meeting Society’s Challenges and Demands); ARMA: Vancouver, BC, Canada, 2007; pp. 199–206. [Google Scholar]
- Tan, Z.Y.; Cai, M.F.; Yue, Z.Q.; Tham, L.G.; Lee, C.F. Application and reliability analysis of DPM system in site investigation of HK weathered granite. J. Univ. Sci. Technol. B 2005, 12, 481–488. [Google Scholar]
- Yue, Z.Q.; Lee, C.F.; Law, K.T.; Tham, L.G. Automatic monitoring of rotary percussive drilling for ground characterization illustrated by a case example in Hong Kong. Int. J. Rock Mech. Min. Sci. 2004, 41, 573–612. [Google Scholar] [CrossRef]
- Yue, Z.Q. Drilling process monitoring for refining and upgrading rock mass quality classification methods. Chin. J. Rock Mech. Eng. 2014, 33, 1977–1996. [Google Scholar]
- He, M.M.; Li, N.; Zhang, Z.Q.; Yao, X.C.; Chen, Y.S.; Zhu, C.H. An empirical method for determining the mechanical properties of jointed rock mass using drilling energy. Int. J. Rock Mech. Min. Sci. 2019, 116, 64–74. [Google Scholar] [CrossRef]
- Rodgers, M.; Mcvay, M.; Horhota, D.; Hernando, J. Assessment of Rock Strength from Measuring While Drilling Shafts in Florida Limestone. Can. Geotech. J. 2018, 55, 1154–1167. [Google Scholar] [CrossRef]
- Rodgers, M.; Mcvay, M.; Ferraro, C.; Horhota, D.; Tibbetts, C.; Crawford, S. Measuring Rock Strength While Drilling Shafts Socketed into Florida Limestone. J. Geotech. Geoenviron. 2018, 144, 04017121. [Google Scholar] [CrossRef]
- Rodgers, M.; Mcvay, M.; Horhota, D. Monitoring While Drilling Shafts in Florida Limestone. In Proceedings of the IFCEE 2018 Installation, Testing and Analysis of Deep Foundations (GSP 294), Orlando, FL, USA, 5–10 March 2018; American Society of Civil Engineers: Reston, VA, USA, 2018; pp. 613–621. [Google Scholar] [CrossRef]
- Rodgers, M.; Mcvay, M.; Horhota, D.; Sinnreich, J.; Hernando, J. Assessment of Shear Strength from Measuring While Drilling Shafts in Florida Limestone. Can. Geotech. J. 2018, 56, 662–674. [Google Scholar] [CrossRef]
- Karasawa, H.; Ohno, T.; Kosugi, M.; Rowley, J.C. Methods to estimate the rock strength and tooth wear while drilling with roller-bits-part 1: Milled-Tooth Tooth Bits. Energy Resour. Technol. 2002, 124, 125–132. [Google Scholar] [CrossRef]
- Karasawa, H.; Ohno, T.; Kosugi, M.; Rowley, J.C. Methods to estimate the rock strength and tooth wear while drilling with roller-bits-part 2: Insert bits. Energy Resour. Technol. 2002, 124, 133–140. [Google Scholar] [CrossRef]
- He, M.; Li, N.; Zhu, J.; Chen, Y. Advanced prediction for field strength parameters of rock using drilling operational data from impregnated diamond bit. J. Pet. Sci. Eng. 2019, 187, 106847. [Google Scholar] [CrossRef]
- Li, Y.; She, L.; Wen, L.; Zhang, Q. Sensitivity analysis of drilling parameters in rock rotary drilling process based on orthogonal test method. Eng. Geol. 2020, 270, 105576. [Google Scholar] [CrossRef]
- Li, H.; Liu, S.; Chang, H. Experimental research on the influence of working parameters on the drilling efficiency. Tunn. Undergr. Space Technol. 2020, 95, 103174. [Google Scholar] [CrossRef]
- Shang, F.; Yu, W.; Guo, Z.; Yu, Z.; Shan, W.; Rui, C.; Shang, X. Estimation of optimal drilling efficiency and rock strength by using controllable drilling parameters in rotary non-percussive drilling. J. Pet. Sci. Eng. 2020, 193, 107376. [Google Scholar] [CrossRef]
- Rossi, E.; Jamali, S.; Saar, M.O.; von Rohr, P.R. Field test of a Combined Thermo-Mechanical Drilling technology. Mode I: Thermal spallation drilling. J. Pet. Sci. Eng. 2020, 190, 107005. [Google Scholar] [CrossRef]
- Rossi, E.; Jamali, S.; Schwarz, D.; Saar, M.O.; von Rohr, P.R. Field test of a Combined Thermo-Mechanical Drilling technology. Mode II: Flame-assisted rotary drilling. J. Pet. Sci. Eng. 2020, 190, 106880. [Google Scholar] [CrossRef]
- Lakshminarayana, C.R.; Tripathi, A.K.; Pal, S.K. Prediction of Mechanical Properties of Sedimentary Type Rocks Using Rotary Drilling Parameters. Geotech. Geol. Eng. 2020, 38, 4863–4876. [Google Scholar] [CrossRef]
- Kalantari, S.; Hashemolhosseini, H.; Baghbanan, A. Estimating rock strength parameters using drilling data. Int. J. Rock Mech. Min. Sci. 2018, 104, 45–52. [Google Scholar] [CrossRef]
- Kalantari, S.; Baghbanan, A.; Hashemolhosseini, H. An analytical model for estimating rock strength parameters from small-scale drilling data. Rock Mech. Geotech. Eng. 2019, 104, 135–145. [Google Scholar] [CrossRef]
- Hughes, H.M. Some aspects of rock machining. Int. J. Rock Mech. Min. Sci. Geomech. Abstr. 1972, 9, 205–211. [Google Scholar] [CrossRef]
- Mellor, M. Normalization of specific energy values. Int. J. Rock Mech. Min. Sci. Geomech. Abstr. 1972, 9, 661–663. [Google Scholar] [CrossRef]
- Poane, J.; Madson, D.; Bruce, W.E. Drillability Studies: Laboratory Percussive Drilling; US Department of the Interior, Bureau of Mines: Washington, DC, USA, 1969. [Google Scholar]
- Zhang, K.; Hou, R.B.; Zhang, G.H.; Zhang, G.M.; Zhang, H.Q. Rock Drillability Assessment and Lithology Classification Based on the Operating Parameters of a Drifter: Case Study in a Coal Mine in China. Rock Mech. Rock Eng. 2016, 49, 329–334. [Google Scholar] [CrossRef]
- Yu, B.S.; Zhang, K.; Niu, G.G.; Xue, X.R. Real-time rock strength determination based on rock drillability index and drilling specific energy: An experimental study. B. Eng. Geol. Environ. 2021, 80, 3589–3603. [Google Scholar] [CrossRef]
- Teale, R. The concept of specific energy in rock drilling. Int. J. Rock Mech. Min. Sci. Geomech. Abstr. 1965, 2, 57–73. [Google Scholar] [CrossRef]
- Kahraman, S. Rotary and percussive drilling prediction using regression analysis. Int. J. Rock Mech. Min. Sci. 1999, 36, 981–989. [Google Scholar] [CrossRef]
- Kahraman, S.; Balci, C.; Yazici, S.; Bilgin, N. Prediction of the penetration rate of rotary blast hole drilling using a new drillability index. Int. J. Rock Mech. Min. Sci. 2000, 37, 729–743. [Google Scholar] [CrossRef]
- Ataei, M.; KaKaie, R.; Ghavidel, M.; Saeidi, O. Drilling rate prediction of an open pit mine using the rock mass drillability index. Int. J. Rock Mech. Min. Sci. 2015, 73, 130–138. [Google Scholar] [CrossRef]
- Ocak, I.; Seker, S.E. Estimation of elastic modulus of intact rocks by artificial neural network. Rock Mech. Rock Eng. 2012, 45, 1047–1054. [Google Scholar] [CrossRef]
- Yesiloglu-Gultekin, N.; Gokceoglu, C.; Sezer, E.A. Prediction of uniaxial compressive strength of granitic rocks by various nonlinear tools and comparison of their performances. Int. J. Rock Mech. Min. Sci. 2013, 62, 113–122. [Google Scholar] [CrossRef]
- Sarkar, K.; Tiwary, A.; Singh, T.N. Estimation of strength parameters of rock using artificial neural networks. Bull. Eng. Geol. Environ. 2010, 69, 599–606. [Google Scholar] [CrossRef]
- He, M.M.; Zhang, Z.Q.; Ren, J.; Huan, J.Y.; Li, G.F.; Chen, Y.S.; Li, N. Deep convolutional neural network for fast determination of the rock strength parameters using drilling data. Int. J. Rock Mech. Min. Sci. 2019, 123, 104084. [Google Scholar] [CrossRef]
- Roxborough, F.F.; Phillips, H.R. Rock excavation by disc cutter: Authors reply to the Discussion on F. F. Roxborough and H. R. Phillip’s paper. Int. J. Rock Mech. Min. Sci. Geomech. Abstr. 1975, 12, 361–366. [Google Scholar] [CrossRef]
- Jalali, S.E.; Zare, M. An analytical pre-feasibility study to generate rotary-percussive concept in hard rock TBMs. J. Geol. Min. Res. 2009, 1, 140–148. [Google Scholar]
- Marji, M.F. Simulation of crack coalescence mechanism underneath single and double disc cutters by higher order displacement discontinuity method. J. Cent. South Univ. 2015, 22, 1045–1054. [Google Scholar] [CrossRef]
- Marji, M.F. Rock Fracture Mechanics with Displacement Discontinuity Method; LAP Lambert Academic Publishing, Yazd Univ, Dept Min Engn: Yazd, Iran, 2014. [Google Scholar]
- Goetz, J.N.; Brenning, A.; Petschko, H.; Leopolda, P. Evaluating machine learning and statistical prediction techniques for landslide susceptibility modeling. Comput. Geosci-UK 2015, 81, 1–11. [Google Scholar] [CrossRef]
- Cutler, D.R.; Edwards, T.C., Jr.; Beard, K.H.; Cutler, A.; Hess, K.T.; Gibson, J.; Lawler, J.J. Random forests for classification in ecology. Ecology 2007, 88, 2783–2792. [Google Scholar] [CrossRef]
- Chang, C.C.; Lin, C.J. LIBSVM: A library for Support Vector Machines; ACM Transactions on Intelligent Systems and Technology: New York, NY, USA, 2011. [Google Scholar]
- Cutler, D.R.; Edwards, T.C., Jr.; Beard, K.H.; Cutler, A.; Hess, K.T.; Gibson, J.; Lawler, J.J. Landslide spatial modeling: Introducing new ensembles of ANN, MaxEnt, and SVM machine learning techniques. Geofis. Internacional. 2017, 305, 314–327. [Google Scholar]
- Breiman, L. Random forests. Mach. Learn. 2001, 45, 5–32. [Google Scholar] [CrossRef] [Green Version]
- Cortes, C.; Vapnik, V. Support-vector networks. Mach. Learn. 1995, 20, 273–297. [Google Scholar] [CrossRef]
- Tang, K.S.; Man, K.F.; Kwong, S.; He, Q. Genetic Algorithms and Their Applications. IEEE Signal Process. 1996, 13, 21–37. [Google Scholar] [CrossRef]
- Wang, S.F.; Li, X.B.; Yao, J.R.; Gong, F.Q.; Li, X.; Du, K.; Tao, M.; Huang, L.Q.; Du, S.L. Experimental investigation of rock breakage by a conical pick and its application to non-explosive mechanized mining in deep hard rock. Int. J. Rock Mech. Min. Sci. 2019, 122, 104063. [Google Scholar] [CrossRef]
- Wang, S.F.; Sun, L.C.; Li, X.B.; Wang, S.Y.; Du, K.; Li, X.; Feng, F. Experimental investigation of cuttability improvement for hard rock fragmentation using conical cutter. Int. J. Geomech. 2021, 21, 06020039. [Google Scholar] [CrossRef]
- Wang, S.F.; Tang, Y.; Li, X.B.; Du, K. Analyses and predictions of rock cuttabilities under different confining stresses and rock properties based on rock indentation tests by conical pick. Trans. Nonferr Metal. Soc. 2021, 31, 1766–1783. [Google Scholar] [CrossRef]
- Wang, S.F.; Tang, Y.; Wang, S.Y. Influence of brittleness and confining stress on rock cuttability based on rock indentation tests. J. Cent. South Univ. 2021, 28, 2786–2800. [Google Scholar] [CrossRef]
- Wang, Y.J.; She, L.; Zhao, Y.F.; Cao, R.L. Experimental study on measurement of rock strength parameters based on digital drilling technology. Chin. J. Geotech. Eng. 2020, 42, 1659–1668. [Google Scholar]
- He, M.M. Research on the prediction of rock mass mechanics characteristics based on the rotary penetration technology. Xi’an: Xi’an Univ. Technol. 2021, 28, 2786–2800. [Google Scholar]
- Wang, Y.J.; She, L.; Zhao, Y.F.; Cao, R.L. Method for Measuring Rock Mass Characteristics and Evaluating the Grouting-Reinforced Effect Based on Digital Drilling. Rock Mech. Rock Eng. 2018, 52, 841–851. [Google Scholar] [CrossRef]
- Wang, Q.; Qin, Q.; Gao, S.; Li, S.C.; Gao, H.K.; He, M.C.; Jiang, B.; Zhang, C. Relationship between rock drilling parameters and rock uniaxial compressive strength based on energy analysis. J. China Coal Soc. 2018, 43, 1289–1295. [Google Scholar]


| N/r·min−1 | F/kN | ROP/cm·min−1 | T/N·m | SE/MJ·m−3 |
|---|---|---|---|---|
| 40 | 10 | 3.02 | 68.195 | 81.48 |
| 11.5 | 3.31 | 72.011 | 78.76 | |
| 19 | 3.74 | 91.091 | 89.04 | |
| 28 | 3.69 | 113.987 | 113.48 | |
| 35 | 3.95 | 131.795 | 123.25 | |
| 40 | 4.03 | 144.515 | 132.79 | |
| 45 | 4.27 | 157.235 | 136.92 | |
| 50 | 3.61 | 169.955 | 173.99 | |
| 60 | 3.85 | 195.395 | 188.42 | |
| 65 | 4.27 | 208.115 | 181.99 | |
| 70 | 4.22 | 220.835 | 195.43 | |
| 115 | 8.5 | 3.44 | 64.379 | 191.98 |
| 19 | 4.44 | 91.091 | 211.82 | |
| 23.5 | 4.52 | 102.539 | 234.57 | |
| 29 | 4.81 | 116.531 | 251.06 | |
| 35.75 | 5.11 | 133.703 | 271.77 | |
| 42 | 6.38 | 149.603 | 244.96 | |
| 46.5 | 7.55 | 161.051 | 224.01 | |
| 53 | 7.01 | 177.587 | 265.73 | |
| 58.25 | 7.29 | 190.943 | 275.23 | |
| 60.5 | 5.87 | 196.667 | 350..07 | |
| 65 | 6.00 | 208.115 | 362.76 | |
| 220 | 8.7 | 3.09 | 64.888 | 410.74 |
| 18.25 | 4.784 | 89.183 | 366.12 | |
| 29 | 6.46 | 116.531 | 355.88 | |
| 34.85 | 7.71 | 131.4134 | 337.31 | |
| 40 | 6.68 | 144.515 | 427.54 | |
| 46.7 | 7.60 | 161.560 | 421.15 | |
| 51.5 | 7.83 | 173.771 | 440.06 | |
| 57.5 | 7.53 | 189.035 | 497.68 | |
| 60 | 7.21 | 195.395 | 536.97 | |
| 400 | 8.5 | 4.36 | 64.399 | 525.06 |
| 11.5 | 5.24 | 72.031 | 490.54 | |
| 18.8 | 6.55 | 90.602 | 492.93 | |
| 25 | 7.23 | 106.375 | 530.47 | |
| 30 | 8.09 | 119.095 | 551.47 | |
| 35.5 | 8.91 | 133.087 | 534.99 | |
| 42.5 | 13.31 | 150.895 | 435.13 | |
| 48.75 | 11.72 | 166.795 | 530.57 | |
| 53 | 10.61 | 177.607 | 584.46 | |
| 58 | 12.86 | 190.327 | 584.19 |
| Model Type | T-F | V-F | V-T | SE-F | SE-T | |||||||
|---|---|---|---|---|---|---|---|---|---|---|---|---|
| Fitting model | T = aF + b | R2 | V = aF b | R2 | V = aT b | R2 | SE = aF + b | R2 | SE = aT + b | R2 | ||
| Rotating speed/r·min−1 | 40 | a | 2.544 | 1 | 2.386 | 0.7057 | 1.364 | 0.6666 | 2.049 | 0.967 | 0.8056 | 0.967 |
| b | 42.75 | 0.1331 | 0.2096 | 55.2 | 20.75 | |||||||
| 115 | a | 2.544 | 1 | 1.584 | 0.7132 | 0.3744 | 0.6941 | 2.363 | 0.6803 | 0.9288 | 0.6803 | |
| b | 42.75 | 0.3536 | 0.5493 | 167.4 | 127.7 | |||||||
| 220 | a | 2.544 | 1 | 1.606 | 0.8447 | 0.3172 | 0.7830 | 2.659 | 0.5109 | 1.045 | 0.5109 | |
| b | 42.76 | 0.3934 | 0.6147 | 319.1 | 274.4 | |||||||
| 400 | a | 2.544 | 1 | 1.214 | 0.8803 | 0.09685 | 0.8749 | 1.108 | 0.1826 | 0.4354 | 0.1826 | |
| b | 42.77 | 0.5788 | 0.9337 | 489.3 | 470.6 | |||||||
| Regression Model | Rotating Speed /r·min−1 | R2 | RMSE | |||||||||
|---|---|---|---|---|---|---|---|---|---|---|---|---|
| F-T | F-V | T-V | F-SE | T-SE | F-T | F-V (kN) | T-V (N·m) | F-SE (MJ·m−3) | T-SE (MJ·m−3) | |||
| Two-dimensional | 40 | 1 | 0.7057 | 0.6666 | 0.9670 | 0.9670 | 0.005 | 0.207 | 0.2198 | 7.547 | 40.841 | |
| 115 | 1 | 0.7132 | 0.6941 | 0.6803 | 0.6803 | 0.005 | 0.675 | 0.6970 | 28.640 | 98.618 | ||
| 220 | 1 | 0.8447 | 0.7830 | 0.5109 | 0.5109 | 0.00496 | 0.591 | 0.7047 | 43.047 | 43.983 | ||
| 400 | 1 | 0.8803 | 0.8749 | 0.1826 | 0.1826 | 0.00498 | 1.032 | 1.0551 | 38.552 | 18.222 | ||
| Three-dimensional | N-F-V | N-T-V | SE=f (F, N, V, A) | N-F-V (cm·min−1) | N-T-V (cm·min−1) | SE=f (F, N, V, A) (MJ·m−3) | ||||||
| 0.903 | 0.879 | 0.996 | 0.794 | 0.890 | 10.11 | |||||||
| Prediction Models | Trian Set | Test Set | ||
|---|---|---|---|---|
| R2 | RMSE (MJ·m−3) | R2 | RMSE (MJ·m−3) | |
| GA-SVM | 99.99% | 0.2578 | 99.98% | 2.5208 |
| RF | 94.55% | 42.1341 | 95.91% | 48.7496 |
| References | Bit Types | Bit Geometry Parameter | Data Size |
|---|---|---|---|
| Wang [54] | Standard diamond solid bit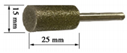 | Radius is 7.5 mm | 34 |
| He [55] | Impregnated diamond bit | External diameter is 70mm, and external diameter is 60 mm | 17 |
| Wang [56,57] | PDC bit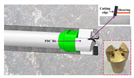 | Cutting edge L1, L2 and L3 are 18, 18 and 27 mm, respectively, and radius is 30 mm | 42 |
| Bit Types | UCS Prediction Model | |
|---|---|---|
| SE-UCS | Id-UCS | |
| Standard diamond solid bit | ||
| Impregnated diamond bit | ||
| PDC bit | ||
| Combine the above three bits | ||
| UCS Models | Standard Diamond Solid Bit | Impregnated Diamond Bit | PDC Bit | Combine the Above Three Bits | |||||
|---|---|---|---|---|---|---|---|---|---|
| R2 | RMSE | R2 | RMSE | R2 | RMSE | R2 | RMSE | ||
| Univariate model | SE-UCS | 0.8845 | 9.6273 (103 MJ·m3) | 0.8067 | 0.8927 (103 MJ·m3) | 0.8916 | 0.0151 (103 MJ·m3) | 0.7333 | 12.7979 (103 MJ·m3) |
| Id-UCS | 0.8614 | 0.0041 | 0.3645 | 0.0064 | 0.1466 | 0.0240 | 0.0070 | 0.0260 | |
| Two-variate model | SE-Id-UCS | 0.9051 | 18.3554 (MPa) | 0.9218 | 7.9442 (MPa) | 0.8981 | 6.5318 (MPa) | 0.7506 | 22.8337 (MPa) |
Publisher’s Note: MDPI stays neutral with regard to jurisdictional claims in published maps and institutional affiliations. |
© 2022 by the authors. Licensee MDPI, Basel, Switzerland. This article is an open access article distributed under the terms and conditions of the Creative Commons Attribution (CC BY) license (https://creativecommons.org/licenses/by/4.0/).
Share and Cite
Wang, S.; Tang, Y.; Cao, R.; Zhou, Z.; Cai, X. Regressive and Big-Data-Based Analyses of Rock Drillability Based on Drilling Process Monitoring (DPM) Parameters. Mathematics 2022, 10, 628. https://doi.org/10.3390/math10040628
Wang S, Tang Y, Cao R, Zhou Z, Cai X. Regressive and Big-Data-Based Analyses of Rock Drillability Based on Drilling Process Monitoring (DPM) Parameters. Mathematics. 2022; 10(4):628. https://doi.org/10.3390/math10040628
Chicago/Turabian StyleWang, Shaofeng, Yu Tang, Ruilang Cao, Zilong Zhou, and Xin Cai. 2022. "Regressive and Big-Data-Based Analyses of Rock Drillability Based on Drilling Process Monitoring (DPM) Parameters" Mathematics 10, no. 4: 628. https://doi.org/10.3390/math10040628
APA StyleWang, S., Tang, Y., Cao, R., Zhou, Z., & Cai, X. (2022). Regressive and Big-Data-Based Analyses of Rock Drillability Based on Drilling Process Monitoring (DPM) Parameters. Mathematics, 10(4), 628. https://doi.org/10.3390/math10040628