Article

Modeling Uranium Transport in Rough-Walled Fractures with Stress-Dependent Non-Darcy Fluid Flow

1
State Key Laboratory of Mining Response and Disaster Prevention and Control in Deep Coal Mines, Anhui University of Science and Technology, Huainan 232001, China
2
Institute of Energy, Hefei Comprehensive National Science Center, Hefei 230031, China
3
School of Mechanics and Civil Engineering, China University of Mining and Technology (Beijing), Beijing 100083, China
*
Authors to whom correspondence should be addressed.
Mathematics 2022, 10(5), 702; https://doi.org/10.3390/math10050702
Submission received: 2 January 2022 / Revised: 18 February 2022 / Accepted: 21 February 2022 / Published: 23 February 2022

Abstract

:
The reactive-transportation of radioactive elements in fractured rock mass is critical to the storage of radioactive elements. To describe the reactive-transportation and distribution morphology of a uranium-containing solution, a stress-dependent reactive transport model was developed, and the simulator of FLAC3D-CFD was employed. The uranium transport experiment subjected to the variation of confining stress of 5–19 MPa and hydraulic pressure of 0.5–3.5 MPa was conducted in fractured rock mass. The results show that the uranium-containing solution transport and distribution is significantly dependent on the evolution of the connected channel in rough-walled fracture, which is significantly influenced by the confining stress and hydraulic pressure. In more detail, the increase of confining stress resulted in the anisotropic of seepage channel in aperture, and corresponding turbulence flow and uranium retention were presented at the fracture aperture of 2–5 μm. As the increase of hydraulic pressure, flow regime evolved from the inertial flow to vortex flow, and the transformation region is 16 MPa confining stress and 1.5 MPa hydraulic pressure. The evolution of loading paths also dominates the flow and solute transport, and high seepage speed and strong solute transport were presented at the k = 1 (ratio of vertical stress loading to horizontal stress unloading), and a laminar flow and weak solute transport were presented at k = 0.

1. Introduction

The nuclear energy provides 16% clear energy for human development, while abandoning radioactive resources threatens the environment safety and human health. Uranium as a fundamental nuclear energy material attracts the attention of researchers and engineers in the field of mining and contaminant disposal. During the uranium mining, the original rock stress and flow state of the reservoir are destroyed, which is manifested by the propagation of fractures and the migration of radioactive pollutants. Natural rock mass is a multiphase medium in which solid, liquid, and gaseous phases co-exist. The geologic structure influenced by the mining dominates the strength capability and uranium transport behavior. Efforts are being made to study the structure change, uranium transport, desorption, adsorption, and precipitation in fractured rock masses, which significantly contributes to the mining of uranium and disposal of a uranium-containing solute [1,2,3,4,5,6,7,8].
The hydrogeological structure and interaction between the solid, gas, and fluid in the resource deposits are crucial to the uranium exploration and pollution prevention [9,10,11,12]. When methods of in situ leaching are employed in the mining industry, the fracturing of the host rock dominates the behaviors of the orebody during the recovery of the mined uranium. Specifically, the effect of fracture geometric properties, including the density, orientation, aperture, and roughness, and the flow regime, mechanical degeneration, containment transport, and retention, was investigated considering the external reactive activities on a multi-scale [13,14,15,16]. By combining the latest technological achievements in equipment, such as hydraulic pumping, computed tomography, three-dimensional (3D) profilers, materials test systems, and rapid triaxial rock (RTR)-1000 [17,18,19], in the field of in situ measurement and experimental study, novel discoveries were made, and empirical formulas were derived [20,21,22,23,24,25,26]. Kim et al. studied the reactive transport of uranium with bacteria in fractured rock and conducted a sensitivity analysis, based on a developed model [27]. Boissezon et al. modelled the uranium and 226Ra mobility during and after an acidic in situ recovery test [28]. Feng et al. developed a fractal discrete fracture network model to study the radon migration in fractured media [29]. Wang et al. revealed that the concentration of HCO3 increased after CO2 injection, and CO2 was able to migrate toward the shallow aquifer through existing leakage pathways, and availability of Fe3+ is the main factor that limits mineralized uranium release [30,31]. Baghbanan developed a nonlinear algorithm for predicting the normal stress–normal displacement behavior of fractures [32]. Rong conducted water flow tests through non-mated rough-walled fractures under normal stresses ranging from 1.0 MPa to 5.0 MPa [33]. Zhang experimentally investigated the fluid flow regimes through deformable rock fractures by conducting water flow tests through both mated and non-mated sandstone fractures in triaxial cells [34].
On the other hand, the algorithms and mathematical model contribute to visualization of the geochemical-physical coupling process [35,36,37,38]. Rutqvist presented a linked multicontinuum and crack tensor approach for modeling coupled geomechanics, fluid flow, and solute transport in fractured rocks [39]. Lei reported a stress-induced variable aperture model to characterize the effect of polyaxial stress conditions on the fluid flow in 3D persistent fracture networks and performed the geomechanical modeling of the fractured rock by the finite-discrete element method (FEMDEM) [40]. Zhao presented a closed-form solution for modeling the coupled stress–flow–transport processes along a single fracture embedded in a porous rock matrix [41]. Crandall related the macroscopic roughness parameters to the effective flow through fractures, examining the relationship between wall roughness and fluid flow in rock fractures [42]. Akhavan quantified the effects of crack width, tortuosity, and roughness on the water permeability of cracked mortars [43].
The in situ leaching uranium and contaminants control is a complex geomechanical and geochemical process, and the transport and retention of the uranium-containing solution through a fractured rock mass significantly affects the underground environment safety. The characterization of transport and retention of the in situ leaching uranium in a fractured rock mass is important. In this study, a stress-dependent reactive transport model, describing the coupling evolution of geofractures and uranium-containing solute transport in fractured rock mass, was established. The transport and distribution of the uranium-containing solution in a fractured rock mass, located at an overlying resource reservoir of ordos basin, were studied, combined with the FLAC3D-CFD simulator. The factors, including fracture morphology, confining stress, and loading path, that influence the uranium-containing transport and distribution were analyzed. In the following section, the mathematical model was described, the application of the established model was showed in Section 3, the results and analysis were conducted in Section 4, and the conclusions were made in Section 5.

2. Mathematical Model for Uranium Transport in Rough-Walled Fractures

The reactive transport of the in situ leaching uranium is a complex process of diffusion, adsorption, desorption, and oxidation–reduction, which was deeply influenced by the variation of component, structure, hydraulic gradient and in situ stress. The geomechanical, geochemical, and hydro-mechanical effect on the transport of uranium should be taken into account, as the reactive transport of uranium is modelled.

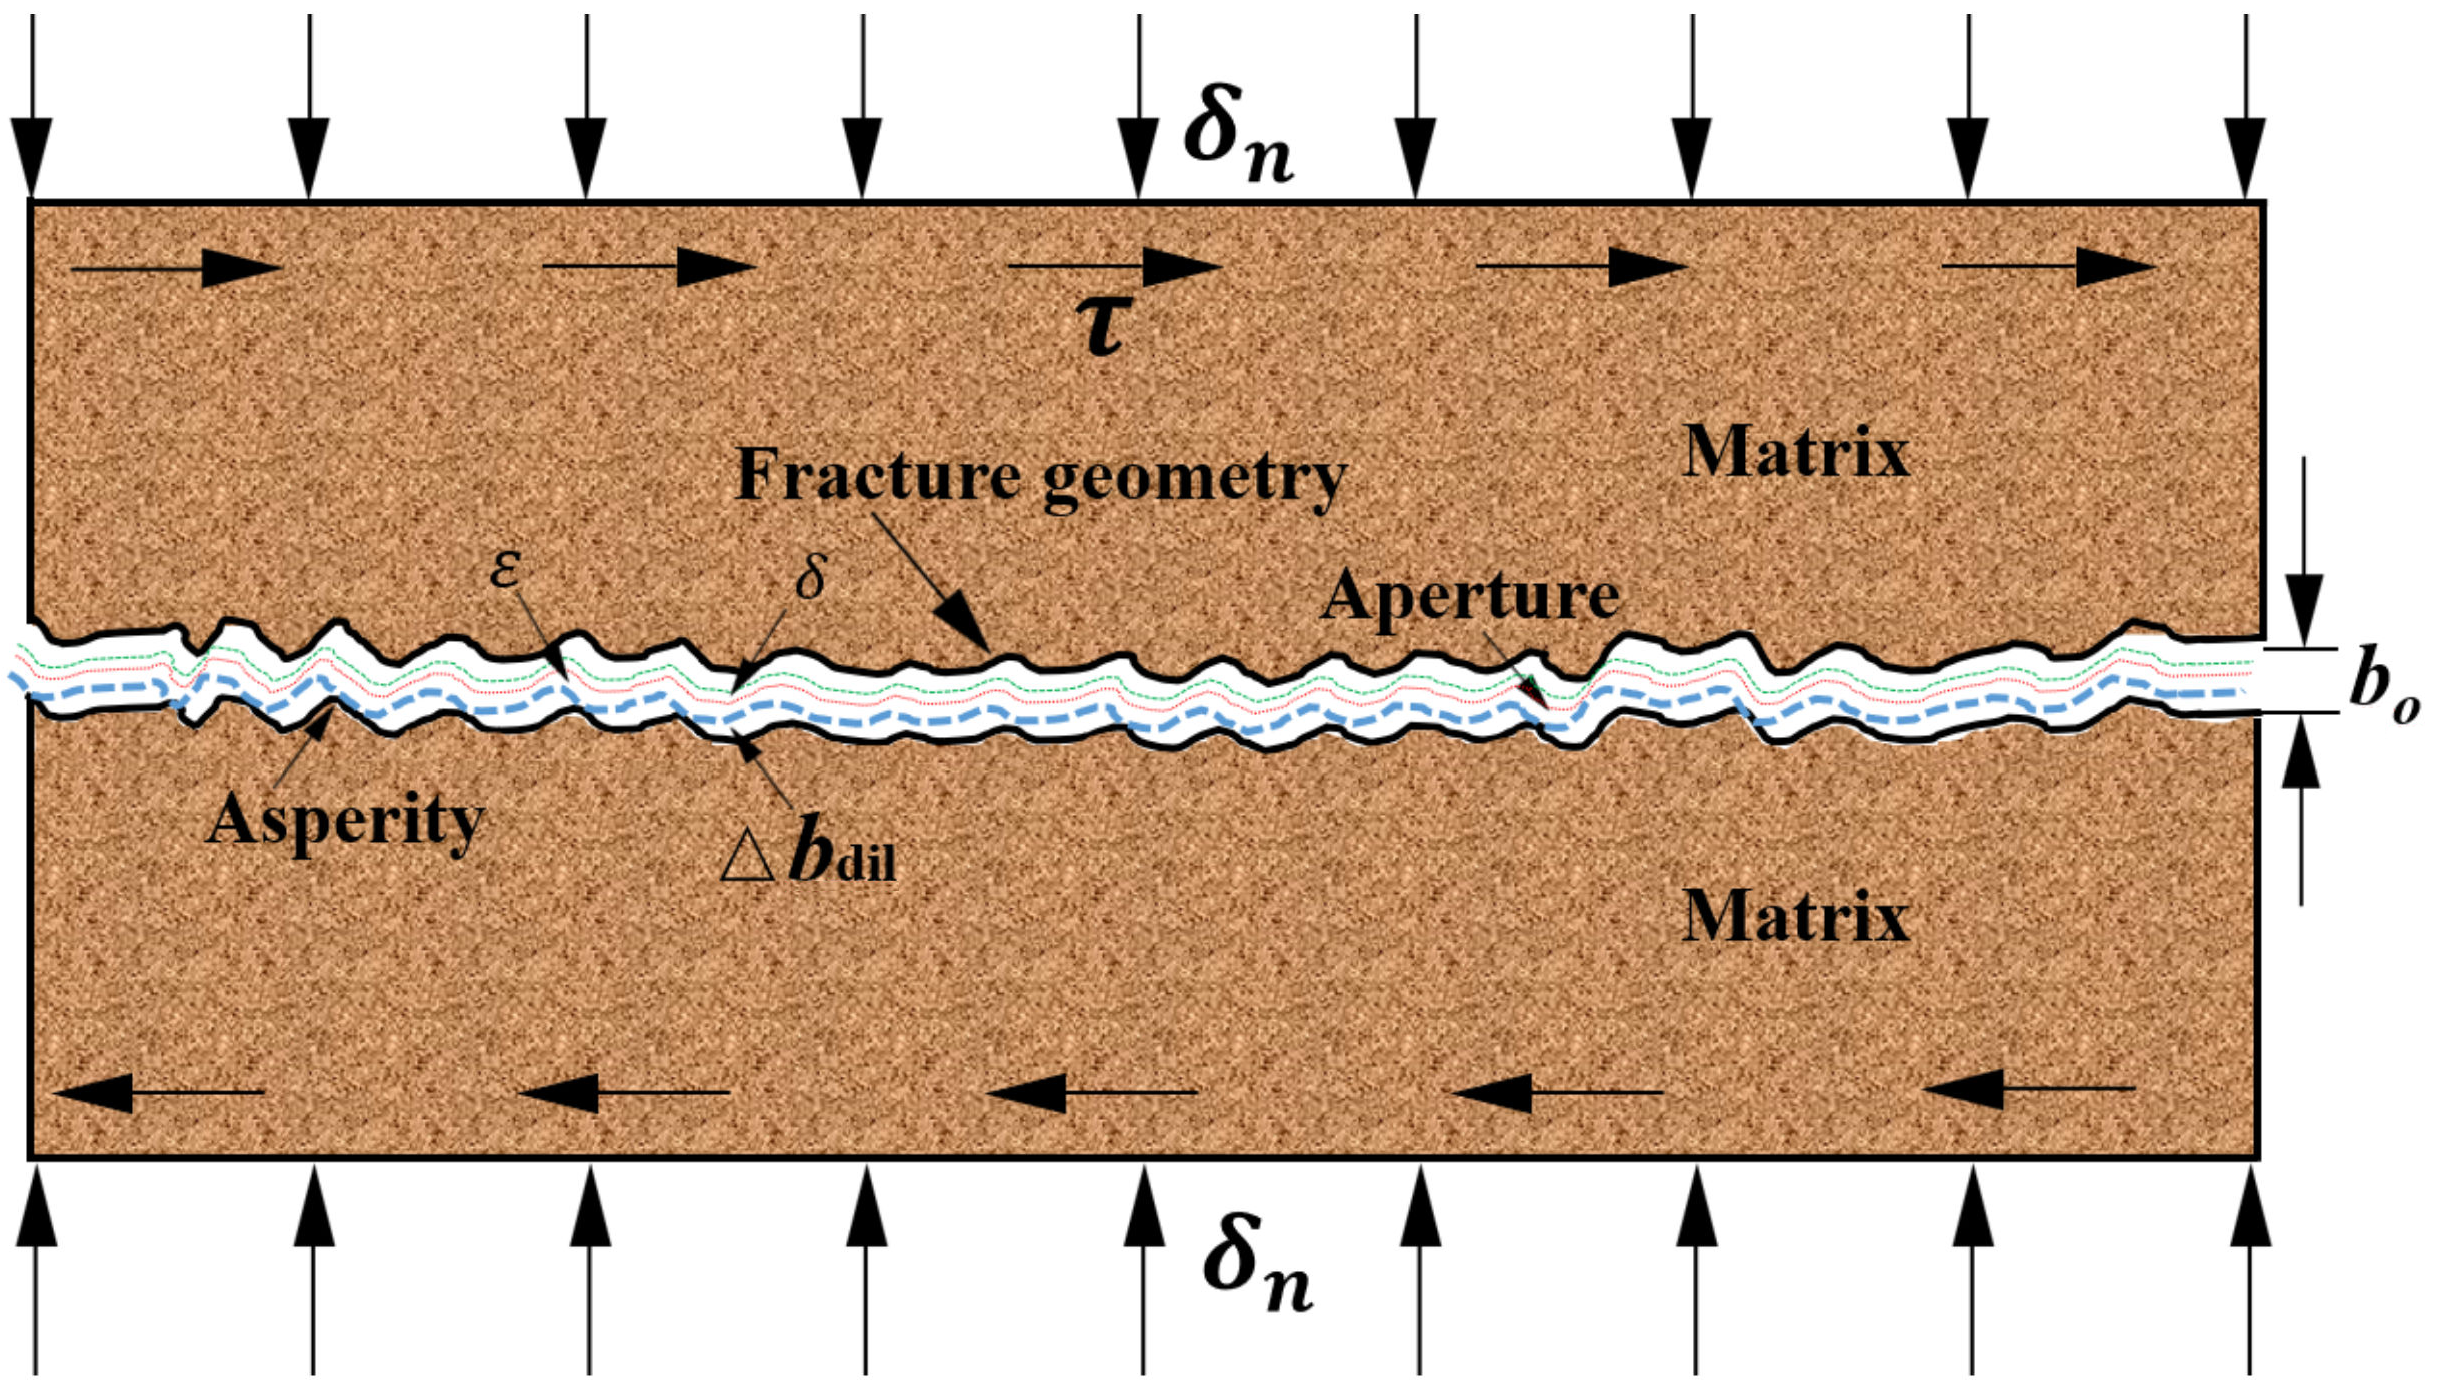
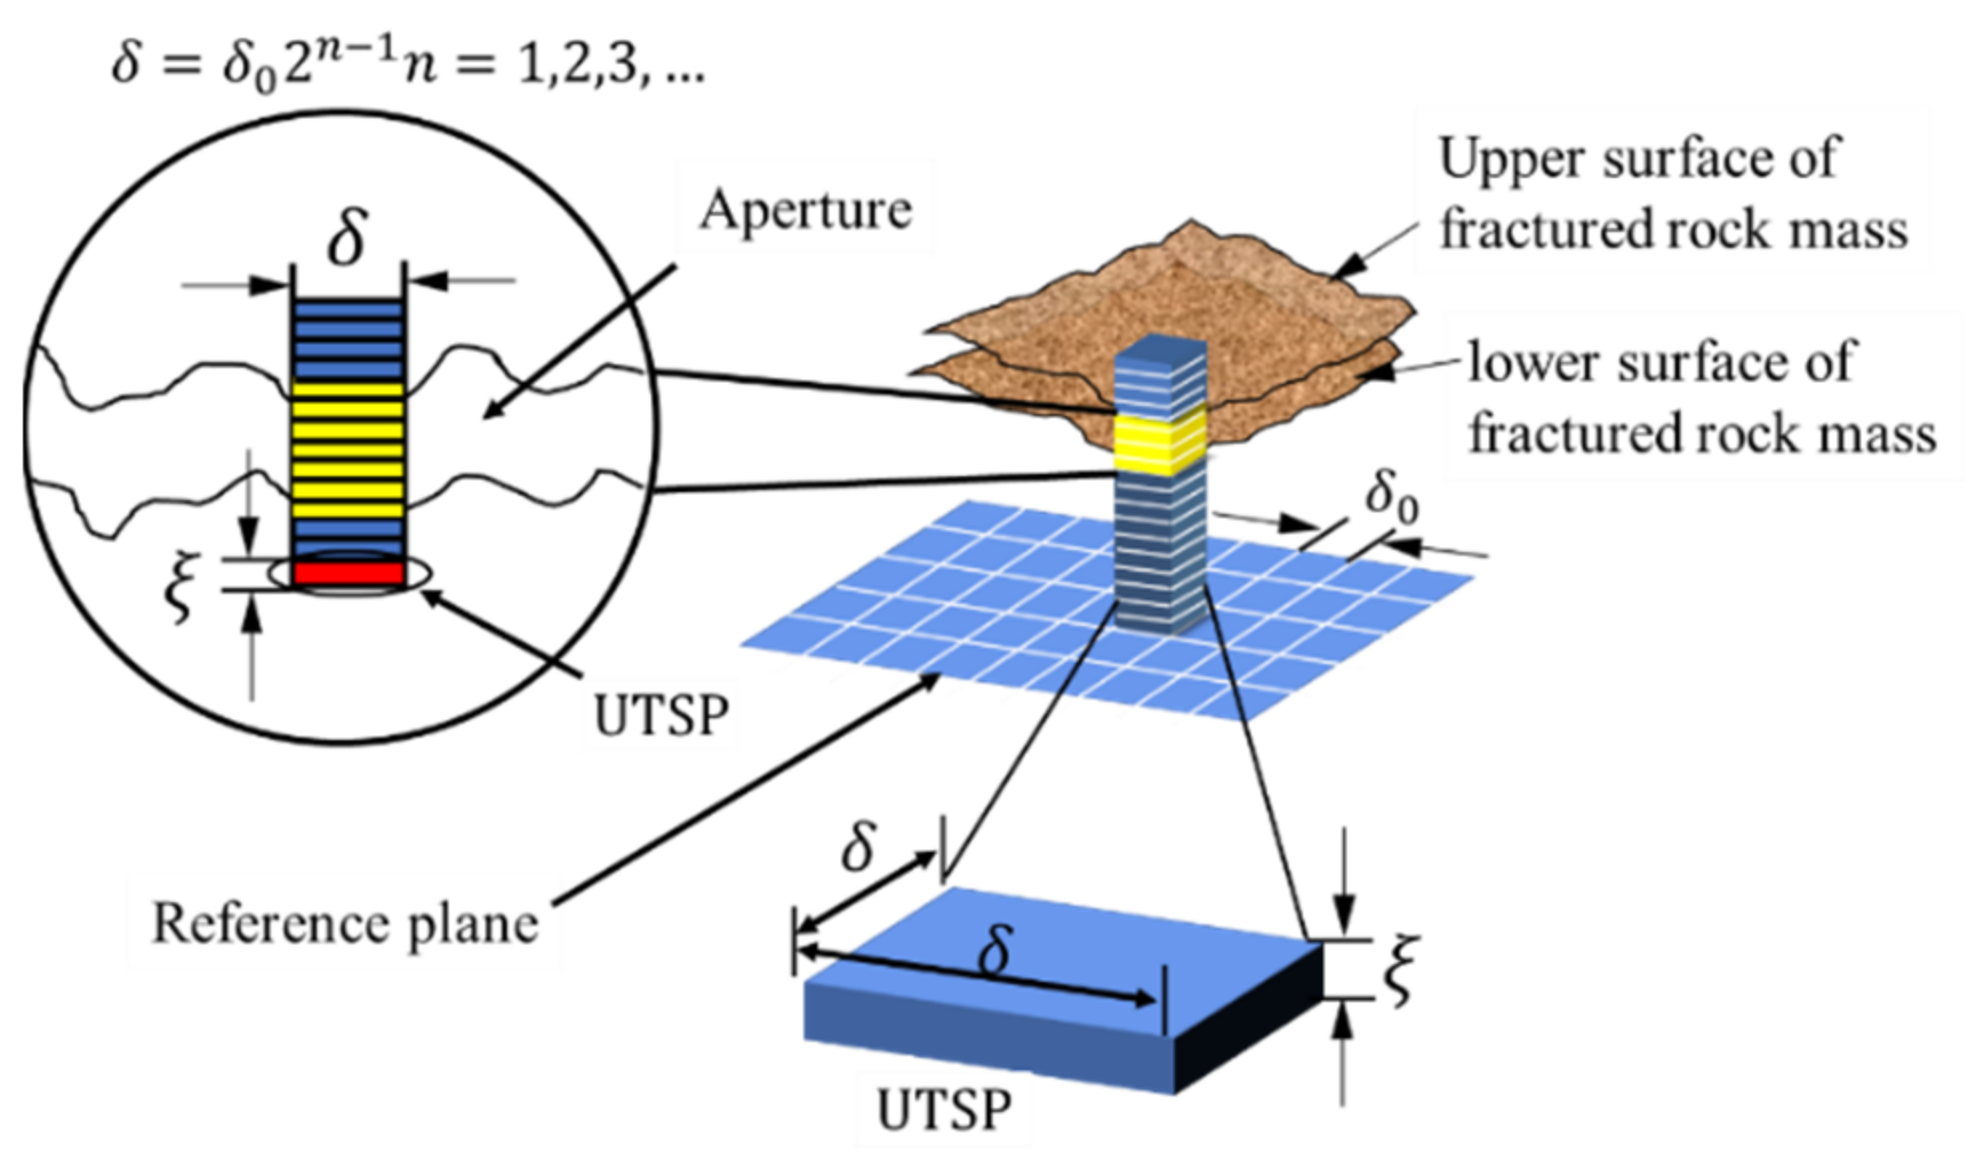
2.1. Equivalent Hydromechanical Coupling Description

The flow regimes and morphology of the uranium-containing solute in fractured rock mass is dominated by fluid kinematical viscosity and the fracture geometric property. Changes in the fractured rock structure induced by normal stress and shear stress are characterized by the normal displacement and shear dilation, as shown in Figure 1. The fracture aperture, as a function of normal closure, dilatational strain and shear expansion, is governed by the following equation:
b = h i δ + Δ b d i l + ε + b 0
where δ is the normal closure; h i , the maximum closure; ε , the dilation strain; Δ b d i l , the shear expansion; and b 0 , is initial aperture.
Considering the fracture geometry of contact area and connecting void, the equivalent mechanic aperture can be described as follows:
e = b 1 1.1 w 4 ( 1 + 2 D ) 3 / 5
w = w 1 + n e σ n k n
where b is the mechanical aperture; e, the equivalent fracture aperture; w , the contact area;   w 1 , the initial contact area; n, the normal direction; D, the fractal dimension of the connecting void. In this work, the ultra-thin square plate (UTSP) covering method was used to calculate the fractal dimension, as shown in (Figure 2) [44].
The description of aperture closure in the normal direction was studied by Bandis [45] in 1983 and progressively modified by Baghbanan and Jing [32], as shown below:
δ = 9 σ n h i σ n c + 10 σ n
where σ n is the normal stress; σ n c ,   the critical normal stress to end-closed fracture; and h i , the maximum closure. Furthermore, the normal stiffness is expressed as follows:
k n = ( 10 σ n + σ n c ) 2 6 σ n c b 0
where K n is the normal stiffness. In addition, the effect of the shear stress on the fracture dilation was studied by Chen [16], and the following specific expression was obtained:
Δ b d i l = 1 b 0 ψ peak r 1 e r δ δ 0 + ψ peak 3 9 r 1 e 3 r δ δ 0
ψ f peak   = JRClog 10 JCS σ z f
where Δ b d i l is the fracture dilation caused by shear stress; JRC, the roughness coefficient of the fracture; JCS, the wall compressive strength of fracture; ψ f peak , the peak dilatancy angle of the fracture.
Furthermore, the dilation strain caused by the geochemical reaction is shown:
ε = a t b 0 < t < t 0 a t 0 t > t 0
where a and b are the fitting parameters related to the attribute of the rock mass; t0, the threshold of dilatational strain; t, the experiment time.
On the other hand, structural changes in the fractured rock mass contribute to its self-mechanical attribute. To express the anisotropic and heterogeneous rock mass strength, the dynamic equivalent bulk modulus and shear modulus related to the fracture and matrix strength are governed by the following equation in the work of Gan [46]:
K = 1 1 K i n t   a c t + f r a c n u m 2 V r a t i o b 1 K n f 1 K s f 1 n 2 4 + 1 K s f n 1 2
G = 1 1 G i n t   a c t + f r a c n u m 2 V r a t i o b 1 K n f 1 K s f n 1 4 n 1 2 n 2 2 + 1 K s f n 1 2
where Kintact is the bulk modulus of the intact rock; Gintact, the shear modulus of the intact rock; and Vratio, the volumetric ratio of the truncated fracture over the element volume.

2.2. Flow Regime in Fractured Structures

In order to determine the flow state in a rough-walled fracture, the Darcy flow, non-Darcy flow, and turbulent flow subjected to changes in hydraulic gradient and fracture geometry were considered. The Forchheimer equation, given in the form shown in Equation (11), has been widely used as the empiric and theoretic formula to describe the flow behavior in porous media and rock fractures [15].
Forchheimer equation is described as:
J = A v + B v 2 ,
where J is the pressure gradient in the flow direction, and v, the seepage velocity. Furthermore, A and B are the coefficients describing energy losses due to viscous and inertial dissipation mechanisms, respectively. A is calculated by μ k , and B is expressed as β ρ , where μ is the dynamic viscosity of fluid; k , the intrinsic permeability; β , the non-Darcy coefficient; and ρ , the fluid density. Taking the equivalent mechanic aperture into account, the intrinsic permeability vector k i j and non-Darcy coefficient vector β i j are expressed as:
k i j = f r a c n u m 1 12 P k k δ i j P i j = f r a c n u m 1 12 V r a t i o b i n i e 3 n k 2 δ i j V r a t i o b i n i e 3 n i n j
β i j = f r a c n u m A i j p i j / 2 b i j e b i j + 1
where Aij and bij are dimensionless regression coefficients; Pij represents the influence of asperity height; bini is the initial aperture of fracture.

2.3. Reactive Transport in Fractured Rock Mass

For in situ leaching of uranium, chemical reactions between the alkaline leaching solute and solid uranium can be described using the following expression:
U O 2 S I + 1 2 O 2 a q I I + C O 3 2 a q I I I + 2 H C O 3 a q I V U O 2 C O 3 4 a q V + H 2 O l V I
Variations in the components of the reactive transport are expressed as follows:
t c I I + c I I U = σ c s ρ φ R I I
t c I I I + c I I I U = σ c s ρ φ R I I I
t c I V + c I V U = σ c s ρ φ R I V
t c V + c V U = σ c s ρ φ R V
t c I = σ c s ρ s 1 φ R I
where CI is the uranium oxide grade; CII, CIII, CIV, and CV are the mass fractions of the solute; U is the transport velocity; σ(cS) is the effective reaction area of the uranium ore; φ is the porosity; RI is the source of uranium oxide; and RII, RIII, RIV, and RV are the solute source terms.
The migration of multispecies in a fluid flow is governed by the following reactive advection–dispersion equation:
α l ρ l φ l k t + α l ρ l u l φ l k α l Γ l k φ l k = S l k k = 1 , , N
where 𝜙𝑙𝑘 is the component of the scalar 𝑘, defined as the ratio of k component mass to phase-𝑙; 𝛼𝑙 is the volume fraction, defined as the ratio of phase-l volume to the solution volume; 𝜌𝑙, and 𝑢𝑙 are the density, and velocity of the species-𝑙, respectively; and Γ𝑙𝑘 and 𝑆𝑙𝑘 are the diffusion coefficient and source item, respectively.

2.4. Transport Kinetic Equation

The governing equation of fluid flow in fractured rock followed Navier–Stokes (N-S) equations.
Continuity equation:
ρ f t + ρ f u = 0
Momentum conservation equation:
ρ f u t + ρ f u u = p + μ f u + u T 2 3 μ f u I
where ρf is the fluid density, u is the fluid velocity, p is the fluid pressure, μf is the hydrodynamic viscosity, I is the identity matrix.

2.5. Integrated Reactive Transport Model

Considering the structural change caused by physicomechanical effects, the transport of the uranium-containing solute through a rough-walled fracture is given as:
U O 2 S + 1 2 O 2 a q + C O 3 2 a q + 2 H C O 3 a q U O 2 C O 3 4 a q + H 2 O l ρ f t + ρ f u = 0 ρ f u t + ρ f u u = p + μ f u + u T 2 3 μ f u I α l ρ l φ l k t + α l ρ l u l φ l k α l Γ l k φ l k = S l k , k = 1 , , N K = 1 1 K i n t   a c t + f r a c n u m 2 V r a t i o b 1 K n f 1 K s f 1 n 2 4 + 1 K s f n 1 2 G = 1 1 G i n t   a c t + f r a c n u m 2 V r a t i o b 1 K n f 1 K s f n 1 4 n 1 2 n 2 2 + 1 K s f n 1 2 J = μ k υ + β ρ υ 2 , k i j = f r a c n u m 1 12 P k k δ i j P i j = f r a c n u m 1 12 V r a t i o b i n i e 3 n k 2 δ i j V r a t i o b i n i e 3 n i n j ,   ( 14 ) β i j = f r a c n u m A i j p i j / 2 b i j e b i j + 1 .

2.6. Simulation Scheme

During the performance the developed model, the transformation script was edited using the fish and C language to call the FLAC3D and CFD. The stress tensor, hydraulic pressure, and fracture geometry were transferred between FLAC3D and CFD. The specific procedure is as follows, and scheme is shown in Figure 3.
The mesh model was established in the FLAC3D and CFD firstly, according to the simulation object. Then, the mechanical calculation was conducted in the FLAC3D, and a corresponding strain tensor in each block was obtained based on the Mohr–Coulomb criterion, and the convergence of the calculation is set as 10−5; The strain tensor was transferred into the corresponding block in the CFD model based on the transformation script, and the permeability was defined based on Equations (12) and (13), and the pressure differences and fluid velocity were changed based on Equations (21) and (22). Simultaneously, the diffusion of the uranium-containing solution was re-calculated, combining the source of chemical solution. The calculation was conducted until the setting time. Finally, the fluid pressure was transferred into the corresponding block in FLAC3D through the UDS and fish script, and the effective stress was modified considering the fluid pressure. Then, the strain tensor was modified based on the Mohr–Coulomb criterion, and the convergence of the calculation was setup as 10−5. Then, the next cycle was conducted, based on the above scheme.

2.7. Model Verification

To validate the application of the established model in the fractured rock mass, a results comparison between the model calculation and experiment work of Chen et al. [1] was conducted. In more detail, the sample is granite collected from a potential site for China’s high-level radioactive waste disposal repository, with a density of 2.64–2.68 g/cm3, porosity of 0.44–0.62%, uniaxial compressive strength of 97–161 MPa, and permeability of 10−20 and 10−19 m2. The model with a diameter of 50 mm and length of 100 mm was established, and the fractured rock samples with mean asperity height of 0.62 mm, 0.95 mm, 1.3 mm, 1.5 mm, and JRC of 6.0, 7.1, 8.8, 10.1 were collected. The seepage experiment subjected to a series of hydraulic pressure ranging from 0.25 to 6.4 MPa was conducted at a certain boundary stress, and the corresponding boundary stress increases from 5 to 25 MPa. The geometry parameter, including asperity, aperture, and JCR, was transferred into the FLAC3D-CFD simulation. Detailed information about the relationship between the seepage velocity and hydraulic pressure difference is presented in Figure 4. The curve is the calculated result, and the point is the experimental result. Based on the results, it illustrates that the stress-dependent fracture geometry and hydraulic pressure-dependent flow regime can be well expressed. As boundary stress increased, the seepage channel decreased and corresponding hydraulic pressure difference increased, while the increase of hydraulic pressure promoted the flow transferred from Darcy flow to non-Darcy flow. As shown in Figure 4, the theoretical prediction is almost consistent with the experiment data with the R2 (The coefficient of determination R2 evaluates the accuracy of the match and represents the degree to which the regression line fits the data. The agreement is best at R2 = 1.0) of 0.97–0.99. The seepage behavior and spatiotemporal coupling of stress–fracture–seepage in fractured rock masses can be well described using the proposed model.

3. Case Study

The Nalinggou uranium and Tarangaole coal mine is an overlay resources reservoir of Ordos Basin, in which the uranium is located at 410 m depth with the grade of 0.5%, and coal is located at a 600 m depth. The mathematical model was applied to simulate the migration of the uranium from a uranium layer to coal seam. The specimens were collected from the overlay resources reservoir, and artificial fractures were created. The fracture geometry, including the roughness, asperity, and aperture, were captured by a 3D laser scanner, as shown in Figure 5, and the geometry parameters of the experiment fracture are listed in Table 1. The fluid and mechanical parameter was confirmed based on the in situ leaching technology and uranium-containing layer. The model with dimensions of 100 mm length and 50 mm width was established in a FLAC3D-CFD simulator. Then, the hydromechanical parameters were imported, and radioactive transport and morphology were calculated. In more detail, the boundary was constrained by the confining stress of 16 MPa, and hydraulic pressure is set as 0.5–3.5 MPa, and the mass fraction of uranium-containing solution UO2(CO3)34− is set as 5 × 10⁻⁴ at the fracture inlet. Additionally, the preparation process is shown in Figure 6, and the mechanical and chemical parameters used in the numerical calculation are listed in Table 2.

Transport and Distribution

The fractured rock mass with an asperity of 0.62 mm, JRC of 6.0, and dimensions of 100 mm length × 500 mm diameter were collected. To analyze the effect of hydraulic pressure on uranium-containing solute transport and distribution, the boundary stress was fixed at 16 MPa, and the hydraulic pressure was set as 0.5, 1.5, 2.5, and 3.5 MPa, respectively. The fracture morphology was formed by the sealed and connected voids and contact areas, and variation of hydraulic pressure and uranium-containing solute occurred in the connected channel, as shown in Figure 7. In more detail, the transport path of uranium-containing solute was heterogenetically distributed, characterized by the regional concentration and dissipation of the uranium-containing solute in a fracture area.
The rapid and following slow decrease in the uranium-containing solute responds to the continuing fluid flow in fracture. As the hydraulic pressure increased, the uranium-containing solute transport was increased, and 2 days, 1.5 days, 1 day, and 0.5 days were required for the uranium-containing solute migration in the hydraulic pressure of 0.5, 1.5, 2.5, and 3.5 MPa, respectively. In addition, the local retention of the uranium-containing solute presented in low-connected voids, combined with a fluid vortex phenomenon. The hydraulic pressure promoted the improvement of the void connectivity in the fracture, and corresponding seepage velocity and solute migration through the connected voids were increased.

4. Sensitivity Analysis

4.1. Confining Stress

The effect of confining stress on the solution migration and distribution was conducted, subjected to the boundary stress of 5–19 MPa and hydraulic pressure of 3.5 MPa. As shown in Figure 8, as the confining stress increases, the fracture aperture decreases in a negative exponential form, and the contact area ratio (the ratio of contact area in fracture to over total areas of fracture) increases in a logarithmic form.
As the confining stress increases, the main seepage channels gradually decrease, whereas small seepage channels propagated along the fracture. The increase of confining stress triggered the decrease of the maximum average aperture from 5–40 μm to 1–35 μm, and dynamic and slight decrease corresponds to the confining stress range of 5–13 MPa and 13–17 MPa. In addition, a void connectivity decrease and contact area increase, responding to the increase of confining stress, were observed.
The different magnitude changes in contact area and fracture aperture occurred. In more detail, the larger contact area is associated with a smaller aperture, and dynamic fracture closure is presented in a larger initial aperture fracture.

4.2. Fracture Aperture

Figure 9a shows that the seepage velocity increases with the increase of fracture aperture. For the same average aperture, the seepage velocity increases slightly corresponding to an average aperture of 0–10 μm, and differences were observed in the seepage velocity for average apertures of 5 to 40 μm.
In Figure 9a, high seepage was observed in fracture4 with an 8 μm aperture. Meanwhile, fracture2 has a larger average aperture for the same seepage velocity. Figure 9b shows that the seepage velocity decreases with an increase in the fracture contact area ratio, unlike the dynamic decrease of the seepage velocity subjected to the increase of the contact area ratio from 0.2 to 0.35. In this case, a slight change in the seepage velocity corresponding to an increase in the contact area ratio from 0.35 to 0.45 was observed. The seepage velocity for the initial contact area ratio was 5–40 times that of the final state for a contact area ratio of 0.43; this observation indicates that the influence of the contact area ratio on the seepage velocity differs depending on the stages.
In addition, for a certain contact area ratio, the seepage velocities of fracture2 and fracture3 were 5–8 times those of fracture1, fracture4, fracture5, and fracture6. On the other hand, the contact area ratios were different for all fractures, and fracture1 had small initial contact area ratio, and fracture4 had a large initial contact area ratio. The contact area ratio and fracture tortuosity also influenced the distribution of the connected voids, leading to differences between the seepage velocities of fracture1 and fracture2, thereby indicating that the average aperture is not the only factor dominating fracture seepage.
Figure 10 shows that the solute concentration changes with an increase in the average aperture, and an increment of 1 × 10⁻⁴ to 5 × 10⁻⁴ was observed for an increment of 2–5 μm in the average aperture; then, the solute concentration decreased by 1 × 10⁻⁴ to 10 × 10−4 in the following increment of 5–10 μm in the average aperture was observed. These observations imply that there exists a threshold in the fracture for the transportation between the lower and higher solute concentrations. The dynamic migration of the uranium-containing solute was presented in the early 12 h, and the migration seepage generally slowed in the later 12 h.
Considering fracture2 as an example, the characteristic of the solute migration is shown in Figure 11. The residual solute concentration varies spatiotemporally with changes in the average aperture and time. The residual solute is anisotropically distributed and the concentration decreased along the fracture. High and low solute concentrations were distributed at the inlet and outlet of the fracture, respectively. Furthermore, solute concentration decreased dynamically in the first 6 h, and slightly decreased during the following 6 h, and the morphology of the solute differed for different average apertures. This observation indicates that the transport of time-dependent uranium-containing solute is highly sensitive to the changes in the average aperture.

4.3. Cross Channel of the Fracture

The experiment of fluid seepage and uranium-containing solute transport in cross channel of the fracture was conducted, based on the double-fracture model. Compared with the single-fracture model, the dual-fracture model adds a fracture perpendicular to the fracture mentioned above. The characteristics of seepage flow and uranium solute transport were studied in the scenarios of k = 0, k = 0.5, and k = 1 (the ratio of vertical stress loading and horizontal stress unloading, the horizontal stress direction is the direction perpendicular to the crack surface).
For the scenario of k = 0, the 18.3 MPa axial stress and 18.3 MPa, 14.3 MPa, 10.3 MPa, 7.3 MPa, and 6.3 MPa confining stresses were successively applied. As shown in Figure 12, the maximum seepage velocity is negatively related to the confining stress in multi-fractured rock masses, and that the maximum seepage velocities are 2.29 × 10⁻², 4.42 × 10⁻², 6.09 × 10⁻², 9.66 × 10⁻², and 1.11 × 10⁻¹ corresponding to 18.3 MPa, 14.3 MPa, 10.3 MPa, 7.3 MPa, and 6.3 MPa confining stress, respectively. As the confining stress increases, the number and width of the flow paths for solute migration anisotropically decreased, and corresponding fracture permeability was decreased. The block and ribbon-shaped uranium-containing solute areas gradually decreased in inclined and vertical fractures. The local retention of the uranium-containing solute induced by the vortex and inertial flow caused by high-speed percolation and heterogeneous fracture morphology occurred in a short period; furthermore, slow solute release was observed under weak convection in a low permeability region.
As the confining stress decreases, the width of the double-fracture increases, while the solute concentration in the fracture decreases rapidly under the convection of higher-velocity fluids, and nonuniformly distributed block and ribbon-shaped solute concentration areas appeared in the fracture area. As the aperture increases, the influence of the asperity and roughness on the fluid flow state gradually decreases, and the vortex and inertial flow phenomena gradually evolved into laminar flow. Compared with the solute morphology under high confining stress, the time factor dominated the solute distribution under lower confining stress. With the increase of time, the number and area of solute-intensive areas decreased rapidly.
In the fracture intersections region, low-concentration solutes present a concentrated distribution, and the distribution area gradually increases as the confining stress decreases. Compared with the rough fracture surfaces, low-concentration cross fracture areas are more sensitive in smooth fractures.

4.4. Loading Path

Figure 13a–c show that the apertures of inclined fractures and vertical fractures exhibit different responses to the increase in confining stress at the same k. When k = 0, the confining pressure increases from 6.3 MPa to 18.3 MPa, the apertures of vertical fractures decrease from 31.4 to 24.2 μm, and the apertures of inclined fractures remain unchanged. Similar phenomena are also observed at k = 0.5 and k = 1, the confining pressure increases from 9.3 MPa to 18.3 MPa, the apertures of the vertical fractures decreased by 5.1 μm and 5.2 μm, and the apertures of inclined fractures decreased by 0.51 μm and 0.54 μm, respectively. As the confining stress increases, apertures of inclined fractures experienced an initial increase and then a dynamic decrease, while apertures of vertical fractures maintained a uniform decrease. This observation indicates that the k value affects different morphological fractures differently. As k increases, the apertures of inclined fractures decrease, while those of vertical fractures remain more or less unchanged. When the confining stress is 10.3 MPa and k increases from 0.5 to 1, the apertures of inclined fractures decrease by 7.3 μm, while those of vertical fractures only decrease by 0.7 μm. In addition, when k = 0, the apertures fluctuation amplitude of inclined fractures is 2 μm, while the apertures fluctuation amplitude of inclined fractures is 9.1 μm and 4.3 μm for k = 0.5 and k = 1, respectively. While apertures fluctuation amplitude vertical fractures remain more or less unchanged with the increases of k. This observation indicates that the inclined fractures are more sensitive than vertical fractures to changes of k. Thus, changes in axial stress have a more significant effect on inclined fractures than on vertical fractures.
Figure 13d–f show that the seepage velocity of the double-fracture increases with the decrease in confining stress for a certain k. A fluctuation of the solute concentration induced by the increase of confining stress in solute concentration was observed at 3 h. This indicates that local retention and accelerated regional migration occur as solute is transported through nonuniform interconnected voids, resulting in the fluctuation of the solute concentration subjected to changes of confining stress. As k increases, the seepage velocity generally decreases, and the confining stress corresponding to the peak value of the seepage velocity increases from 8 MPa for k = 0 to 12.5 MPa for k = 1. In addition, as k increases, the fluctuation of the solute concentration responding to the change of confining stress gradually decreases.

5. Conclusions

Combined with the developed mathematical model and FLAC3D-CFD simulator, the migration of uranium-containing solute in fractured rock masses was studied, and the influence of the sensitive factor on the evolution of fracture and uranium-containing solution was analyzed, and the main achievements are as follows:
(1)
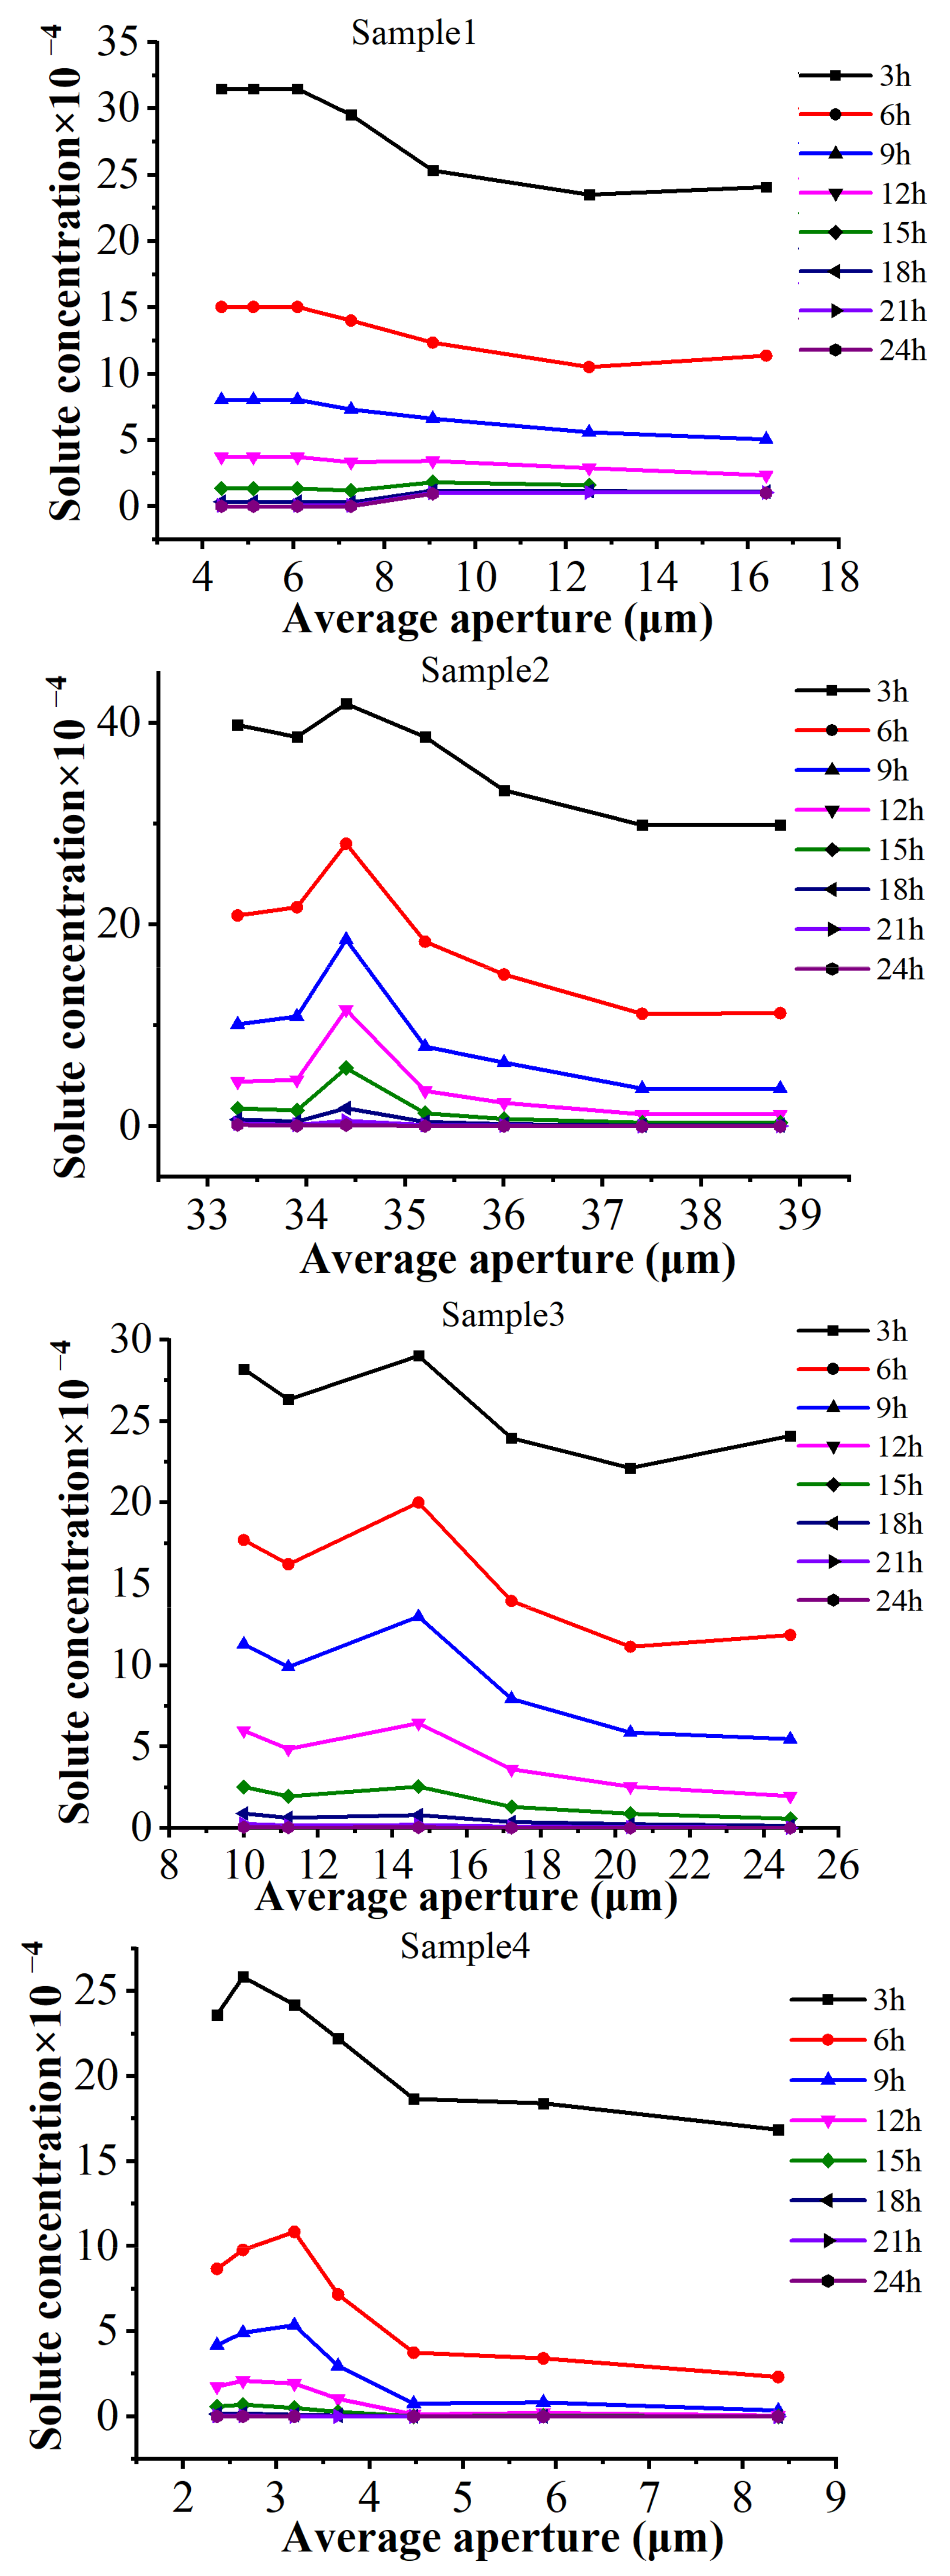
A mathematical model describing the stress-dependent fracture structure and uranium-containing solute transport was established. The evolution of a connected channel in fracture aperture is influenced by the increase of confining stress, and a dynamic and slight decrease zone was confirmed for confining stress of 5–13 MPa and 13–17 MPa. The concentration of uranium-containing solution is directly influenced by the fracture aperture and hydraulic pressure, and a 2–5 μm fracture aperture was identified as a width threshold from a lower to higher uranium-containing solute concentration.
(2)
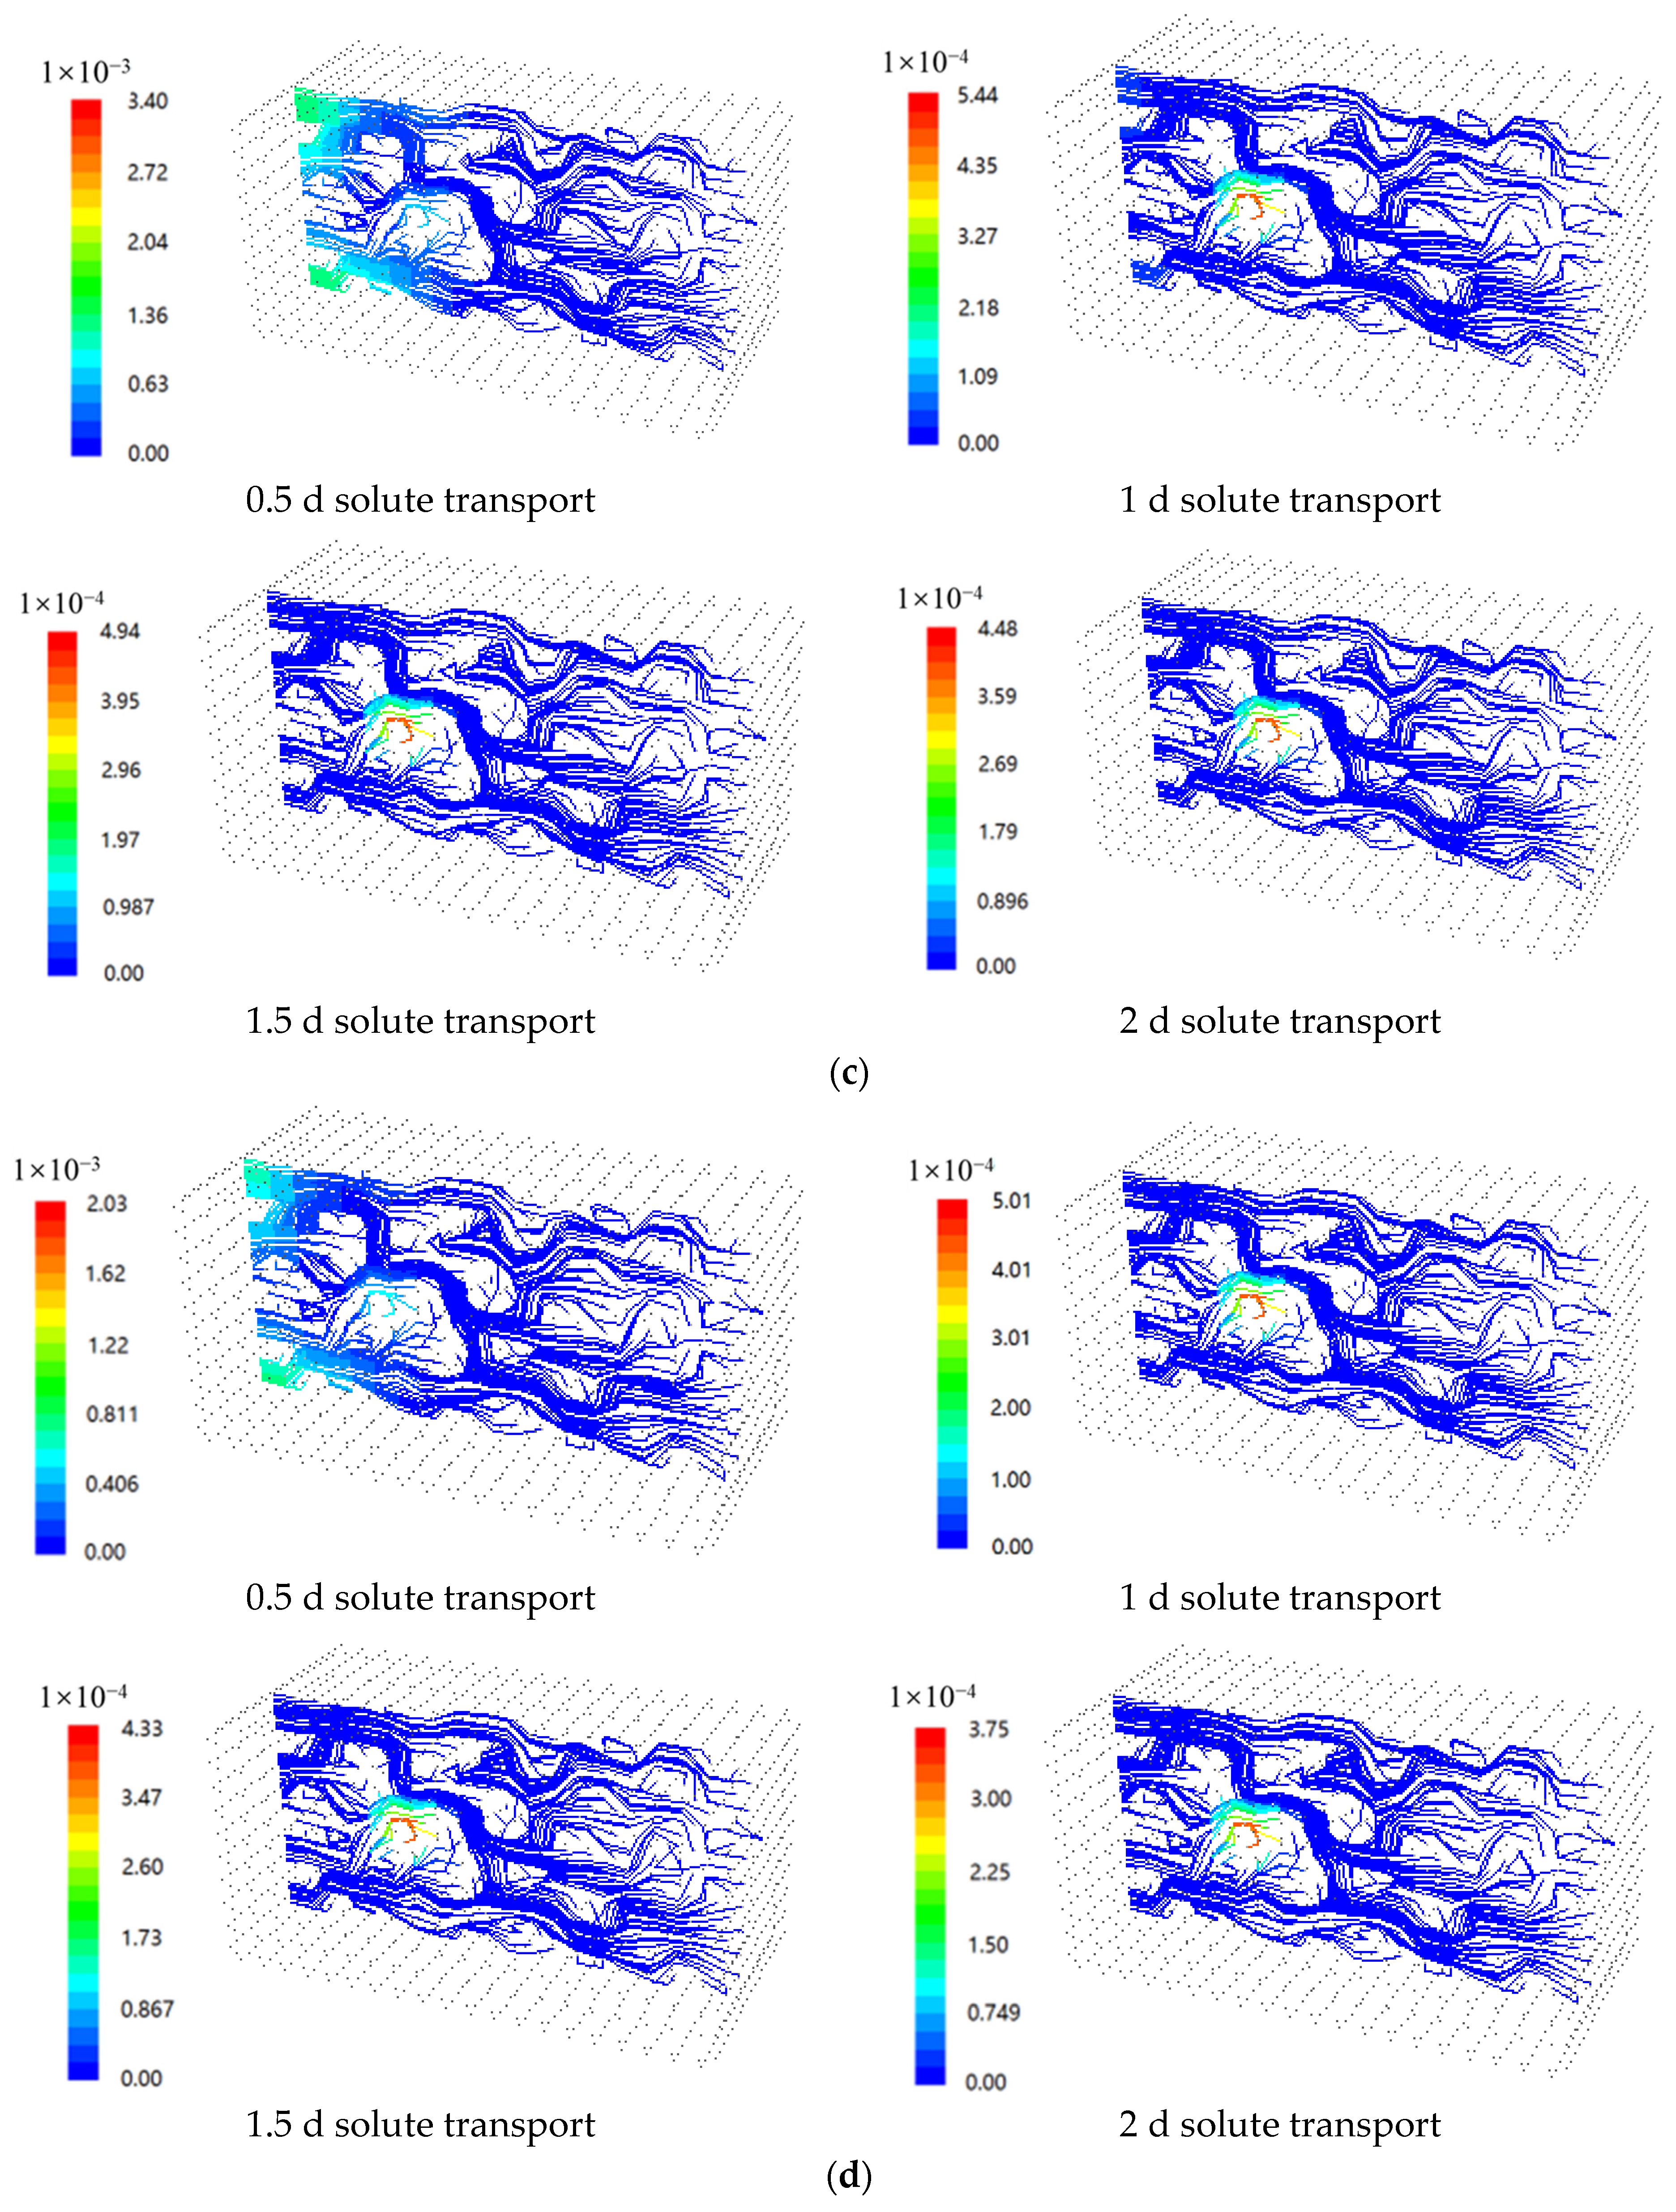
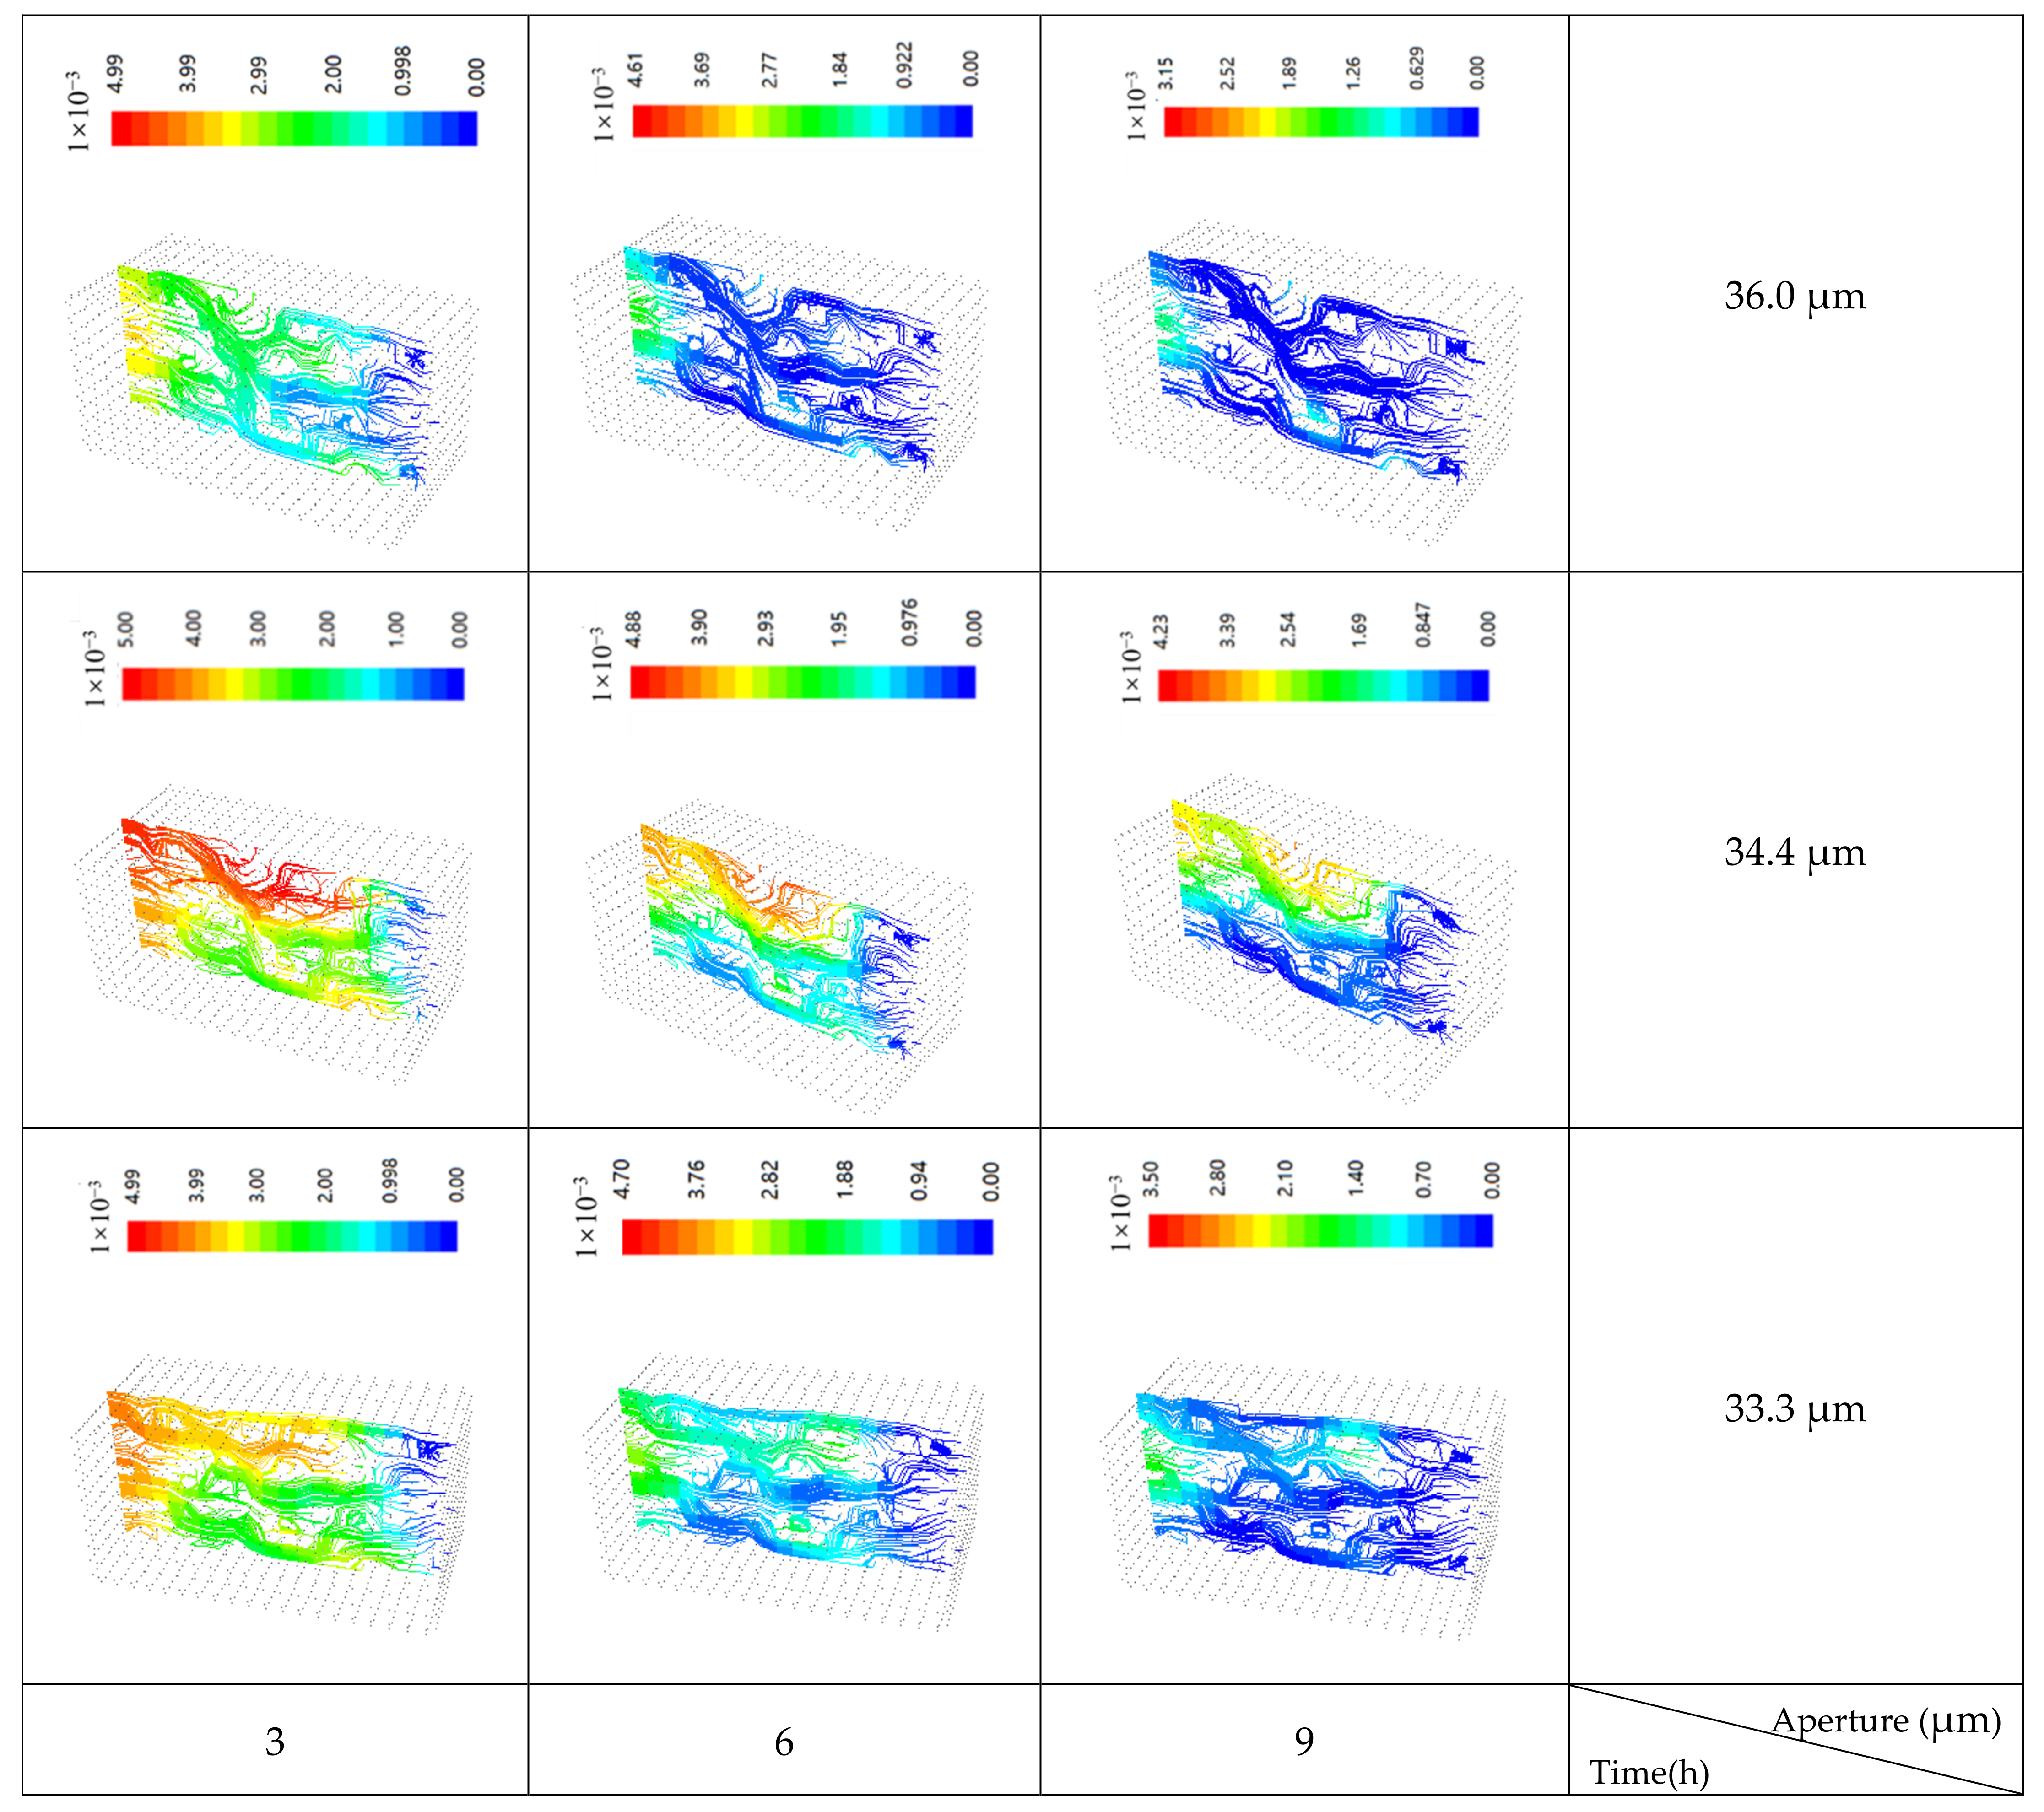
The number and size of a connected channel decreased with the increase of confining stress in double-fractures. The turbulent flow was presented in a high fluid velocity and confining stress condition, and retention of uranium-containing solution characterized by block and ribbon-shaped solute concentration areas was observed in both inclined and vertical fractures, and dynamic decrease of uranium-containing solution was presented at the fracture intersections region. The dynamic decrease presented in the initial 12 h, and a slight decrease presented in the following period.
(3)
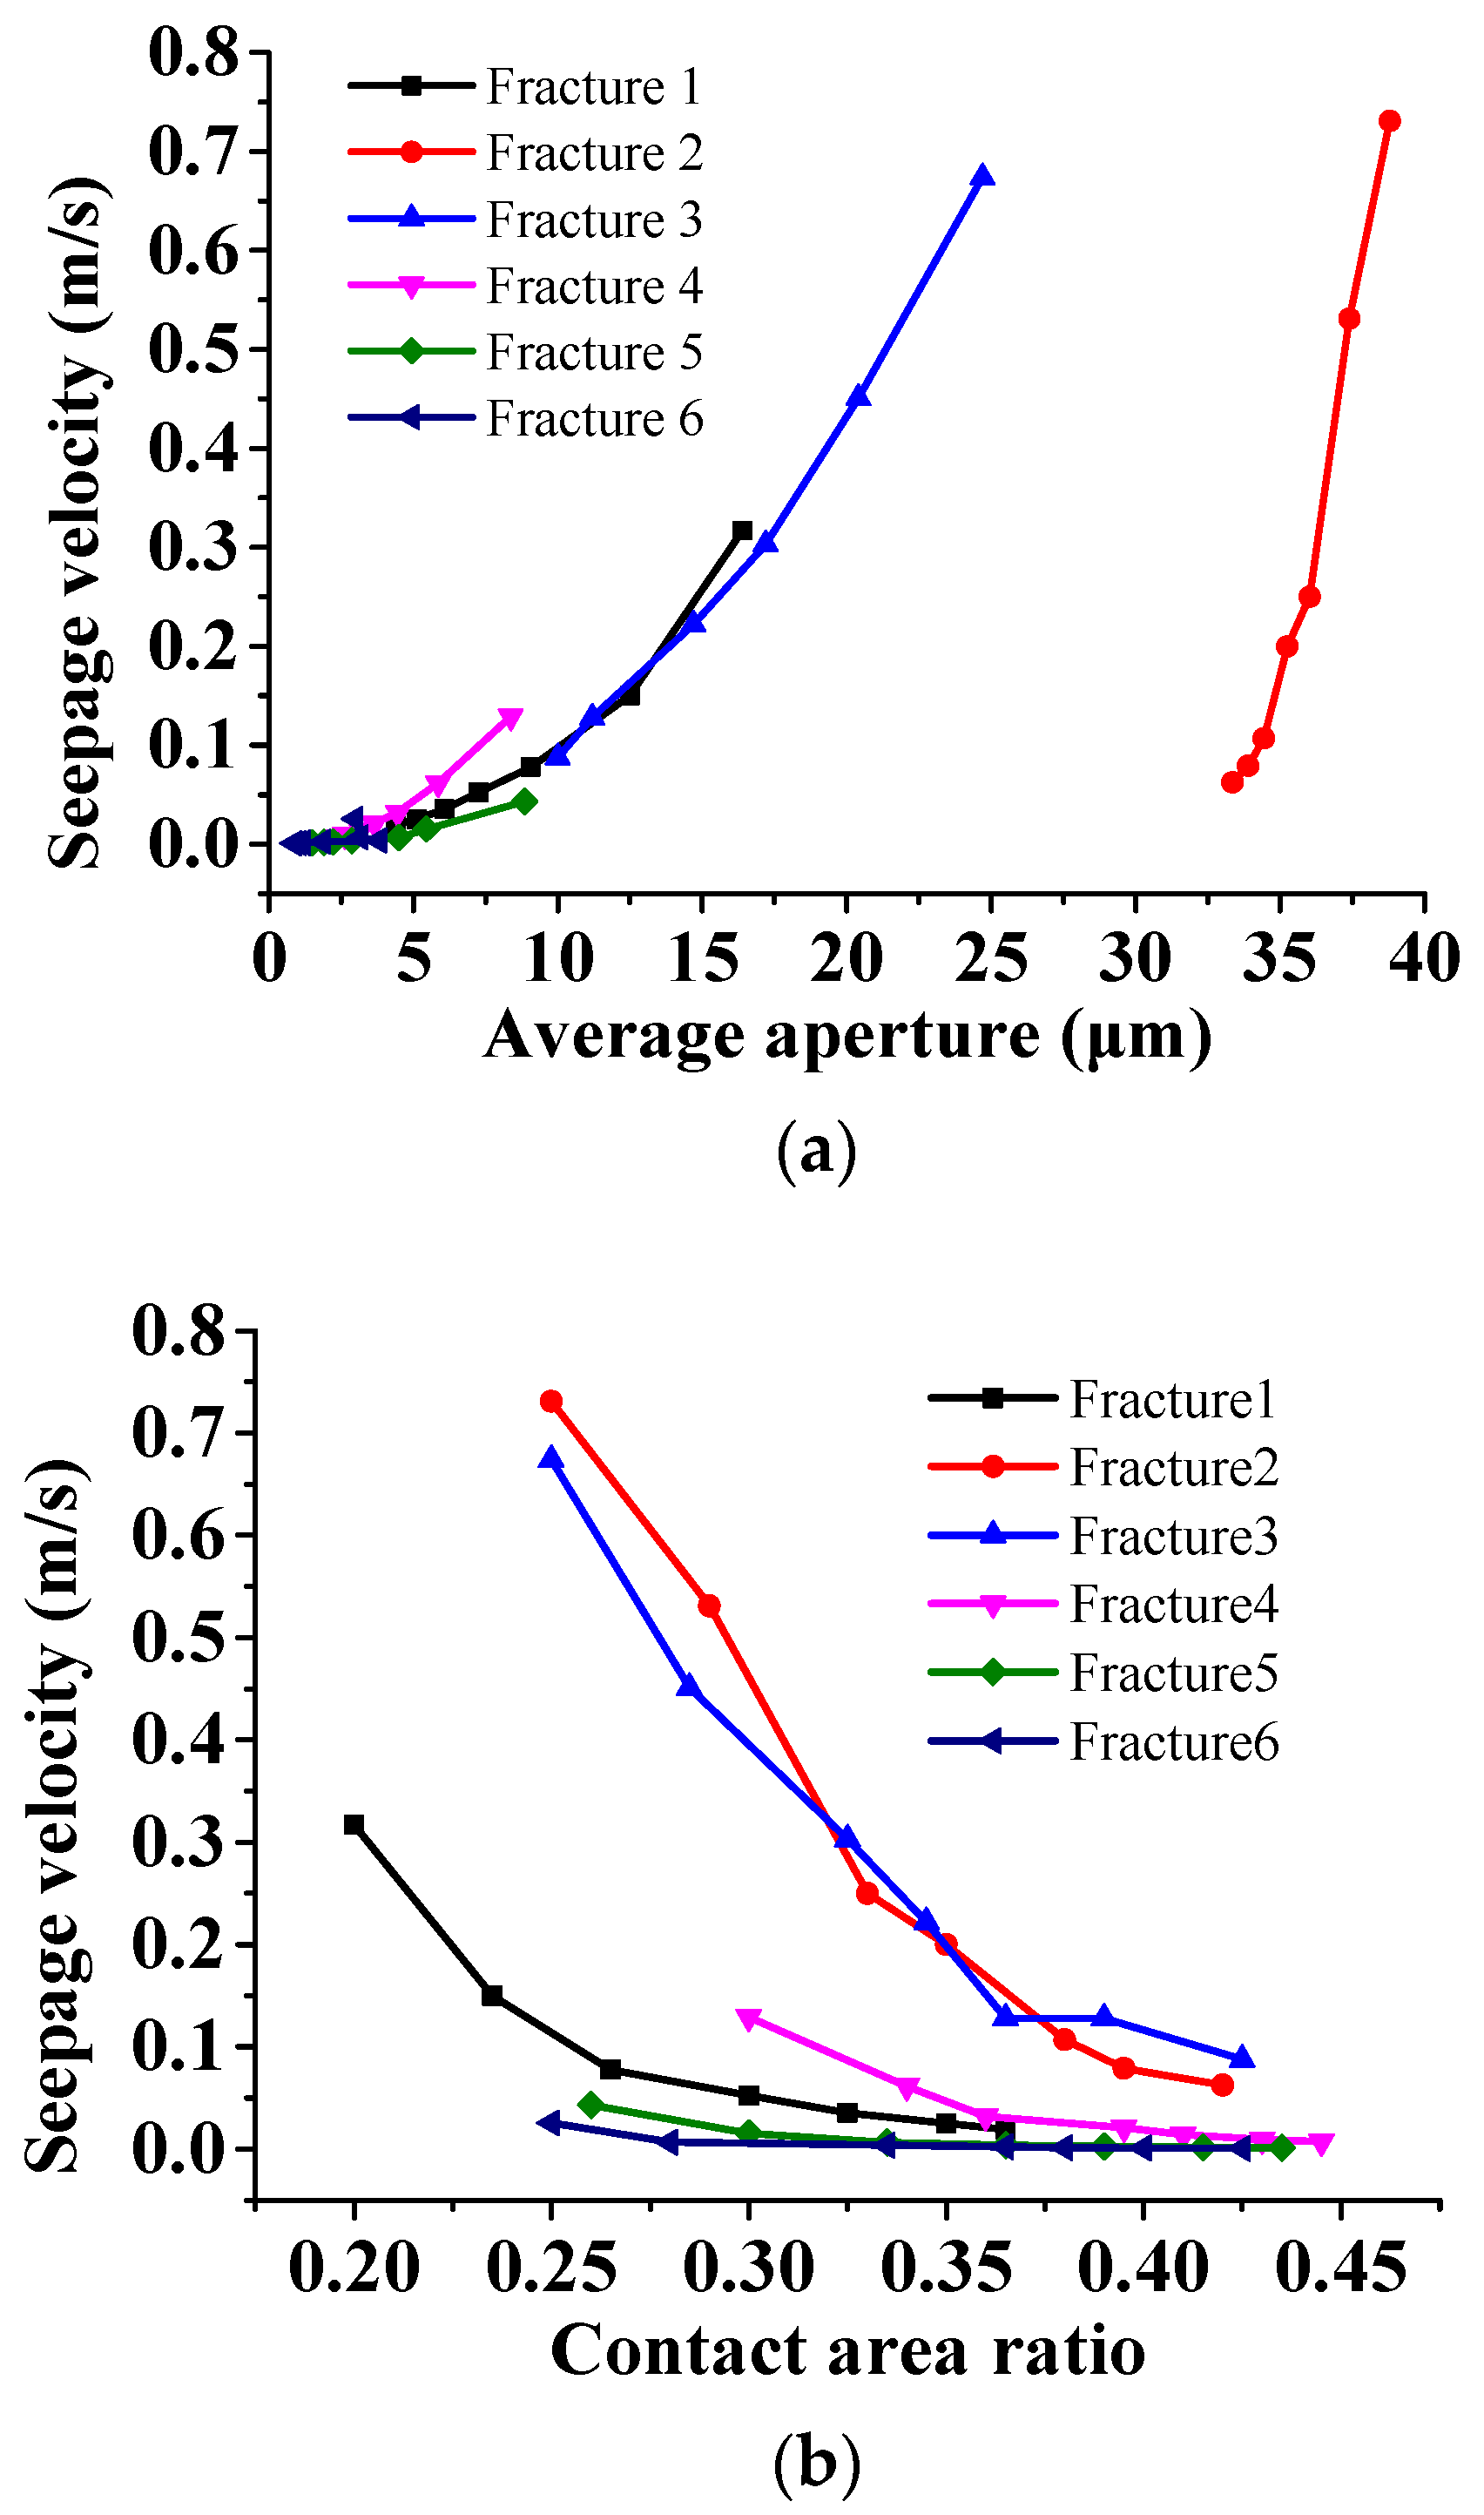
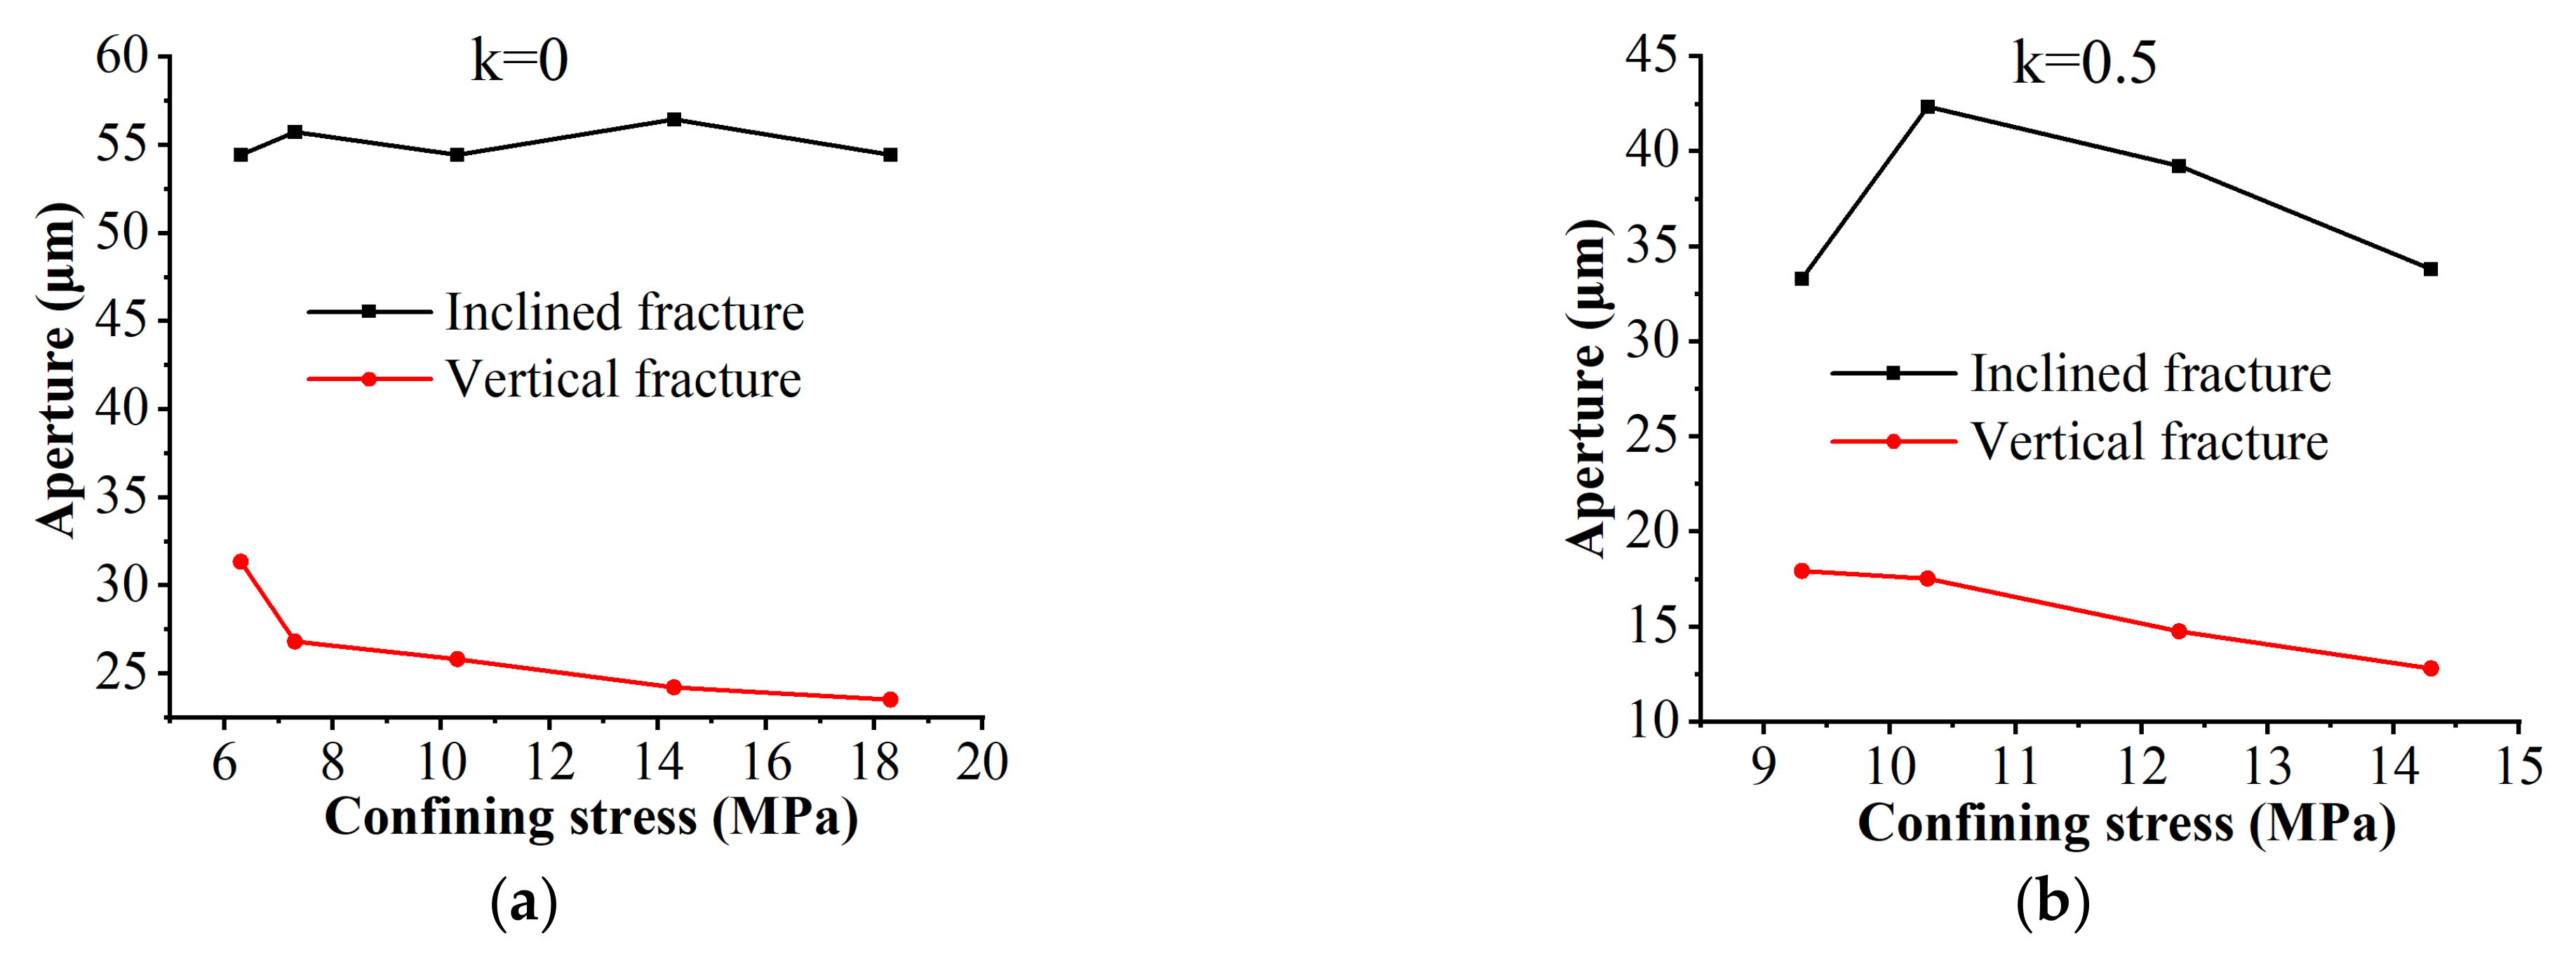
The loading and unloading direction and rate significantly influence the fracture geometry and uranium-containing solute transportation. As the ration of vertical stress loading and horizontal stress loading k increases, the decrease in fracture aperture, seepage velocity, and uranium-containing solute concentration was observed. In addition, high seepage velocity and strong solute transport capacity for k = 1, and the laminar flow for k = 0 were observed.

Author Contributions

Conceptualization, Writing—review and editing, Project administration, Funding acquisition, T.Z.; Writing—original draft, X.N.; Methodology, Investigation, Formal analysis, T.Z., X.N. and S.S.; Data curation, X.H.; Supervision, T.Z. and X.H.; Software, Validation, T.Z., X.N. and X.Y. All authors have read and agreed to the published version of the manuscript.

Funding

This work was supported by the National Youth Science Foundation (Grant No. 51904011), the Institute of Energy, Hefei Comprehensive National Science Center (Grant No. 21KZS216), the Anhui Provincial Natural Science Foundation (Grant No. 1908085QE183), the University Synergy Innovation Program of Anhui Province (Grant No. GXXT-2021-019), and the Open Fund of State Key Laboratory of Water Resource Protection and Utilization in Coal Mining (Grant No. GJNY-18-73.7), the Open Fund of State Key Laboratory of Mining Response and Disaster Prevention and Control in Deep Coal Mines (Grant No.SKLMRDPC19ZZ05).

Institutional Review Board Statement

Not applicable.

Informed Consent Statement

Not applicable.

Data Availability Statement

Not applicable.

Conflicts of Interest

The authors declare no conflict of interest.

References

  1. Chen, Y.; Zhou, J.; Hu, S.; Hu, R.; Zhou, C.-B. Evaluation of Forchheimer equation coefficients for non-Darcy flow in deformable rough-walled fractures. J. Hydrol. 2015, 529, 993–1006. [Google Scholar] [CrossRef]
  2. Dangelmayr, M.A.; Reimus, P.W.; Wasserman, N.L.; Punsal, J.J.; Johnson, R.H.; Clay, J.T.; Stone, J.J. Laboratory column experiments and transport modeling to evaluate retardation of uranium in an aquifer downgradient of a uranium in-situ recovery site. Appl. Geochem. 2017, 80, 1–13. [Google Scholar] [CrossRef]
  3. Zhang, T.; Gan, Q.; Zhao, Y.; Zhu, G.; Nie, X.; Yang, K.; Li, J. Investigations into Mining-Induced Stress–Fracture–Seepage Field Coupling Effect Considering the Response of Key Stratum and Composite Aquifer. Rock Mech. Rock Eng. 2019, 52, 4017–4031. [Google Scholar] [CrossRef]
  4. Sims, R.; Lawless, T.A.; Alexander, J.L.; Bennett, D.G.; Read, D. Uranium migration through intact sandstone: Effect of pollutant concentration and the reversibility of uptake. J. Contam. Hydrol. 1996, 21, 215–228. [Google Scholar] [CrossRef]
  5. Dittrich, T.M.; Reimus, P.W. Uranium transport in a crushed granodiorite: Experiments and reactive transport modeling. J. Contam. Hydrol. 2015, 175–176, 44–59. [Google Scholar] [CrossRef] [Green Version]
  6. Dittrich, T.M.; Reimus, P.W. Reactive transport of uranium in fractured crystalline rock: Upscaling in time and distance. J. Environ. Manag. 2016, 165, 124. [Google Scholar] [CrossRef] [Green Version]
  7. Panfilov, M.; Uralbekov, B.; Burkitbayev, M. Reactive transport in the underground leaching of uranium: Asymptotic analytical solution for multi-reaction model. Hydrometallurgy 2016, 160, 60–72. [Google Scholar] [CrossRef]
  8. Read, D.; Ross, D.; Sims, R.J. The migration of uranium through Clashach Sandstone: The role of low molecular weight organics in enhancing radionuclide transport. J. Contam. Hydrol. 1998, 35, 235–248. [Google Scholar] [CrossRef]
  9. Zhang, P.; Yang, T.; Yu, Q.; Xu, T.; Zhu, W.; Liu, H.; Zhou, J.; Zhao, Y. Microseismicity Induced by Fault Activation during the Fracture Process of a Crown Pillar. Rock Mech. Rock Eng. 2015, 48, 1673–1682. [Google Scholar] [CrossRef]
  10. Cui, G.; Wei, J.; Feng, X.T.; Liu, J.; Elsworth, D.; Chen, T.; Xiong, W. Preliminary study on the feasibility of co-exploitation of coal and uranium-ScienceDirect. Int. J. Rock Mech. Min. Sci. 2019, 123, 104098. [Google Scholar] [CrossRef]
  11. Du, L.; Li, S.; Li, X.; Wang, P.; Huang, Z.; Tan, Z.; Liu, C.; Liao, J.; Liu, N. Effect of humic acid on uranium(VI) retention and transport through quartz columns with varying pH and anion type. J. Environ. Radioact. 2017, 177, 142–150. [Google Scholar] [CrossRef]
  12. Wang, G.; Wu, M.; Wang, R.; Xu, H.; Song, X. Height of the mining-induced fractured zone above a coal face. Eng. Geol. 2017, 216, 140–152. [Google Scholar] [CrossRef]
  13. Ahn, H.; Oh, Y.; Ryu, J.H.; Jo, H.Y. Uranium sequestration in fracture filling materials from fractured granite aquifers. J. Environ. Radioact. 2020, 225, 106440. [Google Scholar] [CrossRef]
  14. Tan, K.; Li, C.; Liu, J.; Qu, H.; Xia, L.; Hu, Y.; Li, Y. A novel method using a complex surfactant for in-situ leaching of low permeable sandstone uranium deposits. Hydrometallurgy 2014, 150, 99–106. [Google Scholar] [CrossRef]
  15. Zeng, F.; Zhao, G. The optimal hydraulic fracture geometry under non-Darcy flow effects. J. Pet. Sci. Eng. 2010, 72, 143–157. [Google Scholar] [CrossRef]
  16. Chen, Y.; Zhou, C.; Sheng, Y. Formulation of strain-dependent hydraulic conductivity for a fractured rock mass. Int. J. Rock Mech. Min. Sci. 2007, 44, 981–996. [Google Scholar] [CrossRef]
  17. Espinoza, D.N.; Shovkun, I.; Makni, O.; Lenoir, N. Natural and induced fractures in coal cores imaged through X-ray computed microtomograph—Impact on desorption time. Int. J. Coal Geol. 2016, 154, 165–175. [Google Scholar] [CrossRef]
  18. Lai, P.; Samson, C.; Bose, P. Visual enhancement of 3D images of rock faces for fracture mapping. Int. J. Rock Mech. Min. Sci. 2014, 72, 325–335. [Google Scholar] [CrossRef]
  19. He, R.; Yang, Z.; Li, X.; Li, Z.; Liu, Z.; Chen, F. A comprehensive approach for fracability evaluation in naturally fractured sandstone reservoirs based on analytical hierarchy process method. Energy Sci. Eng. 2019, 7, 529–545. [Google Scholar] [CrossRef]
  20. Zhou, Y.; Li, G.; Xu, L.; Liu, J.; Sun, Z.; Shi, W. Uranium recovery from sandstone-type uranium deposit by acid in-situ leaching—An example from the Kujieertai. Hydrometallurgy 2019, 191, 105209. [Google Scholar] [CrossRef]
  21. Devaraj, N.; Panda, B.; Chidambaram, S.; Prasanna, M.V.; Singh, D.K.; Ramanathan, A.L.; Sahoo, S.K. Spatio-temporal variations of Uranium in groundwater: Implication to the environment and human health. Sci. Total Environ. 2021, 775, 145787. [Google Scholar]
  22. Liu, H.; Wei, M.; Rutqvist, J. Normal-stress dependence of fracture hydraulic properties including two-phase flow properties. Hydrogeol. J. 2013, 21, 371–382. [Google Scholar] [CrossRef]
  23. Li, Y.; Chen, Y.; Zhou, C. Hydraulic properties of partially saturated rock fractures subjected to mechanical loading. Eng. Geol. 2014, 179, 24–31. [Google Scholar] [CrossRef]
  24. Song, Z.; Wang, Y.; Konietzky, H.; Cai, X. Mechanical behavior of marble exposed to freeze-thaw-fatigue loading. Int. J. Rock Mech. Min. Sci. 2021, 138, 104648. [Google Scholar] [CrossRef]
  25. Wang, S.; Li, X.; Yao, J.; Gong, F.; Li, X.; Du, K.; Tao, M.; Huang, L.; Du, S. Experimental investigation of rock breakage by a conical pick and its application to non-explosive mechanized mining in deep hard rock. Int. J. Rock Mech. Min. Sci. 2019, 122, 104063. [Google Scholar] [CrossRef]
  26. Wang, S.; Sun, L.; Li, X.; Wang, S.; Du, K.; Li, X.; Feng, F. Experimental investigation of cuttability improvement for hard rock fragmentation using conical cutter. Int. J. Geomech. 2021, 21, 06020039. [Google Scholar] [CrossRef]
  27. Kim, J.W.; Baik, M.H.; Jung, H.; Jeong, J.T. Reactive transport of uranium with bacteria in fractured rock: Model development and sensitivity analysis. J. Contam. Hydrol. 2013, 152, 82–96. [Google Scholar] [CrossRef]
  28. De Boissezon, H.; Levy, L.; Jakymiw, C.; Distinguin, M.; Guerin, F.; Descostes, M. Modeling uranium and 226Ra mobility during and after an acidic in situ recovery test (Dulaan Uul, Mongolia). J. Contam. Hydrol. 2020, 235, 103711. [Google Scholar] [CrossRef]
  29. Feng, S.; Wang, H.; Cui, Y.; Ye, Y.; Liu, Y.; Li, X.; Wang, H.; Yang, R. Fractal discrete fracture network model for the analysis of radon migration in fractured media. Comput. Geotech. 2020, 128, 103810. [Google Scholar] [CrossRef]
  30. Wang, H.; Zhang, L.; Lei, H.; Wang, Y.; Liu, H.; Li, X.; Su, X. Potential for uranium release under geologic CO2 storage conditions: The impact of Fe (III). Int. J. Greenh. Gas Control 2021, 107, 103266. [Google Scholar] [CrossRef]
  31. Wang, Q.; Miao, X.; Wang, Y.; Gan, M.; Aftab, S.M.; Li, X.; Zhang, L.; Wang, Z. Simulation of uranium mobilization potential in a deep aquifer under geological carbon storage conditions. Appl. Geochem. 2020, 118, 104620. [Google Scholar] [CrossRef]
  32. Baghbanan, A.; Jing, L. Stress effects on permeability in a fractured rock mass with correlated fracture length and aperture. Int. J. Rock Mech. Min. Sci. 2008, 45, 1320–1334. [Google Scholar] [CrossRef]
  33. Rong, G.; Hou, D.; Yang, J.; Cheng, L.; Zhou, C. Experimental study of flow characteristics in non-mated rock fractures considering 3D definition of fracture surfaces. Eng. Geol. 2017, 220, 152–163. [Google Scholar] [CrossRef]
  34. Zhang, Z.; Nemcik, J. Fluid flow regimes and nonlinear flow characteristics in deformable rock fractures. J. Hydrol. 2013, 477, 139–151. [Google Scholar] [CrossRef]
  35. Yan, C.; Zheng, H. A two-dimensional coupled hydro-mechanical finite-discrete model considering porous media flow for simulating hydraulic fracturing. Int. J. Rock Mech. Min. Sci. 2016, 88, 115–128. [Google Scholar] [CrossRef]
  36. Koyama, T.; Fardin, N.; Jing, L.; Stephansson, O. Numerical simulation of shear-induced flow anisotropy and scale-dependent aperture and transmissivity evolution of rock fracture replicas. Int. J. Rock Mech. Min. Sci. 2006, 43, 89–106. [Google Scholar] [CrossRef]
  37. Zhao, Z.; Jing, L.; Neretnieks, I.; Moreno, L. Numerical modeling of stress effects on solute transport in fractured rocks. Comput. Geotech. 2011, 38, 113–126. [Google Scholar] [CrossRef]
  38. Song, Z.; Konietzky, H.; Herbst, M. Bonded-particle model-based simulation of artificial rock subjected to cyclic loading. Acta Geotech. 2019, 14, 955–971. [Google Scholar] [CrossRef]
  39. Rutqvist, J.; Leung, C.; Hoch, A.; Wang, Y.; Wang, Z. Linked multicontinuum and crack tensor approach for modeling of coupled geomechanics, fluid flow and transport in fractured rock. Rock Mech. Geotech. Eng. 2013, 5, 18–31. [Google Scholar] [CrossRef] [Green Version]
  40. Lei, Q.; Latham, J.-P.; Xiang, J.; Tsang, C.-F. Polyaxial stress-induced variable aperture model for persistent 3D fracture networks. Geomech. Energy Environ. 2015, 1, 34–47. [Google Scholar] [CrossRef] [Green Version]
  41. Zhao, Z.; Jing, L.; Neretnieks, I.; Moreno, L. Analytical solution of coupled stress-flow-transport processes in a single rock fracture. Comput. Geosci. 2011, 37, 1437–1449. [Google Scholar] [CrossRef]
  42. Crandall, D.; Bromhal, G.; Karpyn, Z.T. Numerical simulations examining the relationship between wall-roughness and fluid flow in rock fractures. Int. J. Rock Mech. Min. Sci. 2010, 47, 784–796. [Google Scholar] [CrossRef]
  43. Akhavan, A.; Shafaatian, S.; Rajabipour, F. Quantifying the effects of crack width, tortuosity, and roughness on water permeability of cracked mortars. Cem. Concr. Res. 2012, 42, 313–320. [Google Scholar] [CrossRef]
  44. Chen, Y.; Liang, W.; Lian, H.; Yang, J.; Nguyen, V.P. Experimental study on the effect of fracture geometric characteristics on the permeability in deformable rough-walled fractures. Int. J. Rock Mech. Min. Sci. 2017, 98, 121–140. [Google Scholar] [CrossRef]
  45. Bandis, S.; Lumsden, A.; Barton, N. Fundamentals of rock joints deformation. Int. J. Rock Mech. Min. Sci. Geomech. Abstr. 1983, 20, 249–268. [Google Scholar] [CrossRef]
  46. Gan, Q.; Elsworth, D. A continuum model for coupled stress and fluid flow in discrete fracture networks. Geomech. Geophys. Geo-Energy Geo-Resour. 2016, 2, 43–61. [Google Scholar] [CrossRef] [Green Version]
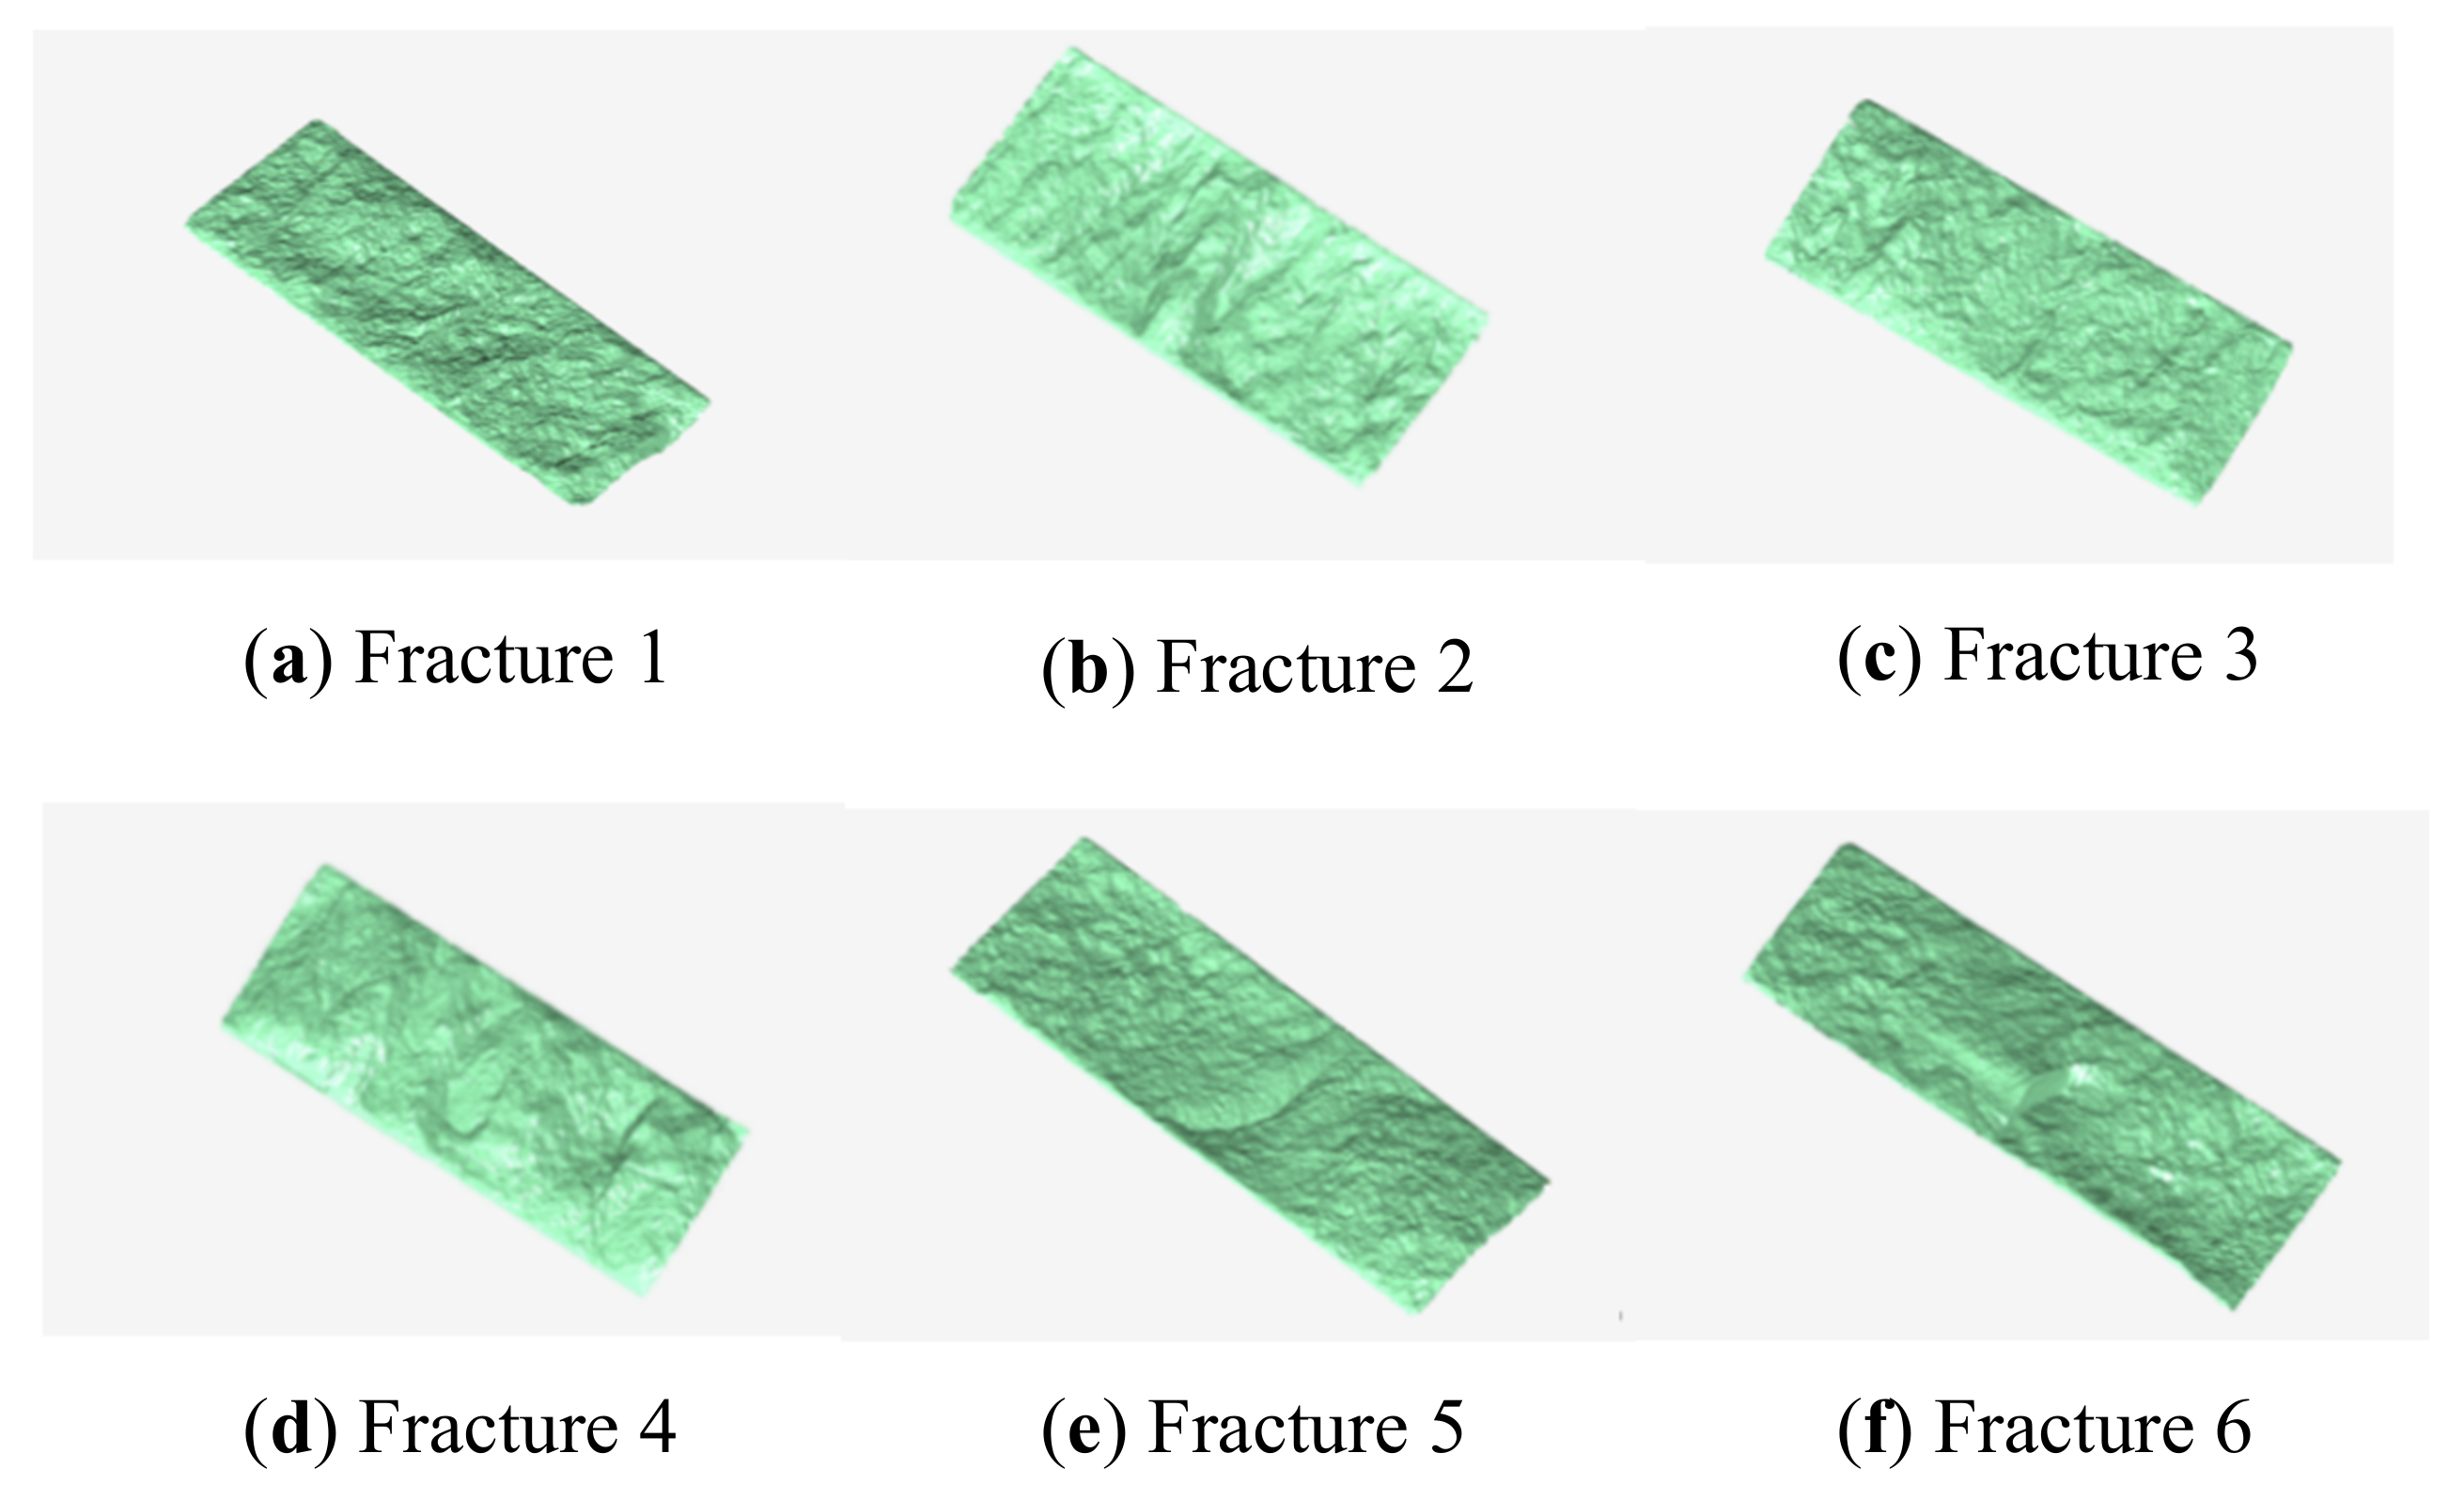
Figure 1. Schematic diagram of the fracture aperture model.
Mathematics 10 00702 g001
Figure 2. Schematic diagram of the UTSP covering method.
Mathematics 10 00702 g002
Figure 3. The simulation schematic.
Mathematics 10 00702 g003
Figure 4. Comparison of the fracture model calculating and the experimental results: (a) sample 1, (b) sample 2, (c) sample 3, (d) sample 4.
Mathematics 10 00702 g004
Figure 5. Surface scanning image of the sandy mudstone fracture.
Mathematics 10 00702 g005
Figure 6. Transformation process of the fractured rock mass.
Mathematics 10 00702 g006
Figure 7. Fracture solute transport condition under different hydraulic pressures: (a) hydraulic pressure of 0.5 MPa, (b) hydraulic pressure of 1.5 MPa, (c) hydraulic pressure of 2.5 MPa, (d) hydraulic pressure of 3.5 MPa.
Mathematics 10 00702 g007aMathematics 10 00702 g007b
Figure 8. Correlation between confining stress, average aperture, and contact area ratio.
Mathematics 10 00702 g008
Figure 9. Correlation of seepage velocity with average aperture and contact area ratio. (a) correlation between average aperture and seepage velocity, (b) correlation between contact area ratio and seepage velocity.
Mathematics 10 00702 g009
Figure 10. Relation between the solute concentration and time.
Mathematics 10 00702 g010
Figure 11. Characteristics of solute transport under different stresses.
Mathematics 10 00702 g011
Figure 12. Seepage solute transfer characteristics under different horizontal vertical stress at k = 0 (a) confining stress 18.3 MPa, axial stress 18.3 MPa, (b) confining stress 14.3 MPa, axial stress 18.3 MPa, (c) confining stress 10.3 MPa, axial stress 18.3 MPa, (d) confining stress 7.3 MPa, axial stress 18.3 MPa, (e) confining stress 6.3 MPa, axial stress 18.3 MPa.
Mathematics 10 00702 g012
Figure 13. Relationship of the confining stress, aperture, seepage velocity, and concentration in different loading conditions. (a) confining stress for a k = 0, (b) confining stress for a k = 0.5, (c) confining stress for a k = 1, (d) the seepage velocity for a k = 0, (e) the seepage velocity for a k = 0.5, (f) the seepage velocity for a k = 1.
Mathematics 10 00702 g013aMathematics 10 00702 g013b
Table 1. The geometry parameters of the experiment fracture.
No.Fracture Length L (mm)Fracture Width w (mm)Contact Ratio (5 MPa)Fracture Aperture (μm) (5 MPa)
1100490.201.64 × 10−5
2100490.253.88 × 10−5
3100490.252.47 × 10−5
4100490.308.38 × 10−6
5100490.268.86 × 10−6
6100490.253.00 × 10−6
Contact ratio: the area ratio of contact zone to rough-walled fracture.
Table 2. The hydraulic and mechanic parameters of the fractured rock mass.
Stress FieldDensity
d
(kg/m3)
Bulk
Modulus
B
(GPa)
Shear Modulus
S
(GPa)
Cohesion
C
(MPa)
Tensile Strength
t
(MPa)
Internal Friction Angle
ψ
(°)
Initial Permeability
K
(m2)
266033.9422.44.022.5235
Chemical fieldUO2(CO3)34−reaction rate (kg/m3s)Dispersion coefficient (m2/s)
5.0 × 10−410.50
Fracture fieldInitial mean fracture width
(μm)
Initial permeability
(m2)
Initial non-darcy flow factor
β (m−1)
307.0 × 10−121.0 × 10⁸
Publisher’s Note: MDPI stays neutral with regard to jurisdictional claims in published maps and institutional affiliations.

