Article

Multiobjective Optimization for Planning the Service Areas of Smart Parcel Locker Facilities in Logistics Last Mile Delivery

1
Department of Industrial Engineering and Management, National Taipei University of Technology, Taipei 106, Taiwan
2
Department of Business Administration, National Taipei University of Business, Taipei 100, Taiwan
3
Manufacturing Department, Taiwan Semiconductor Manufacturing Company, Taichung 407, Taiwan
*
Author to whom correspondence should be addressed.
Mathematics 2022, 10(3), 422; https://doi.org/10.3390/math10030422
Submission received: 25 October 2021 / Revised: 22 January 2022 / Accepted: 27 January 2022 / Published: 28 January 2022

Abstract

:
The planning of the location service areas of smart parcel locker facilities became a critical aspect of logistics last mile delivery. In e-commerce, the efficiency of delivering merchandise from retailer warehouses to customers determines the competitiveness of retailers and delivery operators. The considerable increases in e-commerce transactions and safety concerns under the COVID-19 (Coronavirus disease 2019) pandemic made home delivery services even more inefficient than before, which resulted in the considerable increase in social costs. In numerous countries, smart parcel lockers were adopted to increase delivery efficiency, decrease the risk of COVID-19 infection, and reduce the burden on society. This study proposed a multiobjective optimization mathematical model for investigating the planning of the location service areas of smart parcel locker facilities, and then the optimization mathematical model was solved using a combination of the Taguchi method (TA) and nondominant sorting genetic algorithm II (NSGA-II). Finally, this composite approach was applied to a case study in producing favorable solutions for facility location service area planning.

1. Introduction

The goods and services market was spreading rapidly in the form of e-commerce over the past decade. An extremely wide range of commodities, from mid-to-low-end consumer goods to high-end durable goods and Veblen goods, were transacted through e-commerce. Global e-commerce transactions were valued at US $4.28 trillion in 2020 and are expected to be valued at US $5.4 trillion in 2022 [1]. The unexpected COVID-19 (Coronavirus disease 2019) pandemic in 2020 forced many countries to implement movement control measures, which inadvertently changed consumer behavior from shopping in physical stores to shopping in online stores. Consequently, the e-commerce market experienced an explosive and continuous growth, which considerably increased the quantity of merchandise delivered and the interaction between consumers and couriers. Given that the consumer–courier interaction can directly affect the efficiency and completion of merchandise delivery as well as consumer satisfaction, merchandise delivery, which is the last part of logistics and supply chain management, requires increased research attention.
The business volume of parcel delivery services is increasing worldwide, which aggravated problems such as traffic congestion, noise, and pollution. Topics related to delivery planning in each stage of logistics and supply chain management (e.g., loading, distribution, route planning, delivery volume planning, and transportation planning) attracted considerable industrial and academic attention, and many concrete and practical delivery solutions were identified. Parcel delivery, which involves the delivery of merchandise from retailers to consumers, is the final stage of e-commerce. Merchandise purchased through e-commerce is typically delivered to the residence of consumers. The consumer and merchandise delivery journeys in conventional transactions, which involve consumers visiting retail stores to select and buy merchandise, are longer and shorter, respectively, than those in e-commerce transactions. Increases in the distance of the merchandise delivery journey result in increases in the mileage of delivery vehicles, which increases delivery and environmental costs. Goodman [2] contended that delivering merchandise to consumers, which is also referred to as logistics last mile delivery, is the costliest stage of e-commerce because this stage is inefficient and involves substantial carbon emission. The aforementioned stage accounts for up to 28% of the total delivery costs. Gevaers et al. [3] suggested that logistics last mile delivery is a problem primarily because of the following reasons: (1) customers are not at home: delivery cannot be completed because consumers are not at designated locations when delivery personnel arrive; (2) empty running: delivery vehicles often conduct runs when they are partially loaded or unloaded; (3) security concerns: the requirement for a signature upon delivery can pose security concerns to the recipients and delivery personnel; (4) insufficient economies of scale: the low buying volume of most individual consumers and the low delivery volume of certain areas can make it difficult to achieve sufficient economies of scale; and (5) high carbon emission: the need to deliver merchandise to the residences of consumers as well as the concerns associated with points (1) and (2) compelled operators to field a large fleet of small vehicles, which increased their logistics carbon footprint. Furthermore, Gevaers et al. [3] reported that the cost of logistics last mile delivery accounts for 13–70% of the total cost of supply chains. Logistics last mile delivery can critically affect consumers’ online shopping experience; however, problems arising from inadequate service, such as failed first delivery attempt, package damage, user-unfriendly return procedure, and misconduct of delivery personnel, hindered the development of e-commerce [2]. Moreover, consumer–courier interactions can impede the containment of the ongoing COVID-19 pandemic. All the aforementioned concerns highlight the need for further research to improve the efficiency of merchandise delivery.
Researchers investigated various aspects of logistics last mile delivery. Caceres-ruz et al. [4], Vidal et al. [5], Toth and Vigo [6], and Crainic and Laporte [7] investigated the optimization of delivery route planning, particularly with regard to the presence or absence of time windows in delivery routes. Anderluh et al. [8], Klumpp et al. [9], Chong et al. [10], Perboli et al. [11], and Lee et al. [12] designed innovative delivery methods, such as those involving the use of bicycles, electric vehicles, self-driving vehicles, and drones. Brown and Guiffrida [13] and Edwards et al. [14] compared the levels of pollution generated by in-store pickup and home delivery. Montreuil et al. [15] applied the concept of the Physical Internet in the development of a connected logistics strategy that involves the use of standardized lockers for storing delivered parcels and the transmission of relevant information through the Internet. Fazili et al. [16] reported that the application of the Physical Internet effectively decreases the mileage of delivery vehicles, greenhouse gas emissions, and costs involved in driving delivery vehicles. Faugere and Montreuil [17] introduced the concept of hyperconnected smart parcel lockers, which are essentially a form of the Physical Internet that enables rapid and convenient business-to-consumer (B2C) merchandise delivery and pickup. The aforementioned authors also compared four locker systems. Lemke et al. [18] argued that the placement of lockers at certain locations (e.g., in residential buildings, office buildings, train stations, and shopping malls) for consumers to pick up their purchased merchandise can effectively shorten merchandise delivery journeys. Cheng et al. [19] proposed that merchandise delivery routes should be designed such that the closest possible proximity to the center of the area whereto merchandise is to be delivered is achieved.
Energy shortage and environmental hazards caused considerable concern worldwide. Effective merchandise delivery is a considerable concern for consumers. In various countries, smart parcel lockers are set up to achieve effective merchandise delivery while reducing energy consumption and environmental pollution. Moreover, the establishment of such lockers eliminates the need for interpersonal contact and thus enables the containment of the COVID-19 pandemic. Smart parcel lockers were established by certain operators in Taiwan; however, the locations of these lockers were decided mainly according to cost and convenience considerations rather than considerations for consumer demand and needs or location requirements. Consequently, the use of smart parcel lockers in Taiwan is far from widespread. Therefore, this study developed a multiobjective optimization decision-making model to solve the logistics last mile problem through the use of smart parcel lockers. The TA (Taguchi method) and NSGA-II (non-dominant sorting genetic algorithm II) were combined to determine optimal locker service areas that satisfied consumer needs with limited resources.
The contributions of this study are described in the following text. First, this study developed a novel multiobjective optimization model with three optimization objectives, namely maximum facility coverage, minimum facility overlap, and minimum total idle capacity, for planning the service areas of smart parcel lockers. Second, this study integrated the TA and NSGA-II to develop the TA-NSGA-II approach for solving the developed multiobjective optimization model. This approach requires a relatively small number of experiments and enables the rapid determination of the optimal parameter combination. Third, the present study used the TA-NSGA-II approach in a case study to verify the feasibility of this approach in planning said service areas and its contribution to the development of operational strategies.
The remainder of this paper is structured as follows. Section 2 presents a review of the literature on logistics planning and facility site selection. Section 3 introduces the research assumptions and describes the developed multiobjective optimization model. Section 4 describes the TA-NSGA-II approach. Section 5 presents a discussion on a case study and the obtained analytical results. Section 6 provides the conclusions of this study and suggestions for future research.

2. Literature Review

Optimizing the service areas of smart parcel lockers, which is the objective of the present study, involves the planning of logistic operations and the selection of facility sites. Therefore, this section reviews the literature on last mile delivery in e-commerce supply chain management, facility site selection, and NSGA-II.
Houlihan [20] was the first to propose the concept of supply chain management, which involves the application of industrial dynamics in physical distribution. A supply chain refers to a network comprising upstream, midstream, and downstream entities that are dedicated to various operations that aim to produce goods or services of value [21]. Changes in the production environment, such as an increase in production costs, resource consumption and shortage, shortened product lifespan, and global competition, resulted in the formation of supply chains, which are constituted by the production planning and inventory control process as well as the distribution and logistics process [22]. Ellram [23] defined supply chain management as an integrated approach for handling material planning and control in the different stages between the suppliers to the end users. Supply chain management is conducted to ensure that the interests of all the members of a supply chain are preserved and to achieve the optimal use of resources through the comanagement and consistent plans of supply chain members while providing satisfactory services to customers. Supply chain management is the integration of key business processes concerning related products, services, and information between the raw material suppliers and ends users to maximize the gain of customers and stakeholders. Lambert and Cooper [24] postulated that because the ultimate goal of a supply chain is to maximize the value that it generates, supply chain management refers to the integration and management of supply chain members’ material flow, cash flow, business flow, and information flow to achieve maximum gain for the supply chain.
The internet enables conventional physical stores to engage in e-commerce and convert their business model into multichannel retailing [25]. Thus, the Internet changed the mode of supply chain operations. The real-time exchange of information between supply chain members through the internet has enabled them to increase the efficiency of their operations and decrease their operational costs. Kull et al. [26] maintained that in e-commerce, which is based on the internet, a quicker and more effective access to information allows consumers to consider more options. The Organization for Economic Co-operation and Development defined e-commerce as goods or service transactions completed through the reception or transmission of order specifications on a computer connected to the Internet. According to Maulana et al. [27] and Turban et al. [28], e-commerce refers to merchandise transactions that consumers complete through the Internet. Chiu et al. [29] suggested that e-commerce transactions have the following attractions to consumers: (1) products are available uninterruptedly throughout the year; (2) products can be home-delivered, which eliminates the need to visit physical stores; (3) special offers can be easily compared; (4) prices are attractive; (5) rare or specialized products can be accessed; (6) abundant product-related information can be obtained; (7) more options are available compared with in conventional stores; and (8) any purchased merchandise can be returned.
The operational model of e-commerce mainly comprises business recruitment, the use of online marketplaces, and last mile delivery. Business recruitment involves identifying suitable retailers or sellers capable of selling merchandise online. Online marketplaces provide platforms for online transactions. Retailers or sellers list commodities and relevant information on these platforms, and consumers use an information system to browse through the listing and place orders. Last mile delivery refers to the process of retailers or sellers sending ordered commodities to their customers. Shipping and warehousing are critical to e-commerce. Retailers and sellers must closely monitor the quality and quantity of their commodities during shipping and warehousing to ensure that the orders delivered to their customers are accurate. Shipping and warehousing must also be performed at the lowest possible cost and on schedule. Among the transaction modes of e-commerce, the delivery of physical commodities from manufacturers to customers is usually the most cost-intensive and most difficult to execute [30]. Home delivery is a key trait of e-commerce. Edwards et al. [14] and Visser [31] observed that the transaction model of e-commerce typically results in an increase in the volume of parcels but a decrease in their weight, which compels delivery vehicles to conduct additional runs. Therefore, the growth of e-commerce scale increases the number of delivery journeys by delivery operators. The prosperity of e-commerce should not be achieved at the expense of the natural environment.
Last mile delivery refers to the last part of the B2C or consumer-to-consumer (C2C) merchandise delivery process. The recipient must be present at a designated location (e.g., their residence) to receive their orders. In practice, the delivery of e-commerce merchandise involves repeated delivery journeys that produce little value and increase the mileage of delivery vehicles. Consumers are usually not at home during normal office hours, which results in the need to transport a parcel to an address two or more times before it can be delivered. Boyer et al. [32] and de Souza et al. [33] reported that approximately 20–30% of parcels are repeatedly delivered. Gevaers et al. [3] identified logistics last mile delivery as the most cost-intensive, most pollution-intensive, and least efficient part of the merchandise logistics process. Moreover, they reported that the low efficiency of logistics last mile delivery could result in it accounting for up to 75% of the total logistics costs and that ineffective delivery may result in consumers assigning a low rating to the entire merchandise purchase system.
E-commerce induced an explosive growth in parcel delivery. In addition to increases in vehicle exhaust, noise, and traffic accidents, e-commerce has contributed to the deterioration of urban environment. The conventional home delivery pattern of e-commerce has drawbacks for both sellers and consumers. One solution to address this problem is the establishment of parcel collection points. Specifically, this solution involves setting up collection points in certain locations (e.g., in shops or booths) for parcels to be stored and collected. This practice allows delivery operators to send a large shipment of parcels to a collection point, which effectively reduces the mileage of their delivery vehicles. It also allows consumers to pick up their parcels at a time of their choice, which eliminates the need of consumers to wait for delivery personnel and provides them flexibility in time use [34].
A smart parcel locker is a type of parcel storage system that combines the delivery and pickup aspects of parcel delivery. Such a locker contains a mobile terminal system that automatically notifies recipients when parcels are shipped to a collection point and stored in the locker. The recipients can then visit the locker at a convenient time and pick up their parcels after passing identity verification. Throughout the entire process, delivery personnel and parcel recipients need not contact with each other. Thus, from the consumer perspective, the transaction process transitions from passive waiting to proactive picking. The aforementioned strategy not only gives consumers autonomy over when to collect their parcels but also addresses their need for privacy. Smart parcel lockers have become common in Western countries since 2014. Notable smart parcel operators include La Poste (France), Correos (Spain), UPS (US), Australia Post (Australia), and CTT (Portugal). In Taiwan, numerous operators have launched smart parcel locker services, including Palm Box, iPickup, and iBox. Palm Box, which was founded in 2016, mainly set up its collection points in convenience stores and community centers. It currently owns approximately 1300 collection points, and the logistics operators it works with include SF Express, Pelican, KTJ, and UPS. iBox, which was also founded in 2016, mainly set up its collection points in post offices; however, it also set up some collection points at train stations and community centers. Currently, iBox owns approximately 300 collection points, and it primarily works with Chunghwa Post. iPickup was established by the Industrial Technology Research Institute in 2016. It originally targeted school campuses but withdrew from schools in 2019. Currently, iPickup is eagerly seeking cooperation with convenience stores. The logistics operators that iPickup works with include Chunghwa Post, KTJ, HCT, Pelican, and T-Cat.
Smart parcel lockers, which can be regarded as temporary parcel storage spaces, function as warehouses. However, warehouses only allow personnel from their operators to perform sorting, storing, and pickup tasks in them; unrelated personnel are denied access. By contrast, people are allowed to enter and pick up parcels from smart parcel lockers. Therefore, in addition to storage space, the selection of parcel collection points must consider customer convenience. Because the objective of this study was facility service planning for smart parcel lockers, consumer needs had to be considered in this study when searching for suitable service areas of locker sites to address the logistics last mile problem. In 1909, Weber proposed that the location of a warehouse should be determined with the aim of achieving the minimum total traveling distance, which is the sum of a candidate site’s distance with each customer. Weber’s study can be regarded as the beginning of site selection research. Hotelling [35] examined a scenario in which two rival companies selected their facility sites in a competitive market. Following Hotelling’s study, studies have made continual improvements to location theory. As the foundation of facility site selection and service deployment decision-making research, location theory is applicable in domains such as industrial production facility planning, spatial layout planning, and service system site selection.
Facility site selection is critical to organizations because it can profoundly affect their operation. Depending on the decision-making scenario an organization is in, common facility location problems include single location problems, multiple location problems, P-median problems, P-center problems, and covering problems. Owen and Daskin [36] explored site selection problems and categorized them into four types: P-median problems, P-center problems, covering problems, and other problems.
P-median problems involve the selection of P locations to set up facilities for demand points. Decisions are made according to each demand point’s distances from facility sites. The weighted values of demand and distance are calculated, and the sites with the smallest total weighted values are selected. P-median problems were first described by Hakimi [37], who presented a network diagram containing nodes and lines that represented demand points and traffic routes, respectively. This diagram is based on the premise that each demand point can also be a candidate facility site, and a set number (P) of sites must be selected from candidates with the shortest total travel distance. ReVelle and Swain [38] developed an integer encoding model for solving P-median problems. This model minimizes the total weighted distance and is expressed as follows:
min   i ,   j h i d i j x i j ,
subject to
j x i j = 1       i ,
x i j y j     i ,   j ,
j y j = p ,
x i j 0 ,   1       i ,   j ,
y i 0 ,   1 j ,
where i is the demand point, j is the facility location, h i is the demand at point i, d i j is the distance between demand points i and j. x i j is 1 if the demand point i is assigned to the facility located at j and 0 otherwise, y j is 1 if the facility located at j and 0 otherwise, p is the number of facilities. Ghoseiri and Ghannadpour [39] and Drezner et al. [40] solved P-median problems by using genetic algorithms. Griffith and Paelinck [41] proposed the use of spatial autocorrelation for solving P-median problems.
P-center problems involve determining the relative locations of facilities according to the minimum coverage distance for a given number of facilities and under the premise that demand was satisfied. The purpose of solving such problems is to minimize the maximum facility–demand point distance. Each facility serves as a center point from which the service perimeter expands as a circle until all the demand points were covered. The facility with the highest service perimeter must have the smallest possible service perimeter radius. Hakimi [37] was first to describe P-center problems in a network model. Daskin [42] developed a mathematical model for solving P-center problems. This model minimizes the maximum distance and is expressed as follows:
min   z ,
subject to
j x i j = 1       i ,
j d i j x i j z       i ,
j y j = p ,
x i j y j       i ,   j ,
y j 0 ,   1       j ,
x i j 0 ,   1       i ,   j ,
where z is defined as the largest distance between a demand point and its closest facility, i is the demand point, j is the facility location, d i j is the distance between demand points i and j. x i j is 1 if the demand point i is assigned to the facility located at j and 0 otherwise, y j is 1 if the facility located at j and 0 otherwise, p is the number of facilities. Davidović et al. [43] used bee colony optimization for solving a P-center problem. Martínez–Merino et al. [44] planned services for potential customers by solving a probabilistic P-center problem.
Covering problems can be categorized into maximal covering location problems (MCLPs) and location set covering problems (LSCPs). LSCPs were first proposed by Toregas et al. [45]. These problems are mainly used and solved in the site selection of emergency service facilities, which requires the satisfaction of all demand points with the least number of facilities. The model minimizes the number of facilities and is expressed as follows:
min   j x j ,
subject to
j x j 1       i ,
x j 0 ,   1 i ,
where x j is 1 if a facility is established at point j and 0 otherwise. Rajagopalan et al. [46] developed a multiperiod LSCP model for the dynamic dispatch of ambulances. Ghaderi and Jabalameli [47] employed heuristic algorithms to solve a budget-constrained dynamic facility location planning problem.
MCLPs were first proposed by Church and ReVelle [48]. These problems are mainly solved to determine optimal facility locations for covering the highest number of demand points with a given number of facilities. The model maximizes the coverage of demand points and is expressed as follows:
max   i h i y i ,
subject to
s . t .   j x j y i       i ,
j   x j p ,
x j 0 ,   1 j ,
y i 0 ,   1 i ,
where i is the demand point, j is the facility location, h i is the demand ate point i, d i j is the distance between demand points i and j. x j is 1 if the facility located at j and 0 otherwise, y i is 1 if the point i is covered by one or more facilities within the expected distance and 0 otherwise, p is the number of facilities to be located. ReVelle et al. [49] applied a heuristic approach to solve an MCLP. Table 1 presents a comparison of MCLP and LSCP.
This study aimed to achieve optimal service coverage and satisfy customer demand by using limited resources. In addition to achieving maximum coverage, this study sought to avoid excessive overlap between facilities. Therefore, the objective of this study can be seen as an extension of MCLP. When the scale of a facility site selection problem is increased, the quantity of data is increased and data processing requires a long time; thus, obtaining an optimal solution in a short time becomes difficult. A review of the relevant literature reveals that heuristic algorithms were widely used for solving facility site selection problems. For example, Ghoseiri and Ghannadpour [39], ReVelle et al. [49], Davidović et al. [43], Ghaderi and Jabalameli [47], and Drezner et al. [40] reported that heuristic algorithms provide favorable results when they are used for solving the aforementioned problems. Because the scenario considered in this study involved a high consumer demand for parcel delivery, a heuristic algorithm was adopted.
Holland [50] developed the genetic algorithm according to the law of natural selection, which is based on the principle of the survival of the fittest. This algorithm determines the optimal solution of a complex problem through mechanisms such as chromosome representation, cloning, crossover, and mutation. Fonseca and Fleming [51] developed a multiobjective genetic algorithm (MOGA) for solving multiobjective optimization problems. Srinivas and Deb [52] introduced the concepts of nondominated and dominated solutions into the MOGA to develop the nondominant sorting genetic algorithm (NSGA) for addressing the interobjective conflicts in multiobjective problems. Deb et al. [53] introduced domination comparison operations and the crowded-comparison operator into the NSGA to develop NSGA-II. They also verified that NSGA-II had a significantly higher problem-solving efficiency than the NSGA did. In NSGA-II, the rankings of nondominated and dominated solutions are sorted to retain the optimal solutions. Through this elitism strategy, the stability of the offspring population is ensured; thus, NSGA-II is an effective algorithm for multiobjective optimization [54,55]. NSGA-II was widely applied in various decision-making problems, such as multipoint planning and dispatch [56], system reliability [57], supply chain planning [58], logistics network design [59], oil platform site selection [60], assembly line balancing [61], satellite data transmission scheduling [62], power system fault diagnosis [63], electric vehicle charging station location planning [64], and nursing home location and allocation [65]. Therefore, the present study employed NSGA-II to solve the developed mathematical model to achieve multiobjective optimization.

3. Mathematical Model for Multiobjective Facility Service Area Optimization

3.1. Assumptions and Notations

This study investigated the facility service areas of smart parcel lockers to address the logistics last mile problem pertaining to the merchandise delivery demand (B2C or C2C) induced by e-commerce transactions. The service areas of smart parcel lockers were determined according to geographic location; online transaction volume; and locker-related information, including locker capacity, consumers’ desired delivery destinations, and distances between desired delivery destinations and lockers. In addition, the optimization of facility service areas can prevent the idling of resources, such as some facilities being underused due to the personal preferences of delivery personnel. Maximum coverage, minimum idle capacity, and minimum overlap were used as the bases of assessment for the service area determination of smart parcel locker facilities in this study.
The following assumptions were made in this study:
  • The customer demand and locations are known;
  • The service cannot be shut down in any smart parcel locker;
  • Nonrecurring events (e.g., traffic accidents and parcels remaining unclaimed) can be ignored;
  • The total demand for a location does not exceed the total capacity of lockers allocated to the location.
The notations used in this study are listed in Table 2.

3.2. Multiobjective Optimization Mathematical Model

Objectives:
Maximum coverage ( f 1 ) refers to the maximum demand that can be satisfied by smart parcel locker locations.
M a x   f 1 = i = 1 I j = 1 J C o d i j A s d i j A s q i j j = 1 J T d e j ,
Minimum overlap ( f 2 ) refers to the minimum number of demand points simultaneously covered by multiple smart parcel locker locations.
M i n   f 2 = j = 1 J C o t j J ,
Minimum total idle capacity ( f 3 ) is the total remaining amount of capacity left in smart parcel locker locations after assigned capacity were eliminated.
M i n   f 3 = 1 i = 1 I j = 1 J C o d i j A s d i j A s q i j T c a i ,
Constraints:
One demand point must be assigned by at most one locker location.
i = 1 I A s d i j 1       j ,
When a demand point is covered by the facilities of a locker location, it must be within the service distance of the locker location.
C o d i j D i s i j   S e c i     i , j ,
The number of assigning demand points to a locker location must not exceed the number of covered demand points to the locker location.
j = 1 J A s d i j     j = 1 J C o d i j       i ,
The service distance of a locker location must not be less than 1.
S e c i 1       i ,
The total demand of the demand points assigned to a locker location must not exceed the maximum capacity of the locker location.
j = 1 J A s d i j A s q i j T c a i       i ,
When a demand point is covered by at least one locker location.
C o t j =   1 ,   i = 1 I C o d i j > 1 0 ,   i = 1 I C o d i j 1       j ,
Stressing the 0–1 integer restriction for decision-making variables, as shown in Equation (10). Non-negative integers are as shown in Equation (11)
A s d i j   0 ,   1     i , j ,
A s q i j       i , j ,

4. The Proposed TA-NSGA-II Approach

This study proposes TA-NSGA-II, which is a combination of the TA and NSGA-II, for solving the developed mathematical model for the multiobjective optimization of the location service areas of smart parcel locker facilities. Considering that smart parcel locker facilities have a limited capacity, capacity constraints must be applied for planning service areas when performing iteration. The steps in the TA-NSGA-II approach are as follows:
Step 1
Performing solution encoding and generating the initial population
Each individual is expressed as a chromosome, which represents a group of feasible solutions. A chromosome, which was encoded using integers in this study, consists of the smart parcel locker facility to which a demand point is assigned and the service perimeter of the smart parcel locker facility. First, the maximum service perimeter of each locker facility is randomly generated. Then, each demand point is randomly assigned to a facility, with the assignment conforming to the maximum capacity constraint of each facility Equation (8), and the distance between the two is calculated. The chromosome structure includes four segments: (A) arrangement of demand quantities from each point to each locker. (B) service distance of each locker. (C) demand assignment from each point to each locker. (D) coverage status for each locker. Figure 1 presents the structure of chromosome encoding. The initial population is generated, with all constraints (Equations (4)–(11)) satisfied, with the primary purpose of increasing the number of nondominated solutions for the initial search. The infeasible chromosomes were deleted and replaced by a new group of chromosomes.
Step 2
Calculating the fitness value of each objective
Fitness is a parameter used to evaluate the adaptability of an individual and a benchmark for evaluating the evolution of an objective value. In this study, three objective functions, namely coverage, overlap, and idle capacity Equations (1)–(3), were the fitness functions used to calculate the fitness value of each individual.
Step 3
Establishing the performance assessment equation
In contrast to the results obtained when solving single-objective problems, those obtained when solving multiobjective problems cannot be easily evaluated. This study used maximum spread (MS) to evaluate the searching performance of the proposed algorithm [66,67]. MS mainly reflects the distribution of a nondominated solution set. A large MS value indicates a wide, extensive distribution. The higher the MS value, the more diverse are an algorithm’s solutions. The objective functions were normalized and then substituted into Equation (12) to calculate MS. In Equation (12), S denotes the number of objective functions and T denotes the number of nondominated solutions.
M S = s = 1 S max t = 1 T f s t min t = 1 T f s t 2 1 / 2 ,
Step 4
Identifying factors and establishing the orthogonal array
This study used NSGA-II to solve multiobjective optimization problems. The parameters that must be set in NSGA-II include the number of iterations, crossover rate, mutation rate, and population size. These four parameters were identified as factors, and their factor levels were determined. A TA orthogonal array was established using the number and level of factors to obtain experimental parameter combinations. The orthogonal array offered a systematical and efficient way to change factors, reducing the number of experiments and simplifying the data processing process.
Step 5
Selecting the optimal parameter combination
The signal to noise ratio (SNR) can serve as a statistic indicating the quality of algorithm solutions. A higher SNR denotes higher stability of quality. This study adopted MS for evaluating algorithm performance. With the aim of maximizing the solution quality, this study adopted Equation (13) to calculate the SNR. The levels of factors (i.e., number of iterations, crossover rate, mutation rate, and population size) that had a high SNR value were selected to form the optimal parameter combination for NSGA-II.
S N R = 10 l o g 1 n i = 1 n 1 y i 2 ,
Step 6
Ranking chromosomes
After obtaining the fitness values of all the chromosomes, the chromosomes must be ranked to determine the quality of the solutions. Chromosomes in a population that are not dominated by any solution are classified as rank 1 chromosomes and excluded in the next ranking cycle. This ranking step is repeated until all the chromosomes were ranked. The solutions with the same rank are nondominated solutions.
Step 7
Calculating crowding distance
Equation (14) presents the formula for calculating chromosomes’ crowding distance, which is the distance between chromosomes of the same rank. This distance also reflects the density of chromosomes. A small crowding distance indicates a high density (because chromosomes are close to each other), and a large crowding distance, a low density. In the gene cloning stage, selecting chromosomes with a large crowding distance can ensure the diversity of the solutions.
C r d h = s = 1 S f s h + 1 f s h 1 ,   h = 2 , 3 , , H 1 ,
where C r d h represents the crowding distance of the hth chromosome; s represents the sth objective function; H represents the number of chromosomes with a certain rank; and f s h + 1 and f s h 1 represent the values immediately before and after chromosome h in objective function s, respectively. This study referenced the study of Deb et al. [53] and set the crowding distances of the first and last chromosomes of a certain rank as infinity to ensure that both ends of the Pareto front exhibited MS.
Step 8
Using the elitism strategy
The initial population is combined with the offspring generated by the proposed algorithm. Nondominated solutions are ranked, and crowding distances are calculated, after which the top 50% of the solutions are retained to be carried over to the next generation. Among all the chromosomes, the ones with identical genes are eliminated.
Step 9
Gene cloning
Tournament selection is used for identifying the genes for cloning. Two chromosomes are randomly selected and compared, and the one with a lower rank, or the one with a larger crowding distance in the event that both chromosomes belong to the same rank, is retained to be carried over to the next population. The aforementioned process is repeated until the new population reaches the same size as the initial population.
Step 10
Crossover and mutation
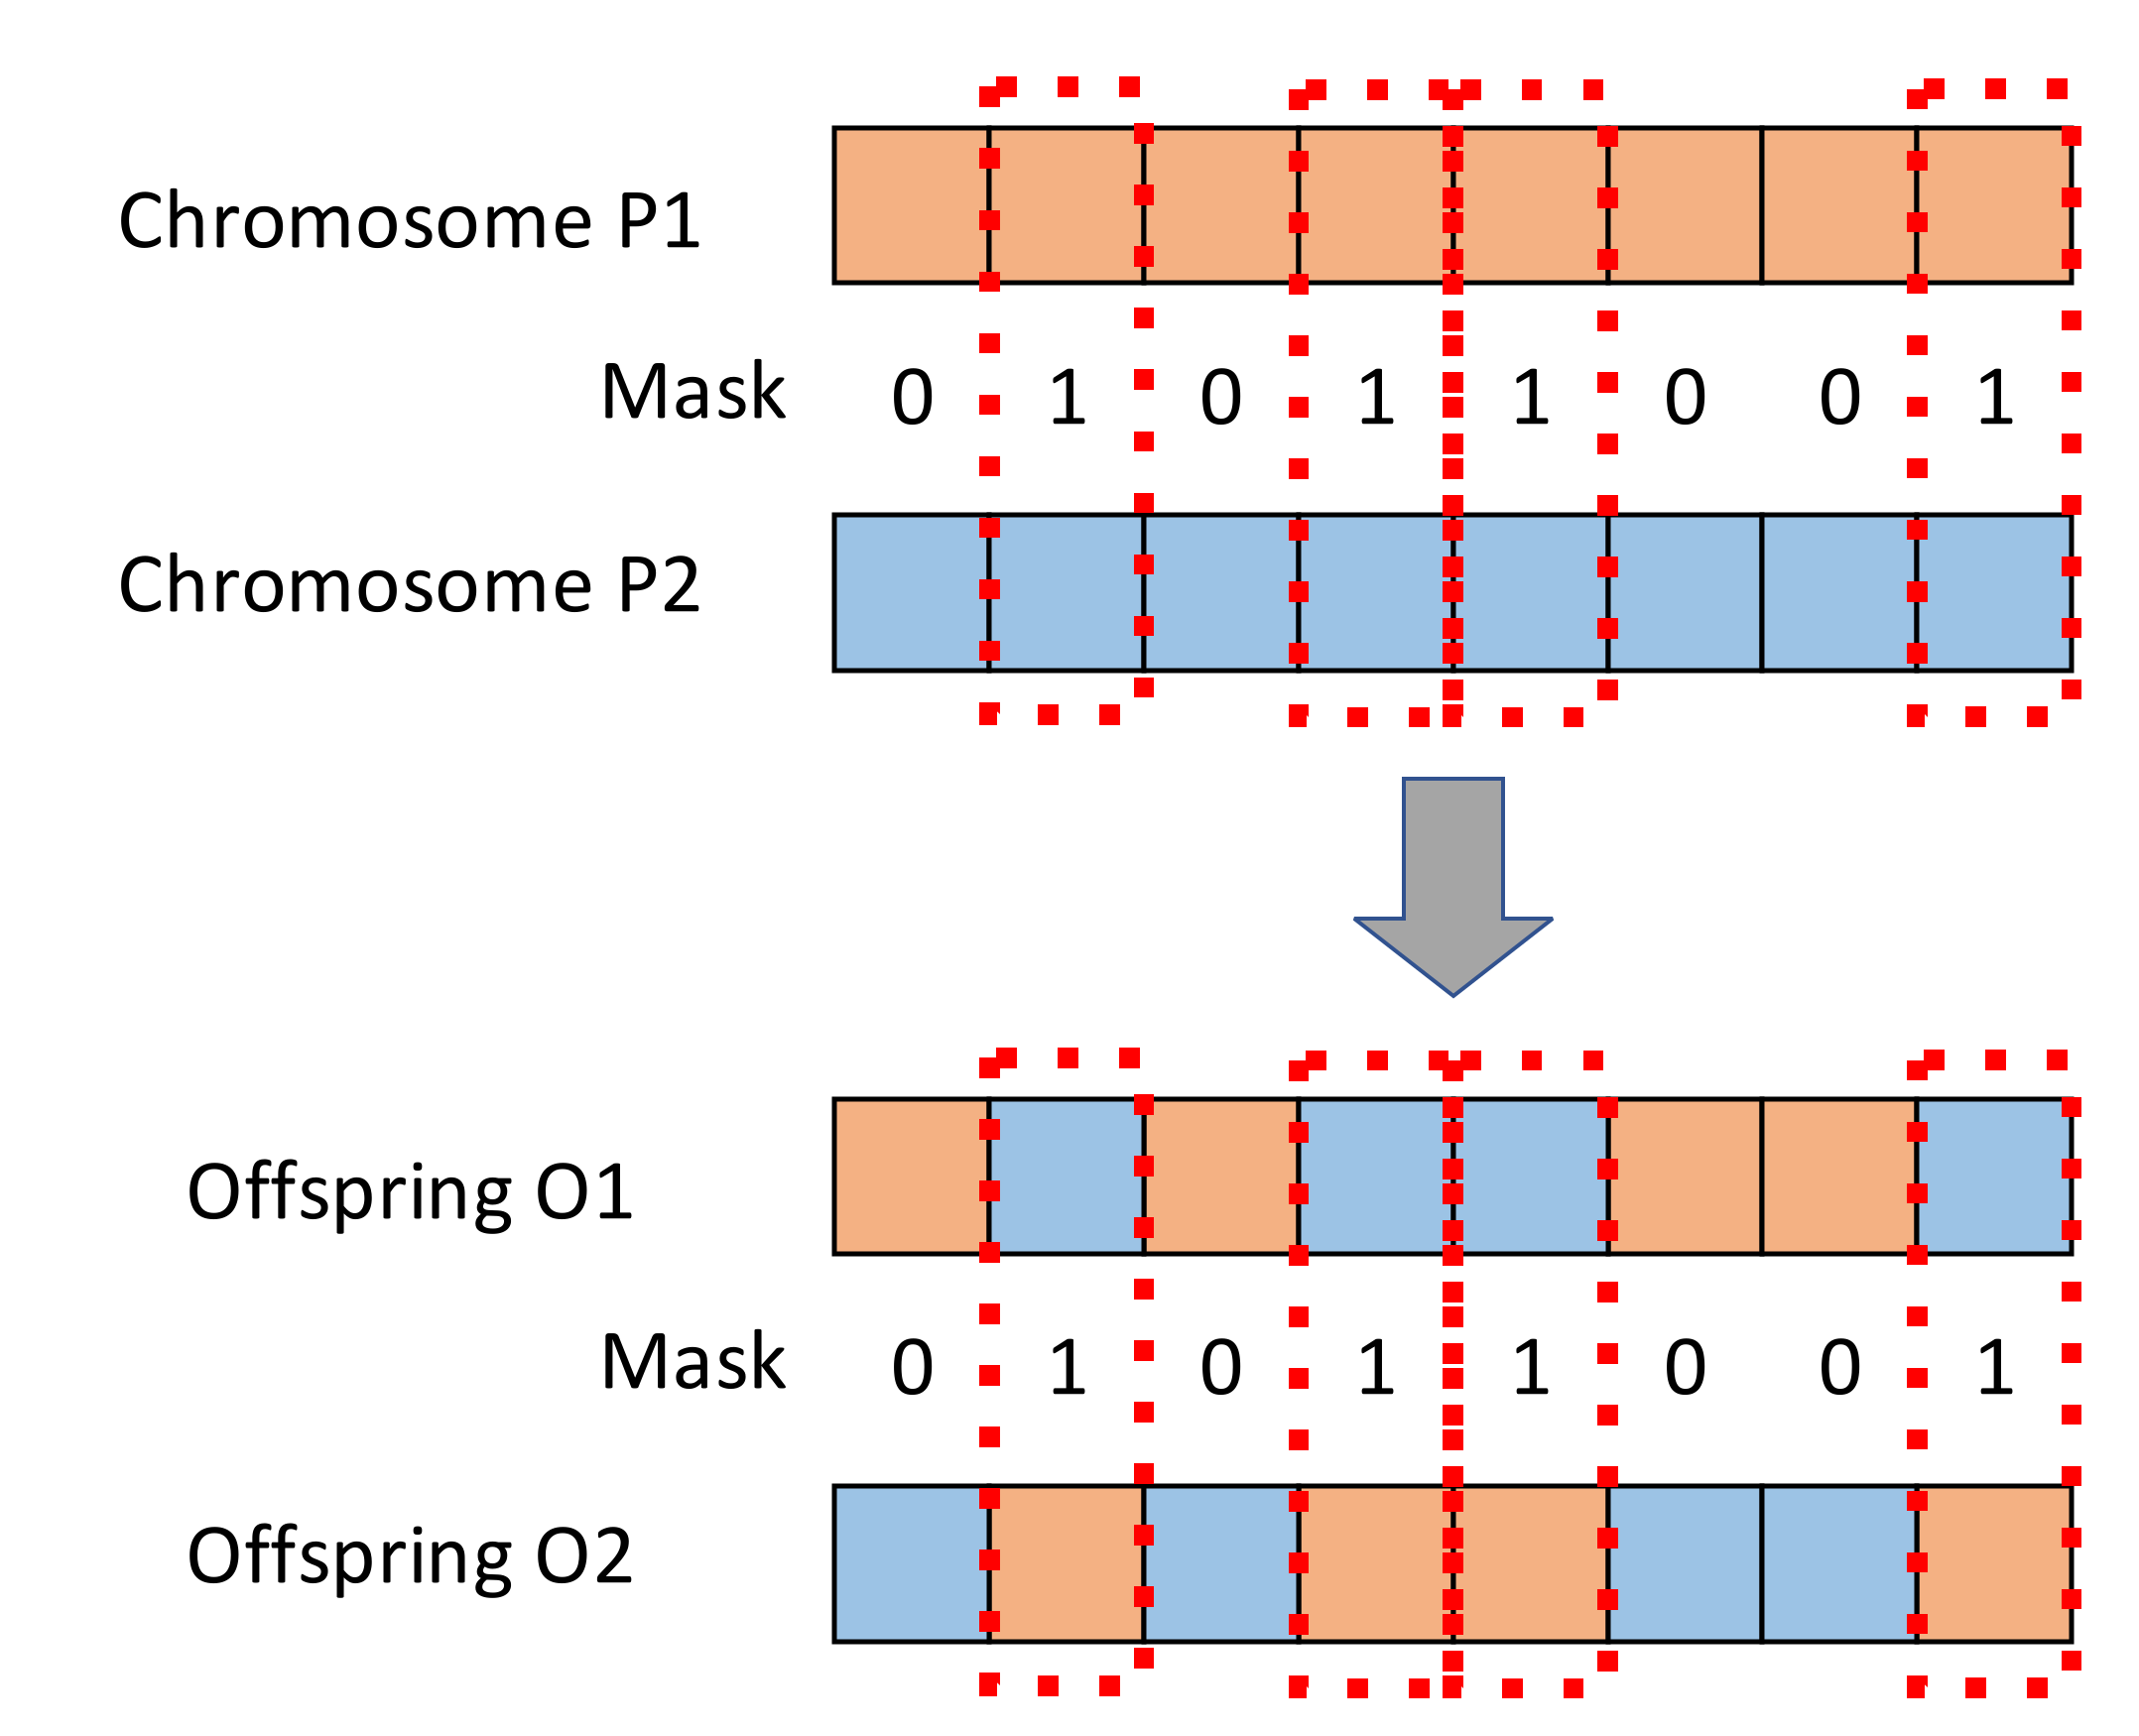
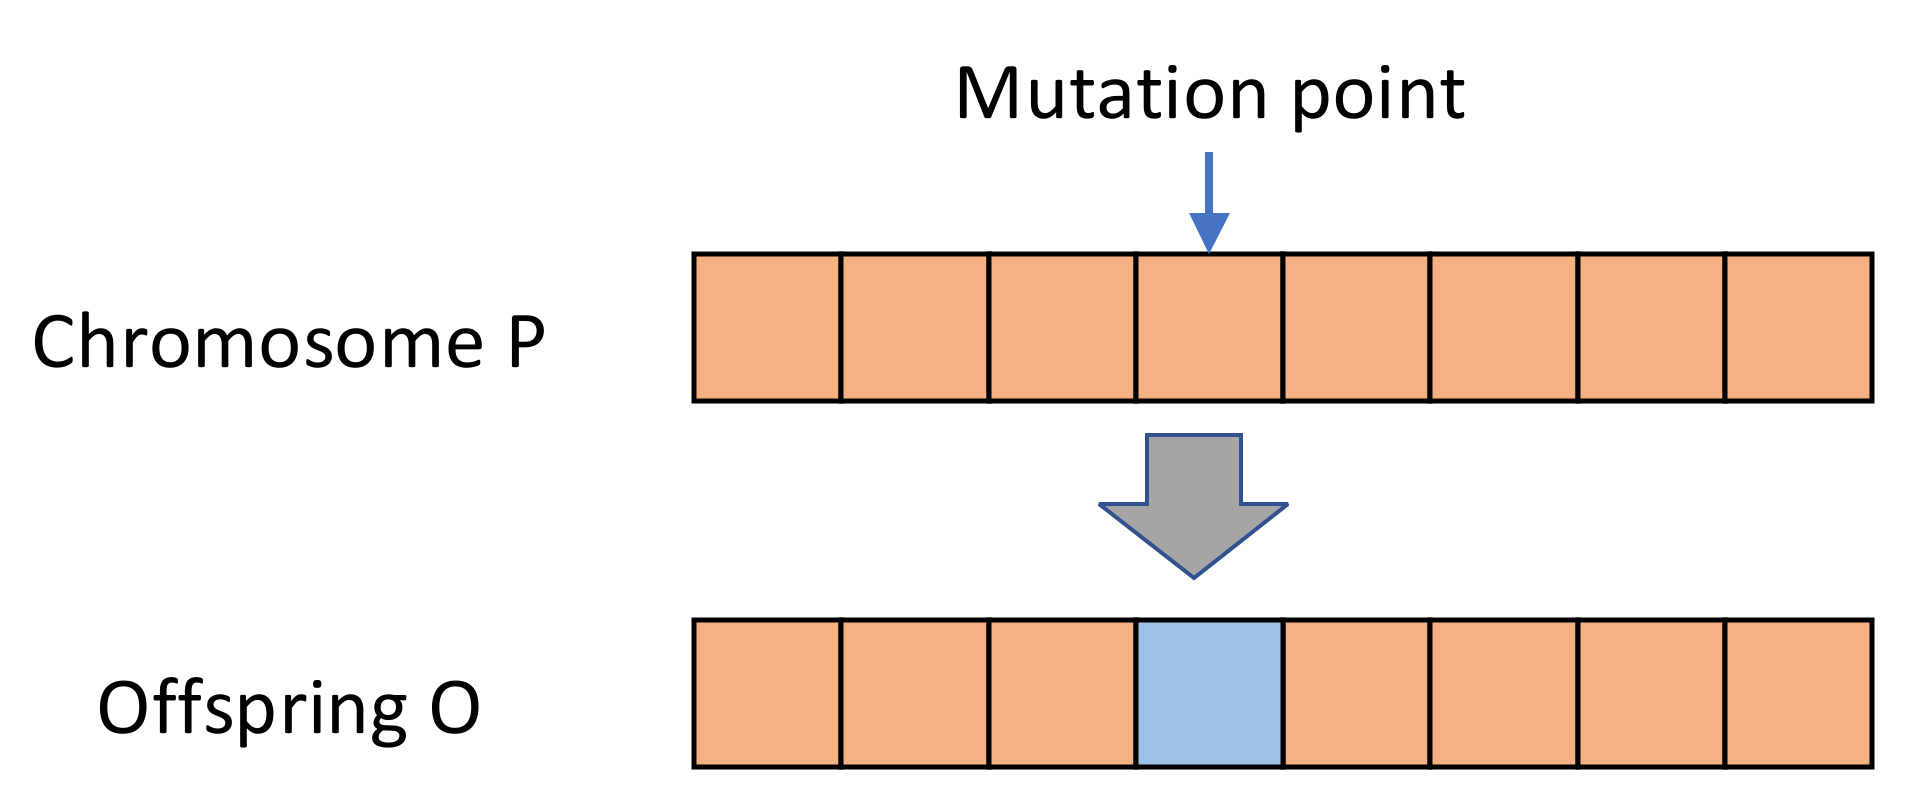
Gene crossover must be performed after gene cloning. Specifically, it involves two chromosomes contributing a part of their genes to form a new offspring. In this study, uniform crossover was performed, and the crossover rate obtained in Step 5 was applied. The uniform crossover method is adopted for the crossover of each segments. Chromosomes P1 and P2 are randomly selected from the population. The gene exchange points are generated by the mask. The value of each mask, is randomly generated, is 0 or 1. When the gene values derived from the mask value 1, the genes will be exchanged, then the two new offspring are be produced. The crossover operator is shown in Figure 2. Gene mutation is a mechanism designed to prevent an objective function from prematurely falling into a local optimum solution and thus missing the global optimum solution. Gene mutation is performed according to the mutation rate obtained in Step 5. For the mutation of each segment, the single point mutation is employed. Randomly selected a chromosome from the population, a mutation point is randomly selected in the chromosome for performing mutation (Figure 3).
Crossover and mutation are repeatedly performed until a solution conforming to the constraints expressed in Equations (4)–(11) are obtained. The infeasible chromosomes were deleted and replaced by a new group of chromosomes. If the number of evolutions is lower than the number of iterations obtained in Step 3, Step 2 must be repeated to form a new generation. In this case, Steps 3–5 need not be repeated because the number of iterations, crossover rate, mutation rate, and population size are already known.
Step 11
Exporting the optimal solution when the termination condition is met
The proposed algorithm is terminated when the number of evolutions reaches the number of iterations obtained in Step 5.

5. Case Study and Results

5.1. Case Description

To meet the demand for parcel delivery, an operator established 10 smart parcel locker facilities in the main area it serves; in these facilities, delivery personnel can store parcels, which can subsequently be collected by customers. For the case study, the locations of the customers were set as demand points, and the objective was to plan the service areas of the locker facilities according to the demand and locations of the customers as well as the locations and capacities of the facilities. A demand point must be assigned to a facility that is most suitable for it so that a parcel delivered to a facility need not be transferred to another facility because the original one has reached full capacity, which would force the recipient of the parcel to travel a longer distance than necessary.

5.2. Parameter Setting

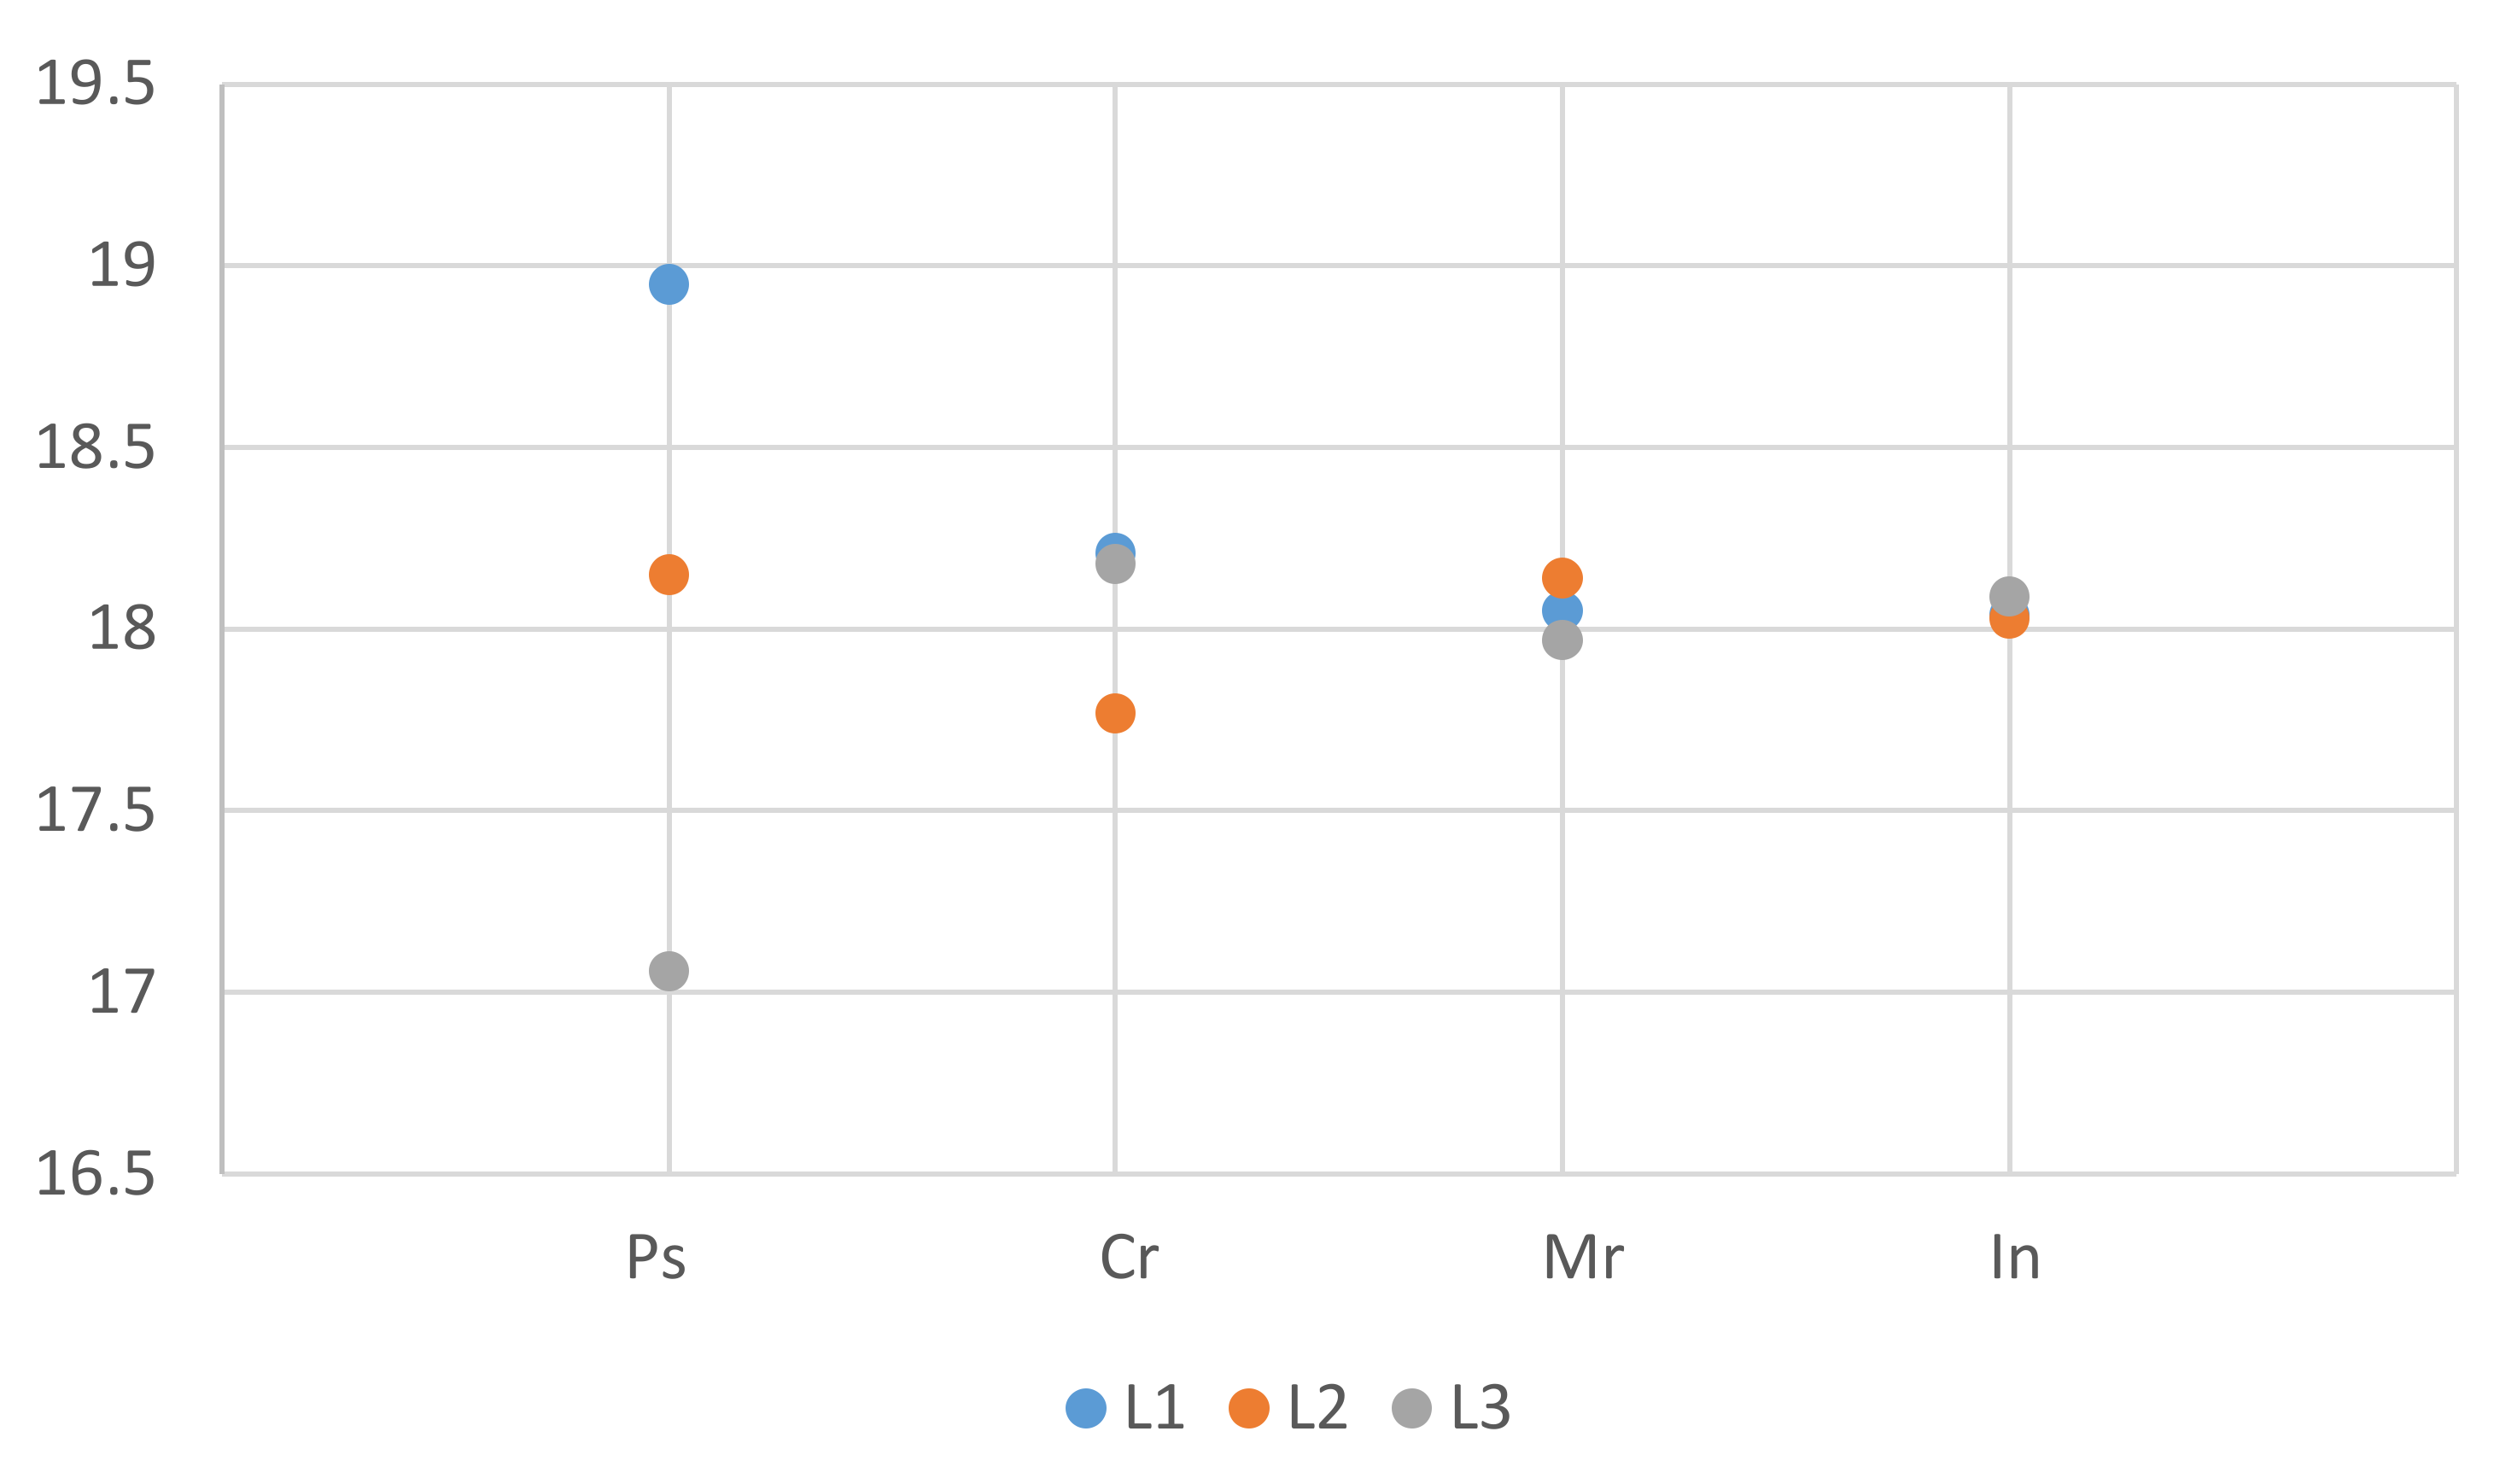
This study referenced the studies of Farsangi et al. [68], Rojas et al. [69], and Su and Chen [70] for setting the algorithm parameters. The population size (Ps) was set as 50, 100, and 150; the crossover rate (Cr) was set as 0.9, 0.8, and 0.7; the mutation rate (Mr) was set as 0.06, 0.1, and 0.2; and the number of iterations (In) was set as 100, 500, and 1000. The optimal parameter combination was identified using a correlation analysis. Ghezavati and Hosseinifar [71] and Rayat et al. [72] applied the TA for parameter adjustment in site selection research; therefore, the present study also used the TA for this purpose. All the factors and factor levels were defined as Table 3. The design of this experiment includes four factors and three levels, and the target is to obtain as large the number of Pareto solutions as possible. Hence, the SNR for “Larger is Better” is computed for each experiment. The mean SNR of the nine experimental combinations implemented 10 times was determined in Figure 4. According to this SNR, the optimal population size, crossover rate, mutation rate, and number of iterations were determined to be 150, 0.9, 0.06, and 1000, respectively. The aforementioned optimal parameter combination was used in the case study to verify the applicability of the proposed algorithm.

5.3. Results and Discussions

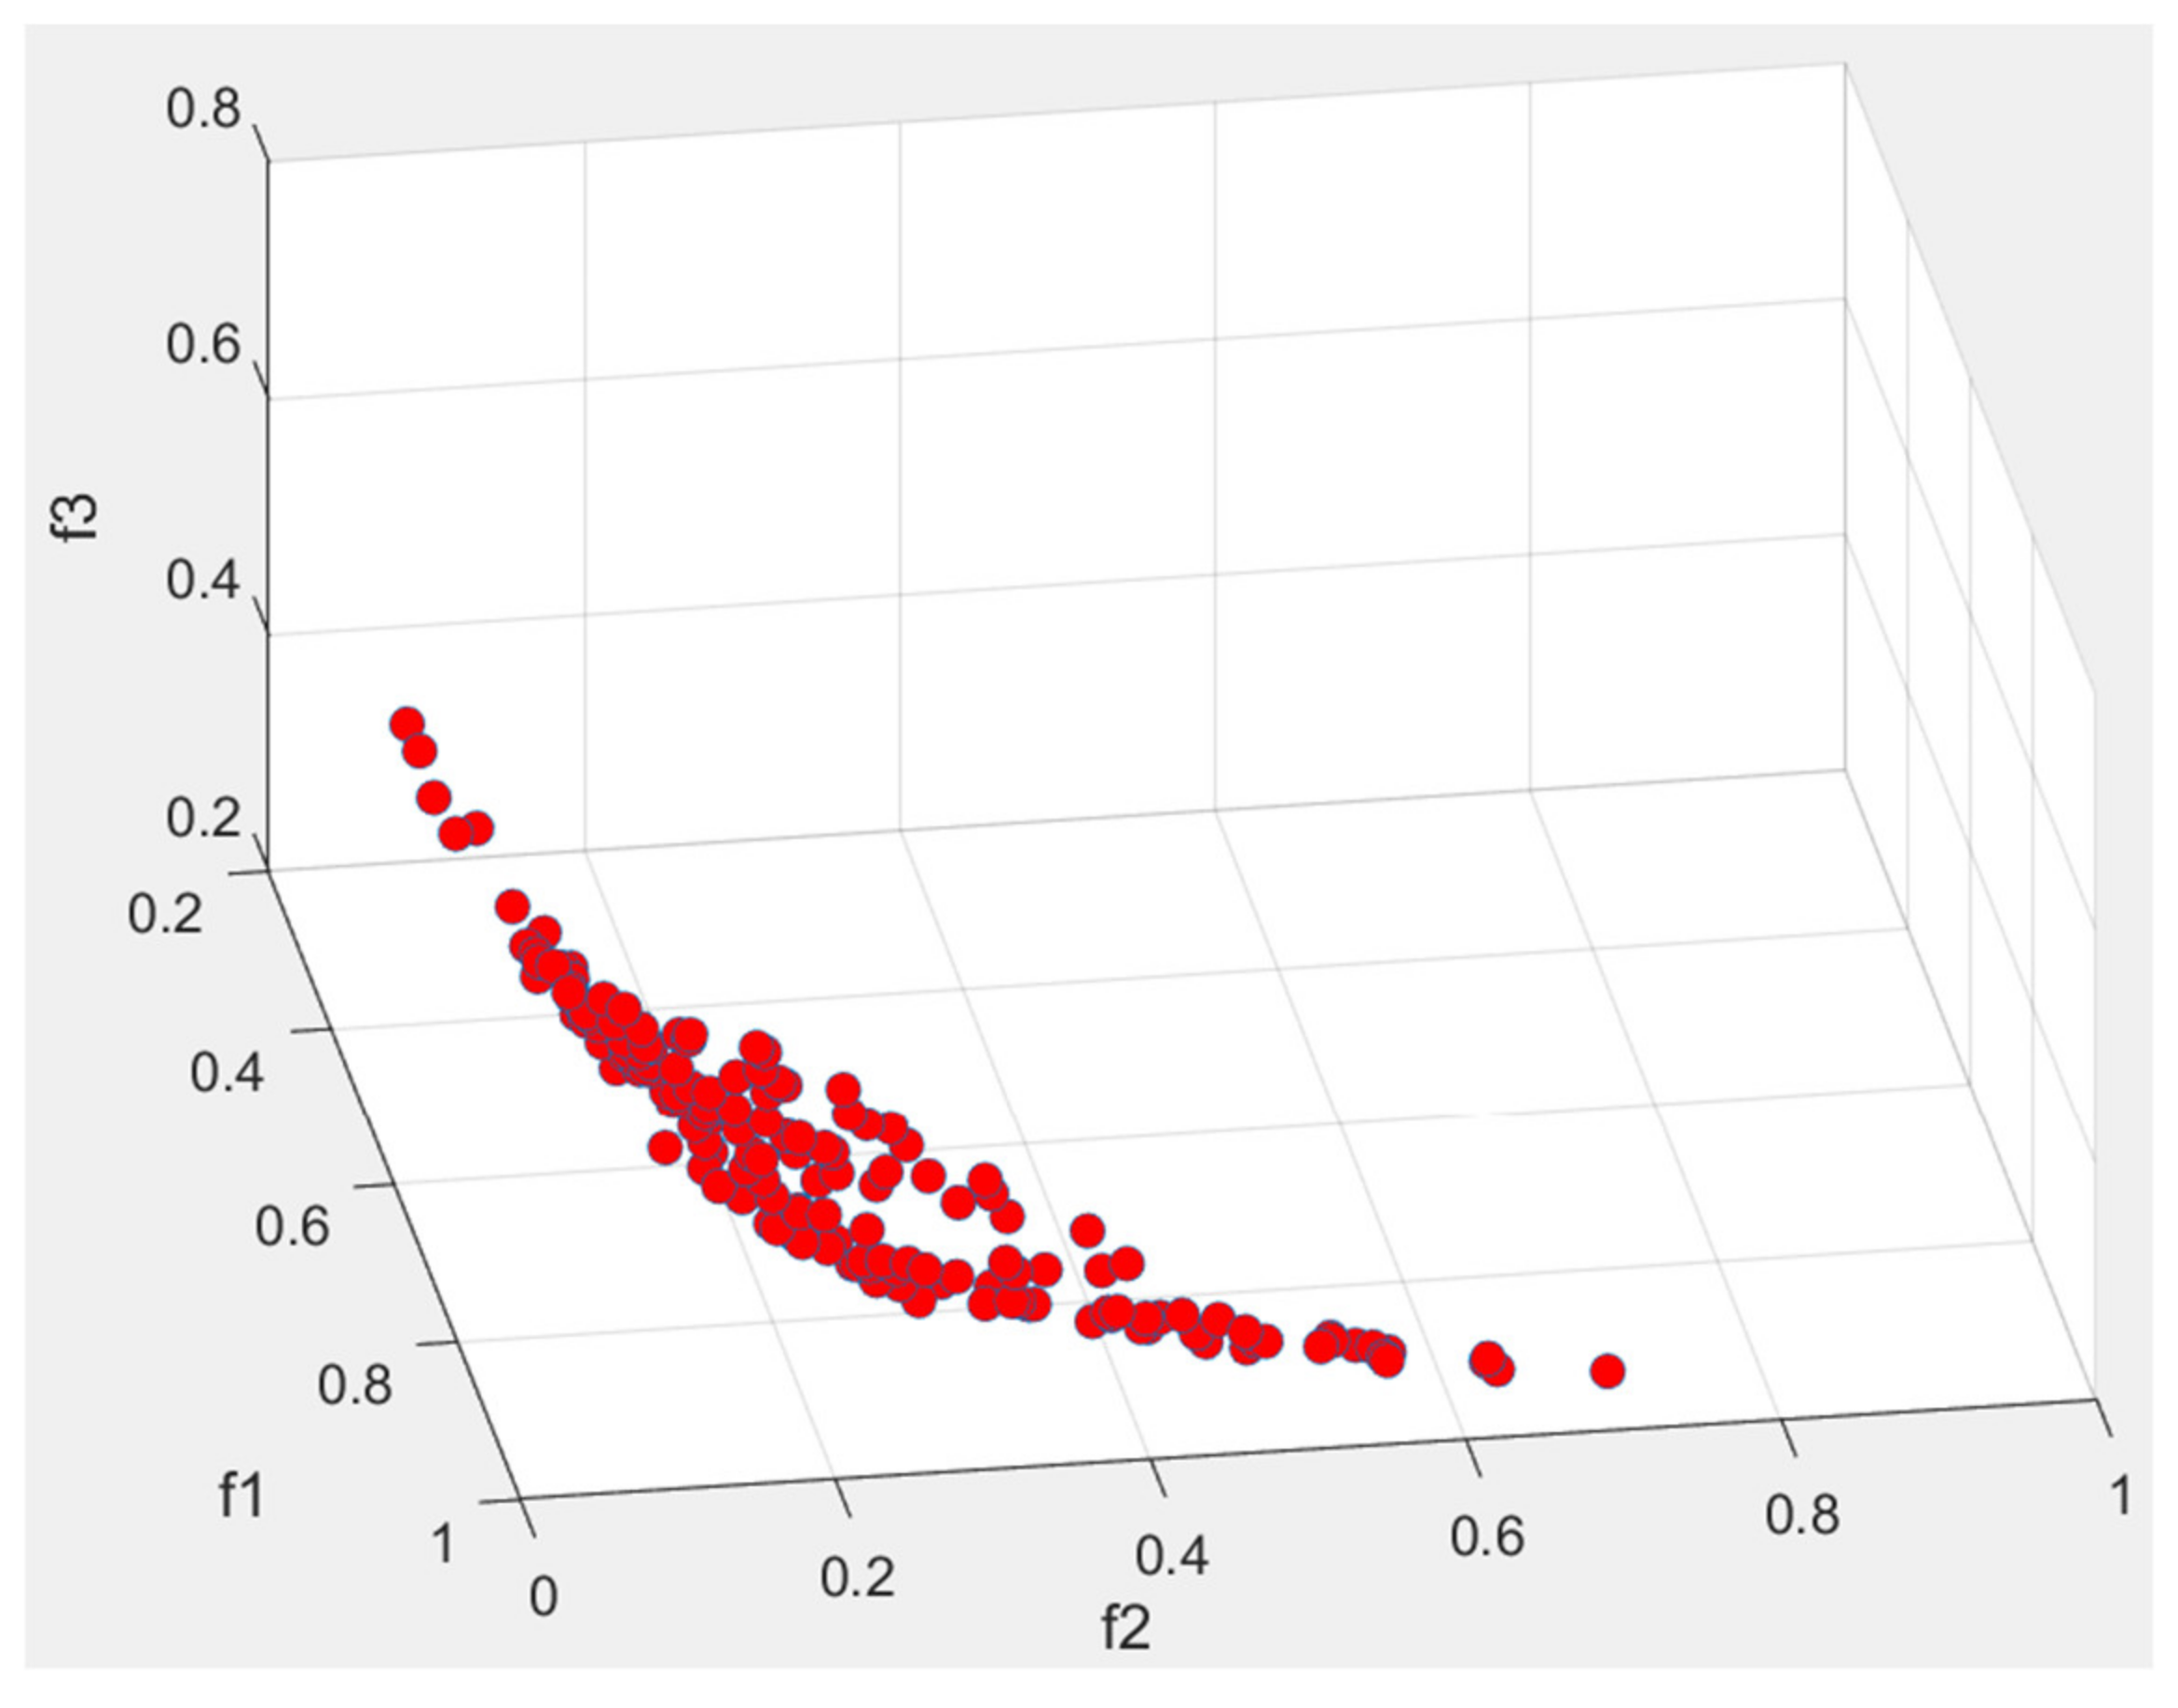
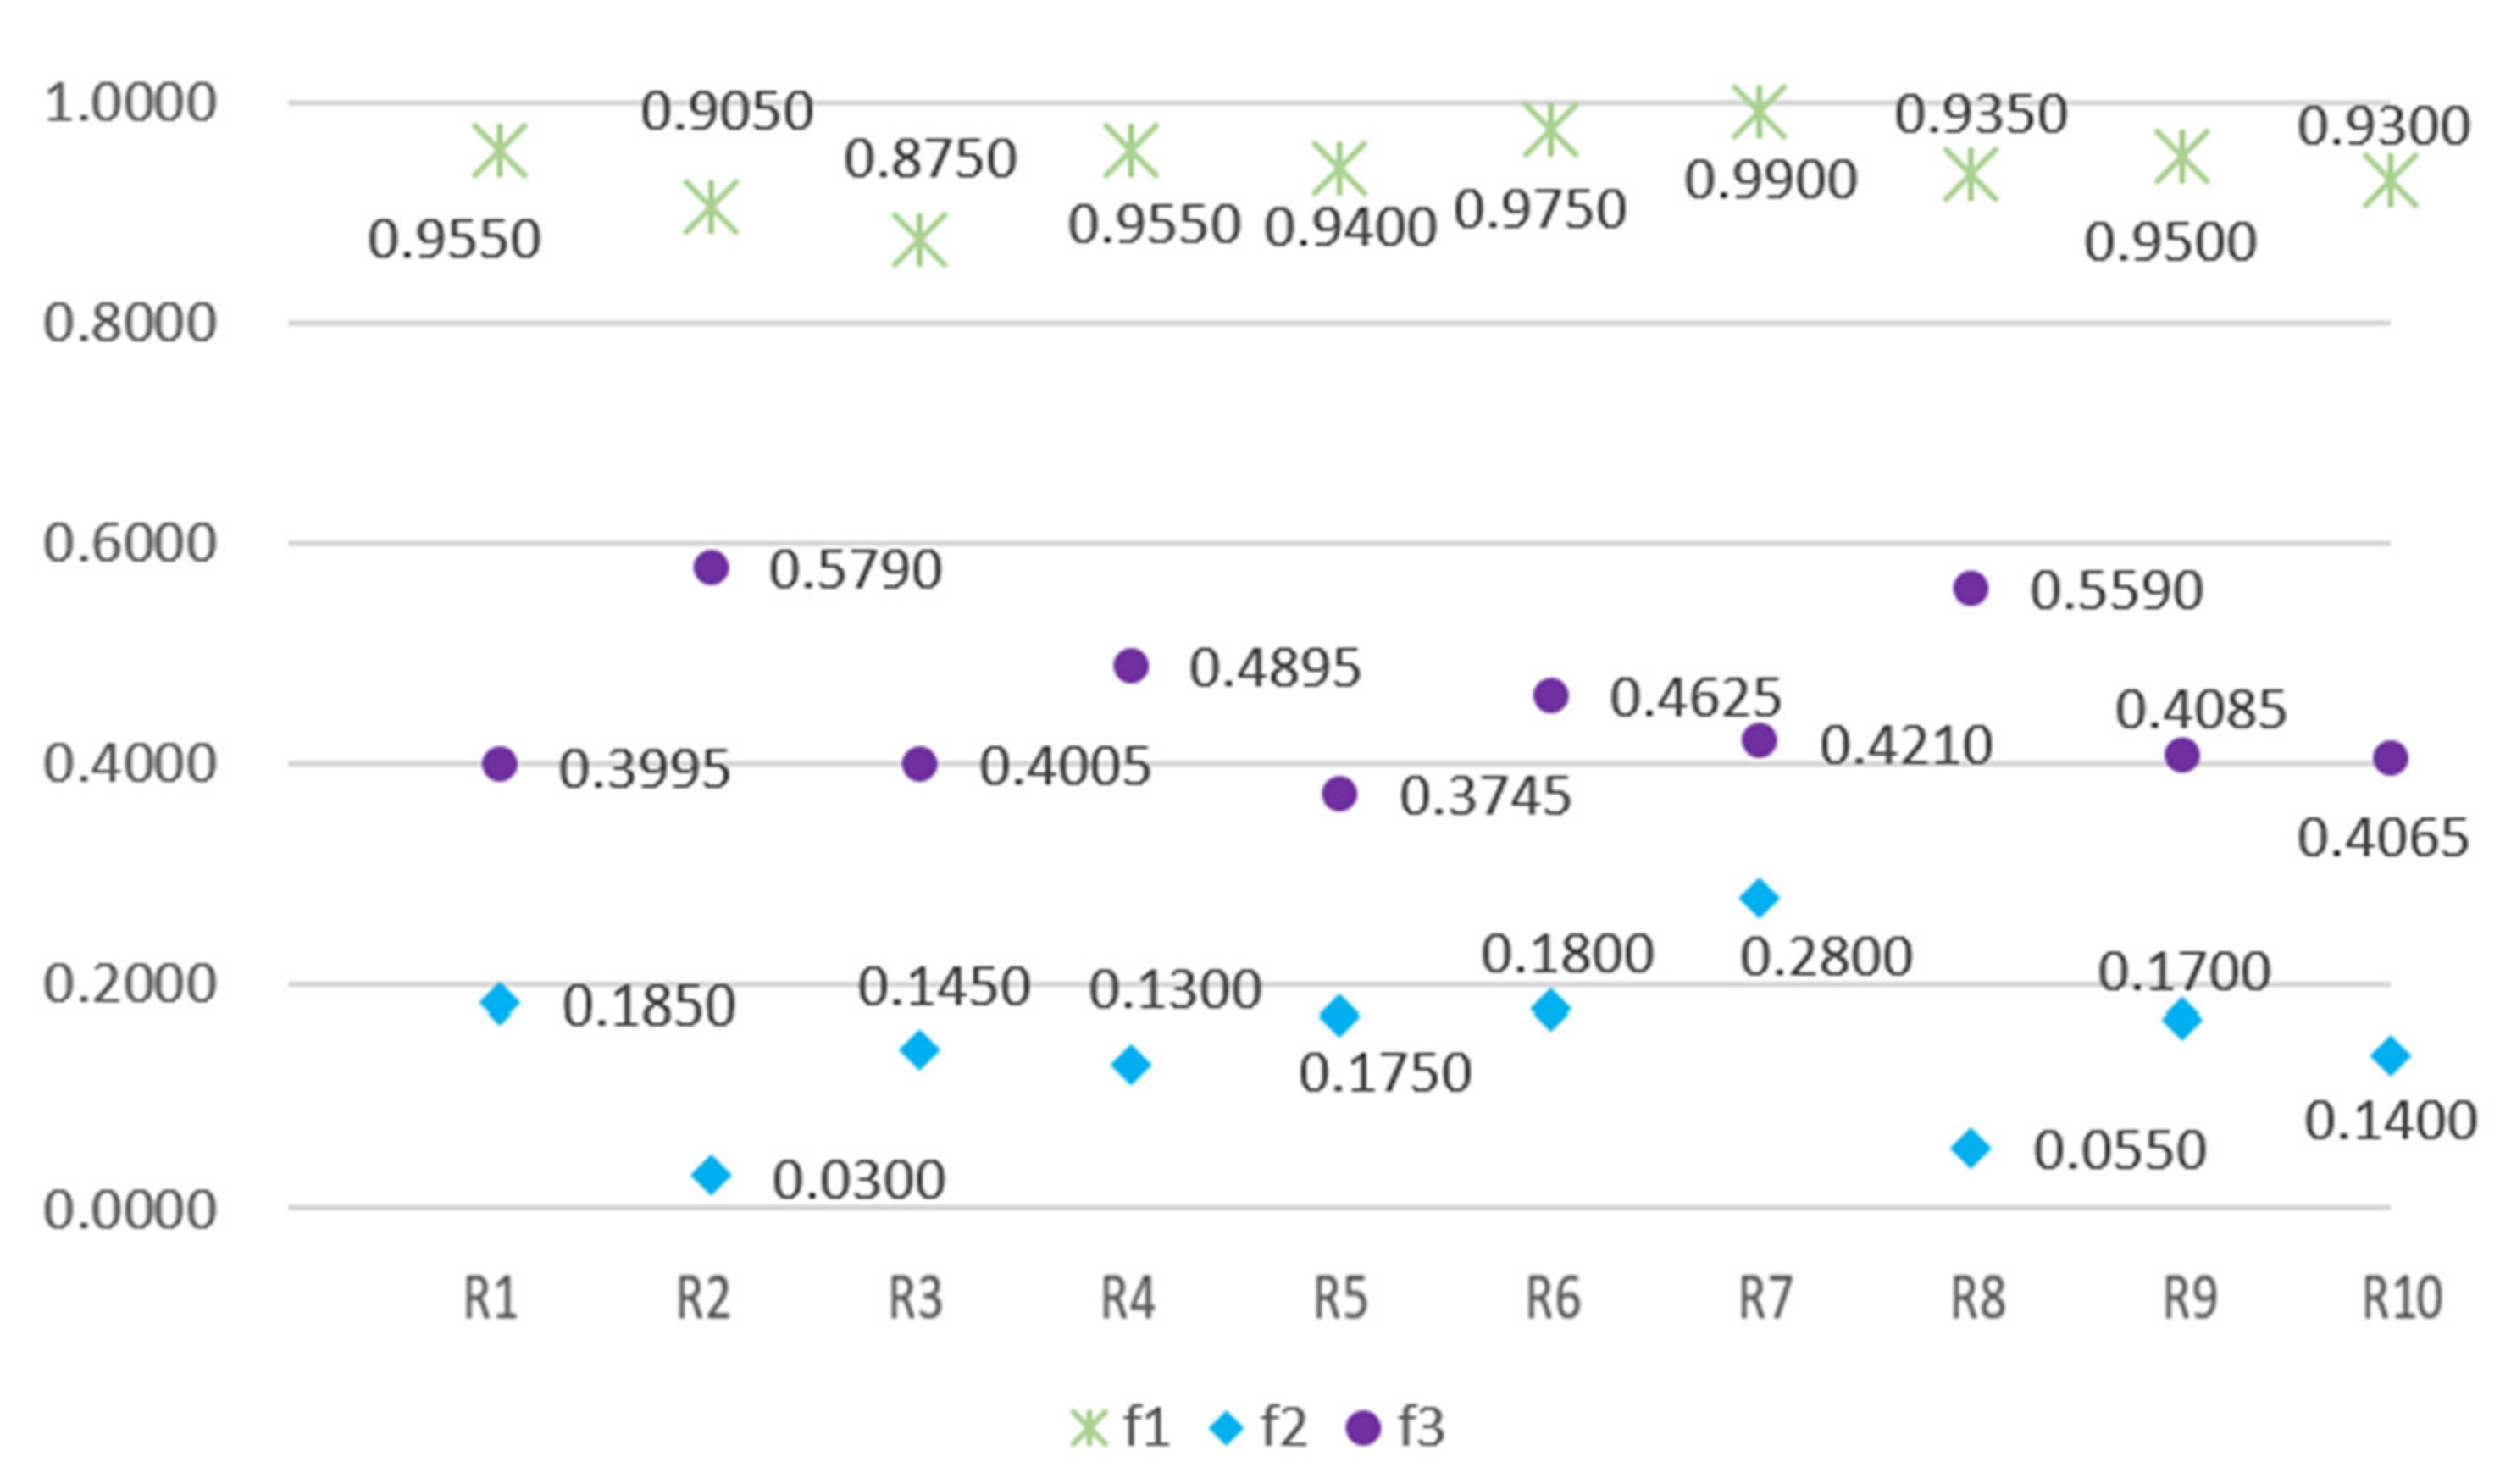
The optimal parameter combination determined using the TA was substituted into NSGA-II to obtain solutions. The solutions obtained using NSGA-II were plotted as three-dimensional coordinates to examine the distributions of the three objective functions. Figure 5 displays the a Pareto optimal solution set obtained after one run of experiment, which indicate that the proposed algorithm generated numerous nondominated solutions for the multiobjective problem. Figure 6 presents the objective function values of 10 reference solutions obtained from the Pareto optimal solution set. The service perimeter and idle capacity of each location corresponding to these 10 optimal solutions are shown in Table 4, which shows that the service areas of every locker facility differ in the 10 feasible solutions. Thus, when maximum coverage, minimum overlap, and minimum total idle capacity are considered as objectives for service area planning, numerous feasible options that cannot substitute for each other are obtained.
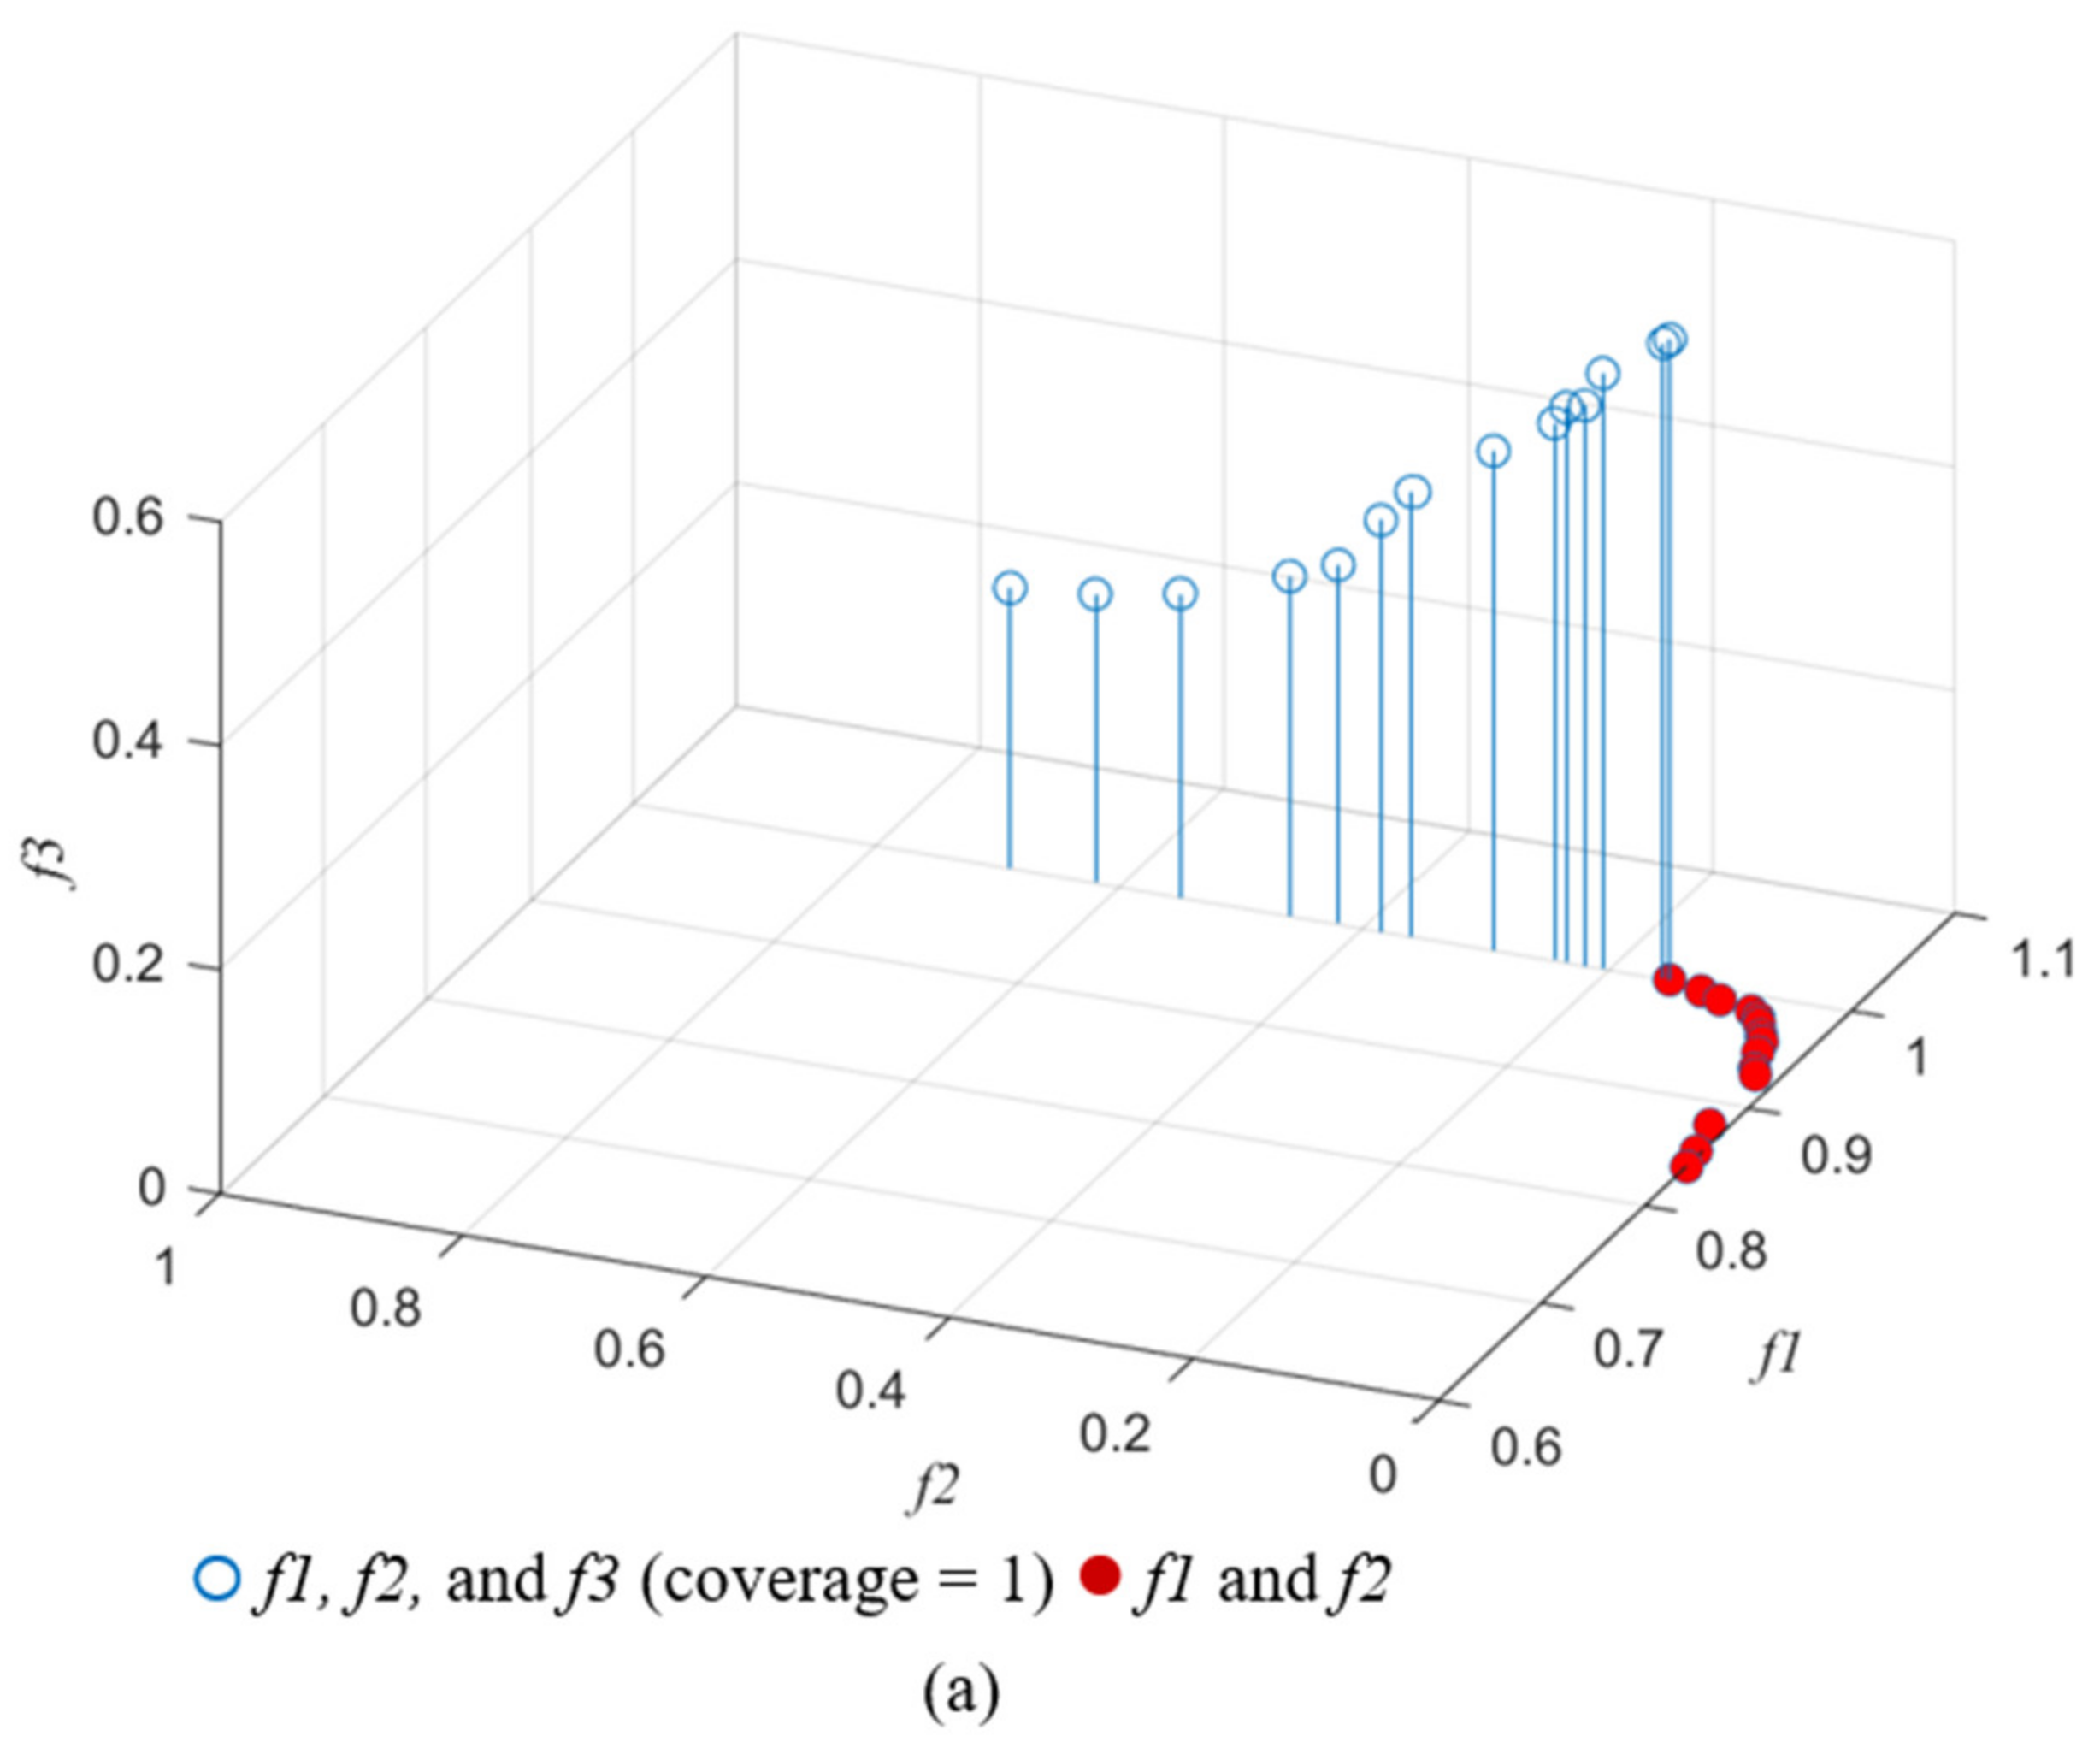
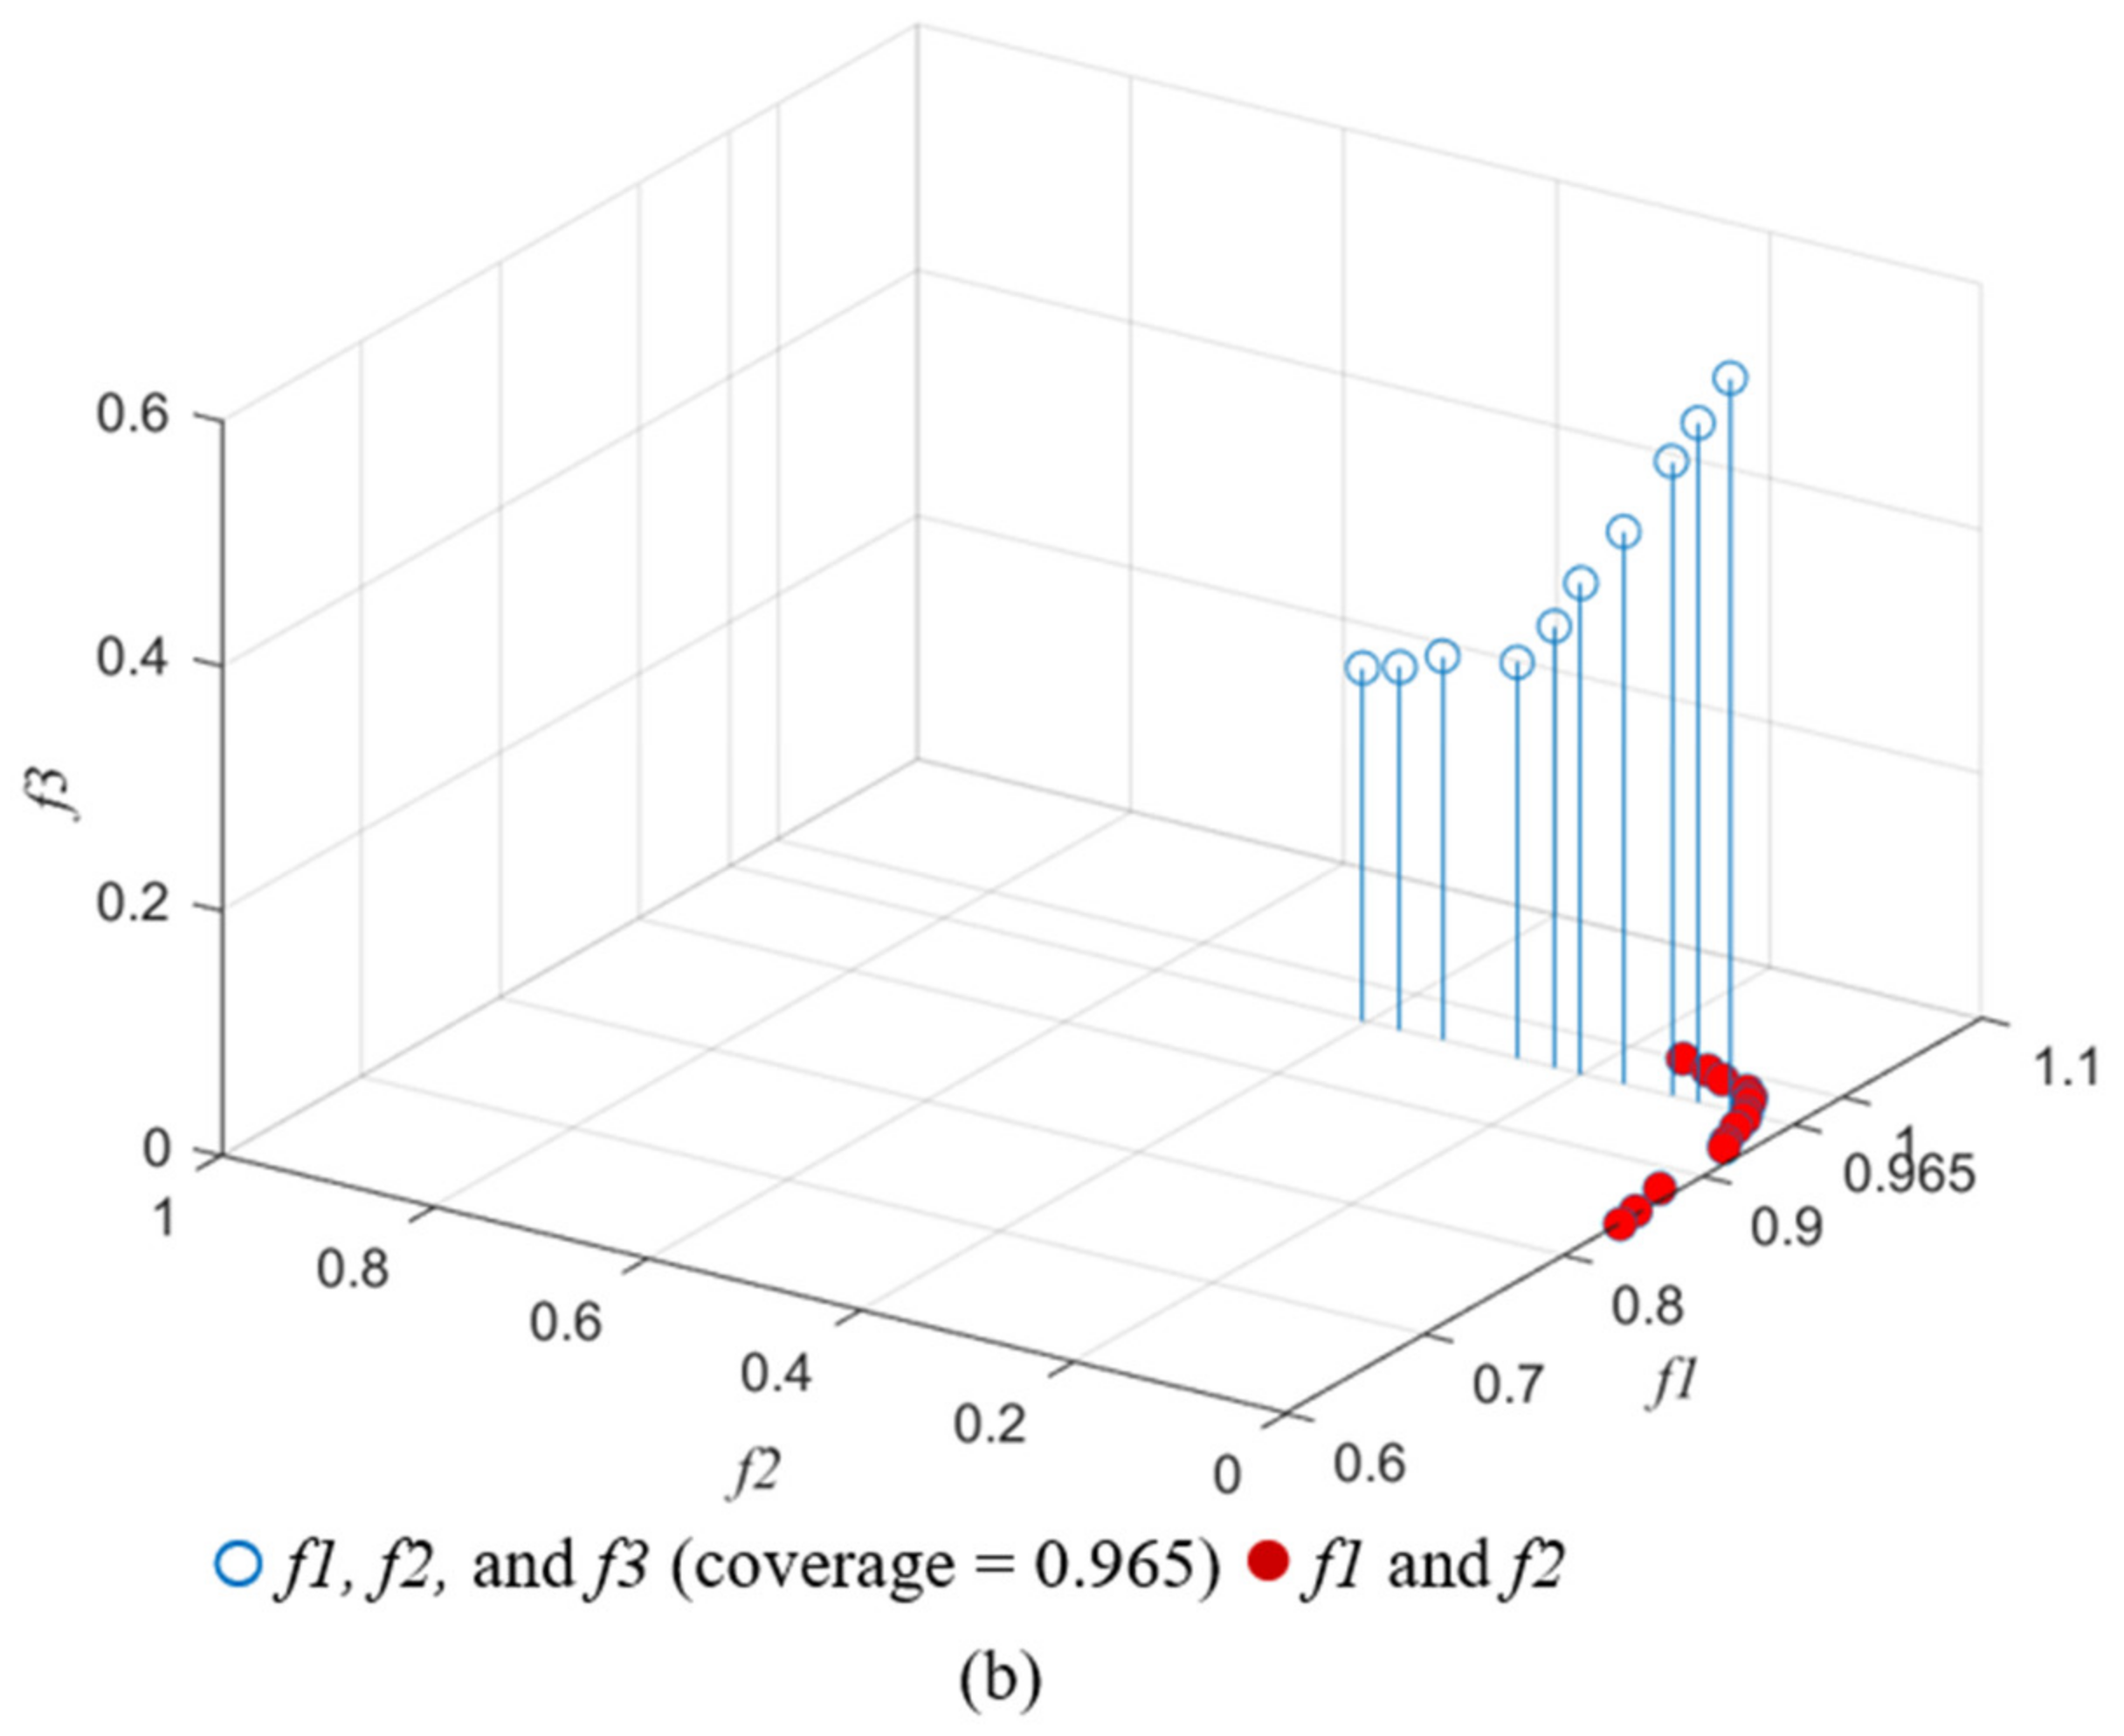
The service areas obtained when considering two of the three objectives, namely maximum coverage and minimum overlap, were compared with those obtained when considering all the three objectives-maximum coverage, minimum overlap, and minimum idle capacity. When only two objectives were considered, overlap increased with coverage, and the overlap value at maximum coverage (1.00) was 0.15, which is equal to the corresponding value obtained when considering three objectives. The fact that when the coverage was the largest, only one optimal solution with an overlap of 0.150 can be obtained in two objectives planning, but multiple reference optimal solutions with different overlaps and idle capacities can be obtained in three objectives planning (Figure 7a). Likewise, when the coverage was 0.965, only one optimal solution with an overlap of 0.045 can be obtained in two objectives planning, but multiple reference optimal solutions with different overlaps and idle capacities can be obtained in three objectives planning (Figure 7b). Thus, the idle capacity of facility affects service area planning results.
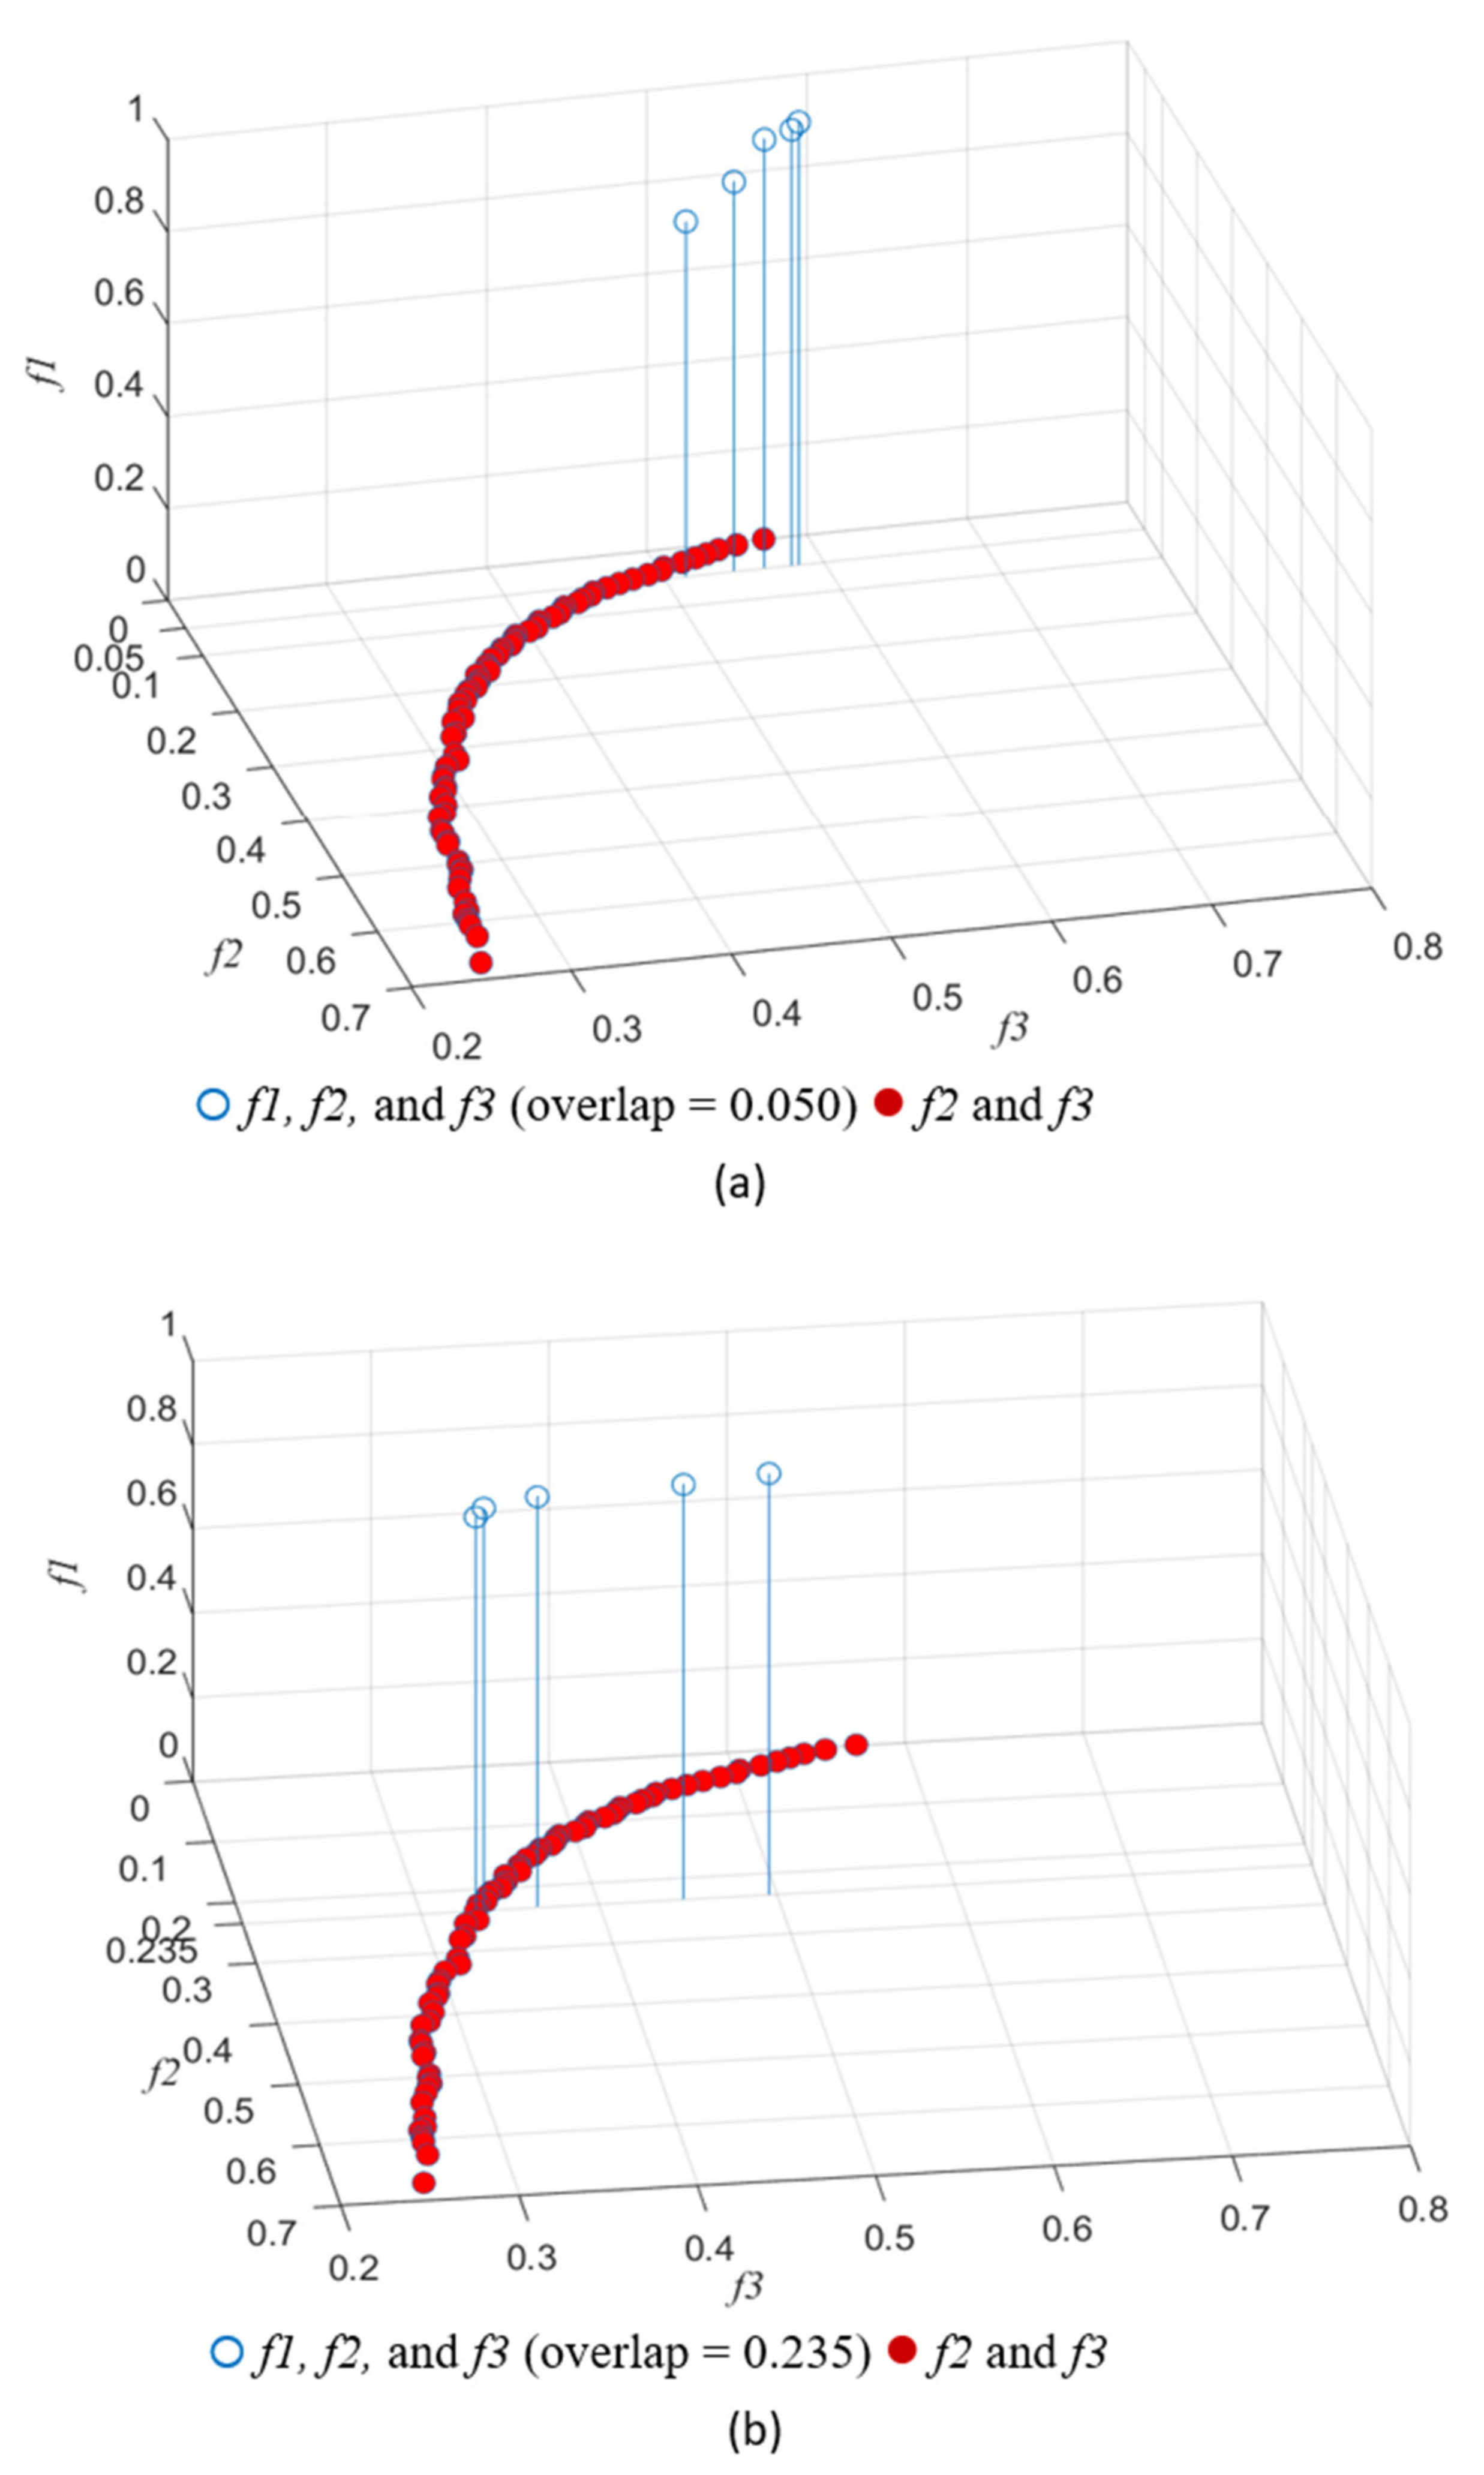
Thus, facility idle capacity affects planning results and should be considered when determining suitable service areas for smart parcel lockers. The service areas obtained when considering the minimum idle capacity and minimum overlap were compared with those obtained when considering all the three objectives. When only two objectives were considered, idle capacity increased with decrease in overlap, and the overlap value at minimum idle capacity (0.25) was 0.67, which is close to the corresponding value 0.690 obtained when considering three objectives. When the overlap value was 0.050, only one optimal solution with an idle capacity of 0.4715 can be obtained with considering two objectives, but five reference optimal solutions with different coverages and idle capacities can be obtained when considering three objectives (Figure 8a). Similarly, when the overlap value was 0.235, only one optimal solution with an idle capacity of 0.331 can be obtained with considering two objectives, but five reference optimal solutions with different coverages and idle capacities can be obtained when considering three objectives (Figure 8b). Thus, facility coverage affects planning results.
When only maximum coverage and minimum idle capacity were considered as objective functions, the optimal solutions were as follows: a maximum coverage of 1 and a minimum idle capacity of 0.250. Thus, optimal idle capacity was obtained at optimal coverage. However, when minimum overlap was considered as an objective function with the aforementioned two objective functions, an increase in coverage did not necessarily result in an decrease in idle capacity. By contrast, it resulted in a increase in idle capacity in some cases (Figure 6). The aforementioned results suggest that facility coverage should not be the only consideration when attempting to increase facility utilization. A more suitable approach is to consider maximum coverage, minimum overlap, and minimum idle capacity altogether as objectives for the aforementioned purpose.
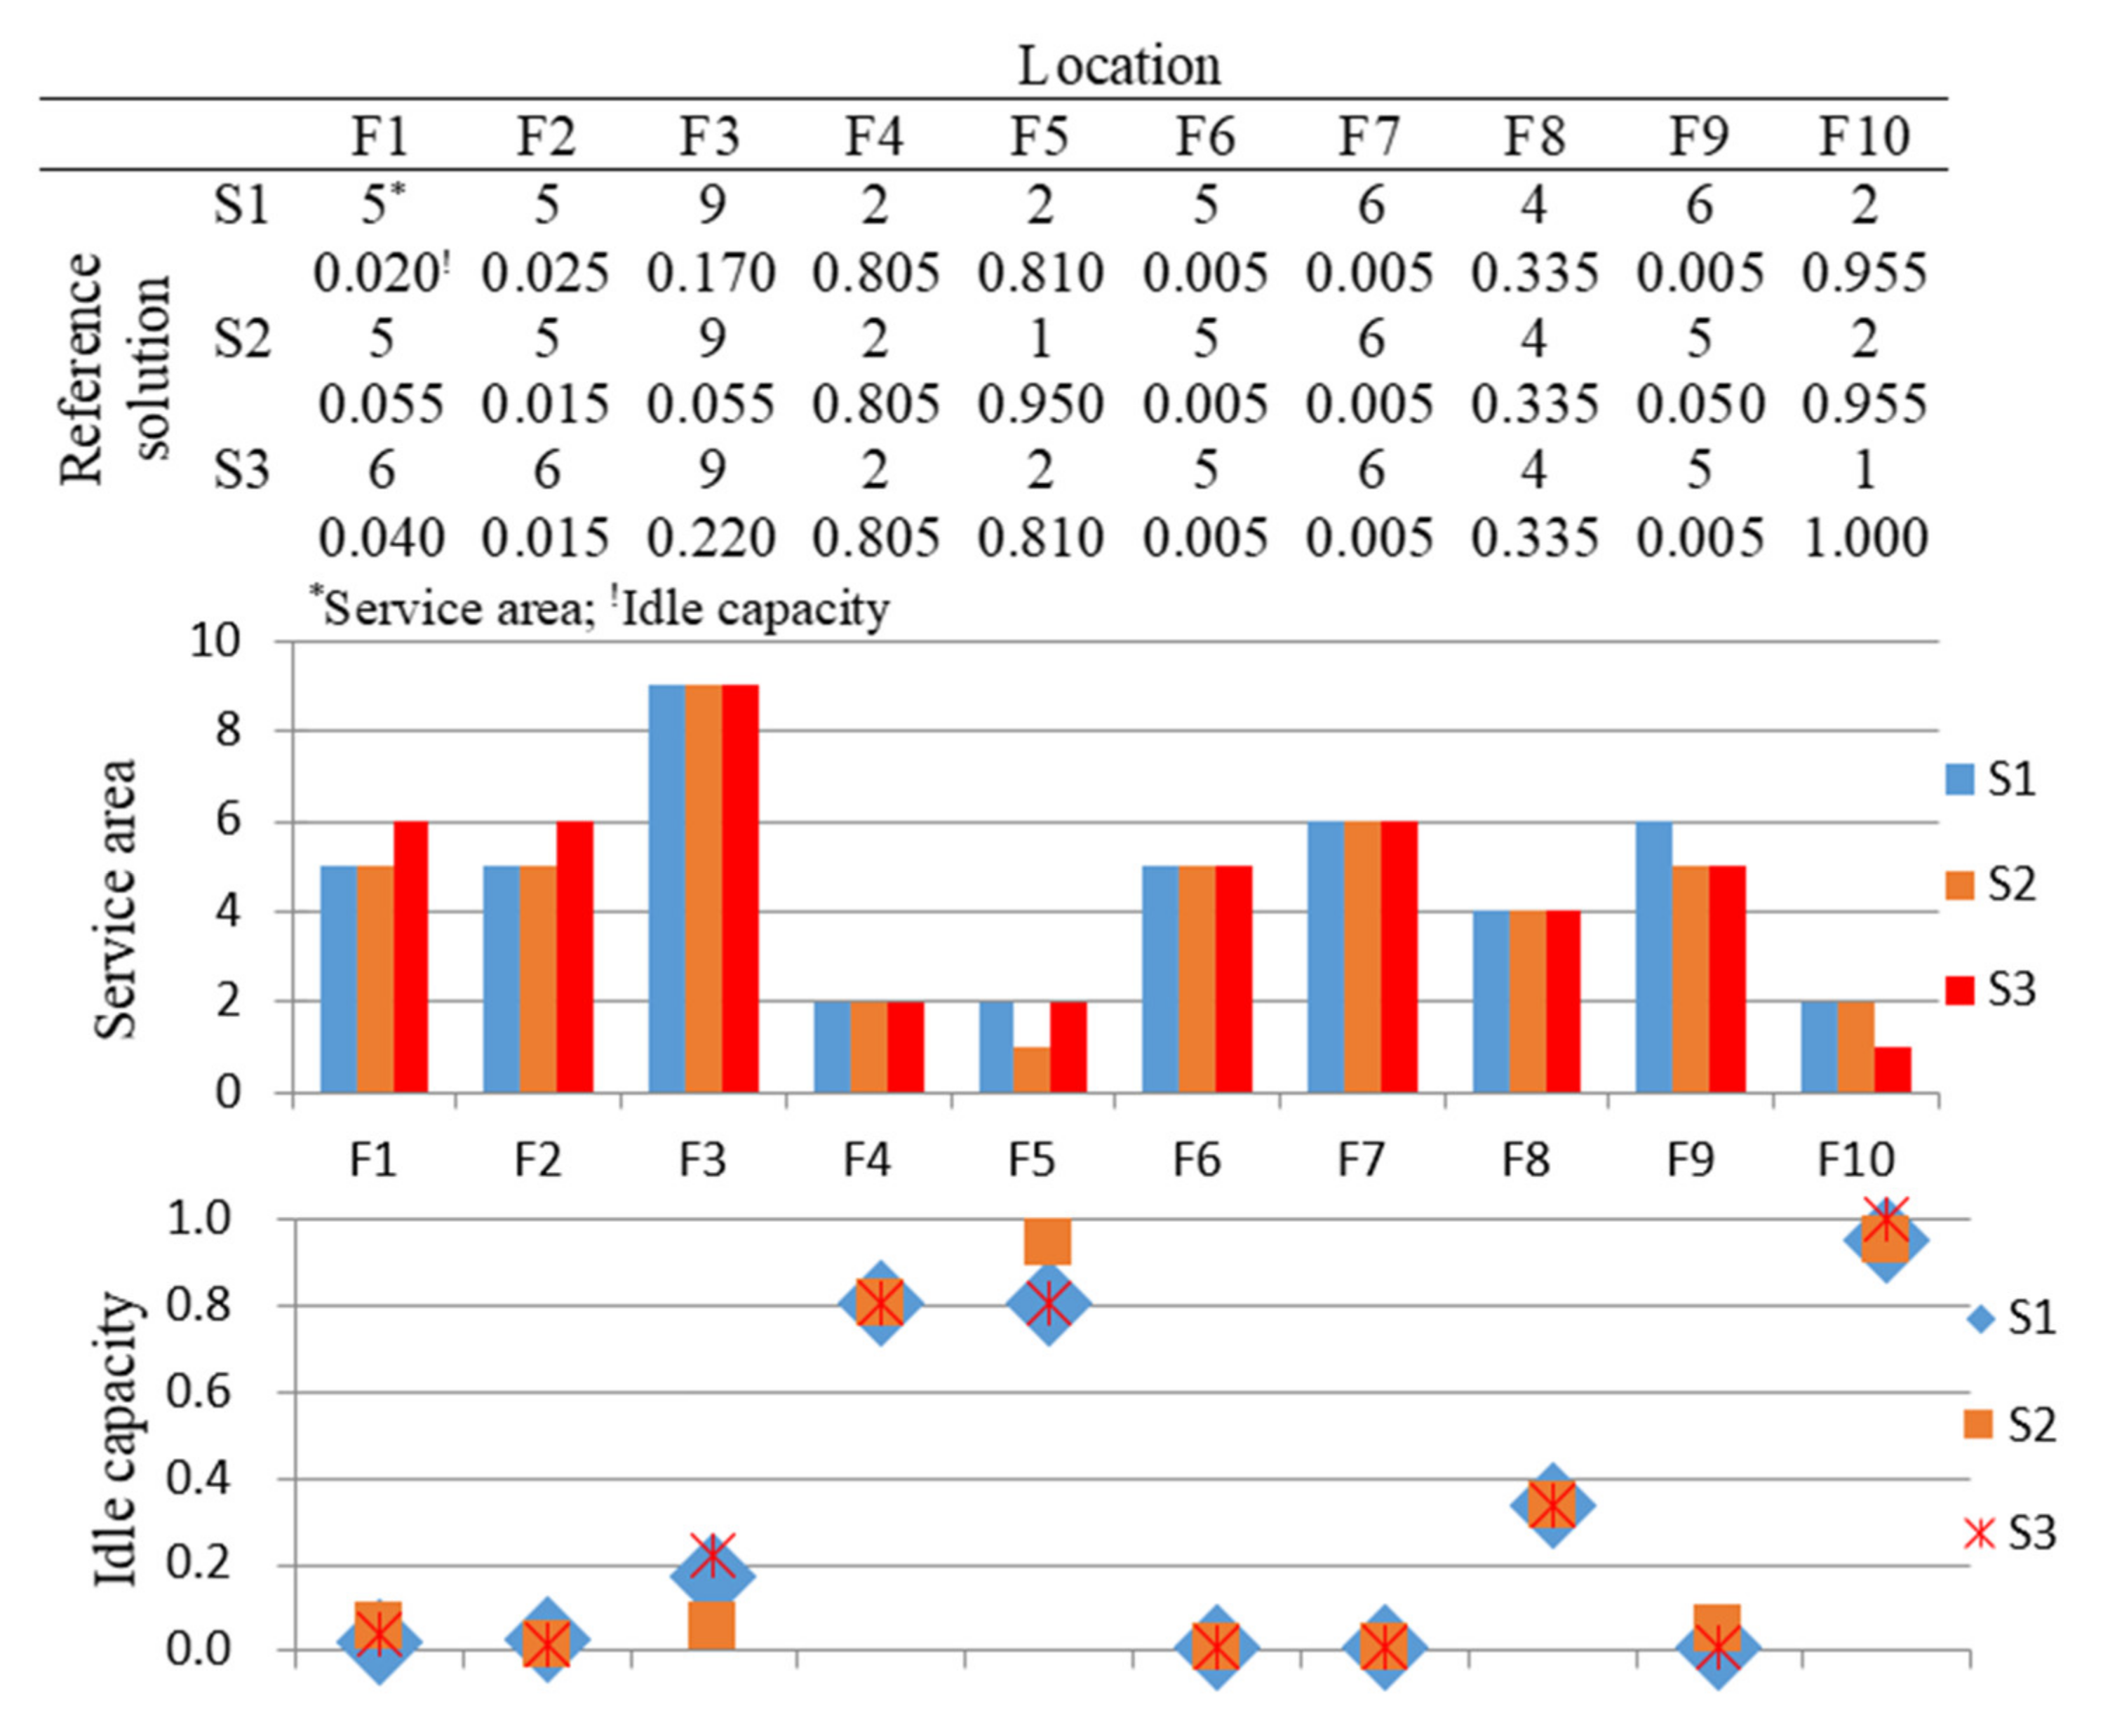
We further examined the operating status of each facility in situations in which the values of one objective function were the same in two reference solutions, whereas those of the other two objective function values were different in these solutions. As presented in Table 5 and Figure 9, the first and second reference solutions (S1 and S2) have the same coverage (0.9650); however, the overlap of S2 is lower by 0.0700 and the total idle capacity of S2 is higher by 0.0095, respectively, than those of S1. This result is obtained mainly because the service areas of F5 and F9 are smaller in S2, which contributes to the higher idle capacity of F1 and F5 and lower idle capacity of F2 and F3. The fact that higher idle capacity and lower overlap are in the S2 than in the S1 suggests that the two solutions do not dominate each other. The first and third reference solutions (S1 and S3) have the same overlap (0.3300); however, S3 has a higher coverage, by 0.0150, and higher idle capacity, by 0.0105, compared with S1. This result is obtained mainly because in S3, the service areas of F9 and F10 are lower, whereas those of F1 and F2 are higher, which leads to the higher idle capacity of F1, F3, and F10 and lower idle capacity of F2. The higher coverage and higher idle capacity of S3 suggests that an increase in coverage may not necessarily result in a decrease in idle capacity. The S1 and S3 do not dominate each other. The second and third reference solutions (S2 and S3) have similar idle capacities; however, if S3 has a higher coverage, by 0.0150, and higher overlap, by 0.0700, than does S2. This result is obtained mainly because in S3, the service areas of F10 is smaller, whereas those of F1, F2, and F5 are larger, which contributes to the higher idle capacity of F3 and F10 and lower idle capacity of F1, F5, and F9. The fact that S3 has both higher coverage and higher overlap than does S2 suggests that the S2 and S3 do not dominate each other. The S3 presented in Figure 8 indicate that F4, F5, and F10 have higher idle capacities mainly because their service areas can be easily covered by other facilities. The idle capacity of F10 is 1.000 in S3, which indicates that its service areas considerably overlap with those of the other facilities, which causes it to be underused. In such a situation, the operator should shut down underused facilities to reduce resource losses.

6. Conclusions and Suggestions

Some studies investigated the use of smart parcel lockers in improving problems related to logistics last mile delivery, such as excessive costs and low efficiency. The locations of smart parcel lockers are a key factor affecting logistics last mile delivery. To facilitate rapid decision making related to locker service area, the present study considered the location of smart parcel lockers as a multiobjective optimization problem with three optimization objectives, namely maximum coverage, minimum overlap, and minimum total idle capacity. A composite TA-NSGA-II approach is proposed for multiobjective service area optimization with constraints on facility capacities. This approach can generate multiple combinations of near-optimal feasible solutions, and these solutions do not dominate each other. Moreover, combinations of superior and relatively poor solutions can be identified for a specific objective function. Thus, decision makers can plan their facility service areas according to specific objectives. This study also compared the results of planning based on two objectives with those of planning based on three objectives and found that the inclusion of the aforementioned three objectives is reasonable and essential. The proposed solving methodology helps effectively solve the problem of the location service areas planning of smart parcel locker facilities. However, it may not be used to solve the more complex problems of the location service areas planning. For instance, the proposed methodology cannot figure out quality results in the location service areas planning with taking into account the uncertain consumer demand, elastic weighted objectives, and damaged facilities. This study highlighted certain aspects that merit further investigation. Accordingly, it proposes the suggestions described in the following text. First, decision makers can assign suitable weights to various objectives so that the results of multiobjective service area optimization are more practical and the decision-making process is more flexible. Second, a minimum utilization level should be established for each facility to prevent resources from being underused.

Author Contributions

Conceptualization, Z.-H.C. and T.-A.C.; methodology, Z.-H.C. and T.-A.C.; software, Z.-H.C. and Y.-J.L.; validation, Z.-H.C., T.-A.C. and Y.-J.L.; formal analysis, Z.-H.C., T.-A.C. and Y.-J.L.; investigation, Z.-H.C. and Y.-J.L.; resources, Z.-H.C. and Y.-J.L.; data curation, Z.-H.C. and Y.-J.L.; writing—original draft preparation, Z.-H.C., T.-A.C. and Y.-J.L.; writing—review and editing, Z.-H.C. and T.-A.C.; visualization, Z.-H.C. and T.-A.C.; supervision, Z.-H.C.; project administration, Z.-H.C.; funding acquisition, Z.-H.C. All authors have read and agreed to the published version of the manuscript.

Funding

This work is supported by the Ministry of Science and Technology of Taiwan (MOST 109-2221-E-027-077 and MOST 110-2221-E-027-111).

Institutional Review Board Statement

Not applicable.

Informed Consent Statement

Not applicable.

Data Availability Statement

Not applicable.

Conflicts of Interest

The authors declare no conflict of interest.

References

  1. Chevalier, S. Global Retail e-Commerce Sales 2014–2024, Statista. 2021. Available online: https://www.statista.com/statistics/379046/worldwide-retail-e-commerce-sales/ (accessed on 8 August 2021).
  2. Goodman, R.W. Whatever you call it, just don’t think of last-mile logistics, last. Glob. Logist. Supply Chain. Strateg. 2005, 11, 46–51. [Google Scholar]
  3. Gevaers, R.; Van de Voorde, E.; Vanelslander, T. Characteristics and typology of last-mile logistics from an innovation perspective in an urban context. In Proceedings of the Transportation Research Board 90th Annual Meeting, Washington, DC, USA, 23–27 January 2011; pp. 2–14. [Google Scholar]
  4. Caceres-Cruz, J.; Arias, P.; Guimarans, D.; Riera, D.; Juan, A.A. Rich vehicle routing problem: Survey. ACM Comput. Surv. 2015, 47, 1–28. [Google Scholar] [CrossRef]
  5. Vidal, T.; Crainic, T.G.; Gendreau, M.; Prins, C. Heuristics for multi-attribute vehicle routing problems: A survey and synthesis. Eur. J. Oper. Res. 2013, 231, 1–21. [Google Scholar] [CrossRef]
  6. Toth, P.; Vigo, D. Vehicle Routing: Problems, Methods, and Applications, 2nd ed.; Society for Industrial and Applied Mathematics: Philadelphia, PA, USA, 2015. [Google Scholar]
  7. Crainic, T.G.; Laporte, G. Fleet Management and Logistics; Springer: Boston, MA, USA, 1998. [Google Scholar]
  8. Anderluh, A.; Hemmelmayr, V.C.; Nolz, P.C. Synchronizing vans and cargo bikes in a city distribution network. Cent. Eur. J. Oper. Res. 2017, 25, 345–376. [Google Scholar] [CrossRef] [Green Version]
  9. Klumpp, M.; Witte, C.; Zelewski, S. Information and process requirements for electric mobility in last-mile-logistics. In Proceedings of the Sixth International Conference on Information Technologies in Environmental Engineering (ITEE2013), Lüneburg, Germany, 10–12 July 2013. [Google Scholar]
  10. Chong, Z.J.; Qin, B.; Bandyopadhyay, T.; Wongpiromsarn, T.; Rankin, E.S.; Ang, M.H.; Frazzoli, E.; Rus, D.; Hsu, D.; Low, K.H. Autonomous personal vehicle for the first-and last-mile transportation services. In Proceedings of the 2011 IEEE 5th International Conference on Cybernetics and Intelligent Systems (CIS), Qingdao, China, 17–19 September 2011; pp. 253–260. [Google Scholar]
  11. Perboli, G.; Rosano, M. Parcel delivery in urban areas: Opportunities and threats for the mix of traditional and green business models. Transp. Res. Part C Emerg. Technol. 2019, 99, 19–36. [Google Scholar] [CrossRef]
  12. Lee, H.L.; Chen, Y.; Gillai, B.; Rammohan, S. Technological Disruption and Innovation in Last-Mile Delivery; Stanford Graduate School of Business: Stanford, CA, USA, 2016. [Google Scholar]
  13. Brown, J.R.; Guiffrida, A.L. Carbon emissions comparison of last mile eelivery versus customer pickup. Int. J. Logist. Res. Appl. 2014, 17, 503–521. [Google Scholar] [CrossRef]
  14. Edwards, J.B.; McKinnon, A.C.; Cullinane, S.L. Comparative analysis of the carbon footprints of conventional and online retailing: A ‘last mile’ perspective. Int. J. Phys. Distrib. Logist. Manag. 2010, 40, 103–123. [Google Scholar] [CrossRef]
  15. Montreuil, B.; Meller, R.D.; Ballot, E. Towards a physical internet: The impact on logistics facilities and material handling systems design and innovation. In Proceedings of the 11th International Material Handling Research Colloquium, Milwaukee, WI, USA, 21–25 June 2010. [Google Scholar]
  16. Fazili, M.; Venkatadri, U.; Cyrus, P.; Tajbakhsh, M. Physical internet, conventional and hybrid logistic systems: A routing optimisation-based comparison using the eastern Canada road network case study. Int. J. Prod. Res. 2017, 55, 2703–2730. [Google Scholar] [CrossRef]
  17. Faugere, L.; Montreuil, B. Hyperconnected Pickup & Delivery Locker Networks. In Proceedings of the 4th International Physical Internet Conference, Graz, Austria, 4–6 July 2017. [Google Scholar]
  18. Lemke, J.; Iwan, S.; Korczak, J. Usability of the parcel lockers from the customer perspective: The research in Polish cities. Transp. Res. Procedia 2016, 16, 272–287. [Google Scholar] [CrossRef] [Green Version]
  19. Cheng, X.; Liao, S.; Hua, Z. A policy of picking up parcels for express courier service in dynamic environments. Int. J. Prod. Res. 2017, 55, 2470–2488. [Google Scholar] [CrossRef]
  20. Houlihan, J.B. International supply chain management. Int. J. Phys. Distrib. Logist. Manag. 1985, 15, 22–38. [Google Scholar]
  21. Christopher, M. Logistics and Supply Chain Management: Strategies for Reducing Costs and Improving Services, 4th ed.; Financial Times/Pitman: London, UK, 2011. [Google Scholar]
  22. Beamon, B.M. Supply chain design and analysis: Models and methods. Int. J. Prod. Econ. 1998, 55, 281–294. [Google Scholar] [CrossRef]
  23. Ellram, L. Supply-chain management: The industrial organisation perspective. Int. J. Phys. Distrib. Logist. Manag. 1991, 21, 13–22. [Google Scholar] [CrossRef]
  24. Lambert, D.M.; Cooper, M.C. Issues in supply chain management. Ind. Mark. Manag. 2000, 29, 65–83. [Google Scholar] [CrossRef]
  25. Heinemann, G.; Schwarzl, C. New Online Retailing—Innovation and Transformation; Gabler Verlag: Fairford, UK, 2010. [Google Scholar]
  26. Kull, T.J.; Boyer, K.; Calantone, R. Last-mile supply chain efficiency: An analysis of learning curves in online ordering. Int. J. Oper. Prod. Manag. 2007, 27, 409–434. [Google Scholar] [CrossRef] [Green Version]
  27. Maulana, S.M.; Susilo, H.; Susilo, H. Implementasi e-commerce sebagai media penjualan online (studi kasus pada toko pastbrik kota malang). J. Adm. Bisnis 2015, 29, 1–9. [Google Scholar]
  28. Turban, E.; King, D.; Viehland, D.; Lee, J.K. Electronic Commerce 2006: A Managerial Perspective; Bergen: Upper Saddle River, NJ, USA, 2006. [Google Scholar]
  29. Chiu, C.M.; Wang, E.T.; Fang, Y.H.; Huang, H.Y. Understanding customers’ repeat purchase intentions in B2C e-commerce: The roles of utilitarian value, hedonic value and perceived risk. Inf. Syst. J. 2014, 24, 85–114. [Google Scholar] [CrossRef]
  30. Agatz, N.A.; Fleischmann, M.; Van Nunen, J.A. E-fulfillment and multi-channel distribution—A review. Eur. J. Oper. Res. 2008, 187, 339–356. [Google Scholar] [CrossRef] [Green Version]
  31. Visser, J.; Nemoto, T.; Browne, M. Home delivery and the impacts on urban freight transport: A review. Procedia Soc. Behav. Sci. 2014, 125, 15–27. [Google Scholar] [CrossRef] [Green Version]
  32. Boyer, K.K.; Prud’homme, A.M.; Chung, W. The last-mile challenge: Evaluating the effects of customer density and delivery window patterns. J. Bus. Logist. 2009, 30, 185–201. [Google Scholar] [CrossRef]
  33. de Souza, R.; Goh, M.; Lau, H.C.; Ng, W.S.; Tan, P.S. Collaborative urban logistics–synchronizing the last mile a Singapore research perspective. Procedia Soc. Behav. Sci. 2014, 125, 422–431. [Google Scholar] [CrossRef] [Green Version]
  34. Moroz, M.; Polkowski, Z. The last mile issue and urban logistics: Choosing parcel machines in the context of the ecological attitudes of the Y generation consumers purchasing online. Transp. Res. Procedia 2016, 16, 378–393. [Google Scholar] [CrossRef] [Green Version]
  35. Hotelling, H. Stability in Competition. Econ. J. 1929, 39, 41–57. [Google Scholar] [CrossRef]
  36. Owen, S.H.; Daskin, M.S. Strategic facility location: A review. Eur. J. Oper. Res. 1998, 111, 423–447. [Google Scholar] [CrossRef]
  37. Hakimi, S.L. Optimum locations of switching centers and the absolute centers and medians of a graph. Oper. Res. 1964, 12, 450–459. [Google Scholar] [CrossRef]
  38. ReVelle, C.S.; Swain, R.W. Central facilities location. Geogr. Anal. 1970, 2, 30–42. [Google Scholar] [CrossRef]
  39. Ghoseiri, K.; Ghannadpour, S. Solving capacitated p-median problem using genetic algorithm. In Proceedings of the 2007 IEEE International Conference on Industrial Engineering and Engineering Management, Singapore, 2–4 December 2007; pp. 885–889. [Google Scholar]
  40. Drezner, Z.; Brimberg, J.; Mladenović, N.; Salhi, S. New heuristic algorithms for solving the planar p-median problem. Comput. Oper. Res. 2015, 62, 296–304. [Google Scholar] [CrossRef]
  41. Griffith, D.A.; Paelinck, J.H.P. Spatial Autocorrelation and the p-Median Problem. In Morphisms for Quantitative Spatial Analysis; Springer: Cham, Switzerland, 2018; pp. 9–24. [Google Scholar]
  42. Daskin, M. Network and Discrete Location; Wiley: New York, NY, USA, 1995. [Google Scholar]
  43. Davidović, T.; Ramljak, D.; Šelmić, M.; Teodorović, D. Bee colony optimization for the p-center problem. Comput. Oper. Res. 2011, 38, 1367–1376. [Google Scholar] [CrossRef]
  44. Martínez-Merino, L.I.; Albareda-Sambola, M.; Rodríguez-Chía, A.M. The probabilistic p-center problem: Planning service for potential customers. Eur. J. Oper. Res. 2017, 262, 509–520. [Google Scholar] [CrossRef] [Green Version]
  45. Toregas, C.; Swain, R.; ReVelle, C.; Bergman, L. The location of emergency service facilities. Oper. Res. 1971, 19, 1363–1373. [Google Scholar] [CrossRef]
  46. Rajagopalan, H.K.; Saydam, C.; Xiao, J. A multiperiod set covering location model for dynamic redeployment of ambulances. Comput. Oper. Res. 2008, 35, 814–826. [Google Scholar] [CrossRef]
  47. Ghaderi, A.; Jabalameli, M.S. Modeling the budget-constrained dynamic uncapacitated facility location–network design problem and solving it via two efficient heuristics: A case study of health care. Math. Comput. Model. 2013, 57, 382–400. [Google Scholar] [CrossRef]
  48. Church, R.; ReVelle, C. The maximal covering location problem. Pap. Reg. Sci. Assoc. 1974, 32, 101–118. [Google Scholar] [CrossRef]
  49. ReVelle, C.; Scholssberg, M.; Williams, J. Solving the maximal covering location problem with heuristic concentration. Comput. Oper. Res. 2008, 35, 427–435. [Google Scholar] [CrossRef]
  50. Holland, J.H. Adaptation in Natural and Artificial Systems: An Introductory Analysis with Applications to Biology, Control, and Artificial Intelligence; MIT Press: Cambridge, MA, USA, 1975. [Google Scholar]
  51. Fonseca, C.M.; Fleming, P.J. Genetic algorithms for multiobjective Optimization: Formulation, discussion and generalization. In Proceedings of the Fifth International Conference on Genetic Algorithms, Morgan Kaufmann, San Mateo, CA, USA, 1 June 1993; pp. 416–423. [Google Scholar]
  52. Srinivas, N.; Deb, K. Multiobjective optimization using nondominated sorting in genetic algorithms. Evol. Comput. 1994, 2, 221–248. [Google Scholar] [CrossRef]
  53. Deb, K.; Pratap, A.; Agarwal, S.; Meyarivan, T. A fast and elitist multiobjective genetic algorithm: NSGA-II. IEEE Trans. Evol. Comput. 2002, 6, 182–197. [Google Scholar] [CrossRef] [Green Version]
  54. Mansouri, S.A. A multi-objective genetic algorithm for mixed-model sequencing on JIT assembly lines. Eur. J. Oper. Res. 2005, 167, 696–716. [Google Scholar] [CrossRef]
  55. Murugan, P.; Kannan, S.; Baskar, S. NSGA-II algorithm for multi-objective generation expansion planning problem. Electr. Power Syst. Res. 2009, 79, 622–628. [Google Scholar] [CrossRef]
  56. Berning, G.; Brandenburg, M.; Gürsoy, K.; Mehta, V.; Tölle, F.J. An integrated system solution for supply chain optimization in the chemical process industry. OR Spectr. 2002, 24, 371–401. [Google Scholar] [CrossRef]
  57. Li, Z.; Liao, H.; Coit, D.W. A two-stage approach for multi-objective decision making with applications to system reliability optimization. Reliab. Eng. Syst. Saf. 2009, 94, 1585–1592. [Google Scholar] [CrossRef]
  58. Wang, H.F.; Hsu, H.W. A closed-loop logistic model with a spanning-tree based genetic algorithm. Comput. Oper. Res. 2010, 37, 376–389. [Google Scholar] [CrossRef]
  59. Pishvaee, M.S.; Farahani, R.Z.; Dullaert, W. A memetic algorithm for bi-objective integrated forward/reverse logistics network design. Comput. Oper. Res. 2010, 37, 1100–1112. [Google Scholar] [CrossRef]
  60. Camara, M.V.O.; Ribeiro, G.M.; Tosta, M.d.C.R. A pareto optimal study for the multi-objective oil platform location problem with NSGA-II. J. Pet. Sci. Eng. 2018, 169, 258–268. [Google Scholar] [CrossRef]
  61. Babazadeh, H.; Alavidoost, M.H.; Zarandi, M.F.; Sayyari, S.T. An enhanced NSGA-II algorithm for fuzzy bi-objective assembly line balancing problems. Comput. Ind. Eng. 2018, 123, 189–208. [Google Scholar] [CrossRef]
  62. Zhang, J.; Xing, L.; Peng, G.; Yao, F.; Chen, C. A large-scale multiobjective satellite data transmission scheduling algorithm based on SVM+NSGA-II. Swarm Evol. Comput. 2019, 50, 100560. [Google Scholar] [CrossRef]
  63. Wang, S.; Zhao, D.; Yuan, J.; Li, H.; Gao, Y. Application of NSGA-II algorithm for fault diagnosis in power system. Electr. Power Syst. Res. 2019, 175, 105893. [Google Scholar] [CrossRef]
  64. Bai, X.; Chin, K.S.; Zhou, Z. A bi-objective model for location planning of electric vehicle charging stations with GPS trajectory data. Comput. Ind. Eng. 2019, 128, 591–604. [Google Scholar] [CrossRef]
  65. Wang, S.; Ma, S. Efficient methods for a bi-objective nursing home location and allocation problem: A case study. Appl. Soft Comput. 2018, 65, 280–291. [Google Scholar] [CrossRef]
  66. Zitzler, E.; Laumanns, M.; Thiele, L. SPEA2: Improving the strength pareto evolutionary algorithm. In Proceedings of the EUROGEN 2001, Evolutionary Methods for Design, Optimization and Control with Applications to Industrial Problems, Athens, Greece, 19–21 September 2002; pp. 95–100. [Google Scholar]
  67. Rahimi-Vahed, A.R.; Mirghorbani, S.M.; Rabbani, M. A new particle swarm algorithm for a multi-objective mixed-model assembly line sequencing problem. Soft Comput. 2007, 11, 997–1012. [Google Scholar] [CrossRef]
  68. Farsangi, M.M.; Nezamabadi-Pour, H.; Lee, K.Y. Multi-objective VAr planning with SVC for a large power system using PSO and GA. In Proceedings of the 2006 IEEE PES Power Systems Conference and Exposition, Atlanta, GA, USA, 5 February 2002; pp. 274–279. [Google Scholar]
  69. Rojas, I.; Gonzalez, J.; Pomares, H.; Merelo, J.J.; Castillo, P.A.; Romero, G. Statistical analysis of the main parameters involved in the design of a genetic algorithm. IEEE Trans. Syst. Man Cybern. Syst. 2002, 32, 31–37. [Google Scholar] [CrossRef] [Green Version]
  70. Su, P.L.; Chen, Y.S. Implementation of a genetic algorithm on MD-optimal designs for multivariate response surface models. Expert Syst. Appl. 2012, 39, 3207–3212. [Google Scholar] [CrossRef]
  71. Ghezavati, V.; Hosseinifar, P. Application of efficient metaheuristics to solve a new bi-objective optimization model for hub facility location problem considering value at risk criterion. Soft Comput. 2018, 22, 195–212. [Google Scholar] [CrossRef]
  72. Rayat, F.; Musavi, M.; Bozorgi-Amiri, A. Bi-objective reliable location-inventory-routing problem with partial backordering under disruption risks: A modified AMOSA approach. Appl. Soft Comput. 2017, 59, 622–643. [Google Scholar] [CrossRef]
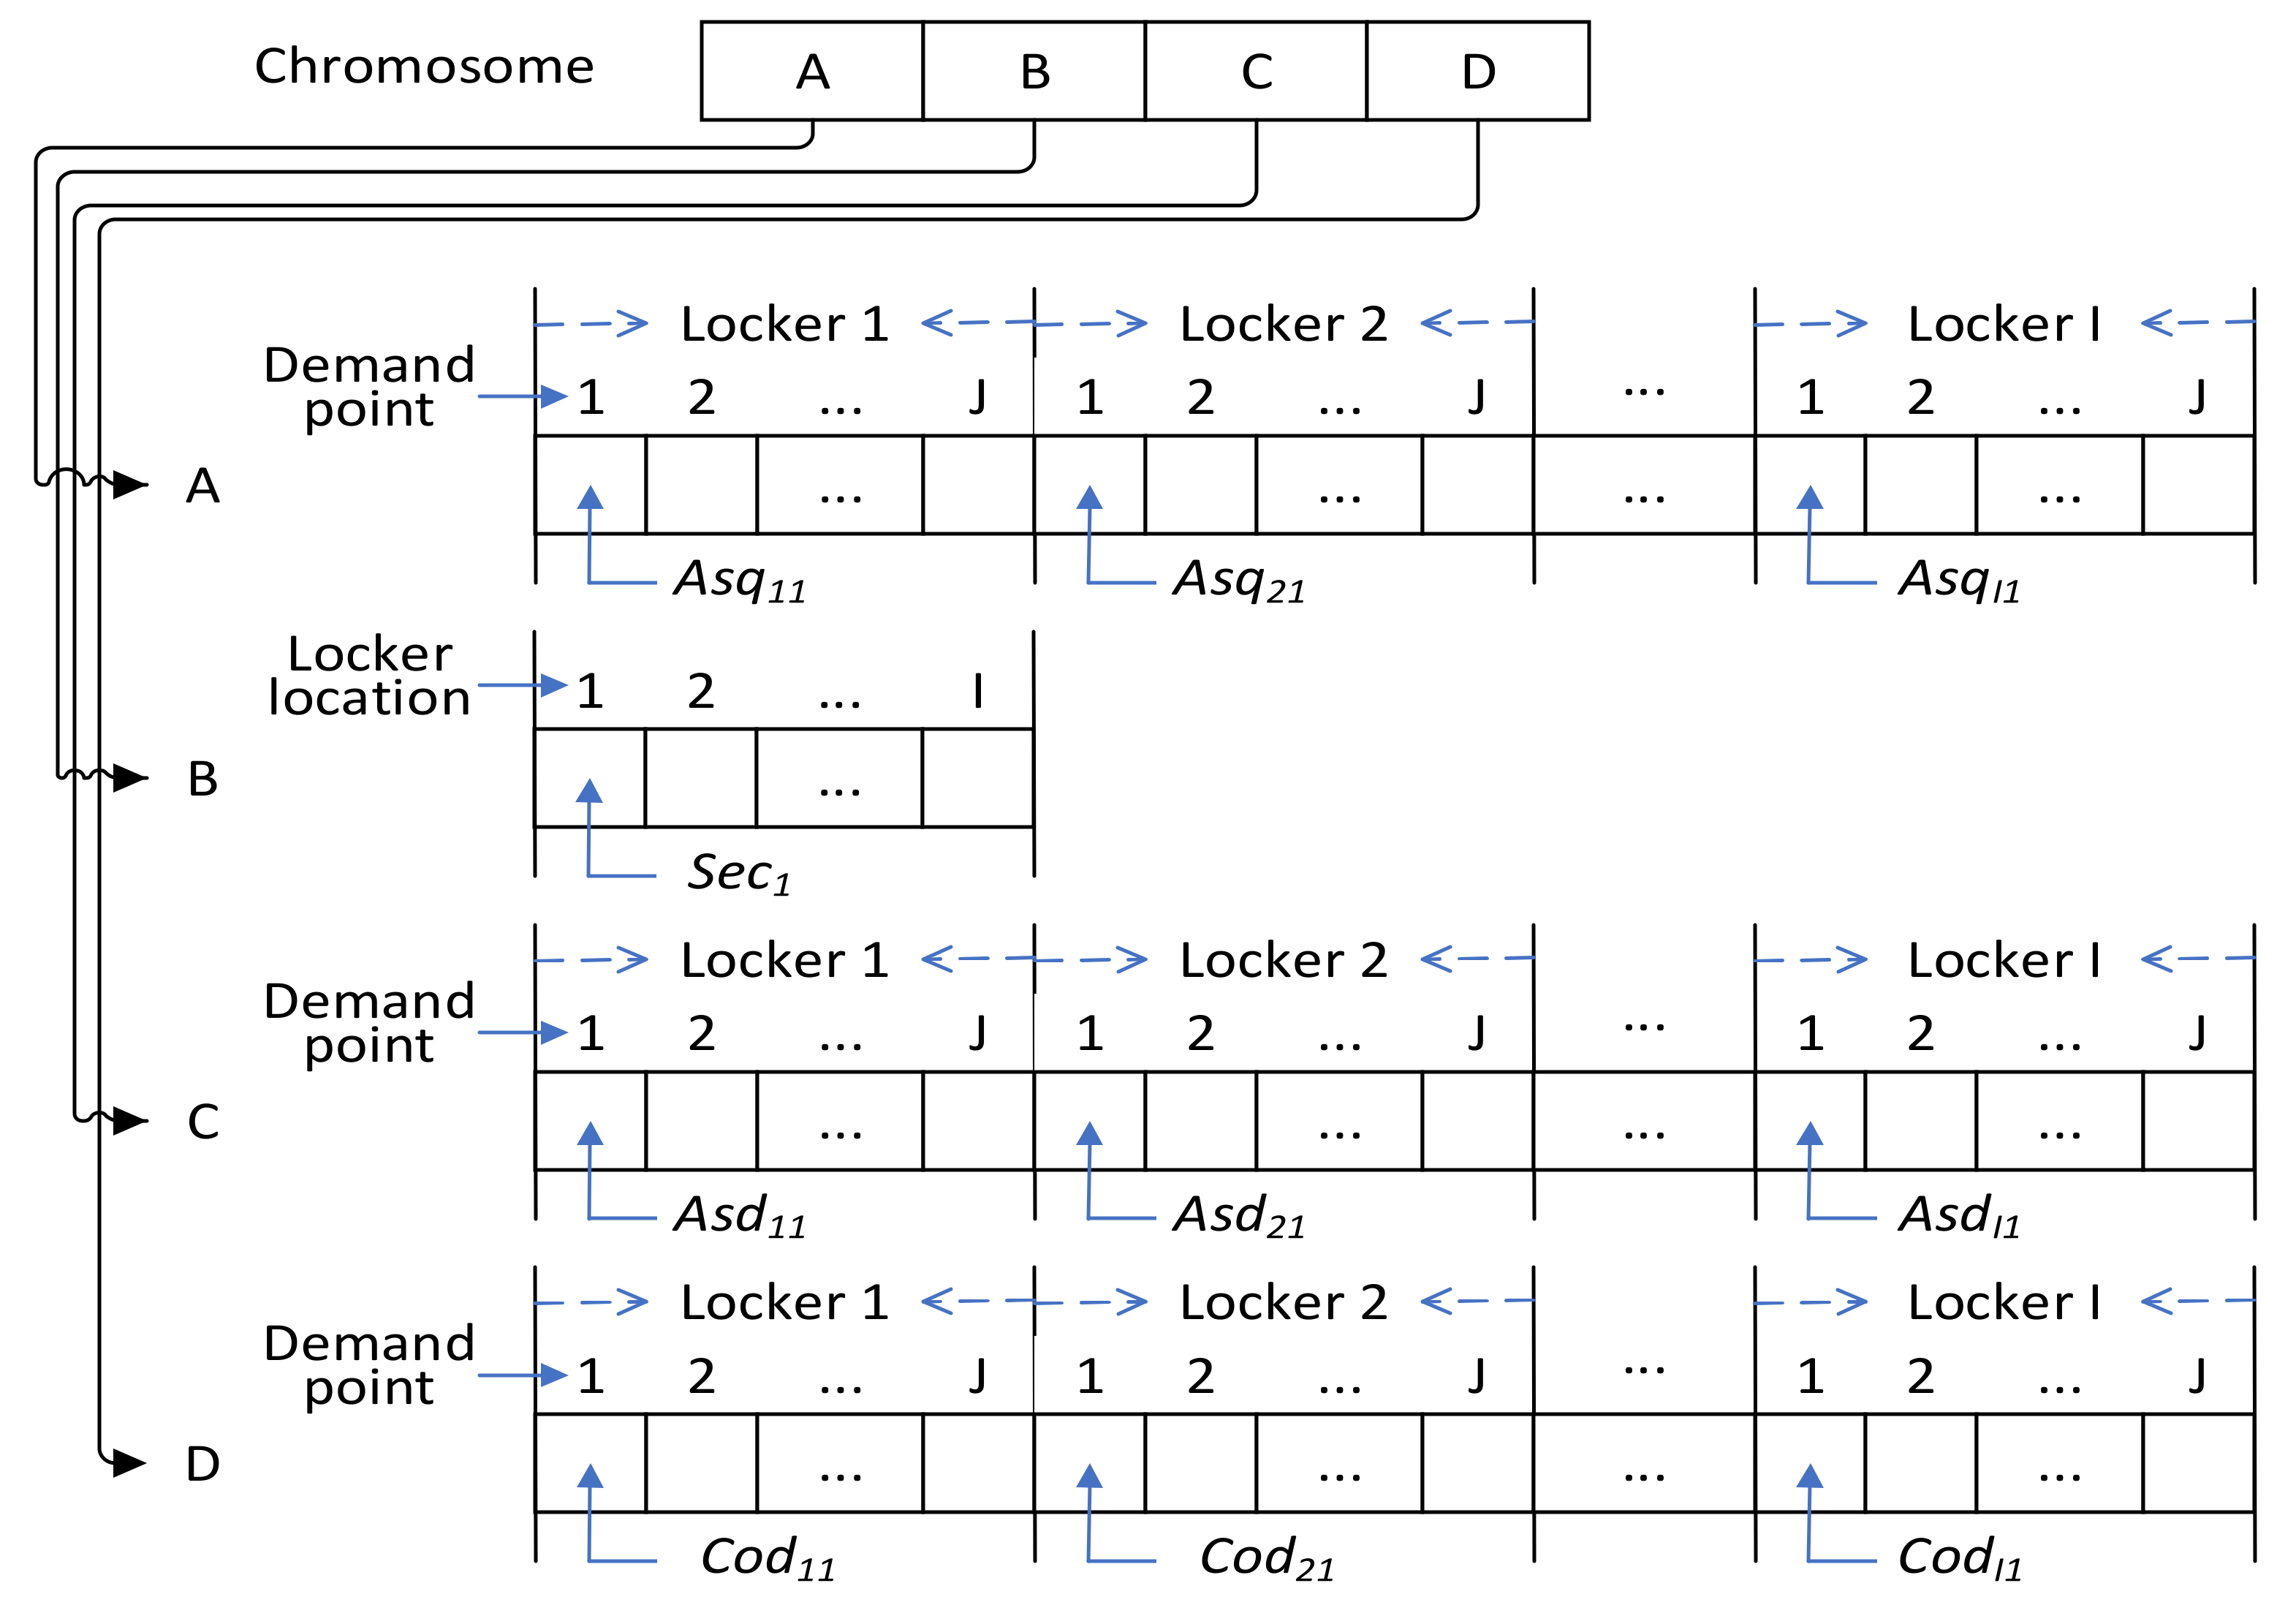
Figure 1. Chromosome structure.
Mathematics 10 00422 g001
Figure 2. Crossover operator.
Mathematics 10 00422 g002
Figure 3. Mutation operator.
Mathematics 10 00422 g003
Figure 4. Main effects for signal to noise ratio (SNRs).
Mathematics 10 00422 g004
Figure 5. Pareto-optimal solutions.
Mathematics 10 00422 g005
Figure 6. Objective function values of 10 reference solutions.
Mathematics 10 00422 g006
Figure 7. Pareto-optimal solutions of two objectives (f1 and f2) and three objectives (f1, f2 and f3) with coverage = 1 (a) and coverage = 0.965 (b).
Mathematics 10 00422 g007aMathematics 10 00422 g007b
Figure 8. Pareto-optimal solutions of two objectives (f2 and f3) and three objectives (f1, f2, and f3) with overlap = 0.050 (a) and overlap = 0.235 (b).
Mathematics 10 00422 g008
Figure 9. Operating status of reference solutions.
Mathematics 10 00422 g009
Table 1. Comparison of maximal location covering problems (MCLP) and location set covering problems (LSCP).
LSCPMCLP
FacilityThe number of facilities is not limitedThe number of facilities is limited
Demand pointEach point must be covered by at least one facilityNot all points must be covered
ObjectiveThe number of facilities must be minimizedService coverage must be maximized
Table 2. Notations for mathematical model.
NotationDefinition
Parameter
iIndex of locker location
ITotal number of locker locations
jIndex of demand point
JTotal number of demand points
T c a i Total capacity of locker location i
T d e j Total demand for demand point j
D i s i j Distance between locker location i and demand point j
Decision variable
A s q i j Assigning quantity from demand point j to locker location i
S e c i Service distance of locker location i
A s d i j 1 ,   assigning   demand   point   j   to   locker   location   i   0 ,   others  
C o d i j 1 ,   demand   point   j   is   covered   by   locker   location   i ,   which   is   within   the   service   distance   of   locker   location   i                                                             0 ,   others  
C o t j 1 ,   demand   point   j   being   covered   by   two   or   more   lockers 0 ,   others  
Table 3. Definitions of factors and factor levels.
LevelPsCrMrIn
L11500.90.1100
L21000.70.06500
L3500.80.21000
Table 4. Definitions of factors and factor levels.
Location
Solution No.F1F2F3F4F5F6F7F8F9F10
R15 *582157422
0.025 ! 0.010 0.130 0.805 0.950 0.005 0.000 0.335 0.780 0.955
R27171157212
0.000 0.970 0.270 1.000 0.950 0.000 0.000 0.750 0.895 0.955
R35582155422
0.025 0.010 0.130 0.805 0.950 0.005 0.010 0.335 0.780 0.955
R47181167423
0.005 0.970 0.025 1.000 0.950 0.000 0.000 0.410 0.780 0.755
R54592156442
0.280 0.000 0.030 0.805 0.950 0.005 0.005 0.335 0.380 0.955
R66572158221
0.015 0.000 0.325 0.805 0.950 0.000 0.000 0.750 0.780 1.000
R78572157422
0.010 0.010 0.360 0.805 0.950 0.005 0.000 0.335 0.780 0.955
R87171167213
0.000 0.970 0.270 1.000 0.950 0.000 0.000 0.750 0.895 0.755
R95581157422
0.025 0.010 0.025 1.000 0.950 0.005 0.000 0.335 0.780 0.955
R103591156442
0.485 0.010 0.000 1.000 0.950 0.005 0.005 0.335 0.320 0.955
* Service area; ! Idle capacity.
Table 5. Reference solutions for examining operating status.
Reference Solutionf1 f2 f3
S10.9650 0.3300 0.3135
S20.9650 0.2600 0.3230
S30.9800 0.3300 0.3240
Publisher’s Note: MDPI stays neutral with regard to jurisdictional claims in published maps and institutional affiliations.