Article

Evaluation Mechanism Design for the Development Level of Urban-Rural Integration Based on an Improved TOPSIS Method

School of Science, Wuhan University of Technology, Wuhan 430070, China
*
Author to whom correspondence should be addressed.
Mathematics 2022, 10(3), 380; https://doi.org/10.3390/math10030380
Submission received: 24 November 2021 / Revised: 13 January 2022 / Accepted: 25 January 2022 / Published: 26 January 2022
(This article belongs to the Topic Multi-Criteria Decision Making)

Abstract

:
Under the background of new-type urbanization and rural revitalization strategy, how to promote the development of urban–rural integration has become an important issue in today’s society. This paper designed a new evaluation mechanism for the development level of urban–rural integration. Specifically, a three-level evaluation index system of urban–rural integration development level was established from four aspects: spatial integration, economic integration, social integration and living environment integration. By combining the entropy weight method with the ranking method, a combination weighting method was proposed to determine the weight of each index in the index system. Furthermore, an improved TOPSIS method based on relative entropy and grey relational degree was proposed to evaluate the development level of urban–rural integration, which considering proximity from the perspectives of distance and shape and solving the problem that some situations cannot be compared through the original model. Then, the established evaluation mechanism was applied to make an empirical analysis for evaluating the development level of urban–rural integration in Hubei Province, China. Cluster analysis and obstacle factor analysis were used to further analyze the evaluation results. Finally, according to the evaluation results, some effective countermeasures and policy implications were provided to improve the development level of urban–rural integration in Hubei Province.

1. Introduction

Urban and rural areas are geographical regions with different characteristics, which have complicated definitions in geography, sociology, economics and many other fields. The relationship between the urban and rural areas is basic relations in the development of human society. With the continuous improvement of social productivity, the development of urban–rural relations often affects the changes of society, economy, environment, science, technology, culture and other factors. Through long-term evolution, a complex relationship between urban and rural areas has been formed in terms of spatial location, social form, economic structure, ecological environment and cultural integration. Urban and rural areas are interdependent, complementary and integrated with each other, which constitutes a complete dynamic system. In the process of promoting regional development, how to balance the relationship between urban and rural areas and how to plan urban and rural development as a whole has been widely considered by people. Related studies show that urban–rural integration is the goal of the future development of urban–rural relations and the ideal state of urban–rural relations [1,2]. Only urban–rural linkage and mutual promotion can promote sustainable economic and social development in the future.
With the continuous advancement of China’s urbanization construction and the steady improvement of modernization level, the relationship between urban and rural areas under the new state of development has also undergone earth-shaking changes. Due to China’s large population base and poor rural development foundation, the rapid development of urban areas driven by the secondary and tertiary industries has led to the gradually widening of the development gap between urban and rural areas. The resulting problems of inadequate rural development and unbalanced urban–rural development are increasingly prominent in the process of progress, which have become important problems that hinder future economic and social development and need to be solved [2]. To solve the above problems, China has implemented a series of macro policies and strategies such as new rural construction and new-type urbanization. As socialism with Chinese characteristics has entered a new era, the 19th National Congress of the Communist Party of China (CPC) first proposed a system and mechanism for integrating urban and rural areas, and implemented a series of policies and measures to benefit farmers. In 2019, the CPC Central Committee and the State Council issued Opinions on Establishing and Improving the System, Mechanism and Policy System for Integrated Urban and Rural Development, which provides the guidelines and time points for the construction of the system and mechanism for urban–rural integration development in the new era. Under this context, perfecting the evaluation system of urban–rural integration and exploring the scientific evaluation method of urban–rural integration development level can help to correctly understand the urban–rural integration development process of different counties in China, and to timely grasp the trend of development in the process of promoting social and economic development, which is of great significance and reference value to effectively formulate the countermeasures of urban and rural integration development [3,4]. Therefore, this paper aims to improve the urban–rural integration evaluation index system, explore more targeted evaluation mechanisms, establish a more practical urban–rural integration development level evaluation model, and help different regions make scientific judgment and objective evaluation on the current situation of urban–rural integration development, and provides support for them to determine development goals and formulate policies for urban–rural integration and rural revitalization development.
At present, in central China, the economic development is relatively backward, and the contradiction between urban and rural areas is prominent. Due to many factors such as geographical environment, the gap between central and eastern regions in economic development is increasing. Thus, for the central region, accelerating economic development, narrowing the gap between urban and rural areas, and improving the level of urban–rural integration development are the basis and key to solving the development problems of the central region [1,5]. As one of the main provinces in central China, Hubei Province is a transportation hub connecting east and west, south and north. Therefore, it is of great importance to explore an evaluation method of integrated development level of urban and rural areas suitable for Hubei Province to solve the problems in the urban–rural integration development. From what has been discussed above, this paper will take Hubei Province as an example to explore a scientific evaluation method suitable for evaluating the level of urban–rural integration development in Hubei Province.
Now, the problems we need to further study are as follows. What is the evaluation index system of urban–rural integration? Under this evaluation index system, which methods can be used to evaluate urban–rural integration development level? At present, what is the status quo of urban–rural integration in various regions of Hubei Province? For cities with a low level of urban–rural integration, how do we promote urban–rural integration development? From these problems, this paper will construct an evaluation index system of urban–rural integration development levels from spatial integration, economic integration, social integration and living environment integration. Considering subjectivity and objectivity, the combination weighting model will be established by combining the entropy weight method with the ranking method to determine the weight of each index in the established index system. Additionally, an improved TOPSIS method will be proposed to evaluate the development level of urban–rural integration, and the urban–rural integration degree and subsystem urban–rural integration degree will be attained by using this method. In this new mechanism, through combining relative entropy and grey relational degree, proximity from the perspectives of both distance and shape will be considered, and the problem that some situations cannot be compared through the original model can be solved. Applying the established evaluation mechanism, according to the urban–rural integration development index data of 15 cities in Hubei Province in 2020, an empirical analysis will be made on the development level of urban–rural integration of each region, and the validity of the model proposed in this paper will be verified by comparing with several traditional models. Moreover, the methods of cluster analysis and obstacle factor analysis will be used to further analyze the evaluation results. Finally, according to the results and conclusions of the above research, some countermeasures and policy implications will be put forward to improve the development level of urban–rural integration in Hubei Province. The methodology of the research in this paper is shown in Figure 1.
The innovation points of this paper are as follows:
(1)
In the process of establishing the evaluation model of urban–rural integration development level, the target value was introduced to replace the positive ideal solution in the traditional evaluation model, which improved the accuracy of evaluation, gave full play to the advantages of TOPSIS model, and provided a reference for the specific quantitative analysis and the determination of development direction.
(2)
Relative entropy and grey relational grade were combined to improve the TOPSIS method, so as to avoid the problem of being unable to distinguish the state of points on the vertical line of positive and negative ideal solutions. At the same time, the proximity degree in the shape of the evaluation unit to positive and negative ideal solutions was considered, which effectively improved the accuracy of the model.
(3)
Cluster analysis was used to analyze the combination of urban–rural integration degree and subsystem urban–rural integration degree, which is helpful to grasp the specific situation of urban–rural integration development level of each city, and put forward more targeted countermeasures and policy implications.
The rest of this paper is organized as follows. Section 2 gives the literature review of rural–urban relationships, rural–urban integration evaluation, multi-attribute decision-making and evaluation methods and other related studies. Section 3 provides the construction process of evaluation index system of urban–rural integration development level. Section 4 establishes a combination weighting model by combining the entropy weight method with the ranking method to determine the weight of each index in the established index system. Section 5 proposes an improved TOPSIS method based on relative entropy and grey relational degree to evaluate the development level of urban–rural integration. Section 6 makes an empirical analysis, and provides some countermeasures and policy implications for improving the development level of urban–rural integration in Hubei Province. Section 7 concludes the paper.

2. Literature Review

2.1. Urban–Rural Integration

In the exploration of urban–rural relationship and urban–rural integration, a large number of scholars have carried out some valuable theoretical research. Since the rapid development of industrialization, the gap between high efficiency mechanized industrial production and low efficiency manual agricultural production has gradually increased, which makes the problem of urban–rural separation and urban–rural contradiction more and more widely paid attention to by people. The theoretical research of urban–rural relationships has experienced nearly two centuries of development, and focuses on the research of urban–rural development mode. Since the industrial revolution, the research and discussion on the urban–rural relationship model have never stopped, resulting in a series of theoretical achievements such as dual economic structure theory, agricultural distribution theory, and the “center-periphery” theory. Among them, Engels first proposed the concept of “urban-rural integration” in 1847, and British urbanist Ebenezer Howar proposed a new social structure composed of the combination of city and country in the garden city theory. Lewis Mumford, a famous American urbanist, also pointed out that city and countryside should be organically combined. Thus, many scholars believe that urban–rural integration is the ideal state for the evolution of urban–rural relations [6].
In recent years, scholars have conducted new discussions on the evolution of urban–rural relationships. For example, Torreggiani et al. [7] believed that there is a two-way development trend between urban and rural areas, which will eventually form an urban–rural integration relationship. Bjørkhaug et al. [8] explored alternative pathways of agricultural modernization, pointed out that the development of modernization cannot be separated from the revitalization of rural agriculture, and believed that improving the resilience of farms, agriculture and the agri-food sector, and rural areas can contribute to the prosperity and well-being of farmers and rural communities, which is increasingly important. In view of China’s basic national conditions and the specific characteristics of urban–rural integration, many scholars have studied the development model of urban–rural integration in China and put forward relevant suggestions. For example, Che et al. [9] took Jiangsu Province as an example, analyzed the evolution characteristics of urban and rural spatial forms, revealed the process and dynamic mechanism of urban and rural spatial integration, and summarized different types of urban and rural spatial integration modes. Wang [10], Wang and Zheng [11] believed that the integration of urban and rural development is the only way to promote agricultural and rural construction and achieve high-quality economic development of the whole people in the new era. They discussed the problems facing urban and rural integrated development in the new period of China, and gave relevant countermeasures and suggestions. In the discussion of rural–urban relations, a large number of studies show that the development of rural–urban relations should be based on the concept and goal of urban–rural integration, and should be appropriately adjusted according to the development situation of different regions, and take targeted and reasonable countermeasures in different development periods.

2.2. Models for Evaluation of Urban–Rural Integration

2.2.1. MCDM Methods and Their Use for Evaluation of Urban–Rural Integration

In the evaluation of urban–rural integration, many scholars have conducted empirical research by establishing evaluation models. Yang [12] first proposed a systematic evaluation index system of urban–rural integration from five dimensions of economy, population, space, life and ecological environment according to China’s national conditions, and put forward a comprehensive evaluation method to observe the realization degree of urban and rural integration on the whole. Zeng et al. [13] evaluated the relationship between urban and rural areas from the perspective of the two-way flow of spatial correlation and functional correlation, and used analytic hierarchy process (AHP) to evaluate the development state of urban and rural relations among provinces and cities in China. Some scholars carried out empirical research on some regions of China. For example, Xiu et al. [14] evaluated the urban–rural integration process in northeast China by using comprehensive index method. Qi [1] used the method of combining principal component analysis and AHP to measure the urban–rural integration relationship in central China. Zhou et al. [15] used network analytic hierarchy process to calculate the urban–rural integration index of Shandong Province. Tong et al. [16] used the cluster analysis method to analyze the development stage of urban–rural integration in northeast China. Han et al. [17] evaluated the process of urban–rural integration in Harbin metropolitan area by using AHP and grey relational analysis methods. Ma et al. [18] took Gansu Province as the evaluation unit and analyzed the spatial pattern of urban and rural quality of life as well as urban–rural difference and integration degree by using the importance-performance analysis (IPA), information entropy, equilibrium index and urban–rural integration degree model. In recent years, many scholars combined the evaluation of urban–rural integration with the newly implemented relevant policies and systems. For example, Bi et al. [19] considered the relationship between the “the Belt and Road Initiatives” and urban–rural integration and its impact on urban–rural integration development. Combining urban–rural integration with other relevant policies improves the accuracy of evaluation and makes the evaluation results more realistic, guiding significance.
In conclusion, it can be seen that most of the studies on urban–rural integration are conducted from the macro level of urban–rural relationships and discussed from the perspective of the concept of urban–rural integration, and the quantitative evaluation of urban–rural integration is slightly insufficient. In the existing evaluation of urban–rural integration development level, the evaluation index system and evaluation basis are different, which fails to reach a unified conclusion, making it difficult to verify the accuracy of the evaluation results. In addition, the evaluation methods used are relatively simple, and most of the scholars adopt basic evaluation methods such as principal component analysis and AHP, which fail to fully consider the complexity of urban–rural integration evaluation. At the same time, the relevant data referred to have low timeliness, the results and suggestions cannot adapt to the existing development environment, and cannot reflect the change trend of regional urban–rural integration level. In addition, there are few empirical studies on the level of urban–rural integrated development in Hubei Province, and the index selection is not highly targeted. The established evaluation index system may not be applicable to Hubei Province, and it needs to be organically improved and adjusted according to the actual situation.

2.2.2. Research Progress of MCDM Methods

Many scholars have studied the multi-attribute decision making problem. At present, common methods include linear weighting method, AHP, TOPSIS method, grey relational decision method, fuzzy comprehensive evaluation method, etc. [20]. The research on new methods of multi-attribute decision making and evaluation is also deepening. For example, Zhang et al. [21] proposed a core space multidimensional cloud model for multi-attribute evaluation. Wang et al. [22] proposed a decision method of integrating the prospect theory with TOPSIS. Lin et al. [23] developed an extended TOPSIS method and an aggregation-based method to rank the alternatives and then select the best one for multi-attribute group decision-making with probabilistic uncertain linguistic information. Grag et al. [24] proposed a new multi-attribute group decision making method under the environment of intuitionistic multiplicative preference set. Zhang et al. [25] proposed a dynamic expert credibility model, which calculated the distance between expert evaluations via the score deviation and ranking deviation, proposed the expert background change process (EBCP), and calculated the dynamic confidence value before and after the EBCP. Balezentis et al. [26] extends the coordinated TOPSIS to the interval environment, and introduces the geometric integer programming model to determine the interval for the degree of coordination, so that the uncertainty can be dealt with and the performance of the alternatives can be coordinated under multiple standards.
It can be seen that in the research of new methods of multi-attribute decision making, a large number of studies focused on the comprehensive use of various methods. On the basis of classical methods, various problems in decision making are considered, and new methods are introduced to improve the defects of the original methods.
Taking Hubei Province as an example, this paper constructed the evaluation index system of urban–rural integration development level according to the relevant principles of index system construction. In order to ensure the rationality of the index system, various methods were used to test it. In terms of the evaluation method, combining the subjectivity and objectivity, the combination weighting model was established by combining the entropy weight method with the ranking method to determine the weight of each index in the established index system. Additionally, an improved TOPSIS method based on relative entropy and grey relational degree was proposed to evaluate the development level of urban–rural integration, so that the problem that some situations cannot be compared through the original model can be solved. In addition, the methods of cluster analysis and obstacle factor analysis were used to further analyze the evaluation results in order to get more practical conclusions.

3. Construction of Evaluation Index System

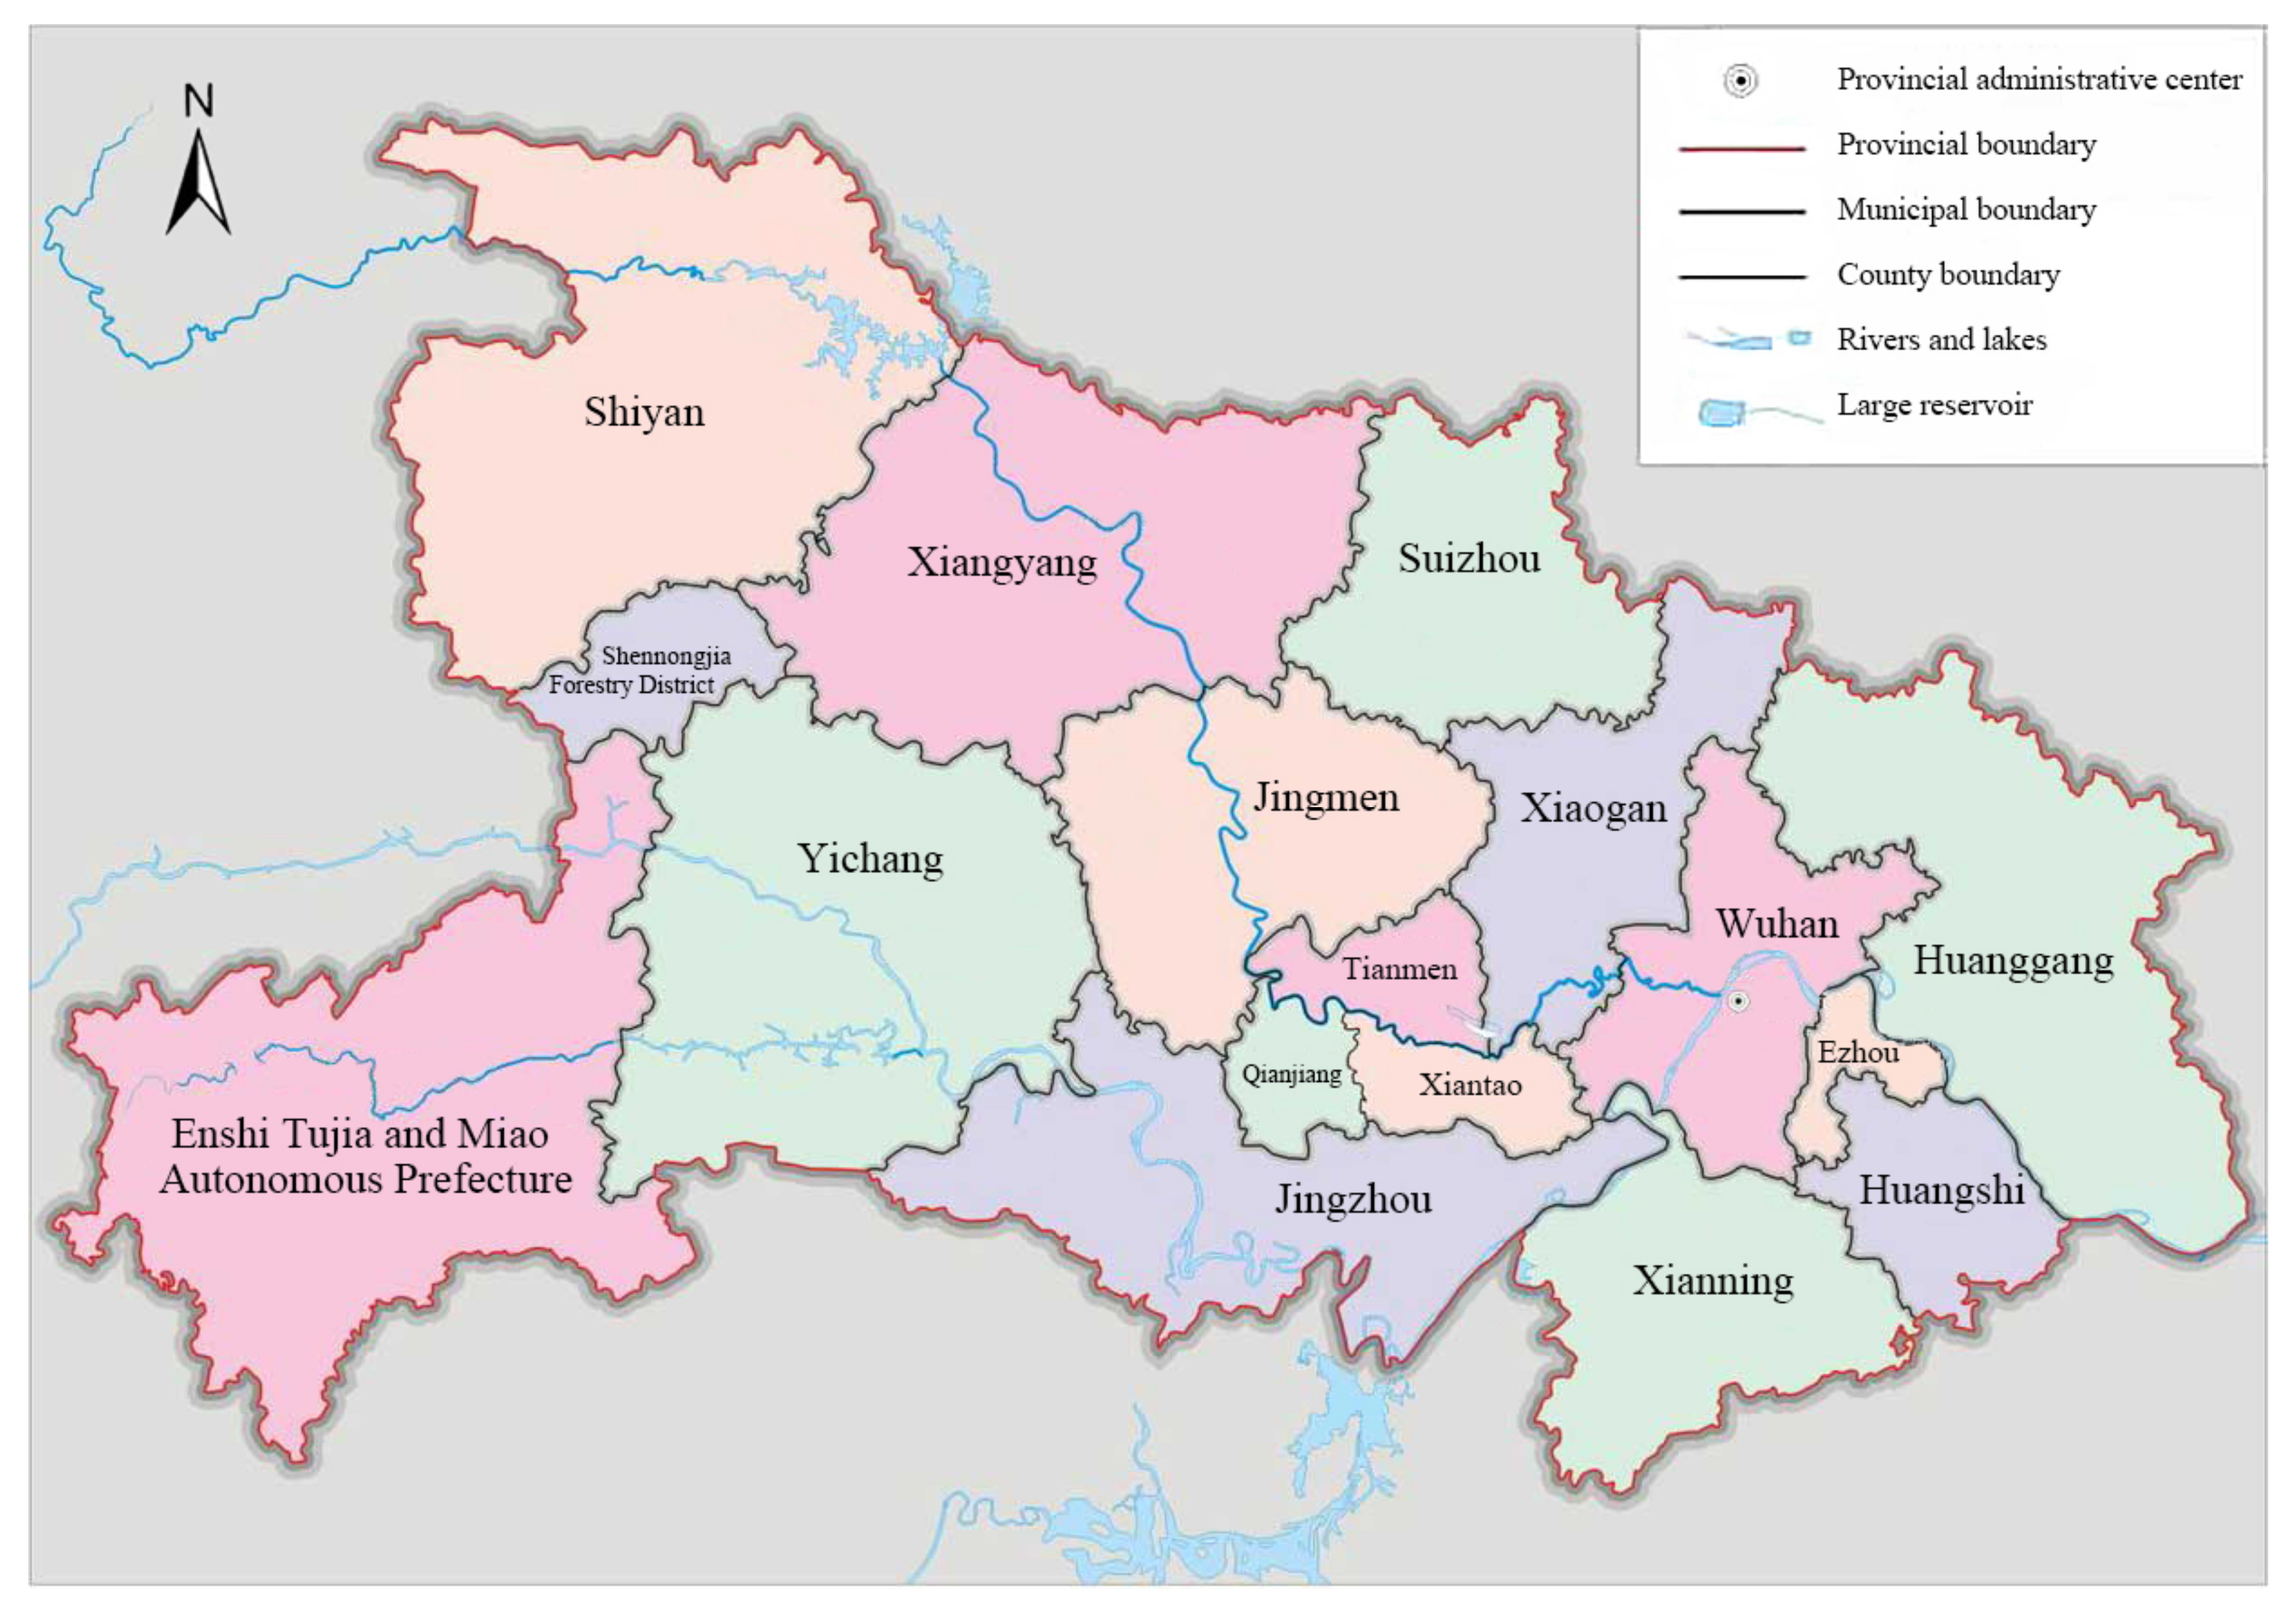
3.1. Overview of Study Area

In the existing studies on evaluation of urban–rural integration, Qi [1] has evaluated and analyzed the degree of urban–rural integration in central China, but there is no specific evaluation for Hubei Province. The economic development in the central region of China is relatively backward, and the urban–rural contradiction is more prominent. Hubei Province, as one of the major provinces in central China, is geographically connected from east to west, from south to north, and is a relatively representative province in central China. Research on Hubei Province is helpful to popularize to other provinces and regions. Therefore, this paper chooses Hubei Province as an example to evaluate the level of urban–rural integration development.
Hubei Province is located in the south-central part of China, in the middle reaches of the Yangtze River. Its geographical area is 185,900 km2, accounting for 1.94% of the national total. It is located between 29°05′~33°20′ N, 108°21′~116°07′ E, as shown in Figure 2 (The map source website is http://map.ps123.net/, accessed on 23 October 2021). Hubei Province borders on many provinces and cities in China, and is a transportation hub linking east and west, south and north. In terms of terrain, Hubei Province is a semi-open basin structure, with higher elevations in the east, west and north, and lower terrain in the south. As for climate, except for some alpine areas, Hubei Province has a subtropical monsoon climate, with sufficient sunshine, suitable temperature, and rain in hot seasons, so it has relatively good conditions for development [27].
Hubei Province now consists of 12 prefecture-level cities, 1 autonomous prefecture, and 4 provincial administrative units at the county level. In terms of population, the population of Hubei Province ranks foremost among all provinces and cities in China. As of 2019, the permanent resident population of Hubei Province is 59.27 million, among which the urban population is 36.15 million, accounting for 61% of the province, indicating that the number of urban residents in Hubei Province is higher than that in rural areas, and the population urbanization rate is relatively high. In terms of economic development, in 2019, the GDP of Hubei Province reached 4,582,831 billion yuan, accounting for 4.63% of the national total. Due to the geographical environment conditions and historical development path, Hubei Province, as a national old industrial base, its industrial structure is dominated by secondary and tertiary industries. In 2019, the GDP of the tertiary industry in Hubei Province reached 2,292,060 billion yuan. It shows that the degree of industrialization and modernization of Hubei Province is relatively high. However, in terms of residents’ living conditions, the per capita disposable income of urban and rural residents are 37,601 yuan and 16,391 yuan, respectively, showing a large difference between urban and rural areas. It can be seen that the overall development level of Hubei Province is relatively high, but there is a big difference between the development of urban and rural areas, and the living conditions of rural residents need to be improved. Therefore, the establishment of an appropriate model to evaluate the development level of urban–rural integration in Hubei Province will help to scientifically grasp the development trend of urban–rural integration, and provide targets and references for the future development direction of urban–rural integration in Hubei Province.

3.2. Construction of Index System

3.2.1. Data Sources and Index Selection

This paper takes 15 cities in Hubei Province as the evaluation objects, and selects relevant data in 2020 for evaluation and analysis. The data involved in the following are all from Hubei Statistical Yearbook (2020), which is available in the Hubei Provincial Statistics Bureau repository (http://tjj.hubei.gov.cn/tjsj/sjkscx/tjnj/qstjnj/, accessed on 25 October 2021). The urban and rural area mentioned in this paper are divided according to the definite administrative division units in China’s legal procedures. The specific data types we selected will be reflected in the construction of the index system below.
To construct the evaluation index system of the development level of urban–rural integration, it is necessary to choose the evaluation index that can clearly reflect the status of urban–rural integrated development, namely, to find out the main influencing factor and expression way of the urban–rural integration, and to extract a quantitative expression form in the complex evaluation problem. Through the statistical method to organically combine the evaluation indexes, we achieve the goal of scientifically evaluating the development level of urban–rural integration [1].
According to the relevant requirements of Opinions on Establishing and Improving the System, Mechanism and Policy System for Integrated Urban and Rural Development, and referring to the relevant research literature [12,13,14,15,16,17,18,19,28,29,30,31,32], a three-level index system for evaluating the development level of urban–rural integration is constructed: The first-level is the evaluation subsystem, which includes four subsystems: spatial integration, economic integration, social integration and living environment integration; the second-level index is the evaluation content extracted from each subsystem, which reflects the meaning of each subsystem through several specific evaluation contents; the third-level index is the specific index layer of evaluation, including the calculation method of the indexes, and the specific value of each second-level index can be obtained through calculation. The four subsystems, respectively, contain 3, 5, 3 and 3 indexes, a total of 14 indexes. The content, significance and calculation method of each index are shown in Table 1.
As the positive and negative aspects of the index are uniformly processed in the index calculation, the three-level indexes in the index system are all positive indexes. Considering the connotation of urban–rural integration in the broad sense [33], the indexes in the system mainly reflect the level of urban–rural integration development from three aspects: comprehensive development level (CDL), urban–rural difference comparison (URDC), and rural development level (RDL). In summary, the evaluation index system of the development level of urban–rural integration established above is shown in Table 2.

3.2.2. Rationality Analysis

In this section, we use the correlation coefficient method and the standard deviation method to test and analyze the rationality of the evaluation index system of the development level of urban–rural integration listed in Table 2 according to the index data of 15 cities in Hubei Province.
(1)
Correlation coefficient method
The correlation coefficient method, which is based on the correlation coefficient in statistics [34], can be used to screen the indexes, which aims to eliminate the indexes with multicollinearity and avoid different indexes reflecting the same information [35]. In this paper, the correlation coefficient method was used to calculate the correlation coefficient among all indexes. Since we want to be more cautious in the deletion of indicators, we consider using the Pearson correlation coefficient, which is more stringent for determining correlation and only indicates whether there is a linear correlation. If the correlation coefficients among all indexes are low, it is proved that no index in the index system can be replaced by other indexes, that is, there is no index redundancy. The formula for calculating the correlation coefficient is as follows:
ρ i j = cov ( X i , X j ) σ X i σ X j ,                         i , j = 1 , 2 , , n
where cov ( X i , X j ) is the covariance between random variables X i and X j ; σ X i and σ X j are the standard deviations of random variables X i and X j , respectively, and the random variables X i and X j in this paper correspond to normalized index i and j , respectively; ρ i j represents the correlation coefficient between index i and j ; n is the number of indexes, and n = 14 in this paper. It can be seen from the collected data of Hubei province that the index values of different regions are continuous and independent of each other. The results of the correlation coefficient obtained by the above method are shown in Table 3 (The result is rounded to two decimal places).
It can be seen from Table 3 that the correlation coefficients between most indexes are small and the correlation is weak. Among them, the correlation coefficient between C21 and C31 is relatively large, respectively, representing per capita GDP and population urbanization rate. However, considering that the two indexes have different meanings in different subsystems and have different research values in subsequent research and analysis, the two indexes were chosen to be retained. The results show that there is no index redundancy in the index system, and the index system is reasonable to some extent.
(2)
Standard deviation method
The standard deviation method [34] was adopted to obtain the standard deviation of each index data, which can indicate the information contained in the index data and verify the availability of each index. It can also be used for determining the weight of indexes [36]. The formula for calculating the standard deviation is as follows:
s j = 1 m 1 i = 1 m ( x i j x ¯ j ) 2 ,         j = 1 , 2 , , n
x ¯ j = 1 m i = 1 m x i j ,     j = 1 , 2 , , n
where s j is the standard deviation of the j-th index; x i j is the normalized value of the j-th index of the i-th evaluation unit; m = 15 in this paper. The results obtained by the above method are shown in Table 4.
As can be seen from Table 4, all indexes have large standard deviation, which proves that all index data contain enough information for evaluation and analysis and are available, which means the index system listed in Table 2 is reasonable.

4. Determination of Index Weights

4.1. Index Weighting Method

In the multi-attribute decision making problem, the commonly used index weighting method can be divided into subjective weighting method and objective weighting method. Subjective weighting method is mainly based on the importance of different indexes to determine the weights subjectively, which can make the evaluation target clearer, but the weight results are easily affected by subjective experience. The objective weighting method determines the weights according to the difference or correlation degree of the indexes, which are not affected by the subjective preference of decision makers. However, the weight results are easily changed by the change of index value. When the evaluation unit changes, the weights need to be recalculated, which has poor inheritance. In view of the above problems, the combination weighting method can be adopted, combining the subjective weighting method with the objective weighting method, so that the importance degree and the differentiation degree of the index value can be considered at the same time, and the defects of the single weighting method can be solved to some extent. Therefore, a combination weighting method by combining the entropy weight method with the ranking method was proposed to determine the weights of the indexes in the index system in this paper.

4.1.1. Entropy Weight Method

Entropy weight method applies the concept of entropy to evaluation. Entropy was originally a concept in thermodynamics, and was later introduced into information theory by C.E. Shannon. It has been widely used in engineering technology, social economy and other fields [37,38,39]. The entropy method does not need to consider the subjective impact of indexes, and only determines the weight based on the amount of information contained in the indexes, which is not easily affected by the subjective ideas of decision-makers. The basic idea of the entropy weight method [40,41,42] is to determine the weight according to the index variability. The larger the variability of the index value, the more information it provides, the larger the weight. Otherwise, the smaller the weight. The basic steps of entropy weight method are as follows:
Step 1: Suppose that there are m evaluation units (that is, m cities to be evaluated) and n evaluation indexes. The evaluation index values of all the evaluation units constitute the evaluation index matrix X , which is expressed as
X = x 11 x 12 x 1 n x 21 x 22 x 2 n x m 1 x m 2 x m n
where x i j , i = 1 , 2 , , m , j = 1 , 2 , , n is the j-th index of the i-th city; m = 15 , n = 14 in this paper.
Due to the different dimensions of each index, the index system established in this paper only includes the positive index, and only the normalization of the positive index needs to be considered. The formula is as follows.
x i j = x i j min x 1 j , , x m j max x 1 j , , x m j min x 1 j , , x m j ,           i = 1 , 2 , , m , j = 1 , 2 , , n
where x i j is the normalized value of the j-th index of the i-th evaluation unit.
Step 2: Calculate the proportion p i j of the i-th city in the j-th index, the formula is as follows.
p i j = x i j i = 1 m x i j ,                       i = 1 , 2 , , m ;       j = 1 , 2 , , n
Step 3: Calculate the entropy value e j of the j-th index, the formula is as follows.
e j = k i = 1 m p i j ln p i j ,                     j = 1 , 2 , , n
where k = 1 ln m , 0 e j 1 .
Step 4: Calculate the weight of each index. The information entropy redundancy d j of the j-th index is calculated by the following formula.
d j = 1 e j , j = 1 , 2 , , n
According to the above information entropy redundancy d j , calculate the weight α j of the j-th index, and the formula is as follows.
α j = d j j = 1 n d j , j = 1 , 2 , , n
In this paper, according to the index values of 14 evaluation indexes in the corresponding evaluation index system of 15 cities in Hubei Province, the weights were solved according to the above steps of the entropy weight method. The results are shown in Table 5.

4.1.2. Ranking Method

The basic idea of the ranking method described in this paper is to determine the weight based on the judgment of the importance of each index in the existing relevant research results. It is a subjective weighting method based on the opinions of scholars in relevant literature. This method takes the expert ranking method [43,44] as the theoretical basis, collects the weight of each index in the existing research results in the evaluation of urban–rural integration and related fields. On this basis, the collected results are processed and analyzed, and the statistical method used in the expert ranking method is used to solve the weight.
The weighting method of ranking method is as follows: supposing that there are n evaluation indexes in the evaluation index system. Collecting the index weight values corresponding to the n evaluation indexes in m literatures in related fields, and the corresponding weight values of each index in each literature are ranked, respectively. The index with the largest weight is denoted as 1, the index with the second largest is denoted as 2, etc. If an index does not appear in the literature, then it will be recorded as the second of the last index that has appeared. The index number of each paper is denoted as the “rank” of the index to the corresponding paper. The corresponding rank of the same index in m papers is summed up, and the result is denoted as the “sum of ranks”. The “sum of ranks” of the j-th index is denoted by R j . Calculate the proportional weight β j of the j-th index, the formula is as follows:
β j = 2 m 1 + n R j / m n 1 + n ,   j = 1 , 2 , , n
As the ranking method adopted in this paper has a parallel ranking situation, the sum of weights may not be 1. Therefore, it is necessary to modify the calculated proportional weight to obtain the actual weight assigned by the ranking method. The formula is as follows:
β j = β j j = 1 n β j , j = 1 , 2 , , n
where β j is the weight result of the ranking method of the j-th index.
In this paper, the weight value of indexes in 20 classical literatures [3,13,14,17,18,33,45] related to the evaluation of urban–rural integration was collected, and the weight corresponding to or approximate to the 14 evaluation indexes in the evaluation index system of urban–rural integration development level established in this paper was statistically analyzed. The above ranking method was used to solve the weight. The results are shown in Table 5.
Although the weight ranking of each literature is different, when the weight ranking of each literature is relatively consistent on the whole, it is proved that the weight determined according to the weight ranking group has high credibility. Therefore, Kendall’s coefficient of concordance check method [46] was adopted in this paper to conduct consistency check on the weight ranking of each index in the above 20 classical literatures. The results are shown in Table 6.
As can be seen from the results in Table 6, the asymptotic significance 0.000 < 0.05, indicating that the weight ranking group passed the Kendall’s coefficient of concordance check, which proves that the weight ranking of the 20 literatures selected in this paper has consistency, and the weight determined by the ranking method has relatively high credibility.

4.1.3. Combination Weighting Method

According to the principle of minimum relative entropy [47], the weights α j and β j of the j-th index obtained by the above entropy weight method and ranking method were combined, and the formula is as follows:
min f = j = 1 n ω j ( ln ω j ln α j ) + j = 1 n ω j ( ln ω j ln β j ) ,   j   = 1 , 2 , , n
s . t .               j = 1 n ω j = 1 , ω j > 0
where ω j is the final weight of the j-th index. The Lagrange multiplier method was used to solve the final weight, and the following results can be obtained:
ω j = α j β j j = 1 n α j β j ,         j     = 1 , 2 , , n
By combining the obtained weight ω j of each index, the weight vector of the evaluation index system of urban–rural integration development level can be obtained, denoted as w :
w = ( ω 1 , ω 2 , , ω n ) ,         j = 1 , 2 , , n

4.2. Result Analysis

Based on the established evaluation index system of urban–rural integration development level and the index data of 15 cities in Hubei Province, using the entropy weight method, ranking method and combination weighting method given by Section 4.1.1, Section 4.1.2 and Section 4.1.3 to obtain weights, respectively, as shown in Table 5.
As can be seen from Table 5, from the perspective of the results of the final weight, the index of proportion of built-up area (C11) has the largest weight, the index of density of organic town (C13) follows, and the index of village garbage harmless disposal rate (C43) has the smallest weight. The weights of the three indexes of the spatial integration subsystem are all larger, while the weights of the three indexes of the living environment integration subsystem are smaller. By comparing the index values and the results of the entropy weight method and the ranking method, it is found that because the indexes in the spatial integration subsystem can directly reflect the regional construction degree, the construction degree gap of different regions shows a big difference in the three indexes, so the weights obtained are relatively large. The index weights of the living environment integration subsystem are smaller, but it cannot be concluded that the three indexes are useless for the evaluation of urban–rural integration development level. This is because the indexes that can be used to measure the level of urban–rural integration in living environment are quite complex. Some literatures select other similar indexes to reflect the level of urban–rural integration in this aspect, cause the weight obtained by ranking method is smaller than other indexes. At the same time, because the actual performance of cities in Hubei Province in the living environment integration index is good, the difference degree of different cities when using the entropy weight is small, resulting in the entropy weight method to obtain small weights, so the final weight is small.
According to above analysis and Table 5, the following preliminary conclusions can be drawn. In the process of measuring the level of urban–rural integration development, regional construction level is of great importance, especially the proportion of built-up area (C11) and the density of organic towns (C13), which are important factors in the evaluation of urban–rural integration development level. Economic and social integration cannot be ignored either. From the perspective of improving the level of urban–rural integration development, we should take consolidating rural development and improving the degree of living environment integration as the basis, give priority to improving the level of comprehensive development, vigorously strengthen regional construction, and expand the scale of construction. However, in the long run, stable development and integration of construction, economy, society and life is the only long-term solution.

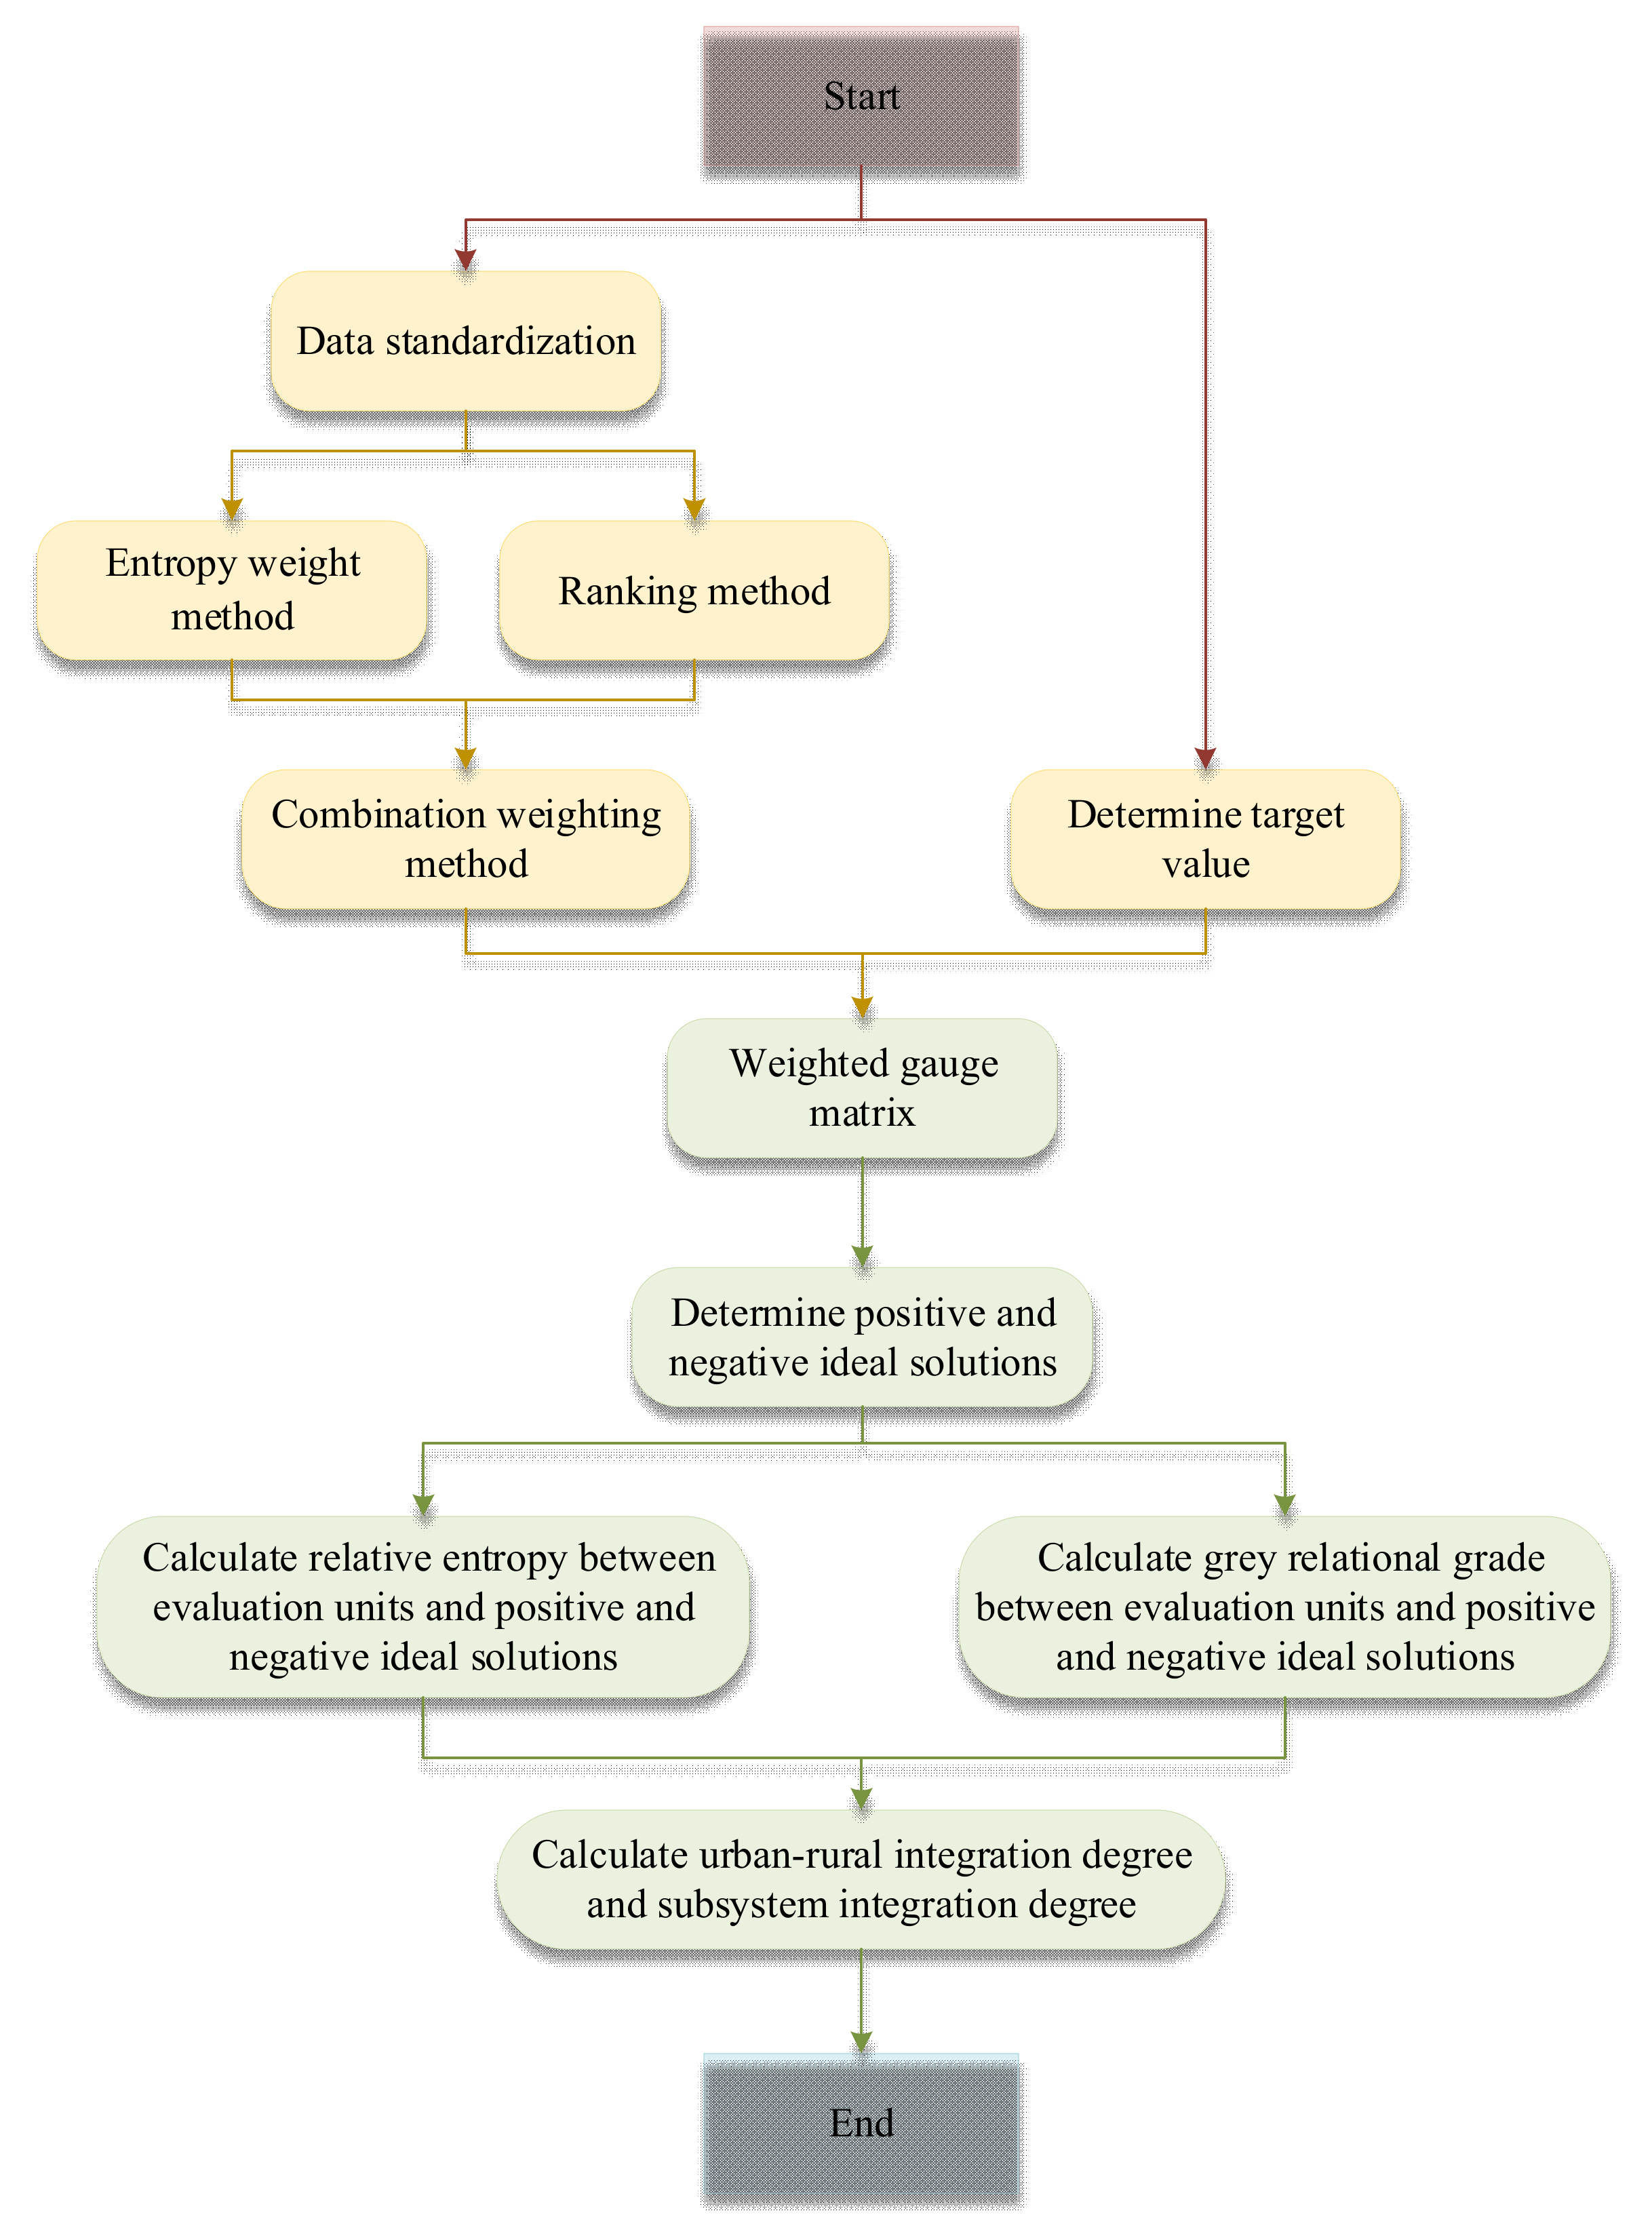
5. Evaluation Model of Urban-Rural Integration Development Level

5.1. Improved TOPSIS Model Based on Relative Entropy and Grey Relational Degree

For the multi-attribute evaluation problem, there are a variety of effective evaluation methods, where TOPSIS method is a common evaluation method. By constructing positive and negative ideal solutions, the distance between the evaluation unit and the positive and negative ideal solutions is taken as the evaluation basis, the closeness of the evaluation unit and the positive and negative ideal solutions is calculated and the evaluation units are ranked [40]. However, the TOPSIS method has a lot of room for improvement. For example, for the points located on the vertical line of the positive and negative ideal solutions, the state cannot be distinguished. The relative entropy evaluation method for multi-attribute decision making proposed by Zhao et al. [48] effectively solves this problem. At the same time, the difference between the evaluation unit and the positive and negative ideal solution in TOPSIS method [44,49] is only taken into account from the distance, while the grey relational analysis method [50,51,52,53], as another commonly used evaluation method, can reflect the proximity degree in the shape of the sequence curve of the evaluation unit to the positive and negative ideal solutions. Therefore, the relative entropy evaluation method and the grey relational analysis method were combined to improve the TOPSIS method, and then the improved method was used to establish the evaluation model of urban–rural integration development level.

5.1.1. Determination of the Ideal Solution

Positive ideal solutions are constructed in both TOPSIS method and grey relational analysis method. Traditional positive and negative ideal solutions are determined by the maximum and minimum values of index data. However, in the evaluation of urban–rural integration development level studied in this paper, some indexes are not positive or negative in a strict sense. For example, for the urban–rural income ratio index, in most cases, the disposable income of urban residents is larger than that of rural residents, and the index value is generally less than 1. In the range of 0~1, this index is a positive index relative to the urban–rural integration development level. However, when the index value is larger than 1, the larger the index value, the larger the difference between urban and rural areas. This index contains the characteristics of a positive index, the positive ideal solution is not that bigger is better, but there is a specific ideal value. Setting specific ideal values for different indexes will help expand the application scope of the evaluation model and more accurately assess the level of urban–rural integration development. In addition, for standard positive indexes, when setting target values according to existing studies or relevant documents, the scoring results obtained will help to analyze the differences between each index and the target values. Therefore, in this paper, the specific ideal value and target value (hereafter, all referred to as the target value) were used to replace the positive ideal solution in the traditional TOPSIS model, so as to give full play to the advantages of the TOPSIS model, improve the accuracy of evaluation, and provide reference for specific quantitative analysis and relevant countermeasures and suggestions. The target value of each index in the evaluation index system of urban–rural integration development level is shown in Table 7.
The target values in Table 7 were calculated based on the relevant requirements of Opinions on Establishing and Improving the System, Mechanism and Policy System for Integrated Urban and Rural Development and the 14th Five-Year Plan of Hubei Province and the Outline of Long-term Goals for 2035 and some conclusions in relevant literature [28,29,54,55,56], combined with the index values of cities in Hubei Province. In the following construction of the improved TOPSIS model based on relative entropy and grey relational degree, the traditional positive ideal solution would be replaced by the target value.

5.1.2. Model Establishment

The steps for evaluating the development level of urban–rural integration are as follows:
Step 1: The values of n evaluation indexes for m cities are formed into evaluation index matrix X = x i j m × n , which is standardized to obtain normalized decision matrix B = ( b i j ) m   × n , where
b i j = x i j i = 1 m x i j 2 ,                   i = 1 , 2 , , m ;     j = 1 , 2 , n
The target value vector is set as t = ( t 1 , t 2 , , t n ) . In order to unify the measure standard between t and the normalized decision matrix B , the formula for standardizing the target value vector is as follows:
t j = t j i = 1 m x i j 2 ,             i = 1 , 2 , , m ;     j = 1 , 2 , , n
Step 2: Calculate the weighted gauge matrix U . The formula is as follows:
U = ( u i j ) m × n = ( ω j b i j ) m × n       = u 1 u 2 u m = u 1 ( 1 ) u 1 ( 2 ) u 1 ( n ) u 2 ( 1 ) u 2 ( 2 ) u 2 ( n ) u m ( 1 ) u m ( 2 ) u m ( n )
where ω j is the weight of each evaluation index determined by the combination weighting method mentioned given by Section 4.1.3. The same method is used to solve the weighted gauge target value for the target value vector. The formula is as follows:
t * = ( ω 1 t 1 , ω 2 t 2 , , ω n t n )
Step 3: Determine the positive ideal solution u + and negative ideal solution u of the weighted gauge matrix U , and the formulas are as follows:
u + = t * = ( u + ( 1 ) , u + ( 2 ) , , u + ( n ) )
u = min 1 i m u i ( j )   |   j J + , max 1 i m u i ( j )   |   j J           = ( u ( 1 ) , u ( 2 ) , , u ( n ) )
where the positive ideal solution is determined by the target value determined in Section 5.1.1, and the negative ideal solution is still determined by the maximum and minimum values of index data; J + is the set of positive indexes among n evaluation indexes; J is the negative index set.
Step 4: Calculate the relative entropy between the evaluation unit i, i.e., the i-th city, and the positive and negative ideal solution. The formulas are as follows:
d i + = j = 1 n u j + log u j + u i j + ( 1 u j + ) log 1 u j + 1 u i j ,   i = 1 , 2 , , m
d i = j = 1 n u j log u j u i j + ( 1 u j ) log 1 u j 1 u i j ,   i = 1 , 2 , , m
where d i + and d i are the relative entropy between the i-th city and the positive ideal solution and the negative ideal solution, respectively.
Step 5: Calculate the grey relational coefficient, which can be used in traditional grey relational analysis method, between the i-th city and positive and negative ideal solutions in the j-th index. The formulas are as follows:
r i j + = min i   min j   u j + u i j   +   ε   max i   max j   u j + u i j u j + u i j   +   ε   max i   max j   u j + u i j ,   i = 1 , 2 , , m ;   j = 1 , 2 , , n
r i j = min i   min j   u j u i j   +   ε   max i   max j   u j u i j u j u i j   +   ε   max i   max j   u j u i j ,   i = 1 , 2 , , m ;   j = 1 , 2 , , n
where r i j + and r i j are the grey relational coefficient between the i-th city and the positive and negative ideal solution of the j-th index, respectively; ε is the distinguishing coefficient. Generally, the larger the distinguishing coefficient is, the higher the resolution will be. ε = 0.5 in this paper.
According to the above Equations (23) and (24), the grey relational degree between the i-th city and the positive and negative ideal solution are calculated, respectively, as follows.
r i + = 1 n j = 1 n r i j + ,     i = 1 , 2 , , m ;   j = 1 , 2 , , n
r i = 1 n j = 1 n r i j ,     i = 1 , 2 , , m ;   j = 1 , 2 , , n
where r i + and r i are, respectively, the grey relational degree between the i-th city and positive and negative ideal solutions.
Step 6: Calculate the proximity degree in distance D i + and D i of the i-th city to the positive ideal solution and the negative ideal solution, respectively, where
D i + = d i + max i   d i + D i = d i max i   d i , i = 1 , 2 , , m
Calculate the proximity degree in shape R i + and R i based on grey relational degree of the i-th city to the positive ideal solution and the negative ideal solution, respectively.
R i + = r i + max i   r i + R i = r i max i   r i ,         i = 1 , 2 , , m
Step 7: Combine D i + , D i , R i + and R i . D i + , D i , R i + and R i are all dimensionless. Since the values of D i and R i + are positively correlated with the positive ideal solution, while D i + and R i are negatively correlated with the positive ideal solution, D i + , D i , R i + , and R i are combined, respectively. The formula is as follows:
S i + = α D i + β R i + S i = α D i + + β R i ,         i = 1 , 2 , , m
where α and β are the preference degree of the evaluator to the distance and shape, respectively, α + β = 1 , α , β 0 , 1 . In this paper, there is no preference for distance and shape, so both α and β are 0.5. S i + and S i comprehensively reflect the proximity degree in distance and shape of the i-th city to the ideal state.
Step 8: Calculate the improved evaluation index F i of the i-th city, i.e., the urban–rural integration degree. The formula is as follows:
F i = S i + S i + + S i ,         i = 1 , 2 , , m
Finally, the evaluation results of urban–rural integration development level can be obtained by ranking the value of F i . The greater the improved evaluation index F i is, the higher the urban–rural integration development level of the city i is.
In addition, we still use the above improved TOPSIS method based on relative entropy and grey relational degree. The “n evaluation indexes” are, respectively, set as 3, 5, 3 and 3 indexes of the four subsystems of spatial integration, economic integration, social integration and living environment integration, and the urban–rural integration degree of each subsystem can be obtained, which provides reference for the subsequent specific analysis of each city.
According to the principle and method are described in the Section 4 and Section 5, the evaluation process of urban–rural integration development level can be shown in Figure 3.

5.2. Further Analysis for Evaluation Results

5.2.1. Cluster Analysis of Urban–Rural Integration Development

In order to further analyze the evaluation results, the urban–rural integration degree and the subsystem integration degree can be combined to get more practical conclusions. Cluster analysis can be used to process the results.
Cluster analysis refers to the process of dividing multiple sets of data into several groups or clusters according to data characteristics without specifying categories [57]. Its basic idea is to minimize the distance between samples within the group and maximize the distance between groups. In this paper, we expect to divide the evaluation results into several categories without definition, and separately explore ways to improve the level of urban–rural integration. k-means clustering algorithm [58] is a classical method for solving clustering problems, which is relatively simple and fast. In this paper, k-means clustering method [57] was used for cluster analysis. The specific steps are as follows:
Step 1
 Combine the urban–rural integration degree of 15 cities with the integration degree of subsystems to form a sample matrix containing 15 sets of data, and standardize the sample matrix.
Step 2
 Specify the value of k in advance. Randomly divide all cities into k groups, and calculate the center of each group.
Step 3
 Calculate the distance of cities to the center of each group, and classify cities as the closest to the center of each group.
Step 4
 Recalculate group centers for groups that have changed.
Step 5
 Repeat Step 3~4 until there is no group change of cities to obtain the final clustering result.

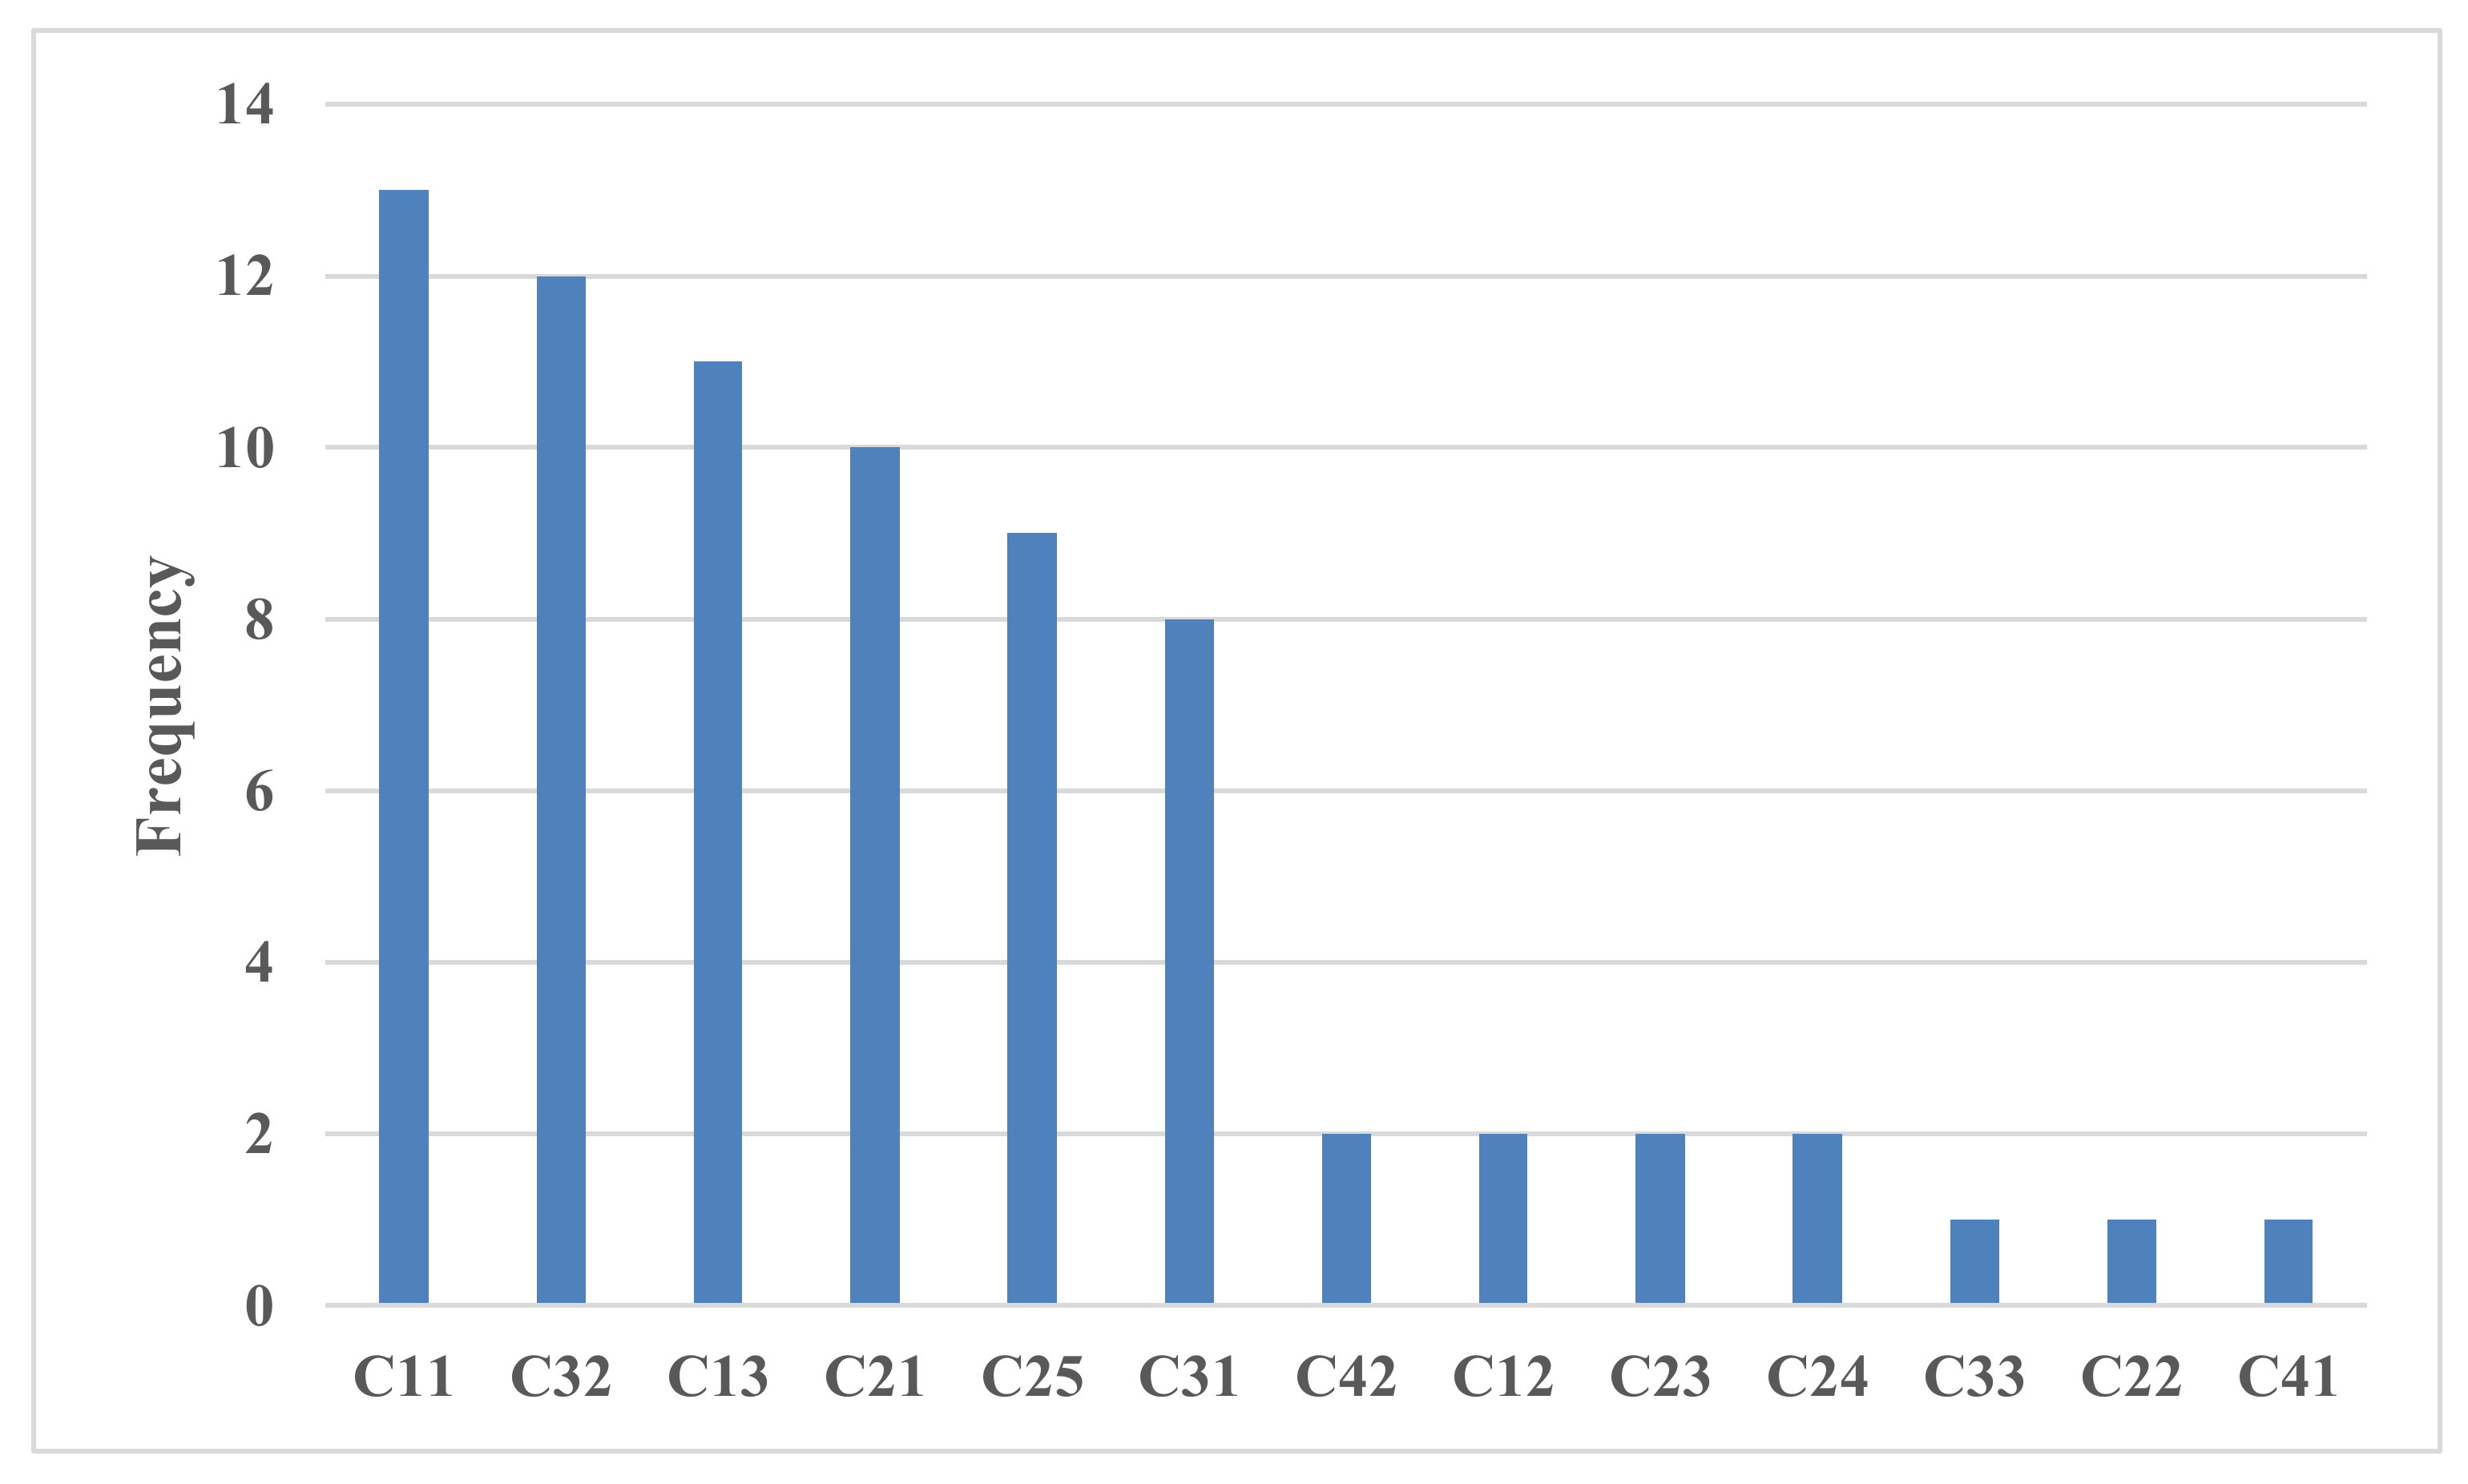
5.2.2. Analysis of Obstacle Factors Restricting Urban-Rural Integration Development

In order to provide targeted suggestions for cities to improve the level of urban–rural integrated development according to the specific situation, the obstacle diagnosis model can be adopted to perform the obstacle factor analysis [59]. By comparing the obstacle degree of obstacle factors, finding out the “short board” urgently needs to improve of each city, pointing out the direction of the work to improve the level of urban–rural integration development, and taking effective measures for a different “short board”, which is helpful to improve the efficiency of urban–rural integration development.
In this paper, the obstacle diagnosis model was used to calculate the obstacle degree of each index factor in cities. The method is as follows: Respectively, calculate the factor deviation degree and factor contribution degree of each city to each index factor. The factor deviation degree refers to the difference between each index and the goal. In this paper, it is the gap between each index of different cities and the ideal value, indicating the degree to which the city needs to be improved in this index. The factor deviation degree of the j-th index of the i-th evaluation unit is expressed by U i j . The difference value between the standardized index value and 1 was taken as the factor deviation degree. The factor contribution degree refers to the degree of influence of each index on urban–rural integration development. In this paper, the weight of each index was selected as the factor contribution degree, that is, the factor contribution degree V j of the j-th index is equal to the corresponding weight ω j of the index. The calculation formulas of deviation degree and obstacle degree of factor are:
U i j = 1 x i j ,           i = 1 , 2 , , m ;     j = 1 , 2 , , n
Y i j = U i j V j j = 1 n U i j V j ,           i = 1 , 2 , , m ;     j = 1 , 2 , , n
where Y i j is the obstacle degree of the j-th index of the i-th evaluation unit, indicating the percentage of deviation of this factor from the development goal of urban–rural integration in the evaluation unit. The larger the obstacle degree, the greater the restriction of the corresponding index in the urban–rural integration development of the city. The more this index hinders the urban–rural integrated development of the city, the more the city needs to focus on improving the index.

6. Evaluation of Urban–Rural Integration Development Level in Hubei Province

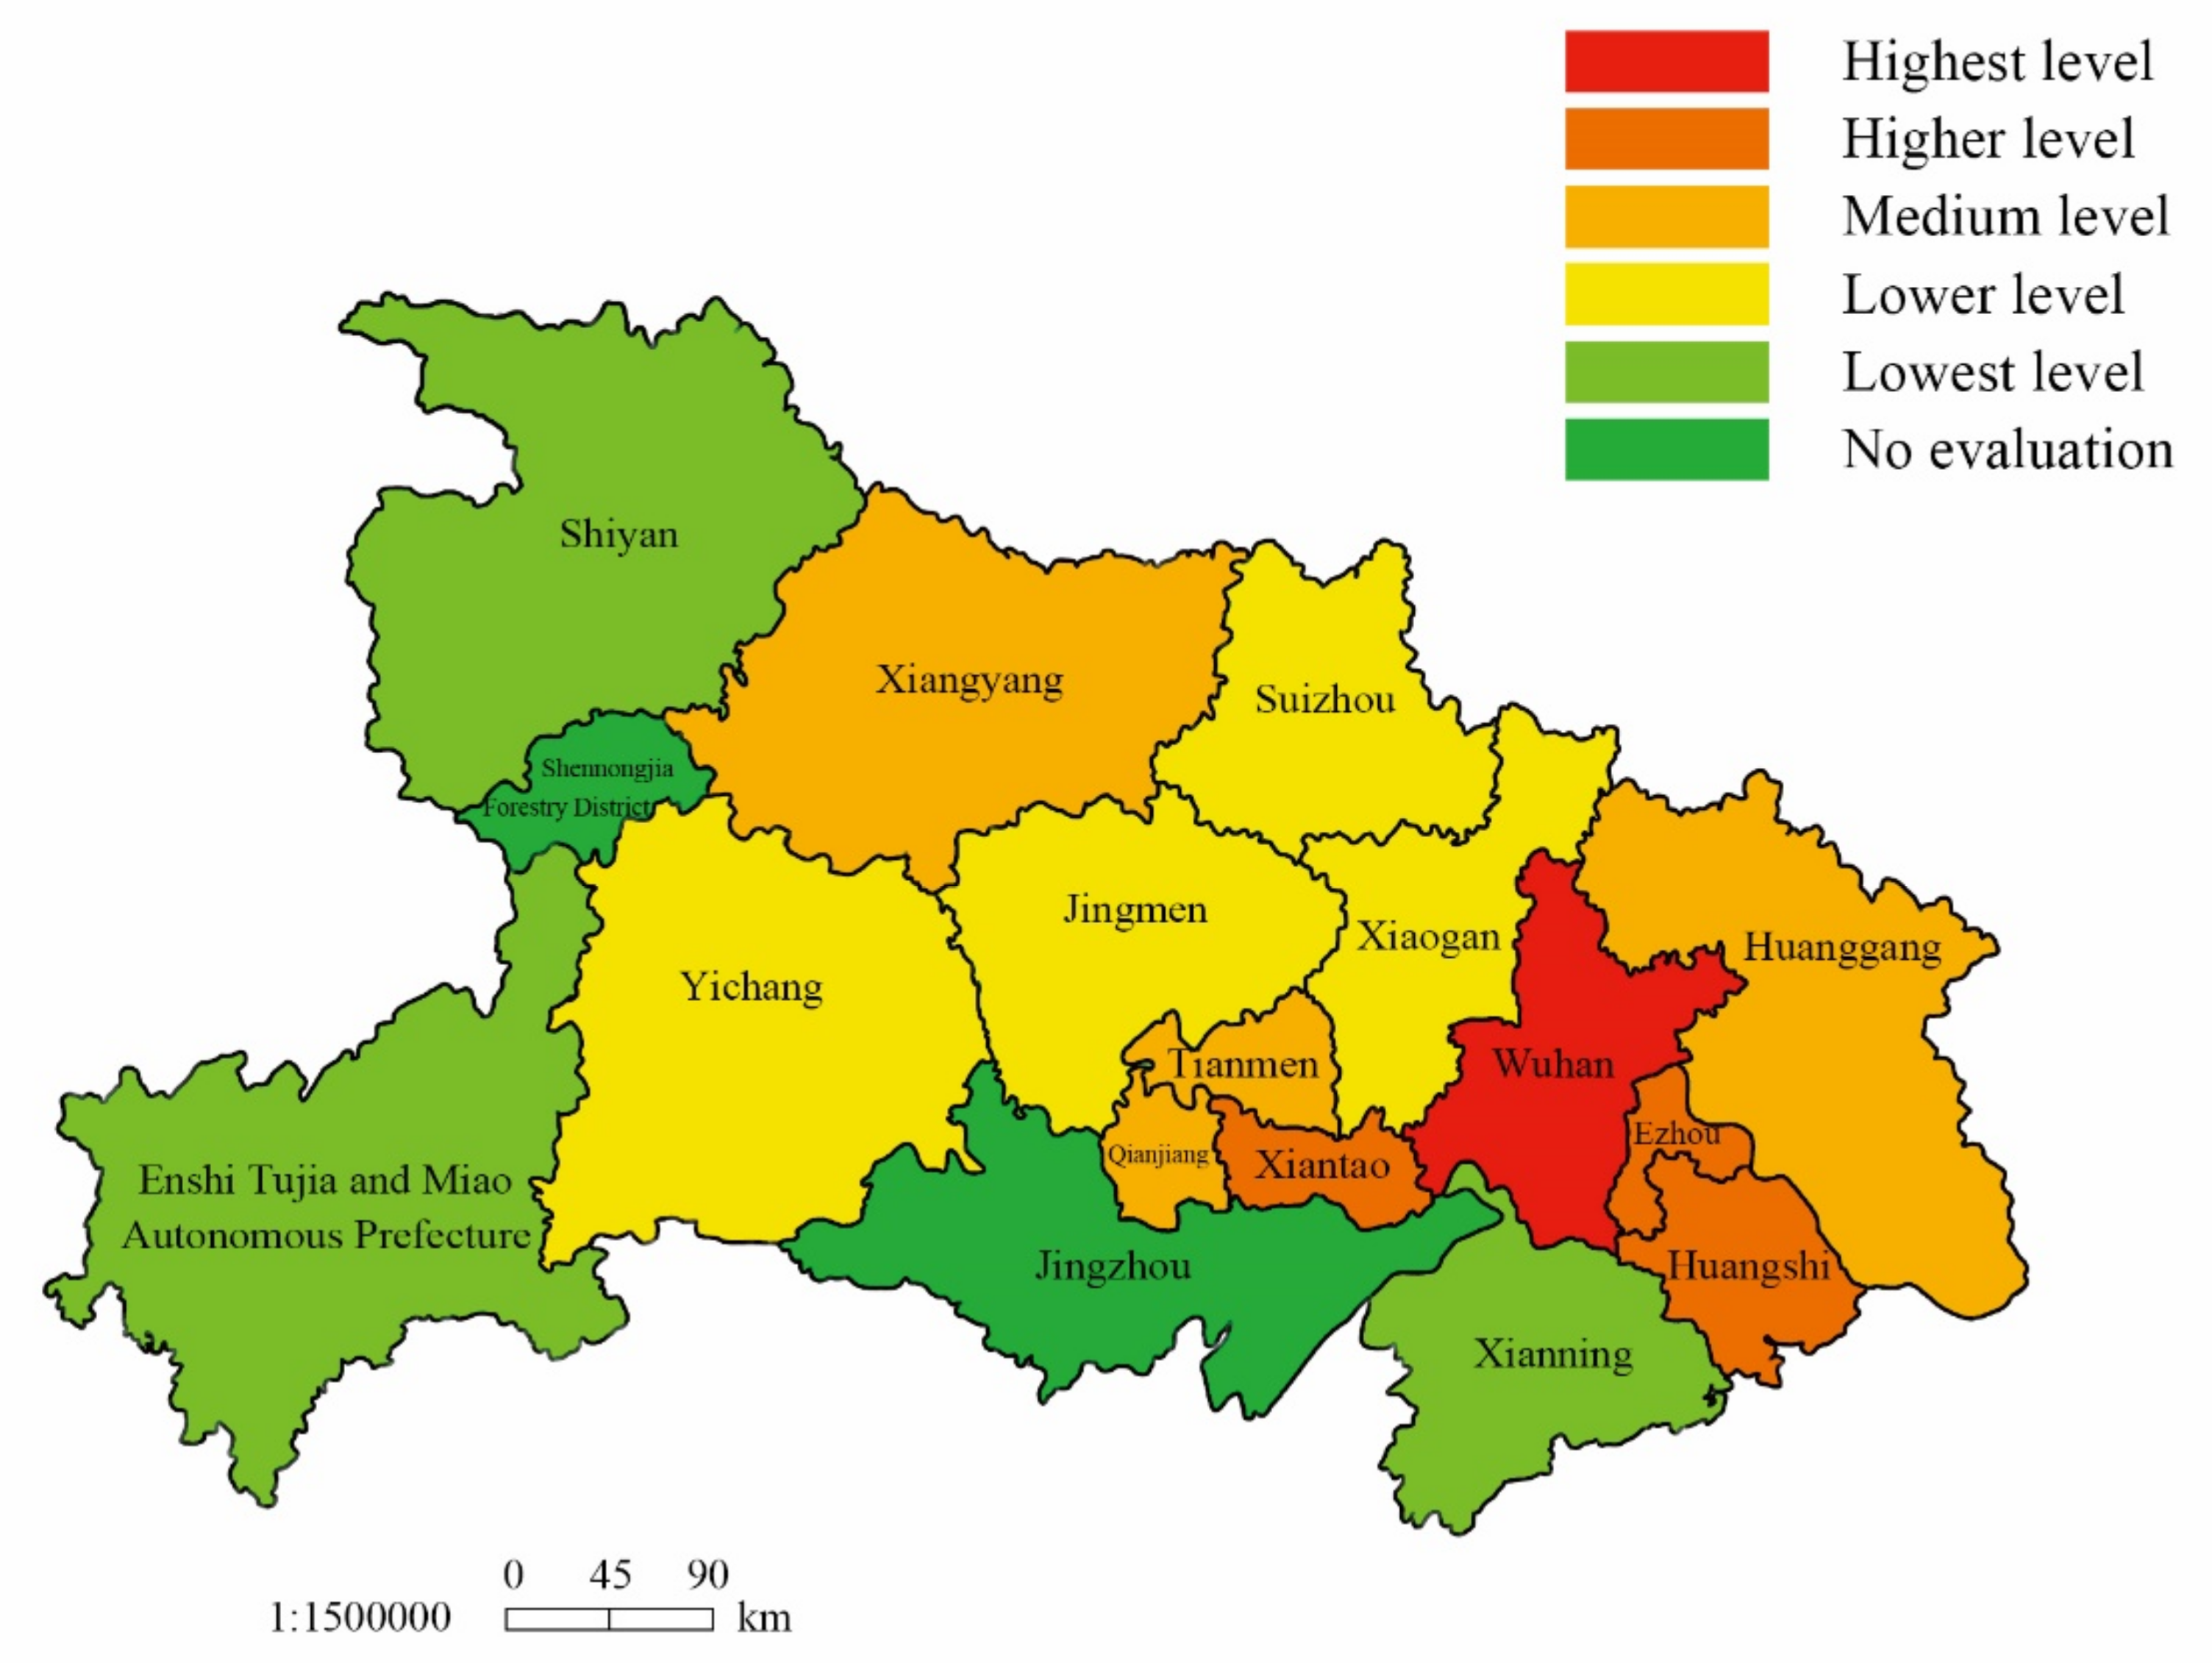
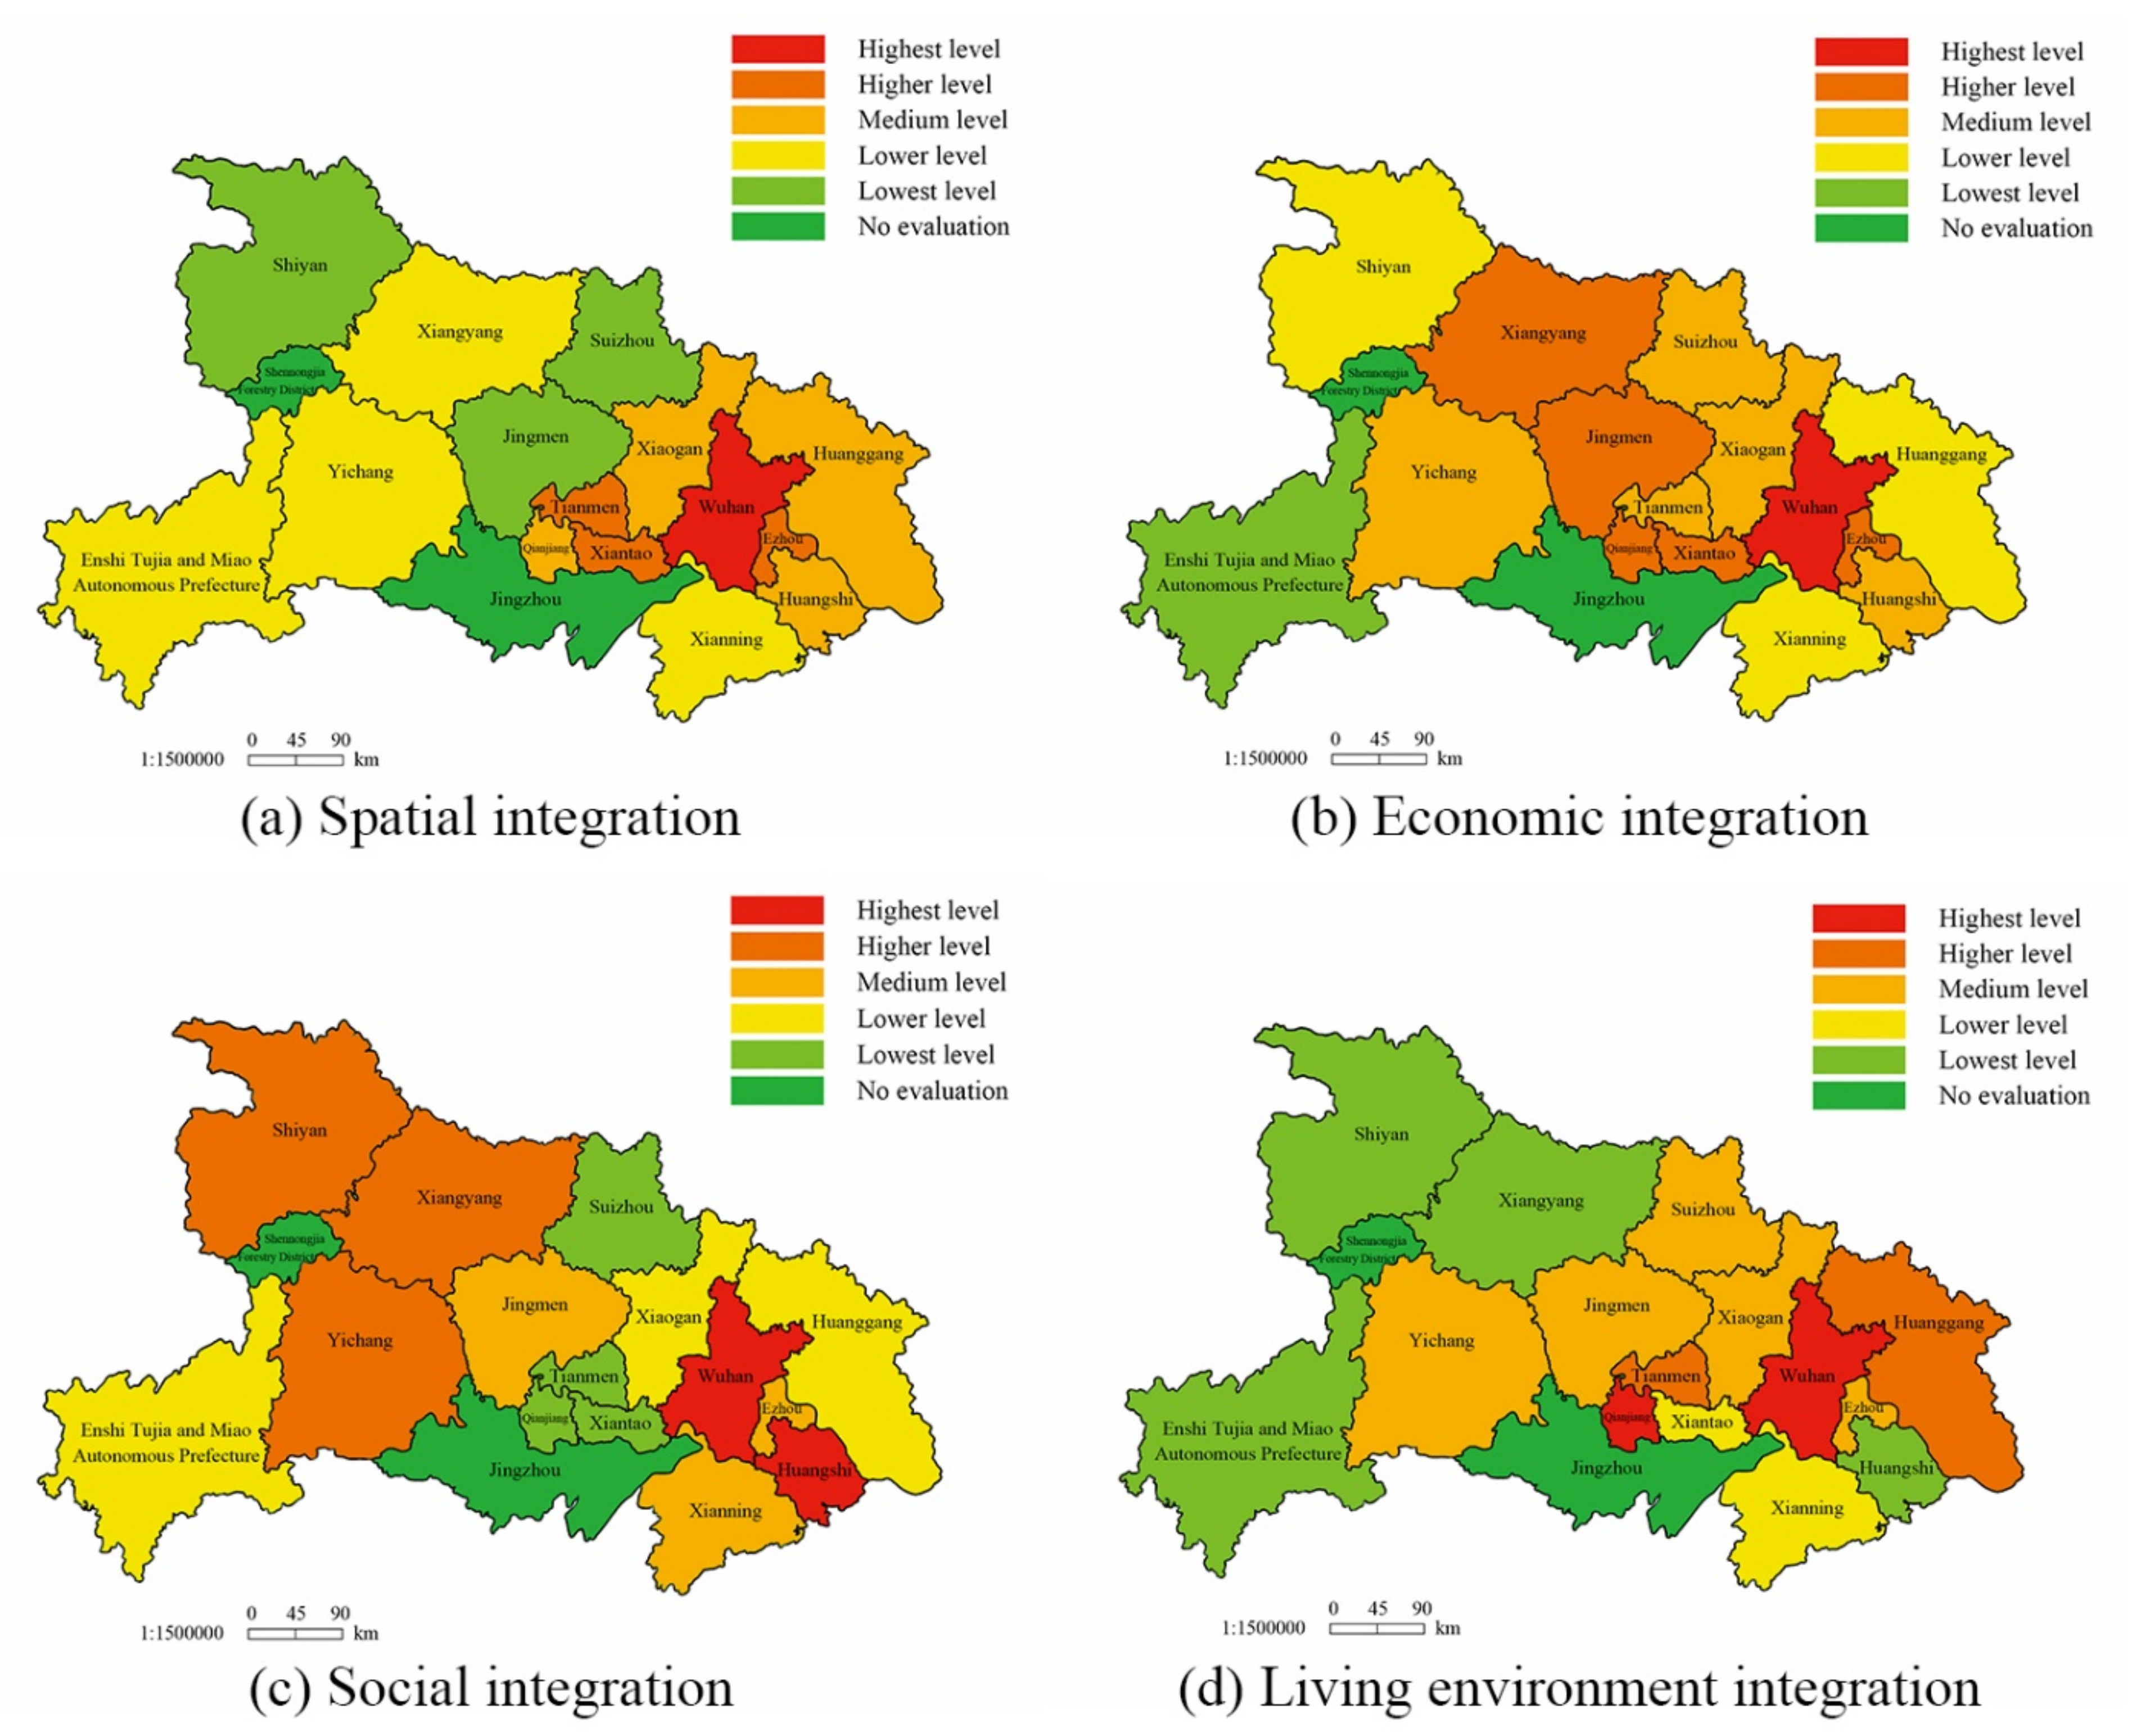
6.1. Analysis of Urban–Rural Integration Degree in Hubei Province

Based on the index data of 15 cities in Hubei Province in 2020, the evaluation model of urban–rural integration development level established in Section 5.1.2 was applied to evaluate the urban–rural integration development level of the 15 cities, the urban–rural integration degree and the urban–rural integration degree of each subsystem of each city were obtained. The results are shown in Table 8.
As can be seen from Table 8, Wuhan has the highest urban–rural integration degree, and the integration degree of each subsystem in Wuhan is also at a relatively high level among cities, followed by Ezhou, Huangshi and Xiantao, and Enshi has the lowest urban–rural integration degree. The difference of urban–rural integration degree in other cities except Wuhan is small, which is consistent with the actual situation that Wuhan is the capital of Hubei Province and its development status of all aspects is relatively developed, which confirms the accuracy of the evaluation results. In terms of spatial integration degree, the spatial integration degree is the highest in Wuhan, relatively high in Ezhou, Xiantao, Tianmen and Huangshi, and the lowest in Jingmen. In terms of economic integration degree, Wuhan has the highest economic integration degree, followed by Xiangyang, Ezhou and Qianjiang, and Enshi has the lowest economic integration degree. In terms of social integration degree, Huangshi has the highest social integration degree, followed by Wuhan, and Xiantao has the lowest social integration degree. In terms of the degree of living environment integration, Wuhan has the highest degree of living environment integration, followed by Qianjiang, and Huangshi has the lowest living environment integration degree. From the above results, we can see that the integration degree of the subsystems of cities with high urban–rural integration degree is also at a high level, which proves that there is no extremely unbalanced development among cities in Hubei Province. However, cities with low urban–rural integration degree have different disadvantages in various aspects, and they need to carry out targeted development.
In order to more clearly reflect the urban–rural integration development of each city, the Jenks natural breaks method in ArcGIS software [60] was adopted to classify the urban–rural integration degrees of cities, and the urban–rural integration degrees of 15 cities were divided into five levels. The results are shown in Table 9. In addition, in order to clearly reflect the regional distribution characteristics of urban–rural integration degree, the regional distribution map of urban–rural integration degree was drawn, as shown in Figure 4.
In the above classification results in Table 9, 1~5 represent highest level, higher level, medium level, lower level and lowest level of integration, respectively. From Table 9, only Wuhan city has reached the highest level of urban–rural integration, while three cities have reached the higher level of integration, four cities have reached the medium level of integration, four cities have reached the lower level of integration, and three cities have reached the lowest level of integration. Overall, the urban–rural integration development of cities in Hubei Province shows a moderate level of development, and the cities with medium levels of integration and below reach 73.3% of the total, and the cities with lower and lowest levels of integration account for 46.7% of the total. The overall urban–rural integration development level of Hubei Province needs to be improved. As can be seen from Figure 4, the regional distribution of urban–rural integration degree in Hubei Province mainly shows the radiation feature with Wuhan as the center. Most cities close to Wuhan have a relatively high urban–rural integration degree, and vice versa.
The same method was used to classify the urban–rural spatial integration degree, economic integration degree, social integration degree and living environment integration degree of the cities. The results are shown in Figure 5.
As can be seen from Figure 5, the urban–rural integration degree of each subsystem still shows radiation characteristics. Specifically, the radiation characteristics of the integration degree of space, economy and living environment are obvious. The regional distribution of the spatial integration degree is relatively consistent with the urban–rural integration degree, the radiation center of the economic integration degree is slightly shifted to the geographical center of the province, and the integration degree of living environment is generally high in the east and low in the west. The radiation characteristic of social integration degree is weaker than that of urban–rural integration degree, but the cities around Wuhan still show a relatively high level of social integration degree.

6.2. Model Verification

In order to verify the effectiveness of the evaluation model established in this paper, the results were compared with the ranking results of the traditional TOPSIS method, relative entropy method and grey relational analysis method. The results are shown in Table 10.
As can be seen from Table 10, the ranking results of urban–rural integration obtained by the model established in this paper are not significantly different from the ranking results of the traditional TOPSIS method, relative entropy method and grey relational analysis method on the whole: The ranking results are different from those of TOPSIS method in only five cities, and the difference is only within three places at most. They are totally consistent with the results of relative entropy method. They are close to the ranking results of grey relational analysis method in high and low, but there is a certain gap in the middle ranking. It is mainly because the difference between cities and the negative ideal solution is not considered in the grey relational analysis, which is different from the ranking idea of the model in this paper, but they are roughly the same as the ranking results in this paper on the whole. The above results show that the results obtained by the model established in this paper are close to the results obtained by the traditional method, which proves that the model established in this paper has good effectiveness and accuracy.

6.3. Results of Cluster Analysis of Urban-Rural Integration Development

In order to analyze the urban–rural integration development status of cities in Hubei Province, the urban–rural integration degree and the urban–rural integration degree of each subsystem were combined, and the method of cluster analysis was used to analyze the urban–rural integration development.
Using the k-means methods mentioned above, by comparing the inner group sum of squares of different k values and the explanatory significance of clustering results, the parameter k was determined to be 4. The urban–rural integration degree and the urban–rural integration degree of the four subsystems were all taken as clustering indexes to analyze the urban–rural integration development status of cities in Hubei Province, which is divided into four categories. The results are shown in Table 11.
According to the indexes of cities in different categories in Table 11 and the cluster center of each category, the characteristics of each category in the table above were analyzed, respectively: Category Ⅰ contains two cities, which represents the category with a high level of urban–rural integration development, the great degree of urban–rural integration and integration of each subsystem, but a relatively low degree of social integration. Category Ⅰ can be called “Social integration to be developed category”. Category Ⅱ includes two cities, which represents the category with a moderately high degree of urban–rural integration, a relatively high degree of social integration, and a general or relatively high degree of economic integration, but a relatively general degree of spatial integration, and a relatively low degree of living environment integration. Category Ⅱ can be called “Spatial and living environment integration to be developed category”. Category Ⅲ includes eight cities, which represents most of the urban–rural integration development at the medium or lower level, living environment integration degree is comprehensive high, economic integration degree is general, spatial integration degree and social integration degree or one of them is relatively low, which is called “Spatial and social integration to be developed category”; Category Ⅳ includes three cities, which represents the category with a low level of urban–rural integration, and the integration degree of each subsystem is generally low. Only the social integration degree is relatively general. Category Ⅳ is called “Comprehensive to be developed category”. According to the characteristics of their respective categories, cities of different categories can take targeted measures for the subsequent urban–rural integration development. The urban–rural integration development of the same category of cities has a certain degree of similarity, which can play a mutual reference role in the formulation of countermeasures to improve the level of urban–rural integration development.

6.4. Results of Analysis of Obstacle Factors Restricting Urban-Rural Integration Development

The obstacle diagnosis model mentioned in Section 5.2.2 was used to calculate the obstacle degree of the obstacle factors of urban–rural integration in 15 cities in Hubei Province. The top five obstacle factors and obstacle degrees are shown in Table 12.
The frequency of each index in Table 12 was counted, and the frequency distribution diagram of obstacle factors was drawn, as shown in Figure 6.
As can be seen from Table 12 and Figure 6, the index C11, namely, the proportion of built-up area, ranks first among the obstacle factors in the 11 cities of Hubei Province. This index appears the most frequently among the obstacle factors, indicating that the built-up area of Hubei Province is in urgent need of expansion. In addition, C32, C13, C21, C25 and C31 appear more frequently in the obstacle factors, corresponding to the indexes, the number of beds per thousand people, density of organic town, per capita GDP, Engel coefficient ratio of urban and rural residents and population urbanization rate, respectively. It shows that most cities need to improve in the aspects of comprehensive construction, increasing economic aggregate and balancing urban and rural consumption and medical level. According to the specific situation of each city, the corresponding obstacle factor and obstacle degree of each city can be analyzed in detail, and the obstacle factor with high obstacle degree can be targeted to improve. In addition, it should be noted that the value of obstacle degree can only be used as a basis for horizontal comparison, reflecting the obstacle degree of each index in a single evaluation unit, and the difference in performance of the same index in different cities cannot be compared vertically according to the obstacle degree of the same index.

6.5. Discussion

Urban and rural areas are an organic whole. Urban and rural development is not an either-or relationship, but a community of symbiotic prosperity and mutual support [61]. Urban–rural integration development is a comprehensive integrated development of economy, society and environment based on spatial layout optimization and institutional supply innovation. The urban–rural integration system is an urban–rural crisscross system formed by the intersection, penetration and integration of urban and rural regional systems [2,61]. Narrowing the gap between urban and rural areas and promoting balanced development between urban and rural areas is an important goal of urban–rural integration. It is also an important criterion to measure the success of urban–rural integration [33,61]. The process of urban–rural integration is the process of spatial, social, economic and ecological balance between urban and rural areas. Therefore, in the discussion of urban and rural integration development in this paper, urban–rural development balance will be a key point of measurement of development levels, and includes development level of multi-angle integration.
At the same time, urban–rural integration development emphasizes urban and rural interactions. Under the context of implementing rural revitalization strategies, urban and rural integration development has also implied the basic premise of “adhering to agricultural rural priorities” [61]. The evaluation model established in this paper not only considers comprehensive integration from four aspects of spatial integration, economic integration, social integration, and living environment, and simultaneously measure urban–rural integration development levels from the comprehensive development, urban–rural differences, and rural development, which considers both narrowing the urban–rural gap and rural revitalization, in order to achieve a more scientific urban–rural integration development level. From the perspective of evaluation method, some static indicators of urban and rural integration are adopted to measure the development level of urban and rural integration through statistical methods, and good results are obtained. At the same time, it has improved and led to innovation in the evaluation method, and a new evaluation mechanism is designed to effectively avoid some defects of the original method, enabling the evaluation model more generally, and effectively improved evaluation accuracy.
From Section 6.1, Section 6.2, Section 6.3, Section 6.4 , the development level of urban–rural integration in Hubei Province was evaluated and analyzed. Table 9 and Figure 4 directly show the level division and regional distribution of urban–rural integration degree in Hubei Province. It can be seen that the urban–rural integration development of cities in Hubei Province is at a moderate level on the whole, and the provincial capital city Wuhan is relatively uncoordinated with other cities in urban–rural integration development. In terms of regional distribution, it mainly presents the radiation feature with Wuhan as the center, and the urban–rural integration degree of cities near Wuhan is relatively high, and vice versa. Figure 5 shows the regional distribution of the urban–rural integration degree of each subsystem, and it can be seen that the urban–rural integration degree of each subsystem still generally presents radiation characteristics. Table 10 shows that the model established in this paper has a certain effectiveness and accuracy. Table 11 shows the cluster results of urban–rural integration development status of 15 cities in Hubei Province. The 15 cities were divided into “Social integration to be developed category”, “Spatial and living environment integration to be developed category”, “Spatial and social integration to be developed category” and “Comprehensive to be developed category”. It can be seen that the development advantages and disadvantages of each city are quite different, should be targeted for leaks to fill a vacancy. Table 12 and Figure 6 show the obstacle factor analysis results, and intuitively reflect the frequency distribution of obstacle factors in the urban–rural integration development in cities of Hubei Province. The indexes of proportion of built-up area, the number of beds per thousand people, density of organic town, per capita GDP, Engel coefficient ratio of urban and rural residents and population urbanization rate have higher obstacle degrees and appear more frequently, which should be emphasized for development.
From the perspective of Hubei Province as a whole, combining the results of obstacle factor analysis and the evaluation results of urban–rural integration development level, the performance of economic integration, social integration and living environment integration is relatively excellent. Especially, in the aspect of living environment integration, the living environment integration indexes of some cities have reached or approached the target level. It shows that Hubei Province has made great achievements in rural revitalization and improving rural living and environmental quality in recent years. At the same time, economic development and social coordination are the old advantages of Hubei Province, reflected in the quantitative performance of all those indexes, which have good results. However, the spatial integration degree, especially the proportion of built-up area and the density of organic town, still need to be strengthened. In terms of index properties, the obstacle degree of comprehensive development indexes is significantly higher than other indexes, so balanced development should be taken as the focus of the work to improve the level of urban–rural integration development. On the basis of steadily improving the level of comprehensive development, urban and rural development should be coordinated, the gap between urban and rural areas should be narrowed, and urban–rural cooperation should be strengthened [1].

6.6. Policy Implications

The integration of urban and rural development depends on the smooth flow of urban and rural human resources, material resources and financial capital elements. Its essence is the coordinated and integrated development of urban and rural areas based on the free flow and fair sharing of urban and rural elements [18]. Specifically, by optimizing the spatial layout of urban and rural areas, we can smooth the two-way flow channels of urban and rural resources, cultivate and develop growth centers and development axes at different levels, gradually form the spatial network of urban–rural integration development. Through the innovation of institutional supply, the system mechanism and policy system of two-way flow of urban and rural resources elements can be established, and the market can play a decisive role in resource allocation and the government’s macro-control role can be brought into play. The integration of urban and rural economy, society and environment can directly promote the development of rural economy, society and environment [61]. According to the above analysis, the countermeasures and policy implications for improving the development level of urban–rural integration in Hubei Province were proposed as follows:
First, expand the scope of development and construction, and accelerate the construction of non-agricultural production. As can be seen from Table 8, the level of urban–rural spatial integration in Hubei Province is relatively low. Figure 6 shows that the proportion of built-up area and the density of organic town rank first and third in the frequency of occurrence among the obstacle factors, respectively, which is important “short boards” for urban–rural integration development in Hubei Province. This result side reflects that Hubei Province still has great development potential, and emphasizes the importance of non-agricultural production and construction. Thus, we can take the following measures. (i) Accelerate the process of population urbanization, encourage the free flow of population, decentralize the development of suburbs, and increase the demand for construction land; (ii) promote the rational distribution of urban and rural industrial structure, guiding some enterprises with large demand for labor force to move to the marginal areas of urban and rural areas, giving full play to the role of idle rural labor force can not only save the cost of enterprises, but also increase the income of rural residents [11]; (iii) improve the planning and layout of public transport and main roads, so that the development of transport will provide opportunities for the use and expansion of land on and around the routes [62].
Second, optimize the allocation of urban and rural resources, and enhance the flow of factors between urban and rural areas. In Figure 6, the frequency of Engel coefficient ratio of urban and rural residents in the obstacle factor is relatively high, indicating that there is a big difference between urban and rural consumption and income level. Thus, the income channels of rural residents should be broadened, the rural surplus labor force should be reasonably coordinated, and the two-way free flow mechanism of urban and rural population should be implemented. In addition, while speeding up the process of urbanization, we can make some effective measures, that is, (i) promote the flow of high-quality urban labor force into the countryside through financial support and policy guidance; (ii) guide the rural surplus labor force into the city to solve the problems of high-quality labor shortage in rural areas and redundant rural surplus labor force; (iii) improve the land circulation system, and accelerate the process of agricultural production modernization; (iv) attract enterprises with advanced production technology to settle in rural areas to promote the development of local industries; and (v) increase financial support for rural construction and encourage the construction of social capital investment in rural industry projects [11].
Third, promote the construction of urban and rural infrastructure and the coordinated development of service supply. In Figure 6, the number of beds per thousand people rank second in the frequency of occurrence among the obstacle factors, indicating the lack of infrastructure construction. Thus, the emphasis of the government should increase the construction of medical facilities and the investment in rural infrastructure construction, and strongly strengthen the weak links. The government should also pay attention to the development of rural social security and gradually realize the integration of urban and rural social security system. Some other measures need to be taken, that is, increase investment in rural education and medical care, ensure sound facilities and equipment, guide high-quality education and medical talents to the countryside, promote the development of rural education, medical and health undertakings [11], etc.
Fourth, promote the ecological environment construction, and improve the rural living facilities. In Figure 5, the living environment integration degree of the six cities is still below the medium level. Therefore, it is necessary to vigorously promote the working process of living facilities projects, such as water supply project and sanitary toilet popularization, focus on monitoring areas where pollution occurs frequently, and make clear the lines of authority and responsibility in ecological environment protection, with zero tolerance for environmental pollution; the government should also strengthen the publicity of ecological civilization construction, guide rural residents to develop the habit of garbage classification treatment [11], promote green urban and rural construction in an all-round way, and promote the coordinated development of social economy and ecological environment.
In addition, from the view of the specific development direction of each city, different categories of cities should take different development measures. Category Ⅰ cities should focus on improving the degree of social integration, while maintaining the current level of urban–rural integration development, and focus on the development of individual weak board indexes. For example, Wuhan should focus on accelerating the construction of road network, narrowing the urban–rural income gap, and improving the guarantee of medical facilities and resources. Category Ⅱ cities should focus on improving the degree of spatial and living environment integration, such as speeding up road network construction, improving rural living facilities and environment, etc. Category Ⅲ cities should focus on improving the degree of spatial and social integration, such as expanding the scope of urban construction, improving the urban and rural social security system and the infrastructure construction, etc. Category Ⅳ cities should accelerate all-round development, and consider to increase the work on the index with the biggest obstacle degree, which is conducive to improving the efficiency of urban–rural integration development level. For each different city, the urban–rural integration development should be targeted, the obstacle factor and the obstacle degree should be taken as the basis of development, and the corresponding countermeasures to improve the index should be implemented according to the ranking of the obstacle degree.
To sum up, urban–rural development balance refers to the comprehensive balance of economic, social and environmental development benefits [61]. Under the background of rural revitalization and urban–rural integration, Hubei Province should take corresponding measures according to its own reality, that is, (i) expand the scope of development and construction, and accelerate the construction of non-agricultural production; (ii) optimize the allocation of urban and rural resources, and enhance the flow of factors between urban and rural areas; (iii) promote the construction of urban and rural infrastructure and the coordinated development of service supply; and (iv) promote the ecological environment construction, and improve the rural living facilities. Moreover, on the premise of all-round and comprehensive development, Hubei Province should focus on mutual assistance between urban and rural areas, supplemented by fixed-point assistance, steadily improve the economic development fundamentals, open up the flow channel of urban and rural factors, and realize the improvement of the quality of life of urban and rural residents. It is the development connotation of urban–rural integration to fully grasp the characteristics and relationships of urban–rural development and form an organism of urban–rural linkage, mutual benefit, and common prosperity.

7. Conclusions

In the context of new urbanization and rural revitalization strategy, how to promote urban–rural integration development has become an important issue in today’s society. According to the index data of urban–rural integration development of 15 cities in Hubei Province, this paper designed a novel evaluation mechanism of urban–rural integration development level, and evaluated and analyzed the urban–rural integration development level of Hubei Province. The main work is summarized as follows: (i) In accordance with the construction principles of the index system and the requirements of relevant documents, a new index system for evaluating the development level of urban–rural integration was established, and the rationality of the index system was tested by the correlation coefficient method and standard deviation method. (ii) The weight of each index in the index system was obtained by using the combination weighting method by combining the entropy weight method with the ranking method. The ideal solution was determined by the target value, which gave full play to the advantages of TOPSIS method. An improved TOPSIS method based on relative entropy and grey relational degree was presented to evaluate the development level of urban–rural integration. (iii) Using the index data of 15 cities in Hubei Province in 2020, an empirical analysis was carried out on the development level of urban–rural integration in Hubei Province, and the urban–rural integration degree of the 15 cities was obtained. The validity of the model was verified, and cluster analysis and obstacle factor analysis were used in the result analysis. Some conclusions were drawn about the urban–rural integration development status in Hubei Province, and some effective countermeasures and policy implications were put forward to improve the urban–rural integration development for Hubei Province.
However, due to the limitation of time and conditions, there are still many areas to be improved in this paper, for example, if the data of more years are used for comparison, the development rate of cities compared with the past may be obtained, which is helpful to grasp the development trend of urban–rural integration and put forward more efficient countermeasures and suggestions. In addition, the division of evaluation regions can be refined from the level of subordinate counties and even municipal districts in Hubei Province, and the index data of each region can be tracked and collected from the time level. The index data of other provinces in China can also be collected and compared with Hubei Province, so as to make a more detailed analysis of the overall development of urban–rural integration in Hubei Province.

Author Contributions

C.R., Conceptualization, methodology, formal analysis, supervision, writing—review and editing. Y.G., Investigation, data curation, software, writing—original draft. All authors have read and agreed to the published version of the manuscript.

Funding

This work is supported by the National Natural Science Foundation of China (Nos. 72071150, 71671135).

Institutional Review Board Statement

Not applicable.

Informed Consent Statement

Not applicable.

Data Availability Statement

The datasets generated and analyzed during the current study are available in the (Hubei Provincial Statistics Bureau) repository, (http://tjj.hubei.gov.cn/tjsj/sjkscx/tjnj/qstjnj/, accessed on 23 October 2021).

Acknowledgments

We would like to thank the editor and the anonymous reviewers for their helpful comments.

Conflicts of Interest

The authors declare that they have no competing interests.

References

  1. Qi, L.L. Comprehensive evaluation and analysis of urban-rural integration degree in central China. J. Jiangxi Univ. Financ. Econ. 2007, 4, 10–13. [Google Scholar]
  2. Liu, Y.S. Research on the urban-rural integration and rural revitalization in the new era in China. Acta Geogr. Sin. 2018, 73, 638–648. [Google Scholar]
  3. Wan, S.W. The Estimated and Assessed Study on the Regional Urban-Rural Integration—A Case of Henan Province; Tianjin University: Tianjin, China, 2006. [Google Scholar]
  4. Xiao, Q.Z.; Chen, L.; Xie, M.; Wang, C. Optimal contract design in sustainable supply chain: Interactive impacts of fairness concern and overconfidence. J. Oper. Res. Soc. 2021, 72, 1505–1524. [Google Scholar] [CrossRef]
  5. Chen, L.; Nan, G.F.; Li, M.Q.; Feng, B.; Liu, Q.R. Manufacturer’s online selling strategies under spillovers from online to offline sales. J. Oper. Res. Soc. Forthcom. 2021, 267, 65–77. [Google Scholar]
  6. Kang, Y.C. Urban and rural integration from the perspective of urban and rural integration. Theor. Explor. 2012, 1, 107–110. [Google Scholar]
  7. Torreggiani, D.; Dall’Ara, E.; Tassinari, P. The urban nature of agriculture: Bidirectional trends between city and countryside. Cities 2012, 29, 412–416. [Google Scholar] [CrossRef]
  8. Bjørkhaug, H.; Knickel, K. Rethinking the links between farm modernisation, rural development and resilience. J. Rural. Stud. 2018, 59, 194–196. [Google Scholar] [CrossRef]
  9. Che, B.Q.; Lu, Y.Q.; Wang, Y. Research on spatial form evolution of urban and rural integration development in Jiangsu province. Resour. Environ. Yangtze Basin 2017, 26, 1022–1031. [Google Scholar]
  10. Wang, Y. Problems and countermeasures of urban and rural integrated development in the new period. Contemp. Cty. Econ. 2010, 12, 62–64. [Google Scholar]
  11. Wang, G.Q.; Zheng, Y.Y. Problems and countermeasures of urban and rural integration in China. Jiang-Huai Trib. 2020, 5, 18–24. [Google Scholar]
  12. Yang, R.N. A preliminary study on the integration of urban and rural areas and its evaluation index system. Urban Res. 1997, 2, 19–23. [Google Scholar]
  13. Zeng, L.; Lei, J.; Lu, Q. Construction of evaluating indicator system of urban-rural interaction and the comparative analysis of regional urban-rural correlative-degree in China. Geogr. Res. 2002, 6, 763–771. [Google Scholar]
  14. Xiu, C.L.; Xu, D.M.; Zhu, X.L. Evaluation of urban-rural integration course in northeast China. Sci. Geogr. Sin. 2004, 3, 320–325. [Google Scholar]
  15. Zhou, X.X.; Liu, Y. Construction and application of evaluation index system of urban-rural integration development: A case study of Shandong Province. J. Shandong Univ. Financ. Econ. 2010, 1, 87–89. [Google Scholar]
  16. Tong, G.J.; Wang, T.K. The Estimated and assessed study on urban-rural integration course in northeast China. Future Wirel. Netw. Inf. Syst. 2012, 2, 637–644. [Google Scholar]
  17. Han, L.H.; Tong, G.J.; Shi, L. Comprehensive evaluation on the urban-rural Integration process within Harbin metropolitan area based on the grey multi-level evaluation model. Inform. Control Autom. Robot. 2012, 2, 803–806. [Google Scholar]
  18. Ma, L.B.; Liu, S.C.; Fang, F. Evaluation of urban-rural difference and integration based on quality of life. Sustain. Cities Soc. 2020, 54, 101877. [Google Scholar] [CrossRef]
  19. Bi, X.C.; Zhang, Z.F. Research on the relationship between the construction of evaluation index system of urban-rural integration in Jilin province and the “Belt and Road” initiative—Based on principal component analysis and ARDL model. J. Chang. Univ. Sci. Technol. 2020, 33, 112–118. [Google Scholar]
  20. Tzeng, G.H.; Huang, J.J. Multiple Attribute Decision Making Methods and Applications; CRC Press: Boca Raton, Fl, USA, 2011. [Google Scholar]
  21. Zhang, G.Y.; Sha, Y.; Liu, X.H. High dimensional cloud model and its application in multiple attribute evaluation. Trans. Beijing Inst. Technol. 2004, 12, 1065–1069. [Google Scholar]
  22. Wang, Y.M.; Que, C.P.; Lan, Y.X. Hesitant fuzzy TOPSIS multi-attribute decision method based on prospect theory. Control Decis. 2017, 32, 864–870. [Google Scholar]
  23. Lin, M.W.; Xu, Z.S.; Zhai, Y.L. Multi-attribute group decision-making under probabilistic uncertain linguistic environment. J. Oper. Res. Soc. 2017, 69, 157–170. [Google Scholar] [CrossRef]
  24. Garg, H. Multi-attribute group decision-making process based on possibility degree and operators for intuitionistic multiplicative set. Complex Intell. Syst. 2021, 1, 1–23. [Google Scholar] [CrossRef]
  25. Zhang, Z.G.; Hu, X.; Liu, Z.T. Multi-attribute decision making: An innovative method based on the dynamic credibility of experts. Appl. Math. Comput. 2021, 393, 125816. [Google Scholar] [CrossRef]
  26. Balezentis, T.; Streimikiene, D.; Siksnelyte-Butkiene, I. Energy storage selection for sustainable energy development: The multi-criteria utility analysis based on the ideal solutions and integer geometric programming for coordination degree. Environ. Impact Assess. Rev. 2021, 91, 106675. [Google Scholar] [CrossRef]
  27. Xing, L.; Hu, M.S.; Wang, Y. Integrating ecosystem services value and uncertainty into regional ecological risk assessment: A case study of Hubei Province, Central China. Sci. Total Environ. 2020, 740, 140126. [Google Scholar] [CrossRef]
  28. Su, C.J. Research on evaluation index system of urban-rural integration in Henan Province. Issues Agric. Econ. 2009, 30, 96–100. [Google Scholar]
  29. Jia, Y.F.; Shen, X. Discussion on the evaluation method and development path of “four-in-one” urban and rural integration—A case study of Taizhou city. Urban Planning Society of China. Urban Era, Collaborative Planning—2013 China Urban Planning Annual Conference Proceedings (12-Small Towns and Urban and Rural Integration). In Urban Planning Society of China; Shandong University Press: Qingdao, China, 2013; p. 9. [Google Scholar]
  30. Xie, H.; Hu, P.; Wang, X.P. Evaluation of urban-rural harmonious development in metropolis fringe area: A case study of Jiangning, Nanjing city. Urban Dev. Stud. 2010, 17, 66–71. [Google Scholar]
  31. Rao, C.J.; Goh, M.; Zhao, Y.; Zheng, J.J. Location selection of city logistics centers under sustainability. Transp. Res. Part D Transp. Environ. 2015, 36, 29–44. [Google Scholar] [CrossRef]
  32. Tian, C.; Peng, J.J.; Zhang, S.; Zhang, W.Y.; Wang, J.Q. Weighted picture fuzzy aggregation operators and their applications to multi-criteria decision-making problems. Comput. Ind. Eng. 2019, 137, 106037. [Google Scholar] [CrossRef]
  33. Han, K. Research on the Evaluation of Urban and Rural Integration Development Level in Qinghai Province; Qinghai University: Xining, China, 2020. [Google Scholar]
  34. Dodge, Y. The Concise Encyclopedia of Statistics; Springer: New York, NY, USA, 2008. [Google Scholar]
  35. Chen, R.Q.; He, L.; Yang, Q. Research on screening methods of indicators system on urban ecology-society-economy synthetical analysis. J. WUT 2018, 40, 151–157. [Google Scholar]
  36. Li, G.; Cheng, Y.Q.; Dong, L.Z. Study of the gini coefficient objective weights. Manag. Rev. 2014, 26, 12–22. [Google Scholar]
  37. Zou, Z.H.; Sun, J.N.; Ren, G.P. Study and application on the entropy method for determination of weight of evaluating indicators in fuzzy synthetic evaluation for water quality assessment. Acta Sci. Circumstantiae 2005, 4, 552–556. [Google Scholar]
  38. Rao, C.J.; Yan, B.J. Study on the interactive influence between economic growth and environmental pollution. Environ. Sci. Pollut. Res. 2020, 27, 39442–39465. [Google Scholar] [CrossRef] [PubMed]
  39. Tian, C.; Peng, J.J.; Zhang, S.; Wang, J.Q.; Goh, M. A sustainability evaluation framework for WET-PPP projects based on a picture fuzzy similarity-based VIKOR method. J. Clean. Prod. 2021, 289, 125130. [Google Scholar] [CrossRef]
  40. Chen, P.Y. Effects of normalization on the entropy-based TOPSIS method. Expert Syst. Appl. 2019, 136, 33–41. [Google Scholar] [CrossRef]
  41. Rao, C.J.; Lin, H.; Liu, M. Design of comprehensive evaluation index system for P2P credit risk of “three rural” borrowers. Soft Comput. 2020, 24, 11493–11509. [Google Scholar] [CrossRef]
  42. Rao, C.J.; Liu, M.; Goh, M.; Wen, J.H. 2-stage modified random forest model for credit risk assessment of P2P network lending to “Three Rurals” borrowers. Appl. Soft Comput. 2020, 95, 106570. [Google Scholar] [CrossRef]
  43. Ma, W.H.; Zhang, Q.; Ding, J.J. Fuzzy comprehensive evaluation of performance evaluation for secondary equipment in smart substation based on expert ranking method. In Proceedings of the 2019 Chinese Control and Decision Conference, Nanchang, China, 3–5 June 2019; pp. 6226–6230. [Google Scholar]
  44. Rao, C.J.; He, Y.W.; Wang, X.L. Comprehensive evaluation of non-waste cities based on two-tuple mixed correlation degree. Int. J. Fuzzy Syst. 2021, 23, 369–391. [Google Scholar] [CrossRef]
  45. Wen, J.H.; Wu, C.Z.; Zhang, R.Y.; Xiao, X.P.; Nv, N.C.; Shi, Y. Rear-end collision warning of connected automated vehicles based on a novel stochastic local multivehicle optimal velocity model. Accid. Anal. Prev. 2020, 148, 105800. [Google Scholar] [CrossRef]
  46. Kendall, M.G.; Smith, B.B. The problem of m rankings. Ann. Math. Stat. 1939, 10, 275–287. [Google Scholar] [CrossRef]
  47. Cao, W.; Pu, G.J. Application of fuzzy matter-element model in DSM evaluation based on AHP-entropy. Power Energy 2015, 36, 617–623. [Google Scholar]
  48. Zhao, M.; Qiu, W.H.; Liu, B.S. Relative entropy evaluation method for multiple attribute decision making. Control Decis. 2010, 25, 1098–1100. [Google Scholar]
  49. Mao, S.; Zhu, M.; Wang, X.; Xiao, X. Grey–Lotka–Volterra model for the competition and cooperation between third-party online payment systems and online banking in China. Appl. Soft Comput. 2020, 95, 106501. [Google Scholar] [CrossRef]
  50. Kuo, Y.Y.; Yang, T.H.; Huang, G.W. The use of grey relational analysis in solving multiple attribute decision-making problems. Comput. Ind. Eng. 2008, 55, 80–93. [Google Scholar] [CrossRef]
  51. Xiao, Q.Z.; Shan, M.Y.; Gao, M.Y.; Xiao, X.P.; Goh, M. Parameter optimization for nonlinear grey Bernoulli model on biomass energy consumption prediction. Appl. Soft Comput. 2020, 95, 106538. [Google Scholar] [CrossRef]
  52. Xiao, X.P.; Duan, H.M.; Wen, J.H. A novel car-following inertia gray model and its application in forecasting short-term traffic flow. Appl. Math. Model. 2020, 87, 546–570. [Google Scholar] [CrossRef]
  53. Xiao, Q.Z.; Gao, M.Y.; Xiao, X.P.; Guo, H. Evaluation of coordination degree between China’s technology and economy based on novel grey multivariate coupling model. Technol. Econ. Dev. Econ. 2021, 27, 24–44. [Google Scholar] [CrossRef]
  54. Rao, C.J.; Xiao, X.P.; Goh, M.; Zheng, J.J.; Wen, J.H. Compound mechanism design of supplier selection based on multi-attribute auction and risk management of supply chain. Comput. Ind. Eng. 2017, 105, 63–75. [Google Scholar] [CrossRef]
  55. Zhao, M.; Fang, C.H.; Chen, C. Re-theorizing and assessing integrated urban-rural development: An empirical study on China’s megacities. Urban Plan. Forum 2018, 2, 11–18. [Google Scholar] [CrossRef]
  56. Dou, W.S.; Wang, C.X.; Jiang, X. Study on the degree of urban-rural integration development in Shandong from the perspective of rural revitalization. J. Nat. Sci. Hunan Norm. Univ. 2019, 42, 1–8. [Google Scholar]
  57. Everitt, B.; Hothorn, T. An Introduction to Applied Multivariate Analysis with R.; Springer: New York, NY, USA, 2011. [Google Scholar]
  58. MacQueen, J. Some methods for classification and analysis of multivariate observations. In Proceedings of the Fifth Berkeley Symposium on Mathematical Statistics and Probability, Berkley, CA, USA, 27 December–7 January 1966; University California Press: Berkeley, CA, USA, 1967; Volume 1, pp. 281–297. [Google Scholar]
  59. Chen, Y.; Zhu, M.K.; Lu, J.L. Evaluation of ecological city and analysis of obstacle factors under the background of high-quality development: Taking cities in the Yellow River Basin as examples. Ecol. Indic. 2020, 118, 106771. [Google Scholar] [CrossRef]
  60. Jenks, G.F. The data model concept in statistical mapping. Int. Yearb. Cartogr. 1967, 7, 186–190. [Google Scholar]
  61. He, W.R. Urban-rural integration and rural revitalization: Theory, mechanism and implementation. Geogr. Res. 2018, 37, 2127–2140. [Google Scholar]
  62. Zhou, X.G.; Fu, Y.T.; Lang, W. The Evolution characteristics of built-up areas from compact city perspective and analysis of its influencing factors: A case study of Shanghai. Shanghai Urban Plan. Rev. 2021, 1, 91–97. [Google Scholar]
Figure 1. Methodology of the research in this paper.
Mathematics 10 00380 g001
Figure 2. Location map of Hubei Province.
Mathematics 10 00380 g002
Figure 3. Flow chart for evaluating the urban–rural integration development level.
Mathematics 10 00380 g003
Figure 4. Regional distribution of urban–rural integration degree.
Mathematics 10 00380 g004
Figure 5. Regional distribution of urban–rural integration degree of subsystems.
Mathematics 10 00380 g005
Figure 6. Frequency distribution of obstacle factors.
Mathematics 10 00380 g006
Table 1. Calculation method and significance of urban–rural integration evaluation indexes.
IndexCalculation MethodSignificance
Proportion of built-up area (PBUA)Built-up area/Total areaReflecting regional construction condition
Highway network density (HND)Total highway length/Total areaReflecting the level of spatial connection infrastructure in the region
Density of organic town (DOT)The number of organic towns/Total land areaReflecting the number and concentration degree of towns in the region
Per capita GDP(PCGDP)GDP/Regional permanent resident populationReflecting regional economic development comprehensive condition
Proportion of non-agricultural industries (PNAI)(Output value of secondary industry + Output value of tertiary industry)/Gross output valueReflecting the contribution degree of non-agricultural industry in regional economic development
Mechanical sowing area ratio (MSAR)Mechanical sowing area/Total sown area of cropsReflecting regional agriculture modernization level
Urban-rural income ratio (URIR)Disposable income of rural residents/Disposable income of urban residentsReflecting the urban–rural differences in income
Engel coefficient ratio of urban and rural residents (ECRURR)Urban Engel coefficient/Rural Engel coefficientReflecting the urban–rural differences in income and expenditure
Population urbanization rate (PUR)Urban population/Total populationComprehensively reflecting the level of regional urbanization
The number of beds per thousand people (NBPTP)(The number of bed/Total population) × 1000Reflecting the situation of regional health institutions and medical resources
The ratio of urban and rural subsistence allowances (RURSA)Minimum standards for rural subsistence allowances/Minimum standards for urban subsistence allowancesReflecting the difference between urban and rural areas in terms of minimum living guarantee
Proportion of tap water benefiting villages to the total number of villages (PTWBV)The number of villages benefiting from tap water/The total number of villagesReflecting the popularization of tap water supply
Coverage rate of sanitary toilets in villages (CRSTV)Village population using sanitary toilets/Total village populationReflecting the popularization of sanitary toilets in rural areas
Village garbage harmless disposal rate (VGHDR)The amount of waste treated harmlessly/Total amount of waste treatedReflecting the way of rural waste disposal and the status of sustainable development
Table 2. Evaluation index system of urban–rural integration development level.
Destination LayerSubsystemIndex LayerUnitIndex Property
Urban-rural integration development level (A)Spatial integration (B1)PBUA (C11)%CDL
HND (C12)km/km2CDL
DOT (C13)a/km2CDL
Economic integration (B2)PCGDP (C21)yuanCDL
PNAI (C22)%CDL
MSAR (C23)%RDL
URIR (C24)%URDC
ECRURR (C25)%URDC
Social integration (B3)PUR (C31)%URDC
NBPTP (C32)a/one thousandCDL
RURSA (C33)%URDC
Living environment integration (B4)PTWBV (C41)%RDL
CRSTV (C42)%RDL
VGHDR (C43)%RDL
Table 3. Correlation coefficient between indexes.
IndexC11C12C13C21C22C23C24C25C31C32C33C41C42C43
C111.00−0.230.560.630.260.160.050.190.660.310.140.300.270.22
C12−0.231.000.33−0.08−0.20−0.010.190.39−0.09−0.20−0.140.01−0.100.38
C130.560.331.000.470.250.080.330.640.55−0.13−0.080.200.300.40
C210.63−0.080.471.000.360.130.180.330.930.260.320.440.210.32
C220.26−0.200.250.361.00−0.03−0.28−0.170.540.570.47−0.02−0.210.06
C230.16−0.010.080.13−0.031.000.630.400.21−0.230.050.320.240.35
C240.050.190.330.18−0.280.631.000.630.10−0.64−0.220.370.380.37
C250.190.390.640.33−0.170.400.631.000.29−0.43−0.400.350.270.48
C310.66−0.090.550.930.540.210.100.291.000.410.360.310.190.37
C320.31−0.20−0.130.260.57−0.23−0.64−0.430.411.000.42−0.19−0.410.05
C330.14−0.14−0.080.320.470.05−0.22−0.400.360.421.00−0.260.18−0.09
C410.300.010.200.44−0.020.320.370.350.31−0.19−0.261.00−0.020.62
C420.27−0.100.300.21−0.210.240.380.270.19−0.410.18−0.021.000.00
C430.220.380.400.320.060.350.370.480.370.05−0.090.620.001.00
Table 4. Standard deviation of each index.
IndexStandard Deviation
C110.2472
C120.2490
C130.3436
C210.2622
C220.2295
C230.2850
C240.2922
C250.2494
C310.2380
C320.2507
C330.2972
C410.3400
C420.3230
C430.2619
Table 5. The results of three weighting methods.
IndexEntropy Weight MethodRanking MethodCombination Weighting Method
Proportion of built-up area (C11)0.17440.06410.1107
Highway network density (C12)0.05000.08200.0671
Density of organic town (C13)0.13700.06620.0998
Per capita GDP (C21)0.08310.08540.0882
Proportion of non-agricultural industries (C22)0.02760.08830.0517
Mechanical sowing area ratio (C23)0.05200.05540.0562
Urban-rural income ratio (C24)0.03950.09120.0629
Engel coefficient ratio of urban and rural residents (C25)0.08580.07750.0854
Population urbanization rate (C31)0.06320.10160.0839
The number of beds per thousand people (C32)0.10000.06870.0868
The ratio of urban and rural subsistence allowances (C33)0.04420.05160.0500
Proportion of tap water benefiting villages to the total number of villages (C41)0.04840.05370.0534
Coverage rate of sanitary toilets in villages (C42)0.06890.04960.0612
Village garbage harmless disposal rate (C43)0.02590.06460.0428
Table 6. Kendall’s coefficient of concordance check results.
Kendall’s Coefficient of Concordance Check
Total N20
Kendall’s W0.468
Chi-Square121.771
Degrees of Freedom13
Asymptotic Significance0.000
Table 7. The target value of the indexes in the evaluation index system.
IndexTarget Value
Proportion of built-up area (C11)10%
Highway network density (C12)4 (km/km2)
Density of organic town (C13)0.02 (a/km2)
Per capita GDP (C21)160,000 (yuan)
Proportion of non-agricultural industries (C22)98%
Mechanical sowing area ratio (C23)1
Urban-rural income ratio (C24)80%
Engel coefficient ratio of urban and rural residents (C25)1
Population urbanization rate (C31)80%
The number of beds per thousand people (C32)20 (a/one thousand)
The ratio of urban and rural subsistence allowances (C33)1
Proportion of tap water benefiting villages to the total number of villages (C41)1
Coverage rate of sanitary toilets in villages (C42)1
Village garbage harmless disposal rate (C43)1
Table 8. Evaluation results of urban–rural integration development level in Hubei Province.
CityUrban-Rural Integration DegreeSpatial Integration DegreeEconomic Integration DegreeSocial Integration DegreeLiving Environment Integration Degree
Ezhou0.54810.60800.65110.46520.6318
Enshi0.31990.32600.28280.38980.3319
Huanggang0.43360.44170.48910.40940.6755
Huangshi0.50400.45170.56860.72960.3198
Jingmen0.37190.24730.62930.44160.6455
Qianjiang0.45290.41550.63400.35060.7381
Shiyan0.32920.25650.40200.52510.3776
Suizhou0.37270.28130.60060.35360.6362
Tianmen0.47420.50760.57630.33930.7051
Wuhan0.65980.71170.72950.65010.7709
Xiantao0.48720.55780.62940.29120.4851
Xianning0.35610.31220.45990.43490.4783
Xiangyang0.43540.33230.67640.49200.3815
Xiaogan0.41070.39180.55000.39990.6612
Yichang0.39990.29630.60450.53250.6585
Table 9. Classification results of urban–rural integration development level.
CityUrban-Rural Integration Level
Ezhou2
Enshi5
Huanggang3
Huangshi2
Jingmen4
Qianjiang3
Shiyan5
Suizhou4
Tianmen3
Wuhan1
Xiantao2
Xianning5
Xiangyang3
Xiaogan4
Yichang4
Table 10. Comparison of ranking results of several models.
CityThe Established Model in This PaperTOPSIS MethodRelative Entropy MethodGrey Relational
Analysis Method
Improved Evaluation IndexRankingDistance ClosenessRankingRelative ClosenessRankingGrey
Relational Degree
Ranking
Wuhan0.659810.631510.676310.87081
Ezhou0.548120.380220.399220.82002
Huangshi0.504030.336930.320330.78176
Xiantao0.487240.330540.278240.78724
Tianmen0.474250.280250.248350.78245
Qianjiang0.452960.257160.206960.77939
Xiangyang0.435470.249180.180370.78068
Huanggang0.433680.229490.174780.770112
Xiaogan0.410790.252770.151090.78793
Yichang0.3999100.2282100.1239100.78107
Suizhou0.3727110.1813120.0965110.772510
Jingmen0.3719120.1856110.0941120.771211
Xianning0.3561130.1689130.0764130.756613
Shiyan0.3292140.1559140.0513140.742514
Enshi0.3199150.1346150.0408150.726615
Table 11. Results of cluster analysis.
CategoryCity
Ezhou, Wuhan
Huangshi, Xiangyang
Huanggang, Jingmen, Qianjiang, Suizhou, Tianmen, Xiantao, Xiaogan, Yichang
Enshi, Shiyan, Xianning
Table 12. Top five obstacle factors and obstacle degrees to urban–rural integration development in 15 cities of Hubei Province.
CityNo.1No.2No.3No.4No.5
EzhouC11 (23.44%)C32 (18.81%)C25 (12.40%)C31 (9.46%)C21 (9.37%)
EnshiC11 (11.03%)C13 (10.83%)C21 (10.60%)C25 (10.26%)C31 (10.09%)
HuanggangC11 (14.86%)C21 (14.35%)C31 (13.52%)C13 (12.45%)C32 (11.24%)
HuangshiC13 (15.01%)C11 (14.44%)C25 (12.93%)C42 (11.66%)C21 (10.91%)
JingmenC11 (17.93%)C13 (15.24%)C12 (11.50%)C32 (11.00%)C25 (10.88%)
QianjiangC13 (16.25%)C11 (15.26%)C32 (14.60%)C31 (10.11%)C22 (9.63%)
ShiyanC11 (15.29%)C13 (13.50%)C25 (11.99%)C21 (9.50%)C24 (8.83%)
SuizhouC11 (17.27%)C13 (15.28%)C32 (14.21%)C21 (12.08%)C31 (11.17%)
TianmenC11 (15.11%)C32 (14.34%)C21 (13.98%)C31 (12.04%)C13 (10.65%)
WuhanC12 (29.84%)C25 (24.87%)C32 (19.75%)C24 (13.05%)C23 (10.44%)
XiantaoC11 (19.01%)C32 (18.98%)C21 (11.47%)C31 (11.18%)C33 (10.93%)
XianningC11 (17.08%)C25 (12.17%)C13 (11.14%)C32 (10.35%)C21 (10.16%)
XiangyangC13 (17.79%)C11 (16.37%)C25 (11.32%)C32 (10.26%)C42 (8.74%)
XiaoganC11 (20.33%)C21 (14.26%)C32 (13.51%)C31 (9.88%)C41 (8.91%)
YichangC11 (20.89%)C13 (15.93%)C32 (10.33%)C25 (8.16%)C23 (7.79%)
Publisher’s Note: MDPI stays neutral with regard to jurisdictional claims in published maps and institutional affiliations.

