Article

Inverse Modeling of Grout Curtain Hydraulic Conductivity Evolution Considering the Calcium Leaching Effect

1
College of Water Conservancy and Hydropower Engineering, Hohai University, Nanjing 210098, China
2
State Key Laboratory of Hydrology-Water Resources and Hydraulic Engineering, Hohai University, Nanjing 210098, China
*
Author to whom correspondence should be addressed.
Mathematics 2022, 10(3), 381; https://doi.org/10.3390/math10030381
Submission received: 14 December 2021 / Revised: 20 January 2022 / Accepted: 24 January 2022 / Published: 26 January 2022
(This article belongs to the Special Issue Modeling and Simulation in Engineering)

Abstract

:
The calcium leaching effect inevitably increases the grout curtain hydraulic conductivity. It is diffucult to sample and obtain the leaching-related calculation parameters for deep-buried grout curtains. This study introduced the inversion method into the calcium leaching analysis to get proper leaching-related calculation parameters and accurate results. An inverse analysis model was proposed using the genetic algorithm (GA) and finite element analysis technology to solve the calcium leaching problems. The objective function is constructed using the hydraulic head and leakage quantity time-series measurements, which improves the uniqueness and reliability of the inverse results. The proposed method was applied to the inverse analysis of the hydraulic conductivity evolution of the grout curtain in a concrete dam foundation. The predicted water heads and leakage quantity are consistent with the monitored data, indicating the rationality of this simulation. The grout curtain hydraulic conductivity prediction in 100 years is also presented. The results illustrate the feasibility of the proposed method for determining leaching-related parameters and the hydraulic conductivity prediction in the leaching process.

1. Introduction

In grouting projects, cement slurry is injected into rock fractures to improve the foundation engineering properties such as permeability, strength, and deformation resistance [1,2,3]. Hydraulic conductivity is a crucial hydrologic parameter of the grout curtains and foundation rock. For foundation rocks, the hydraulic conductivity is generally not changed with time, while for the grout curtains and concrete face slabs, the hydraulic conductivity is constantly changed under the effect of calcium leaching [4]. Calcium leaching occurs when the calcium compounds in the cement matrix dissolve in a low pH or alkaline solution. In the calcium leaching process, the decomposition of calcium hydroxide (CH) and calcium silicate hydrate (C-S-H) significantly degrade the cement-based material engineering performance. For example, the Fengman concrete gravity dam has been demolished and reconstructed for severe calcium leaching and leakage issues. The annual average leached quantity of the dam body is about 9.6 t, and the dam foundation is about 8.0 t [5]. After nearly 40 years of operation, the overall concrete slabs strength of the Gutianxi flat-slab buttress dam decreased from 49.6 MPa to 37.9 MPa, by 23.6% [6].
The simulation of the leaching process could guide the safe operation of the project. Many scholars have studied the modeling of the leaching process. Gerard et al. [7], Wan et al. [8,9], and Phung et al. [10] proposed different solid−liquid equations for diffusion-driven leaching. For advection-diffusion-driven leaching, Ulm et al. [11] proposed a calcium compound decomposition rate equation based on the chemo-poro-plasticity theory. Gawin [12,13] adopted this equation and proposed a pure water hydro-chemo-mechanical leaching model of concrete. Calcium leaching significantly increased the hydraulic conductivity of cement-based materials. The reported data show that the hydraulic conductivity of the leached cement paste specimen increased by three orders of magnitude [14].
The hydraulic conductivity is often defined as a function of porosity in leaching simulations. Saito [15] proposed an exponential formula between porosity and permeability. This equation works well in accelerated electrochemical tests on mortars and was adopted by Gawin [12,13]. To better understand the leaching effect on the increase in hydraulic conductivity, the evolution of pore structures should be considered. The Kozeny−Carman (KC) relation introduced microstructure parameters into permeability, including the channel shapes, specific surface areas, and tortuosity [16]. This relation could provide a more accurate characterization of hydraulic conductivity, and has been widely used in cement-based materials [17,18,19,20]. Phung [10] adopted the Kozeny−Carman (KC) relation for modeling the cement pastes hydraulic conductivity evolution in the leaching process. However, it is difficult to obtain the correct calculation parameters in the KC relation. On the one hand, no calcium leaching test is carried out to determine the parameters. On the other hand, it is not easy to obtain samples for testing as the anti-seepage structures such as concrete core walls and grout curtains are deeply buried.
Inverse modeling is an alternative way to obtain the numerical calculation parameters. Extensive studies have shown the efficiency of inverse modeling for determining the hydraulic conductivity of foundation rocks and seepage-proof systems [21,22,23,24,25,26,27,28]. Most previous studies pursue steady or transient flow conditions in the inverse calculation of aquifer parameters. These studies are generally aimed at seepage problems or fluid−structure interaction problems [29,30], and the calcium leaching effect is not considered. Under the calcium leaching effect, deterioration of the grout curtain will lead to an increase of up-lift pressure and leakage, and endangered dam safety and benefits. At present, there is no research on applying the inverse modeling method to predicting grout curtain hydraulic conductivity. Furthermore, the parameters that are to be inversed in the calcium leaching process are still unknown.
The present study aimed to determine the calcium leaching parameters and predict the hydraulic conductivity evolution of grout curtains in the leaching process. Thus, a new inverse modeling approach is proposed considering the interaction between transient flow and calcium leaching. The genetic algorithm (GA) is adopted to reduce the computational cost. The proposed procedure is applied to the inverse modeling of a grout curtain degradation induced by calcium leaching in the foundation of a concrete gravity dam. Combined with site characterization data, the calcium leaching parameters are obtained. The hydraulic conductivity evolution of the grout curtain in 100 years is also presented.

2. Calcium Leaching Effect on the Grout Curtain

2.1. Calcium Leaching in the Grout Curtain

The main chemical reactions equations of the calcium leaching process are given in Equation (1) [31,32]:
Ca ( OH ) 2     Ca 2 + + 2 OH n CaO SiO 2 nH 2 O     n Ca 2 + + H 3 SiO 4 + [ 2 n     1 ] H 2 O
The calcium ions in the pore solution of the grout curtain are assumed to be in thermodynamic equilibrium with the calcium compound in the cement materix [7]. When the Ca2+ ion concentration decreases below 22 mol/m3, CH starts to decompose; when the calcium ion concentration is lower than 19 mol/m3, C-S-H starts to decay [10]. Decomposition of calcium compounds increases the grout curtain porosity and hydraulic conductivity, degrading the anti-seepage performance.

2.2. Characterization of Hydraulic Conductivity Evolution

To characteristic the mortars hydraulic conductivity evolution in the leaching process, Saito [15] proposed an exponential relation between porosity and hydraulic conductivity. This formula works well in accelerated electrochemical tests on mortars and has been adopted by Kuhl [31,32] and Gawin [12,13]. However, the pore structures of the cement-based materials are not considered in this relation. The Kozeny−Carman model introduces the hydraulic radius and tortuosity, which characterizes the pore space geometry into the hydraulic conductivity of the cement-based materials, as shown in Equation (2) [10].
K = χ φ 3   ( 1     φ ) 2 χ = 1 τ 2 S a 2 F s  
where K is the permeability coefficient (m2), χ is the microstructure parameter (m2), φ is the capillary porosity, τ is the tortuosity, S a is the specific pore surface (m2/m3), and F s is the shape factor.
Phung [10] introduced the lumped term Ω to calculate the shape factor F s and tortuosity τ . The lumped term Ω is defined in Equation (3).
Ω = 1 τ 2 F s Ω 0 = 1 n Ω l Ω = Ω 0     ( Ω 0     Ω l )   d l 2
where Ω 0 and Ω l are the lumped term for intact and leached materials, respectively, and d l is the degradation degree. The degradation degree is defined as the ratio between the current CH content and the initial values, as shown in Equation (4) [10].
d l = 1 , C CH C CH 0   C CH = 0 ,   C CH   >   0  
where d l is the leaching degree, and C CH 0 and C CH are the initial and current concentrations of CH, (mol/m3), respectively.
Due to the solid skeleton dissolution, the porosity of the grout curtain increases according to Equation (5) [12,13].
φ = φ 0 + φ φ = M diss ρ diss 1 η A s dt
where φ and φ 0 are current and initial porosity of the grout curtain, respectively; φ is the increase of the grout curtain porosity due to the leaching process; M diss ρ diss is the average molar volume of dissolved components of the solid skeleton (in this study, M diss ρ diss is taken as 0.056 mol/m3); η is determined by the micro-diffusion of the Ca2+; and As is the chemical affinity.
In this study, the inverse parameters are presented in Table 1. Among them, lumped term and initial specific pore surface are related to the initial hydraulic conductivity—lumped term increased times n is the parameter that controls the increase of hydraulic conductivity due to the decomposition of CH. The leached specific pore surface controls the increase of hydraulic conductivity due to decomposition of CH and C-S-H. The lumped term increase times, and initial and leached specific pore surface ranges are taken from Phung’s test results. More details are presented in reference [10]. The rock hydarulic conductivity range is determined by the water pressure test.

3. The Objective Function

To improve the accuracy of the inverse modeling, this study utilizes the time-series measurements of both the piezometric head and leakage quantity. Suppose that the number of hydraulic conductivities of different rock layers yet to be determined is m , and vector K is defined to denote the hydraulic conductivities of the medium with K = [ k 0 ,   k 1 ,   k 2 ,   ,   k m ] T , in which k 1 ~ m is the hydraulic conductivity of the ith rock layer. M denotes the number of piezometers in the domain, and H i m = [ H i 1 m ,   H i 1 m ,   H i 1 m ,   ] T ( i = 1 ,   2 ,   ,   M ) denotes the time series measurements at piezometer i, where H i m is the measured water head at piezometer i and at time t. Similarly, the leakage measured is denoted by L, and the time-series measurements from the measuring weir are L j m = L 1 m ,   L 2 m ,   L 3 m ,   ,   ( j = 1 ,   2 ,   3 ,   ,   N ) , where L j m is the leakage measurement at time N. The objective function for the inverse problem is defined in Equation (6)
min   f = w H i = 1 M || H i ( K )     H i m || 2 2 || H i m || 2 2 1 2 + w L j = 1 N || L j ( K )     L j m || 2 2 || L j m || 2 2 1 2 w H + w L = 1 . 0 K low   <   K   <   K up  
where || || 2 is the Euclidean norm of a vector, and H i ( K ) and L j ( K ) are the time series results of the water head at piezometer i and leakage quantity numerically obtained with a given parameters vector K, respectively. w H and w L are the weight coefficient to ensure a balance of the relative errors of the measured water head and leakage quantity, respectively. In this study, the weights of the measured water head and leakage quantity are assumed to be the same. The sum of w H and w L equals 1.0. K low and K up represent the lower and upper bounds of the possible hydraulic conductivity values of the rock layers and grout curtains. respectively.
The objective function defined in Equation (6) requires the best fit of the time series measurements of both the water head and the leakage quantity. This study assumes the hydraulic conductivity of the rock layer is an isotropic constant, while for the grout curtain, the hydraulic conductivity increases over the leaching time. This study adopts the Kozeny−Carman (KC) relation to model the grout curtain hydraulic conductivity evolution in the leaching process. The porosity is chosen as the coupling parameter to connect the calcium leaching effect and hydraulic conductivity. The KC relation contains the lumped term for sound materials Ω 0 , lumped term increased times n, initial and leached specific pore surface S a 0 and S al . These parameters have significant impacts on the grout curtain hydraulic conductivity evolution. This study aims to obtain the representative values of these parameters. In addition, the hydraulic conductivity of the rock layer should also be inversed.

4. Calcium Leaching Model

4.1. Basic Assumptions

Calcium leaching in concrete dams is a complex process that involves the decomposition of multiple components such as CH, C-S-H, ettringite, and un-hydrated cement particles. The leached Ca2+ ions may react with carbon dioxide in the air to form CaCO3. To simplify the problem, the following assumptions are applied:
(1)
The cement has been completely hydrated, the influence of the rehydration and the leaching of un-hydrated cement particles are ignored;
(2)
Only the decomposition of CH and C-S-H are considered;
(3)
Ca2+ ions in the solution are not reacting to form any new compounds;
(4)
As the grout curtain is deep-buried in the foundation, the materials are and remain saturated over time, and the isothermal conditions are also preserved;
(5)
The flow in the grout curtain is laminar, and Darcy’s law could describe the flow rate.

4.2. Governing Equation

The governing equations of the advection-diffusion driven leaching in the concrete dams are presented in Equation (7) [33].
u =   k ρ g P ( ε p ρ ) t + ρ u = Q m   c t + D c + u c = R  
In this Equation, u is the flow rate (m/s), k is the permeability (m2), ρ is the water density (kg/m3), g is the gravitational acceleration (m/s2), P is the pore water pressure (Pa), ε p is the porosity, t is the time (s), Q m   is a mass source term (kg/(m3·s)), c is the Ca2+ ions concentration of the species (mol/m3), D is the diffusion coefficient (m2/s), and R is the chemical reaction rate (mol/(m3·s)).
The chemical reactions in the leaching process are the decomposition of the calcium compounds in the solid skeleton. The decomposition rate is presented in Equation (8) [11,12,13]:
s Ca t = 1 η A s η = RT τ leach A s = RT ln c Ca c Ca eq     S Ca eq S Ca κ ( s ¯ ) d s ¯ κ s Ca = RT c Ca ds Ca dc Ca 1
In this equation, s Ca is the calcium content in the cement materix (mol/m3), η is the micro-diffusion of Ca2+ ions (mol/(J·s)), A s is the chemical affinity (J/m3), R is the gas constant (J/(mol·K)), T is the temperature (K), τ leach is the characteristic time of leaching s, c Ca is the Ca2+ ion concentration in the pore solution (mol/m3), ( c Ca eq , s Ca eq ) is the equilibrium concentration, and κ ( s Ca ) is the equilibrium constant.

4.3. Diffusivity

Bentz [34,35,36] proposed the effective diffusion model for cement-based materials. We can calculate the effective diffusivity from cement hydration and the water−cement ratio. Bentz’s model holds for a standard non-leached cement matrix. For leached cement-based materials, Van Eijk and Brouwers [37] proposed a revised formula, as seen in Equation (9).
D e D 0 = 0.0025     0.07 φ c ( x , 0 ) 2     1.8 H ( φ c ( x , 0 )     0.18 ) ( φ c ( x , 0 )     0.18 ) 2 + 0.14 φ c ( x , t ) 2 + 3.6 H ( φ c x , t     0 . 16 ) ( φ c x , t     0.16 ) 2 = D ( φ )
where φ c x , 0 is the initial capillary porosity, H ( ) is the Heaviside function, and φ c x , t is the capillary porosity. D0 is the diffusivity of Ca2+ ion in water, D0 = 4.5 × 10⁻¹⁰ m2/s.
Equation (9) has been widely used in calcium leaching simulations, such as by Wan [8,9]. In this study, we also adopted this equation.

5. Hydraulic Conductivity Prediction Model Optimized by GA

5.1. Genetic Algorithm

The genetic algorithm (GA) is a free-derivative method based on natural selection and evaluation [38]. The genetic algorithm has been widely used as an optimizing tool in many engineering problems, including in dam seepage inverse analysis [39,40,41,42,43]. This study adopted GA to obtain the globally optimal hydraulic conductivity of rock layers and grout curtains. The population size was 50, the function tolerance was 1.0 × 10⁻⁶, and the constraint tolerance was 0.001. In this way, the objective function of Equation (6) is minimized, and reasonable results can be obtained.

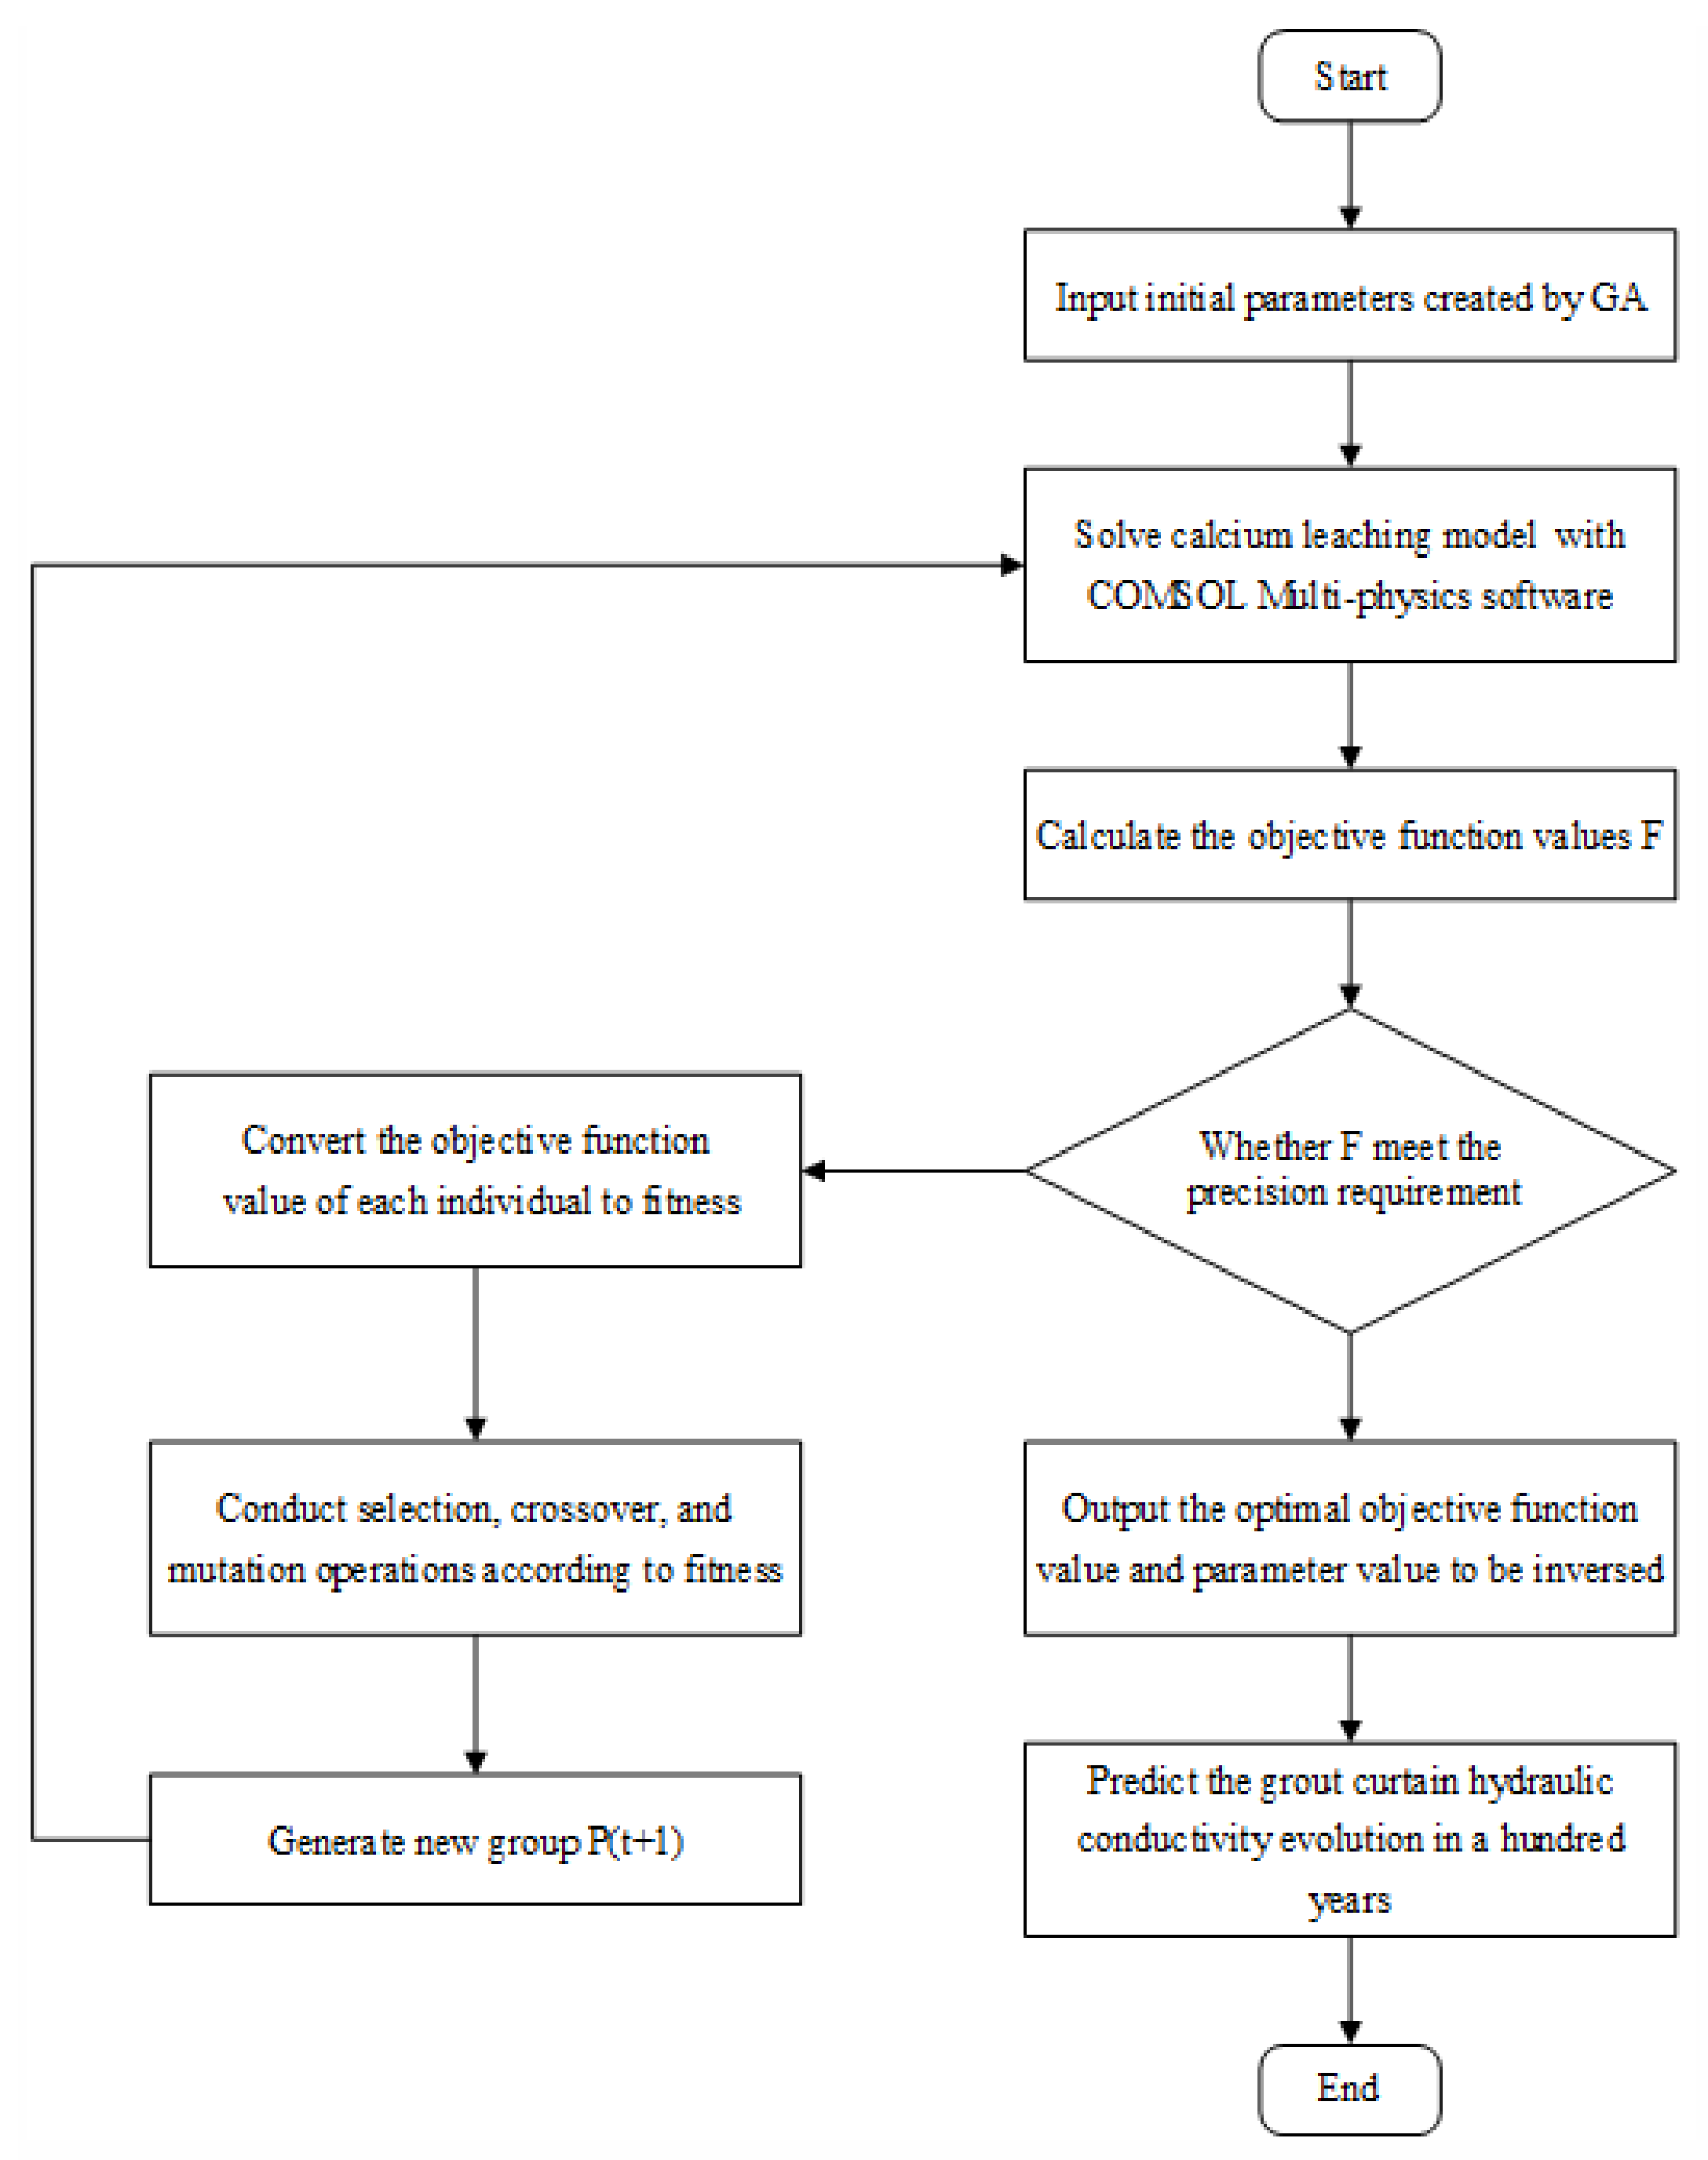
5.2. Mathematical Framework of the Model

The procedure for the inversion of the parameters is shown in Figure 1. The calcium leaching inverse model of the coupled seepage and chemical reactions are numerically solved with COMSOL, compiled with Matlab software. The calculations steps are presented as follows:
  • Step 1: Input all the initial parameters, including the materials property, initial and boundary conditions, and the variation range of the parameters to be inversed;
  • Step 2: Solve the calcium leaching model and obtain the seepage characteristics;
  • Step 3: Calculate the objective functions value F and evaluate the precision requirement;
    Step 4: Generate the new solvable groups according to the operational approach of the GA;
  • Step 5: Steps (2) to (4) are repeated until the objective functions meet the precision requirements;
  • Step 6: Output the optional objective function values and predict the grout curtain hydraulic conductivity evolution.
Figure 1. Flowchart of the inverse modeling.
Mathematics 10 00381 g001

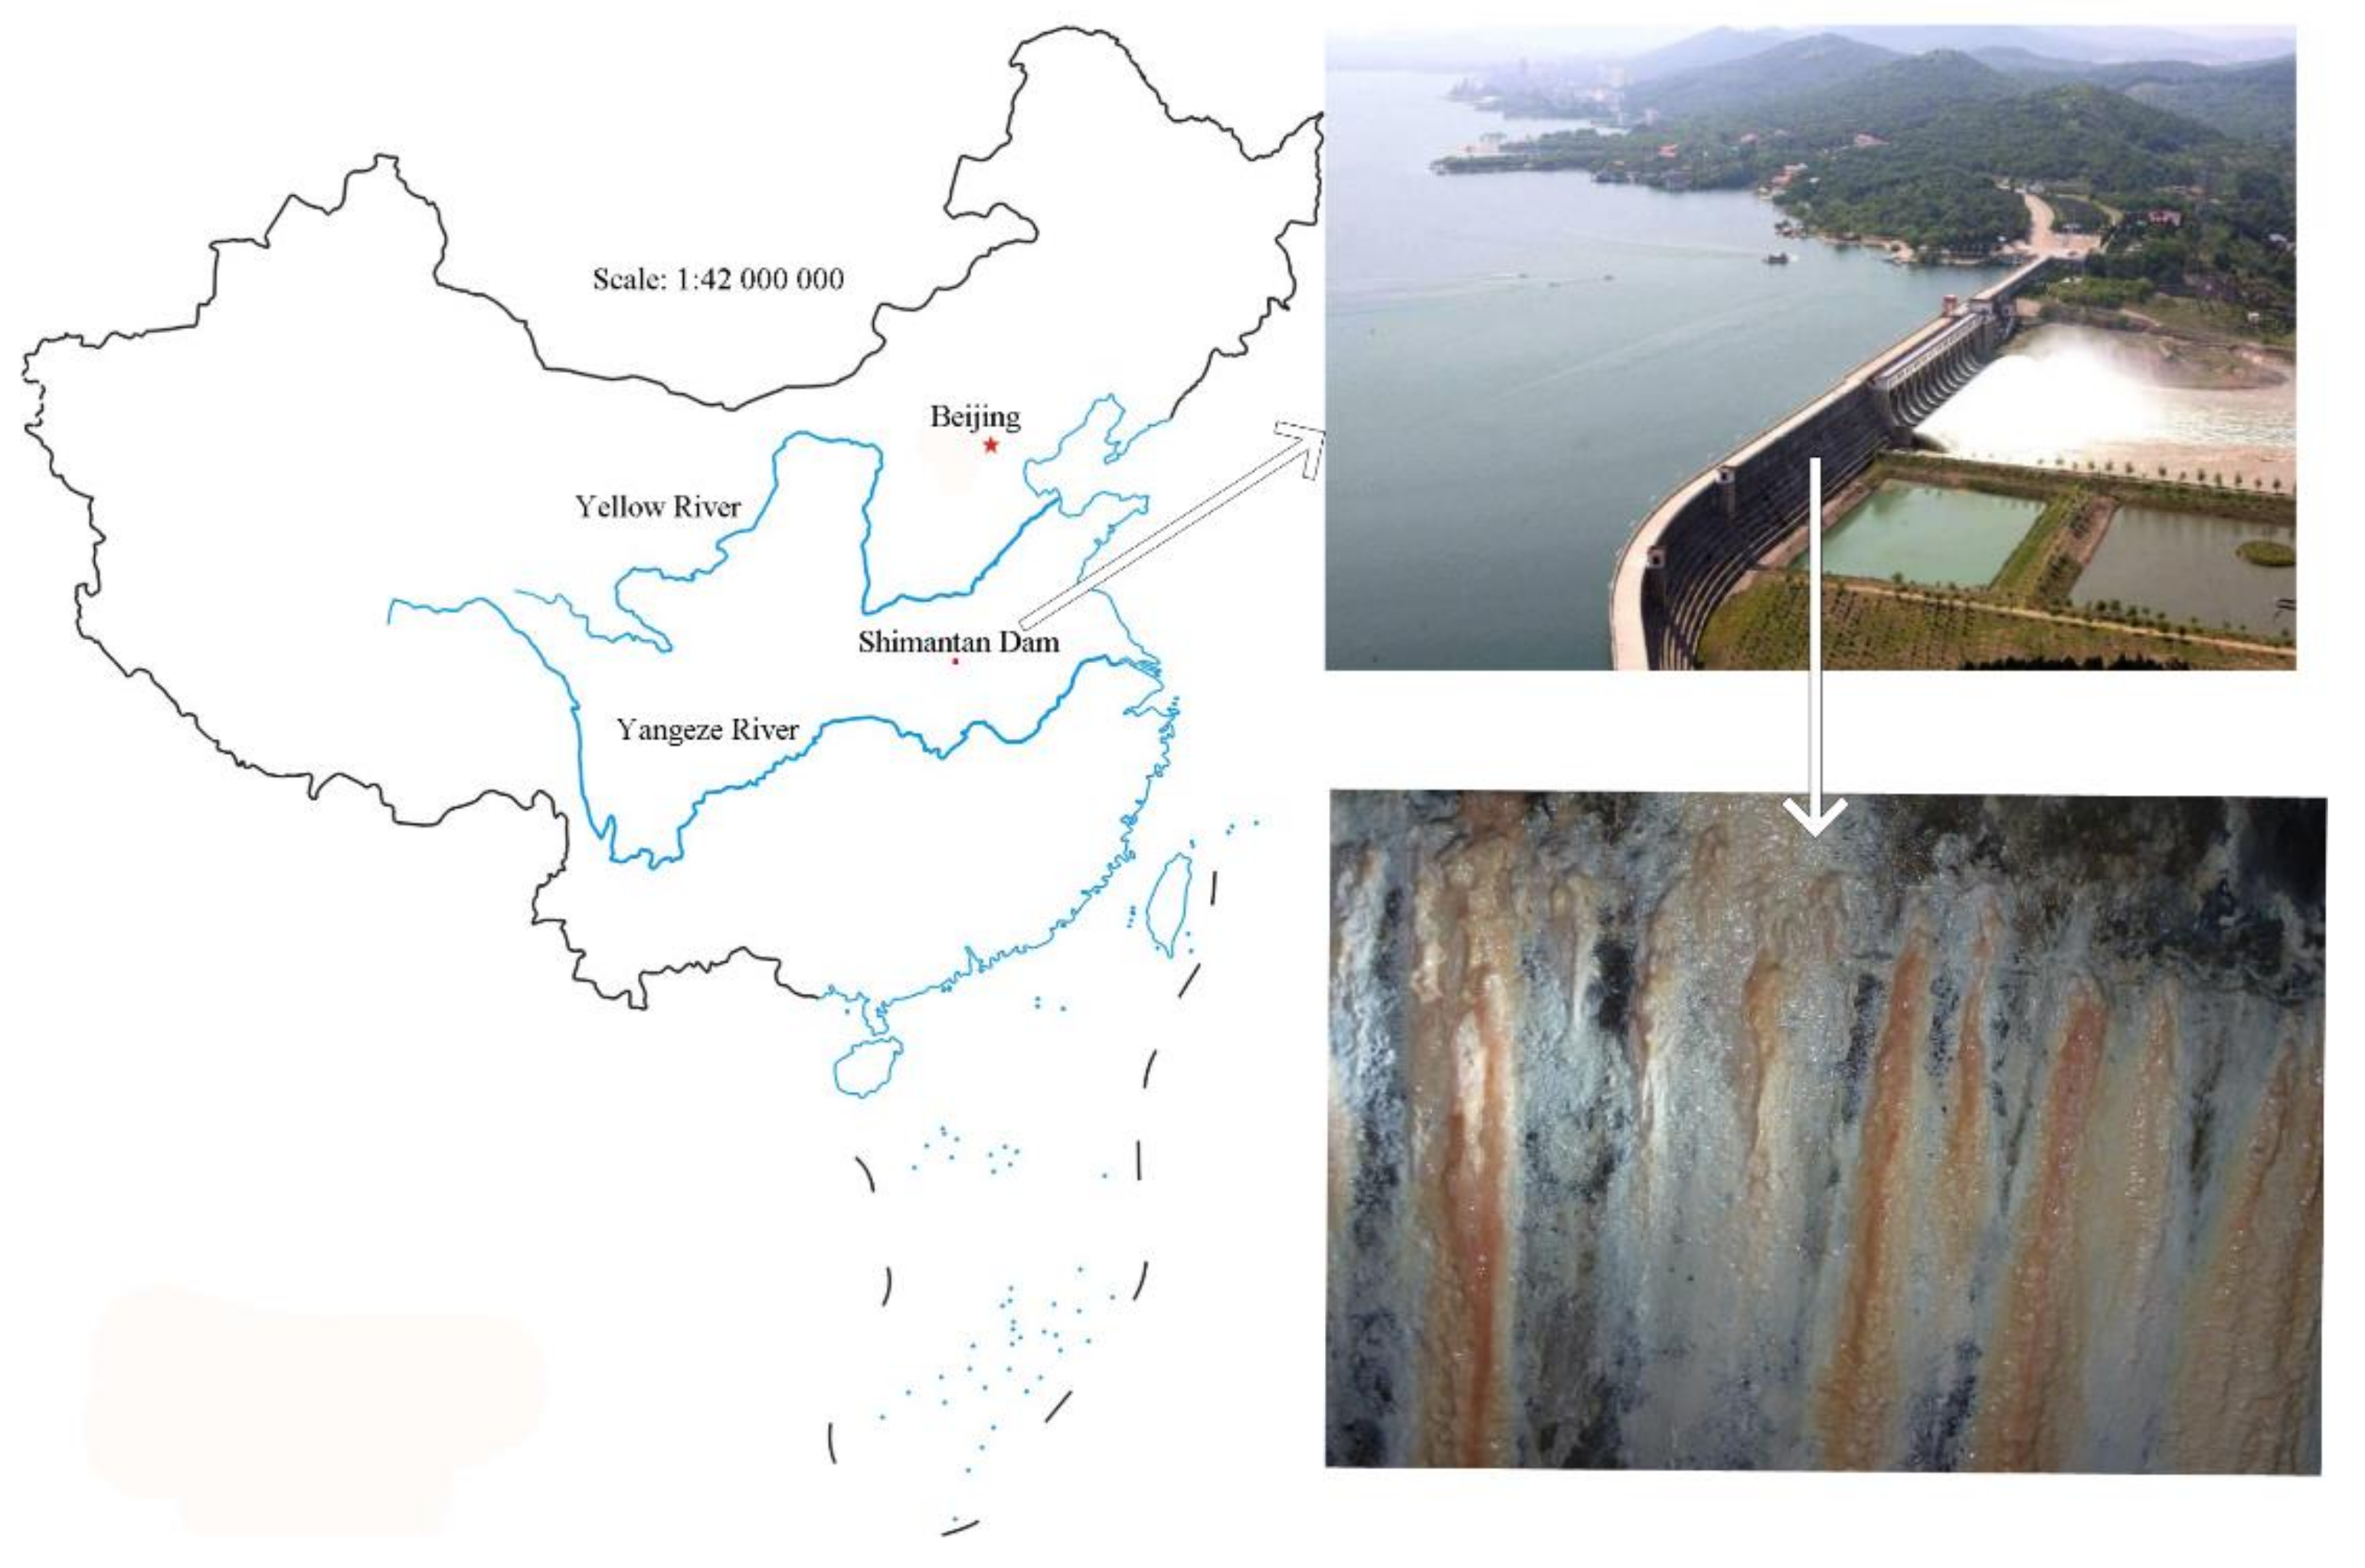
6. Application: A Case Study of the Shimantan Concrete Gravity Dam

6.1. General Description

The Shimantan reservoir is located in Wugang City, Henan Province. The Shimantan dam is a complete roller compacted concrete (RCC) gravity dam with a height of 40.5 m. The maximum width of the dam body is 31.74 m. There are 22 dam sections, with a total length of 645 m. The Shimantan dam started to store water in 1997. The dam foundation is composed of quartz sandstone. The longitudinal wave velocity of the foundation rock is varied from 4000 m/s to 5000 m/s, and is regarded as a relatively uniform elastomer. After 16 years of operation, a severe calcium leaching phenomenon was observed. The location and the calcium leaching phenomena in the corridors of the Shimantan dam are presented in Figure 2.

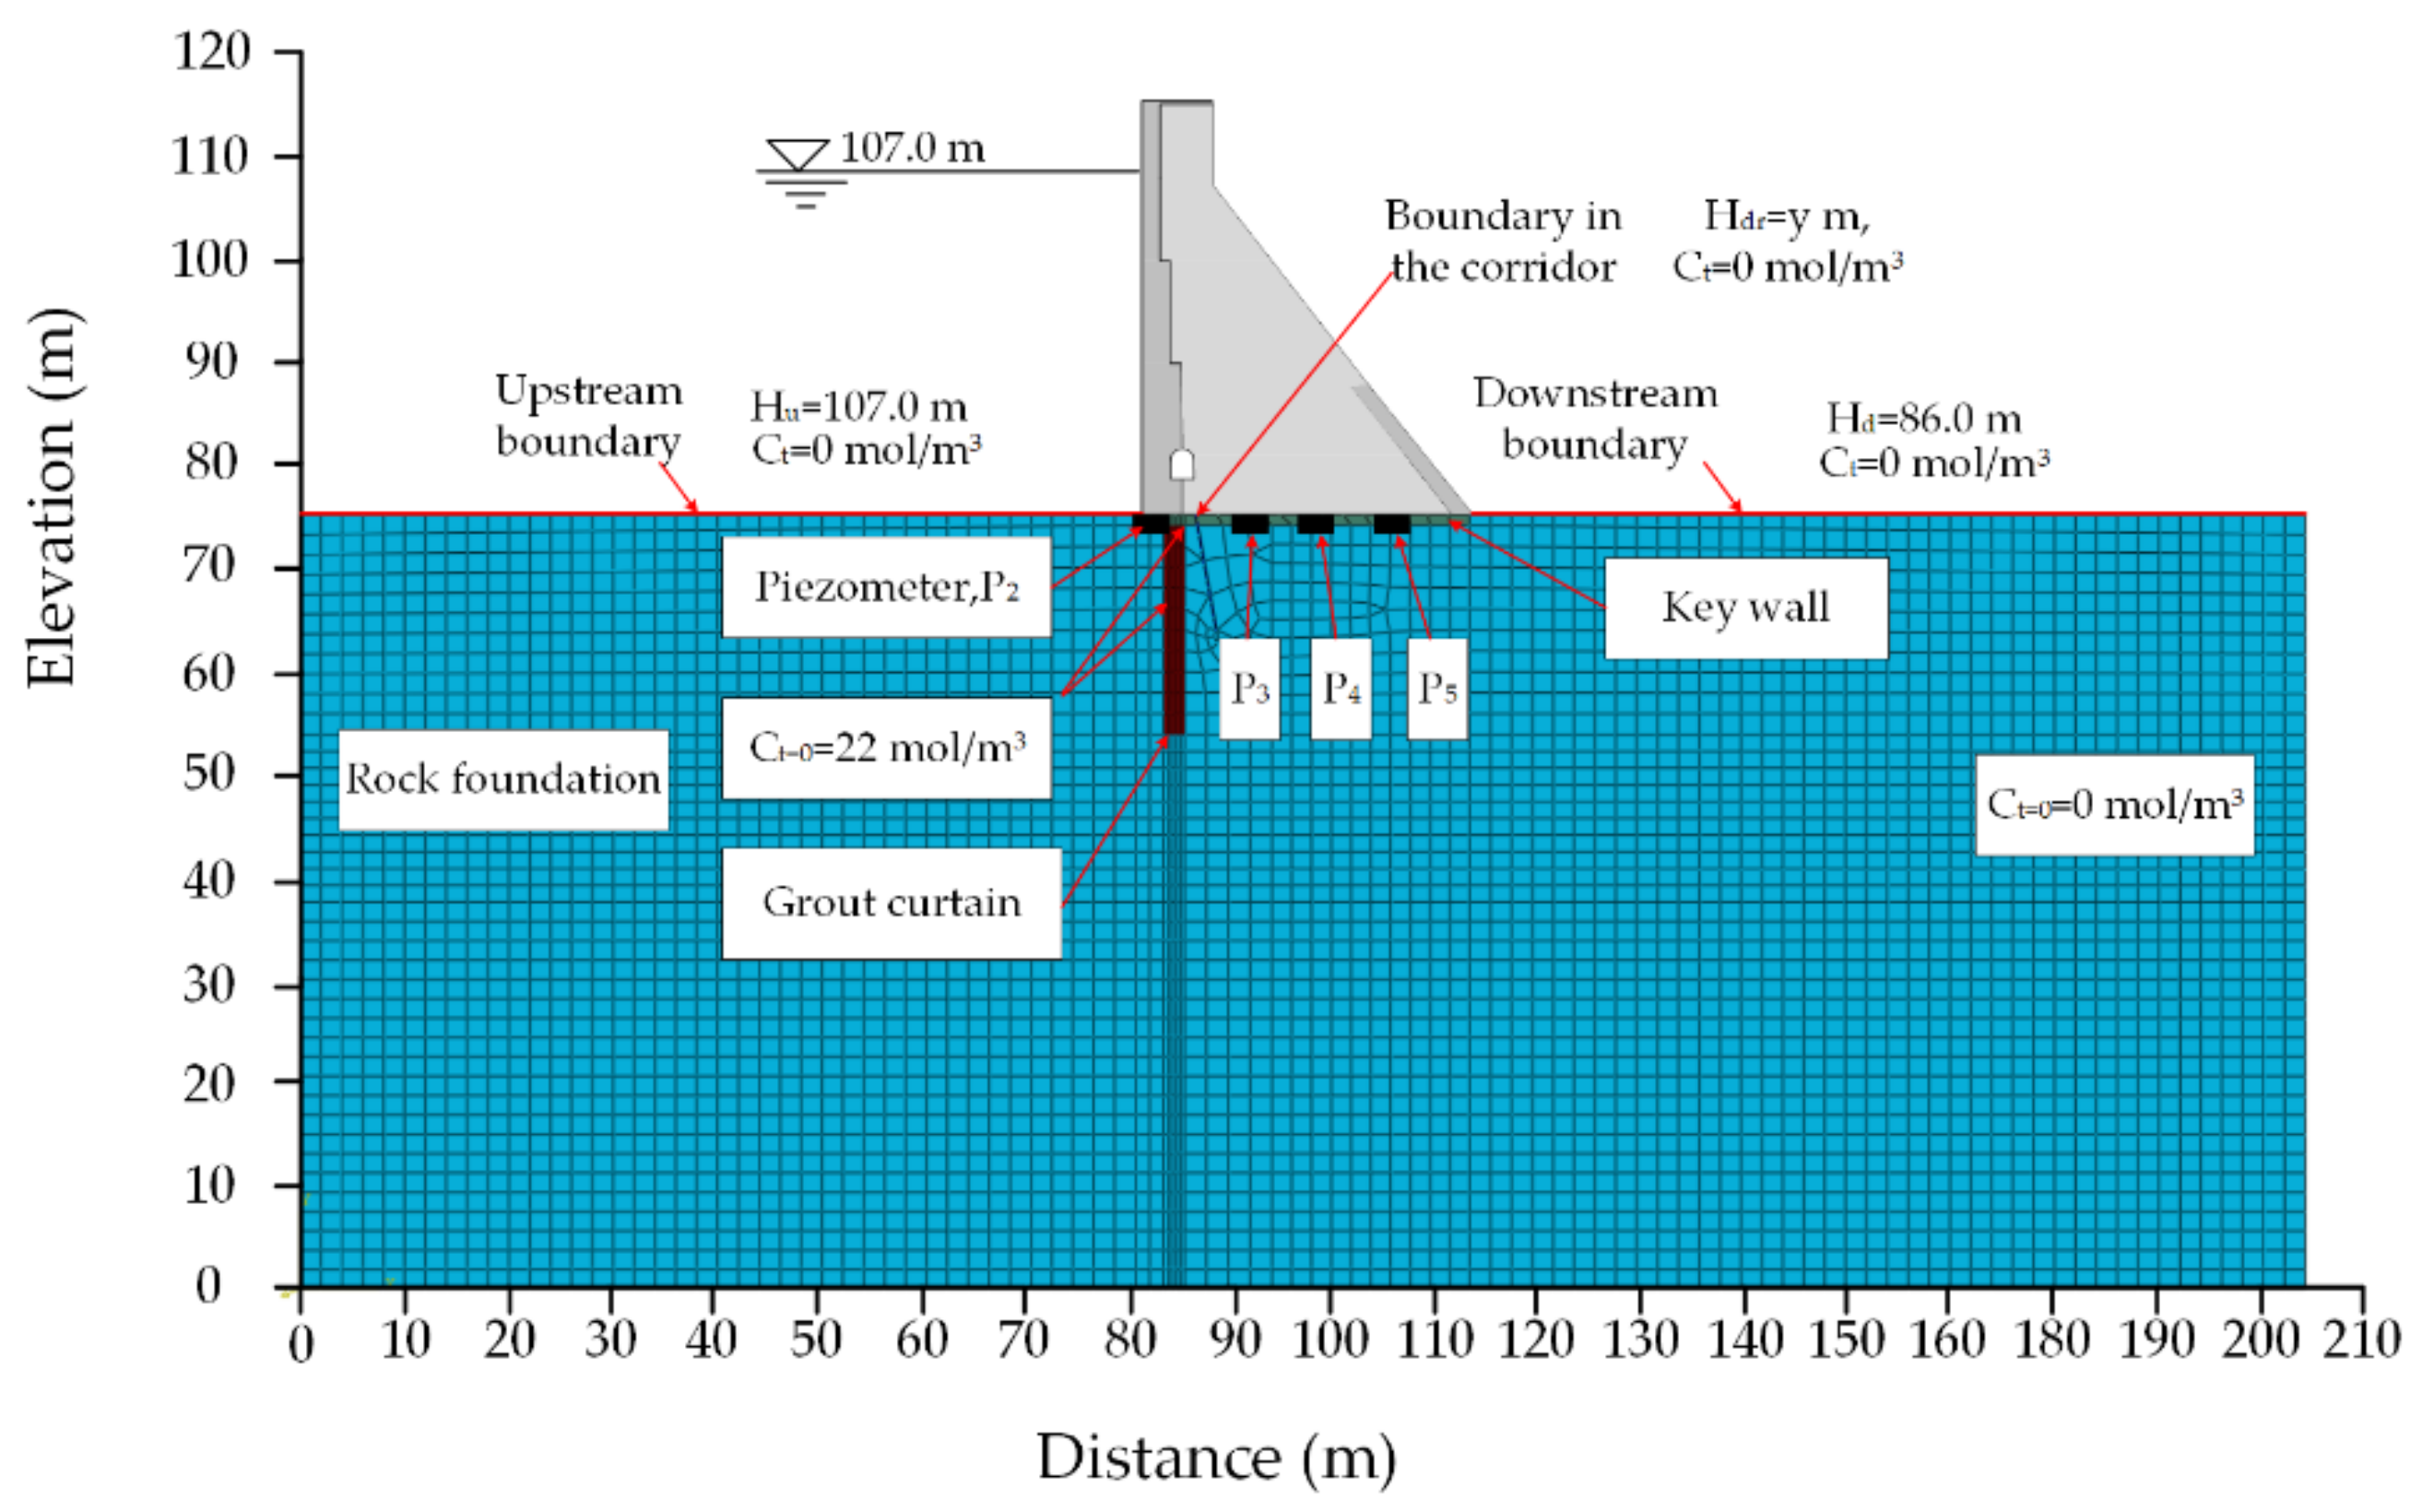
6.2. Computational Model

In this study, the foundation of the Shimantan dam is taken as an example to verify the proposed model. The finite element model of the Shimantan dam foundation is built based on actual size. We extended the foundation two times the dam’s height at both the upstream and downstream sides of the dam. The foundation’s height is considered two times the dam’s height. The thickness of curtain grouting is 2 m and reaches into slightly weathered rock by 3 m. The key wall is located at the top of the curtain, with a 32 m and a thickness of 1m. This study simplifies the key-wall and rock foundation’s bonded surface into straight. In total, 4157 finite elements are used in this model. The maximum element width is 2.5 m, and the minimum element width is 0.1 m. The finite element meshes of the model are presented in Figure 3. The finite elements families used in this study are four-node convection/diffusion quadrilateral elements.

6.3. Calculation Parameters

As the grout curtain has been in operation for more than 20 years, it is not easy to obtain the initial components of the grout materials. In this study, the inverse parameters of the grout curtain adopt Phung’s test parameters of Sample 3. The CH and C-S-H contents are 3027 and 6054 mol/m3, respectively [14]. The parameters of the rock and grout curtain are presented in Table 2. The parameters of non-equilibrium solid−liquid dissolution follow Gawin’s model [12]. The calculation parameters are presented in Table 3.

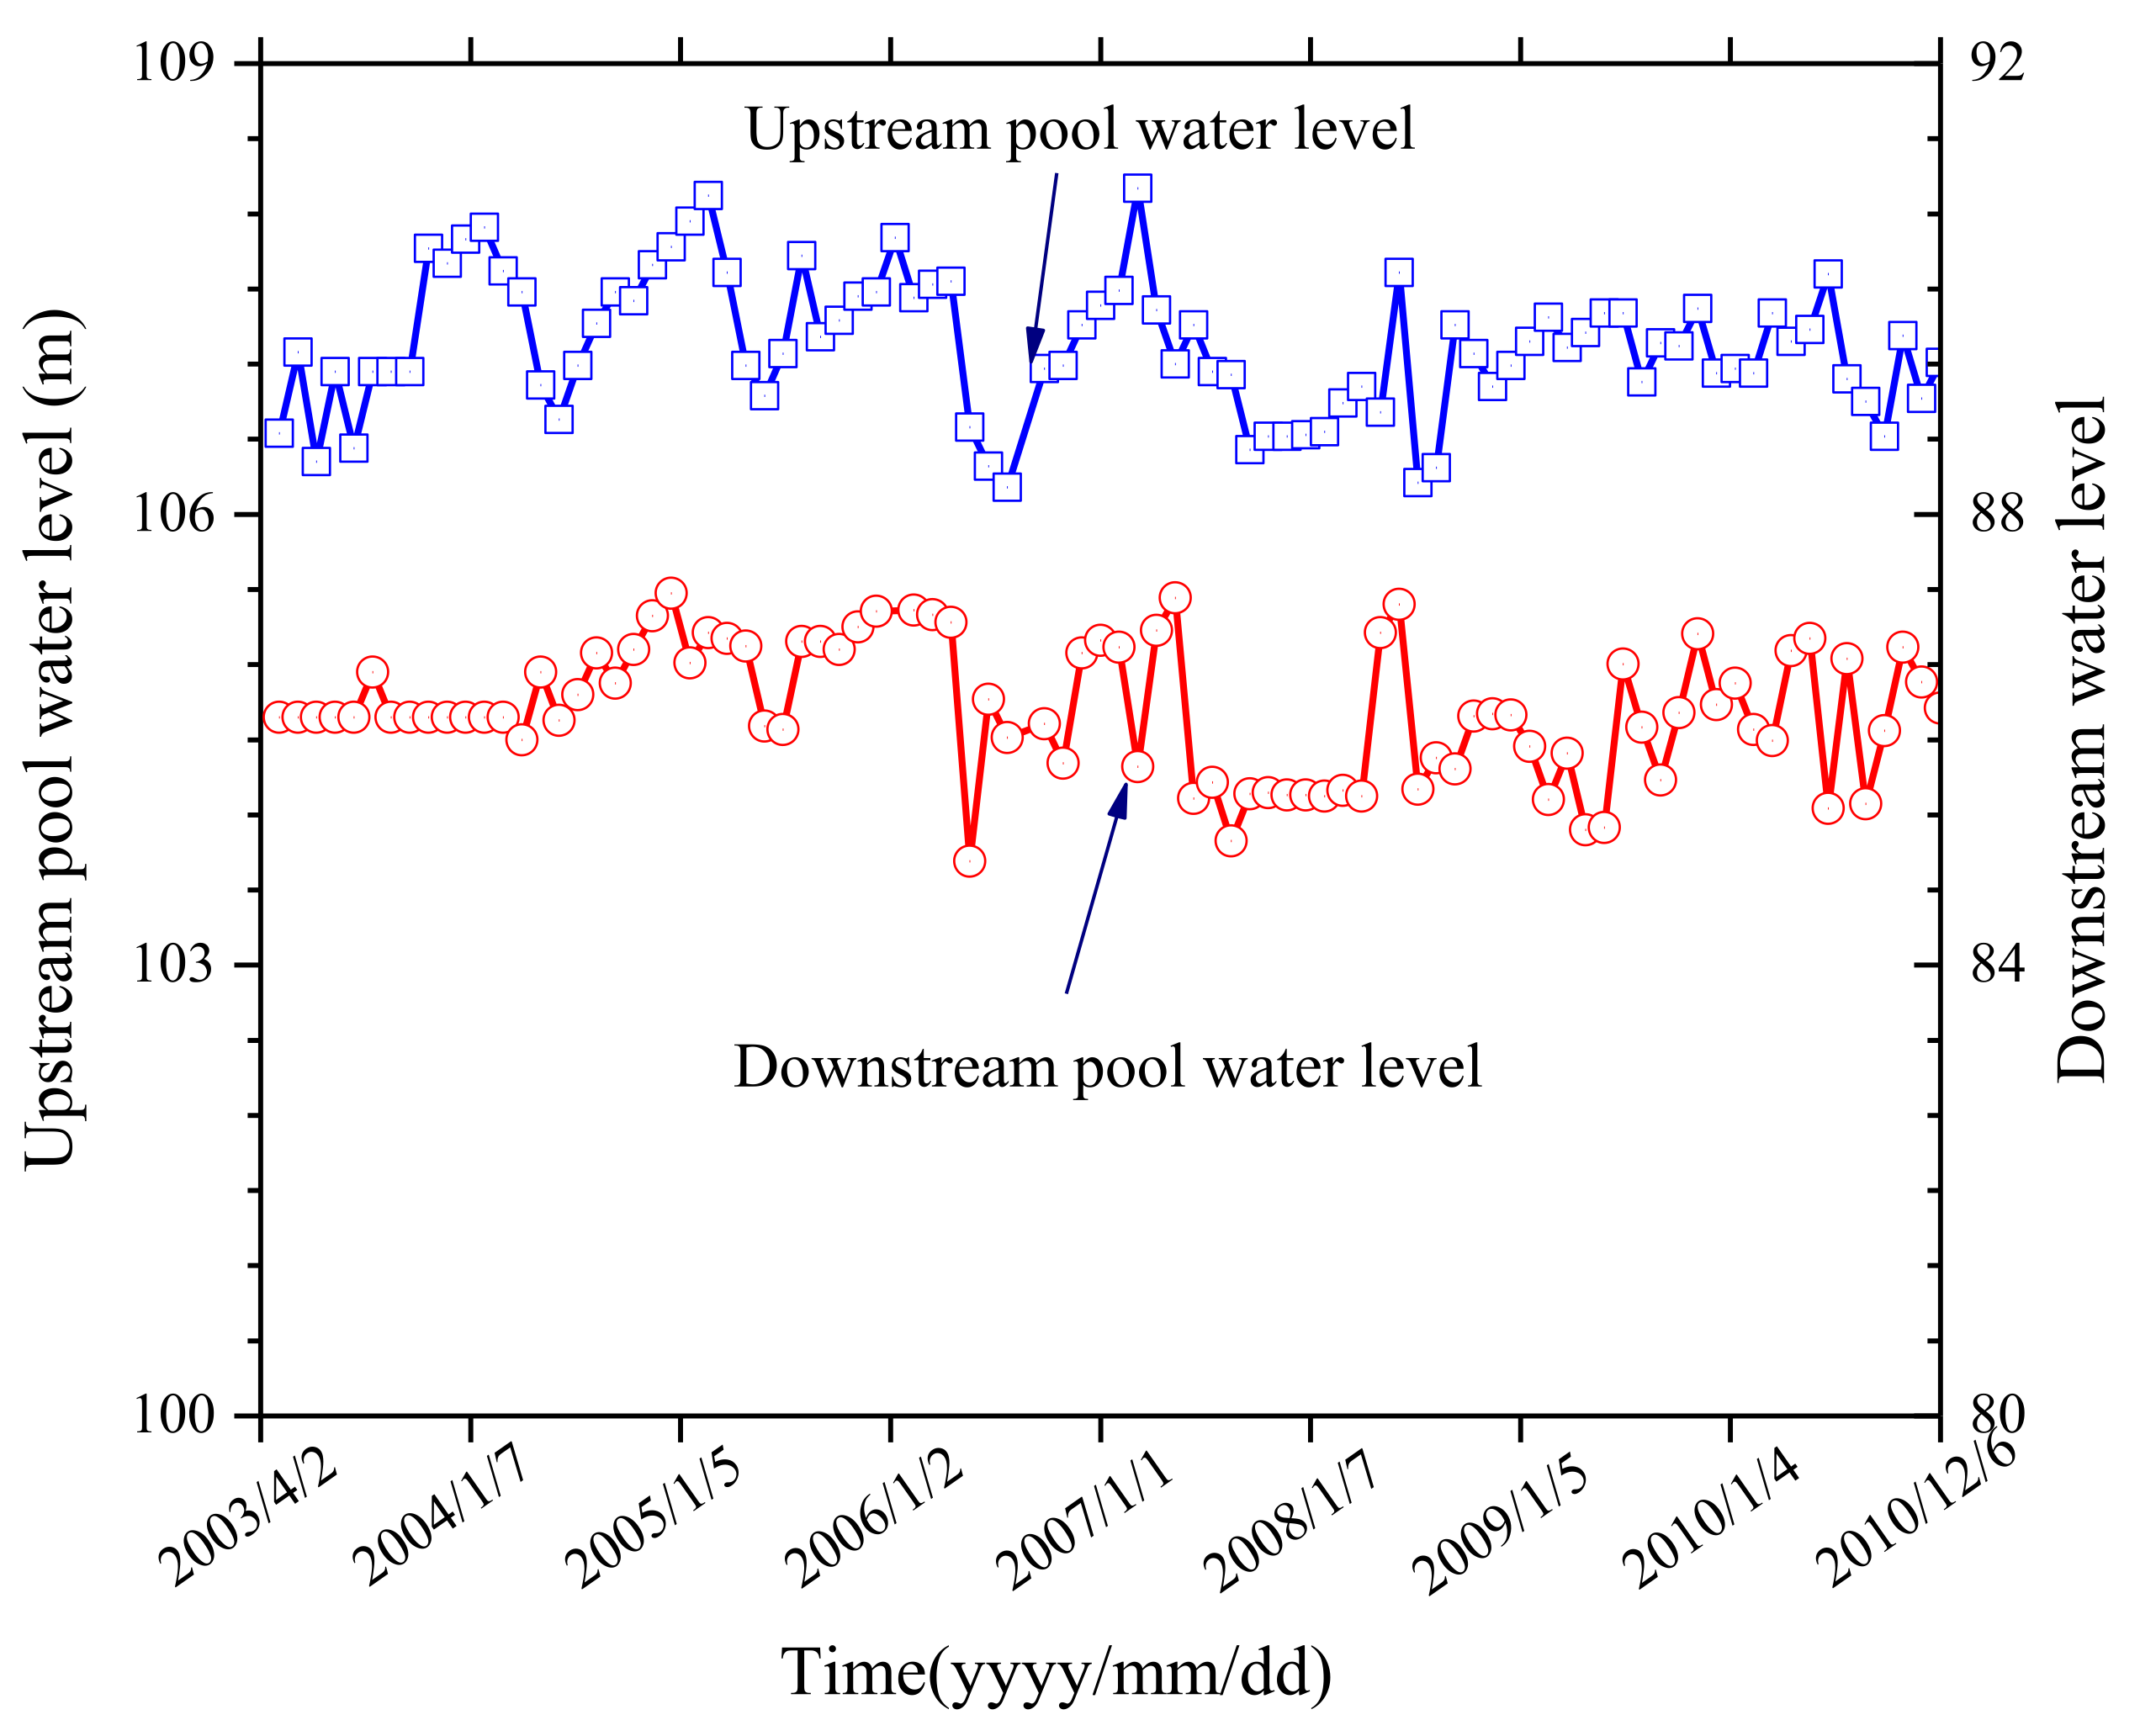
6.4. Initial and Boundary Conditions

The initial and boundary conditions for the calcium leaching model are present in Figure 3. The applied boundary conditions are the same as the working conditions. The pore solution is assumed to be saturated for the grout curtain zones, according to previous studies such as [9,10]. The upstream water head is 107.0 m, and the downstream head is 86.0 m. The upstream water head boundary is applied on the bottom of the reservoir basin at an elevation of 76.0 m. The distance is from 0 m to 80.0 m. The downstream water head boundary is applied on the downstream side foundation surface at an elevation of 76.0 m. The distance is from 116 m to 204 m. The water head boundary in the corridor is 85.0 m. The distance is from 85.6 m to 85.7 m. The calcium ion concentration boundary at the upstream side, downstream side, and corridor is 0 mol/m3. The distribution of the calcium ion concentration boundary is the same as for the water head boundary. The initial calcium ion concentrations in the grout curtain and key-wall are 22 mol/m3. The initial calcium ion concentration in the rock foundation is 0 mol/m3. The long-term observations of upstream and downstream water levels are presented in Figure 4. Data observations shown in Figure 4, Figure 5 and Figure 6 are obtained from the Shimantan reservoir project management report. The time-series measurements adopt the annual average values presented in Figure 5 and Figure 6.

6.5. Results

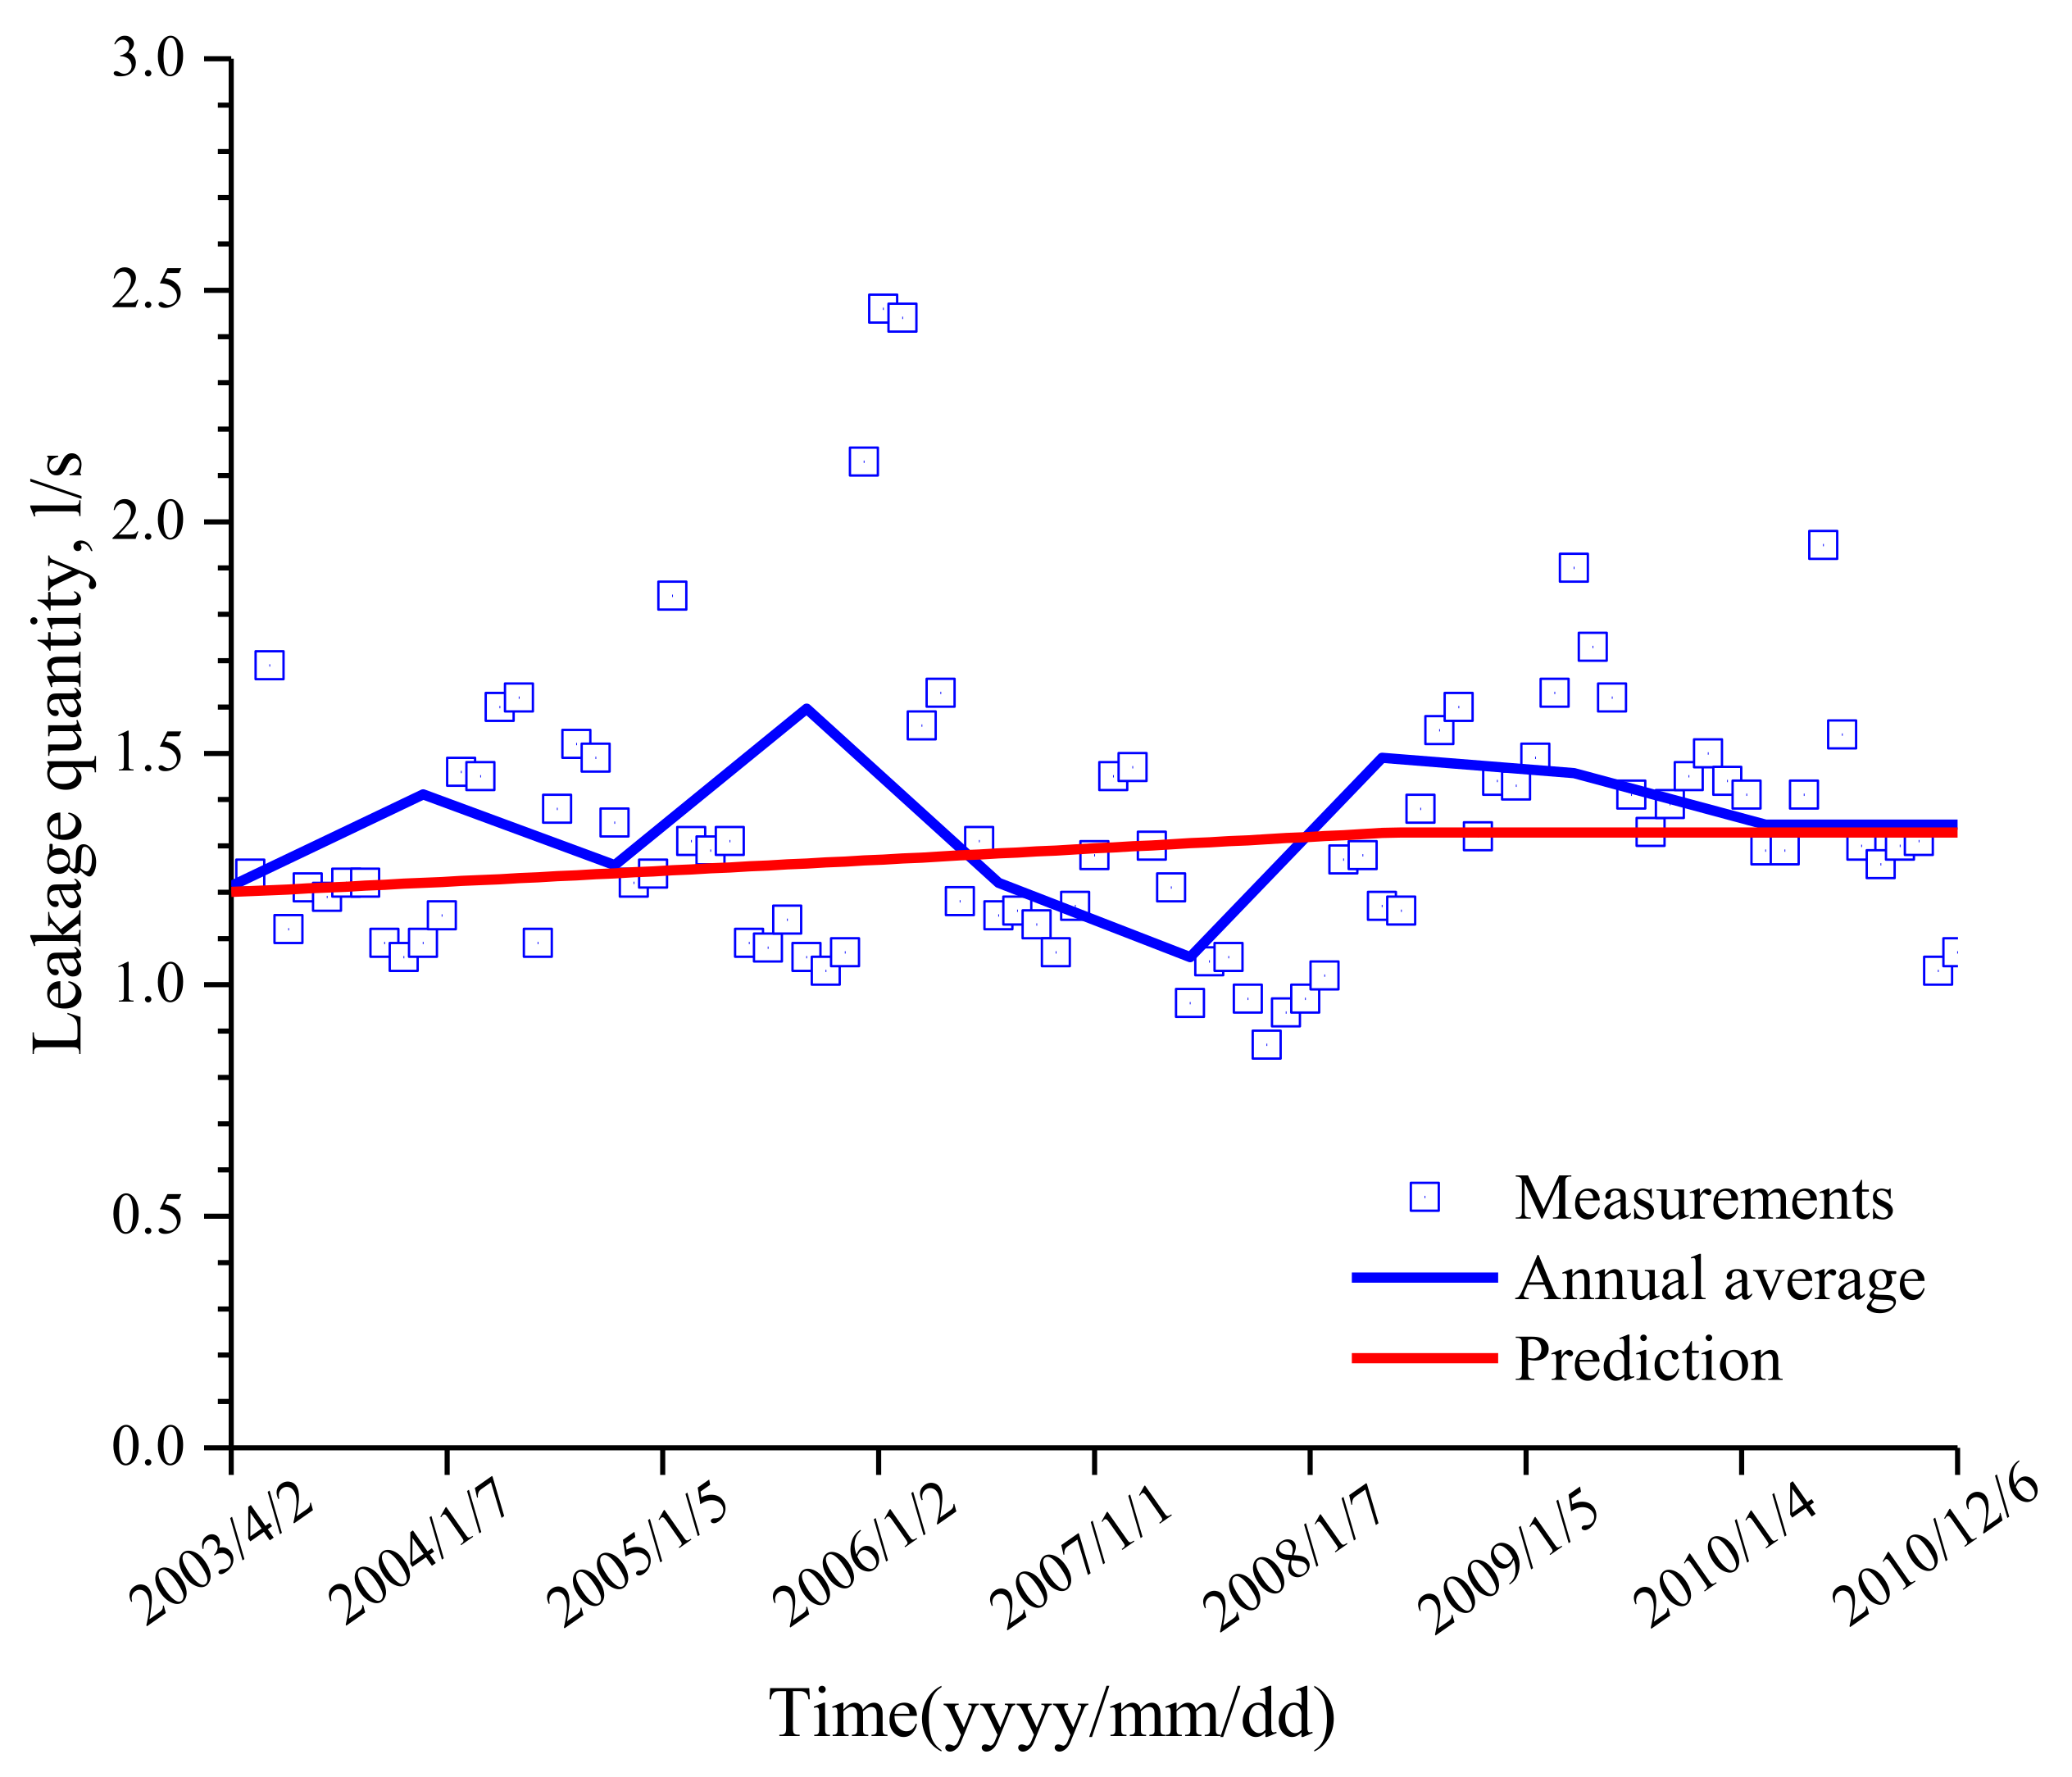
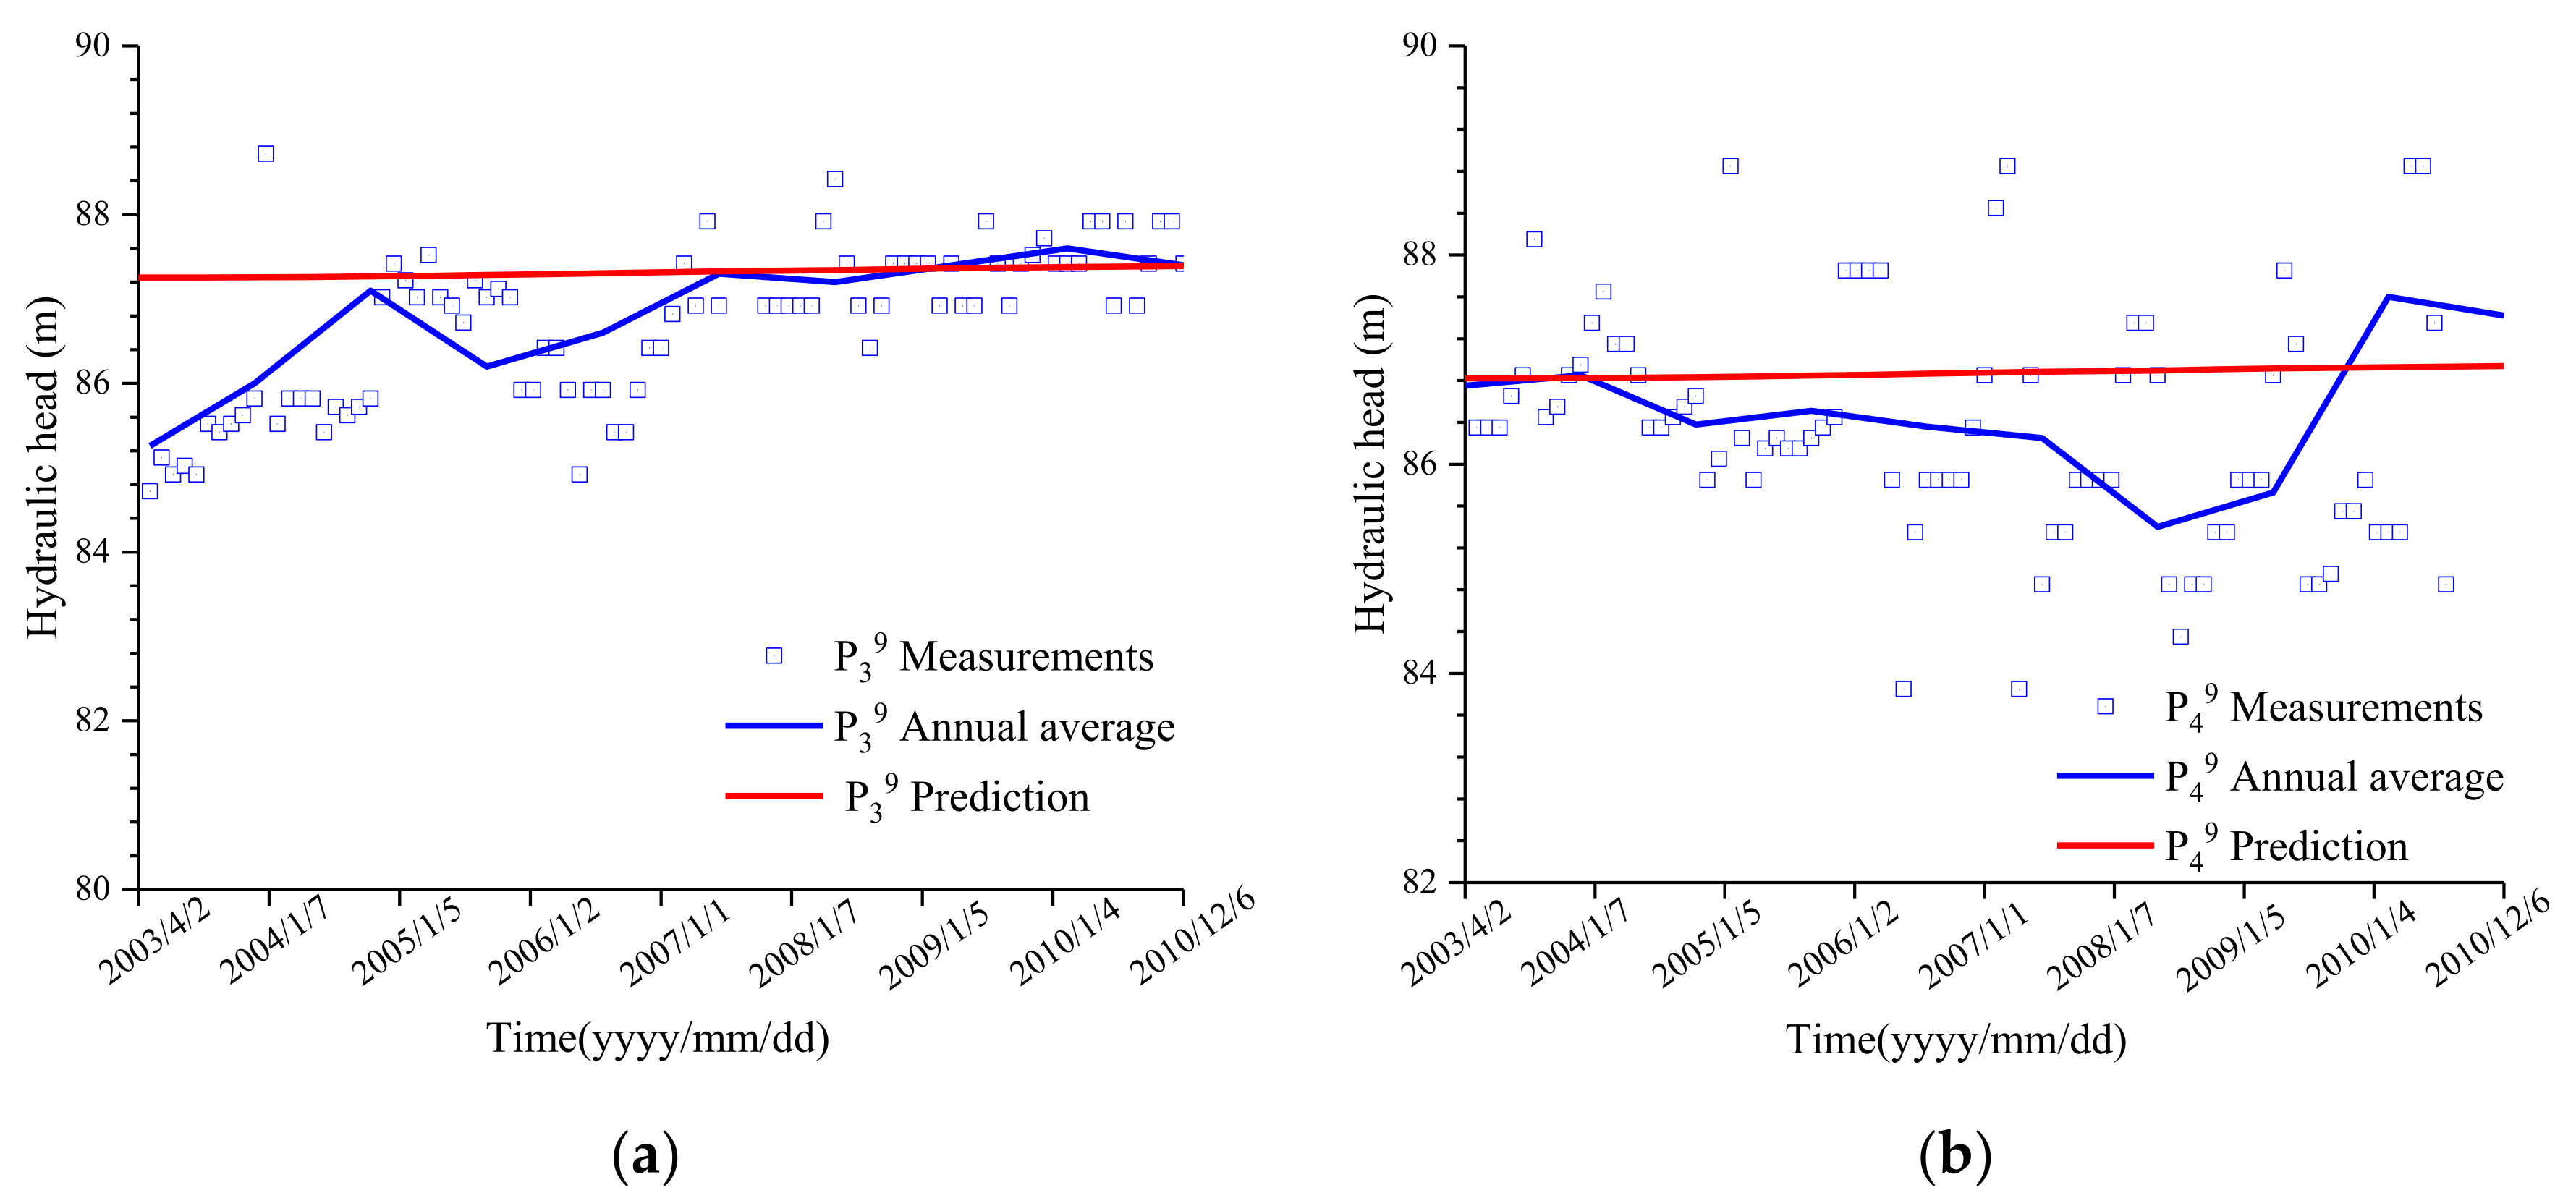
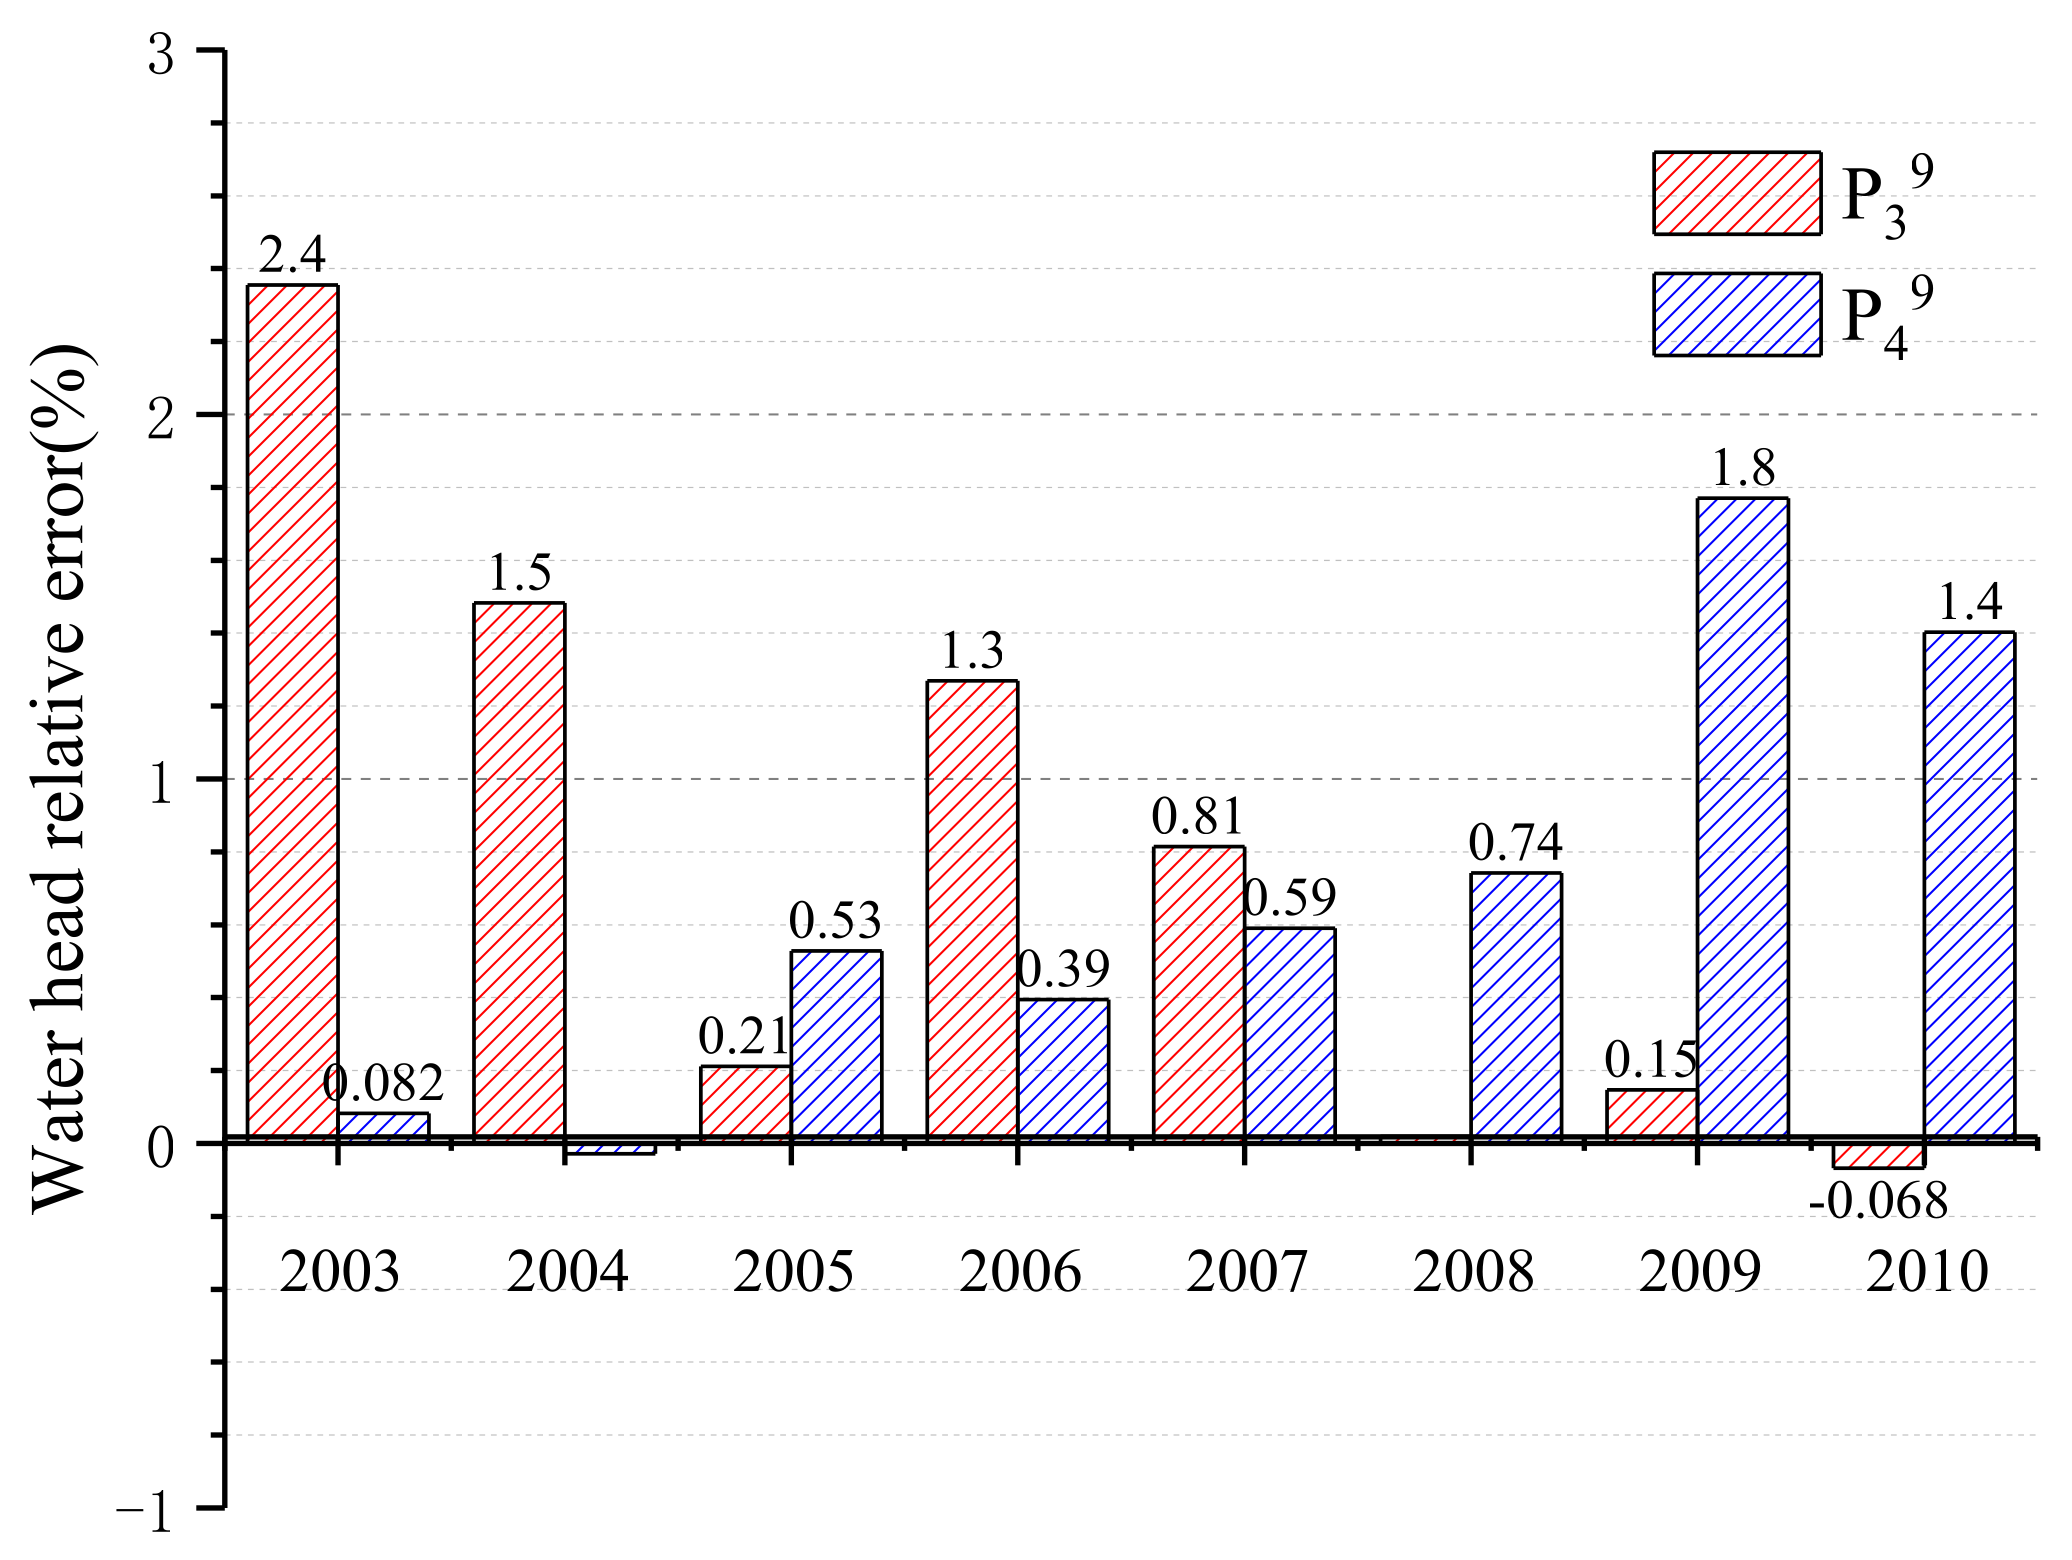
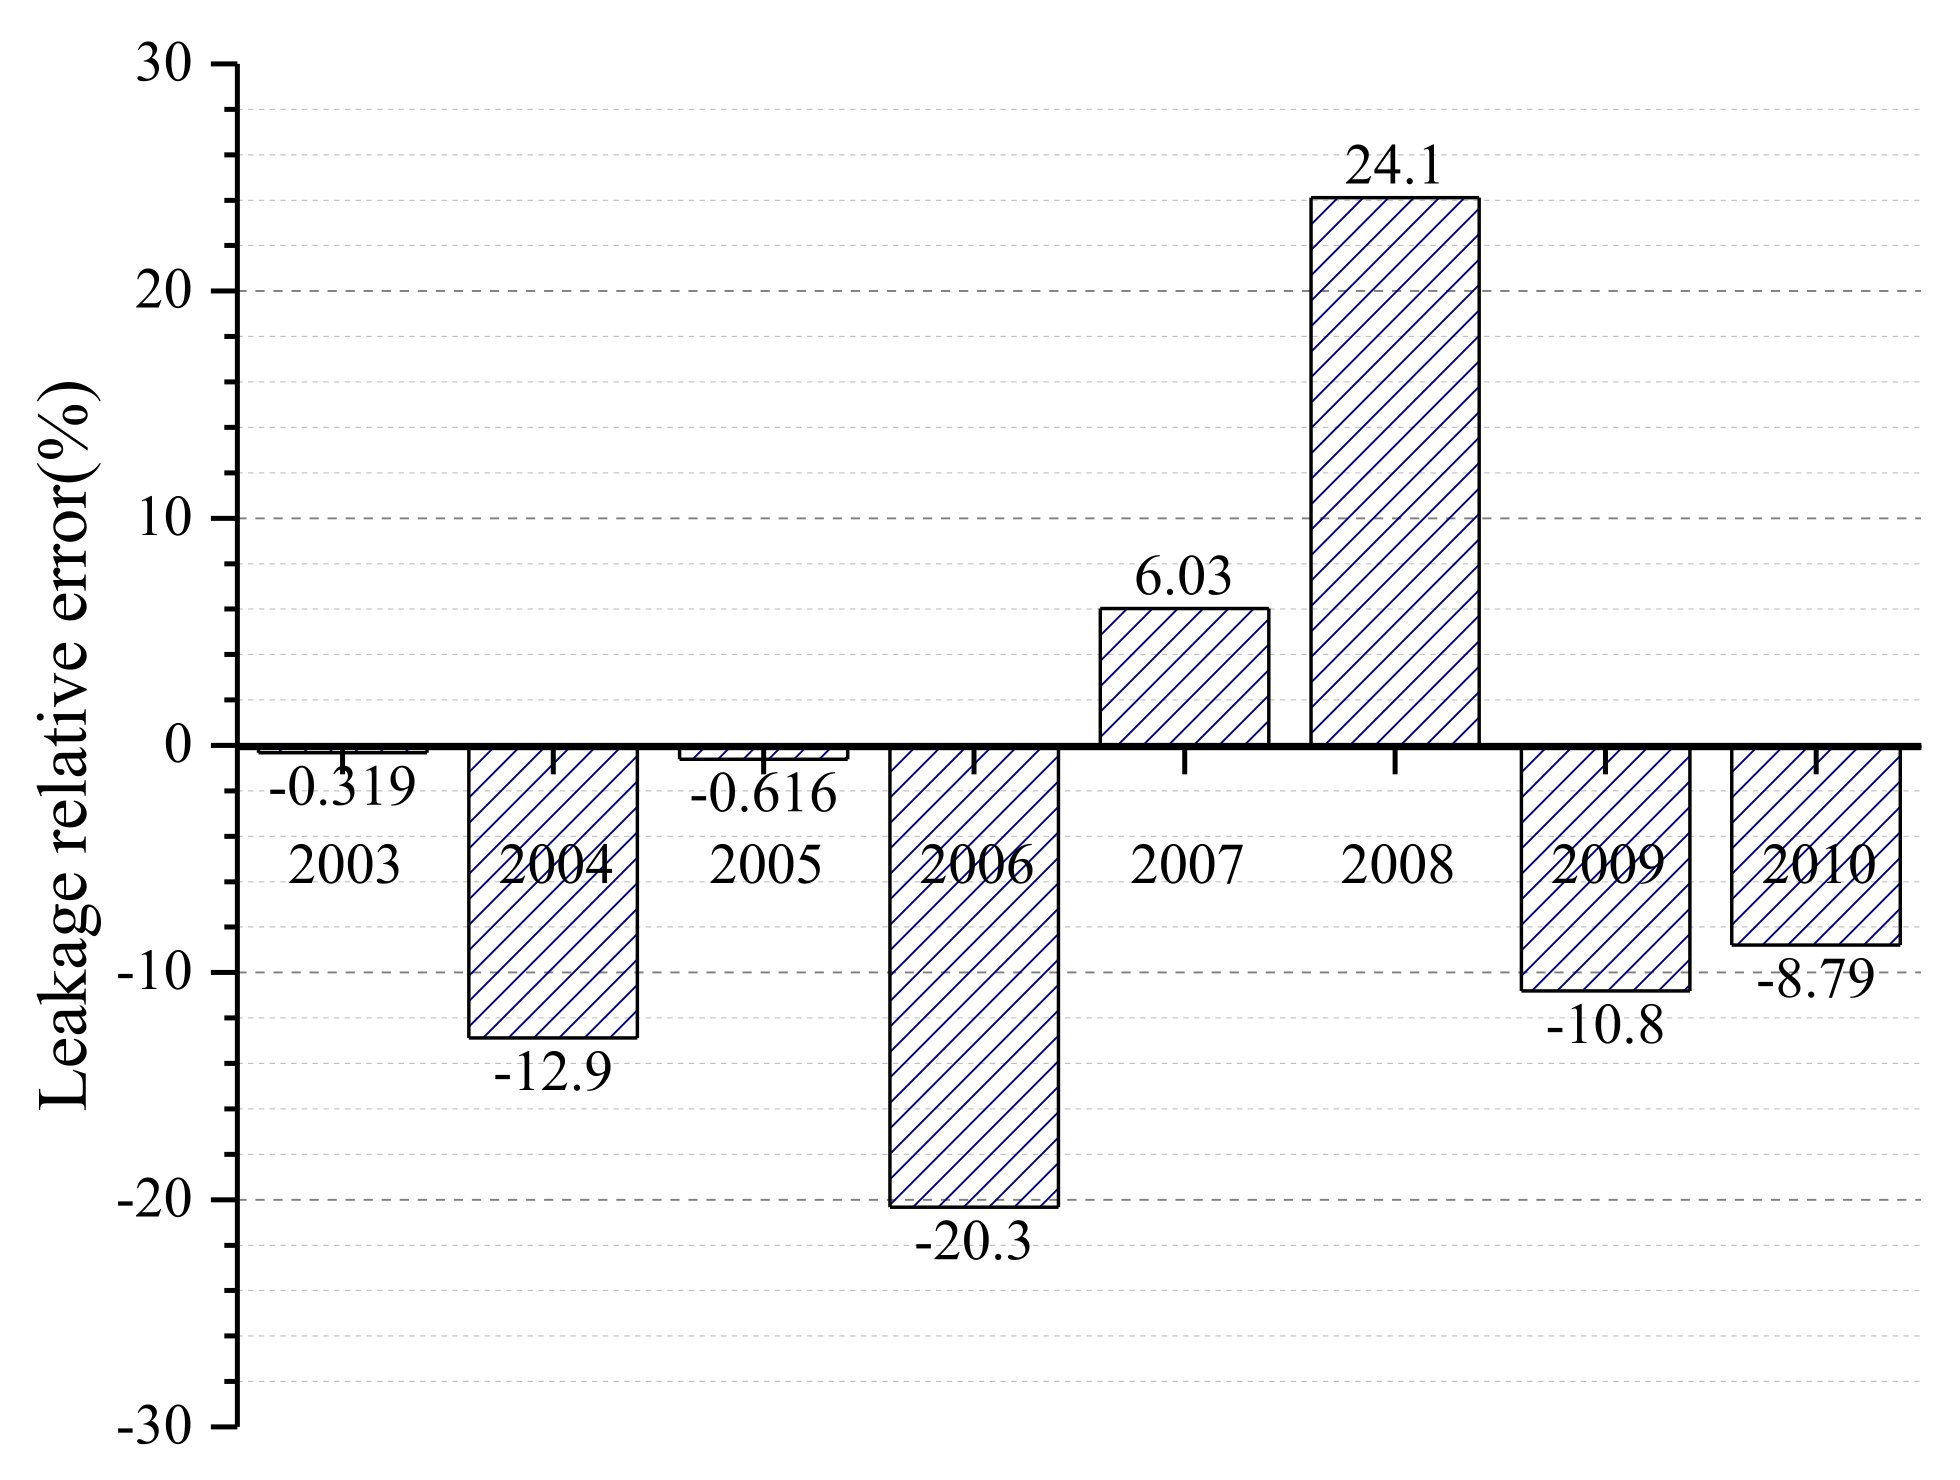
6.5.1. Verification of the Results

The predicted results are listed in Table 4.
Figure 5 compares the simulated dam foundation leakage quantity and the monitored data. The monitored data recorded the leakage quantity of the dam foundation from 2003 to 2010. As we can see from Figure 5, with the increase in time, the leakage quantity increases from 1.20 L/s to 1.33 L/s. The predicted leakage quantity fluctuates between the average annual monitored values. The predictions are basically consistent with the monitored data, indicating the rationality of this simulation.
Figure 6 presents a comparison of measured and simulated water heads at piezometers P 3 9 and P 4 9 . The upstream hydraulic head fluctuates around 107.0 m, and the downstream hydraulic head fluctuates around 86.0 m. The positions of piezometers P 3 9 and P 4 9 are presented in Figure 1. The square dots are the measured data from 2003 and 2010. As we can infer from the figure, the predicted water head at P 3 9 increases from 87.25m to 87.40m. The predicted water head at P 4 9 increases from 86.82 m to 86.93 m. The predicted water heads are basically consistent with the monitored data, indicating the rationality of this simulation.
The bar graphs of the water head and leakage relative error are presented in Figure 7 and Figure 8. The relative error is computed from the D-value between the annual average measurements and predicted values divided by the yearly average measures. As we infer from the figures, the presented maximum water head relative error is 2.4% and the maximum leakage quantity relative error is 24.1%. The scatter field data showed a comparative considerable leakage relative error. Overall, the predicted leakage and water head are consistent with the monitored data.

6.5.2. Hydraulic Conductivity of the Grout Curtain

Figure 9a presents the grout curtain porosity evolution in the leaching process. As we can infer from the porosity contour distribution, the porosity of the upper part is larger than the middle and bottom parts. The porosity of the upstream side is larger than the downstream side. Figure 9b presents porosity evolution in 100 years at H = 63.0 m. After 100 years of leaching duration, the maximum porosity on the upstream side is 0.21 and the minimum porosity at the downstream side is 0.17. Figure 9c shows the grout curtain porosity evolution at the different positions after 50 years of leaching duration. The elevation of these three positions is 72.0, 63.0, and 54.0 m. The maximum porosity at the elevation of 72.0 m is 0.02 larger than the other two positions.
Figure 10a presents the grout curtain hydraulic conductivity evolution in the leaching process. The hydraulic conductivity evolution is similar to the porosity. The hydraulic conductivity at the upper and upstream sides is more significant than in the other regions. Figure 10b presents the hydraulic conductivity evolution in 100 years at H = 63.0 m. The maximum hydraulic conductivity on the upstream is 1 . 8   ×   10 6   m / s and the minimum porosity at the downstream side is 1 . 9   ×   10 7   m / s . The hydraulic conductivity of the upstream side is one order of magnitude larger than the downstream side. Figure 10c shows the evolution of the hydraulic conductivity at different positions after 50 years of leaching. The hydraulic conductivity at an elevation of 72.0 m is half an order of magnitude larger than for the other two elevations. According to the above analysis, the most vulnerable parts of the grout curtain are the upper and upstream sides.

7. Conclusions

Accurate determination of the hydraulic conductivity of the anti-seepage structures, such as grout curtains, concrete face slabs, and core walls, is challenging. Under the calcium leaching effect, the hydraulic conductivity of the grout curtain is not constant. The evolution of grout curtain hydraulic conductivity in the leaching process is closely related to the project safety and benefits. It is not easy to sample and obtain the calculation parameters for deep-buried grout curtains. This study introduced the inversion analysis into the calcium leaching analysis in order to obtain proper calculation parameters and accurate results. This method can analyze the new curtain and the curtain built for many years.
The proposed inverse analysis model provides a new way to obtain calcium leaching parameters. The genetic algorithm (GA) is adopted to reduce the computational cost. The time-series measurements, including the hydraulic head and leakage quantity, were adopted to construct the objective function, which improves the uniqueness and reliability of the inverse results. The proposed inverse analysis method is applied to predict the grout curtain hydraulic conductivity of a concrete dam in the leaching process. The predictions are basically consistent with the monitored data, indicating the rationality of this model. The simulation results of this study show that the increase in the permeability coefficient at the connection between the curtain and tooth wall is more significant than that at other parts. It is necessary to strengthen the grout curtain and key-wall joint monitoring to prevent leakage, abnormal uplift pressure, and for other problems induced by calcium leaching.
The calcium leaching problem is common in hydraulic engineering anti-seepage structures such as concrete face slabs and grout curtains. Compared with the grout curtains, the hydraulic conductivity evolutions of the concrete face slabs in the leaching process is more complex, involving the interaction of stress state, seepage flow, and chemical reactions. The inverse modeling of concrete face slabs hydraulic conductivities needs further study.

Author Contributions

Conceptualization, K.Z. and L.X.; methodology, Z.S.; software, K.Z.; validation, Y.S. and C.Y.; formal analysis, L.X.; investigation, K.Z.; resources, Z.S.; data curation, C.Y.; writing—original draft preparation, K.Z.; writing—review and editing, K.Z.; visualization, Y.S.; supervision, Z.S.; project administration, Z.S.; funding acquisition, L.X. All authors have read and agreed to the published version of the manuscript.

Funding

This research was funded by the National Natural Science Foundation of China, grant number 52179130; the Postgraduate Research and Practice Innovation Program of Jiangsu Province, grant number KYCX18/0598; and the Fundamental Research Funds for the Central Universities, grant number 2018B630/X14.

Institutional Review Board Statement

Not applicable.

Informed Consent Statement

Not applicable.

Data Availability Statement

Not applicable.

Conflicts of Interest

The authors declare no conflict of interest.

References

  1. Ribeiro, D.; Cardoso, R. A review on models for the prediction of the diameter of jet grouting columns. Eur. J. Environ. Civ. Eng. 2016, 21, 641–669. [Google Scholar] [CrossRef]
  2. Liangchao, Z.; Hakansson, U.; Cvetkovic, V. Two-phase cement grout propagation in homogeneous water-saturated rock fractures. Int. J. Rock Mech. Min. Sci. 2018, 106, 243–249. [Google Scholar]
  3. Zhong, D.; Liu, Z.; Su, Z.; Li, K.; Li, X. Predicting and controlling the cement intake during curtain grouting of dam foundations. Eur. J. Environ. Civ. Eng. 2020, 2020, 1–27. [Google Scholar] [CrossRef]
  4. Kailai, Z.; Zhenzhong, S.; Lei, G. Advances in cement-based materials leaching test. Adv. Sci. Technol. Water Resour. 2018, 38, 86–94. (In Chinese) [Google Scholar]
  5. Longze, P.; Shuming, Z.; Weiping, G. Analysis on the Corrosion of Percolating Water to the Concrete of Fengman Dam. Water. Resour. Hydrop Eng. 2000, 31, 34–36. (In Chinese) [Google Scholar]
  6. Xing, L.; Xu, S. Deterioration and its treatment of Gutianxi Cascade-III Dam. Water Power 2005, 31, 69–71. (In Chinese) [Google Scholar]
  7. Gerard, B.; Le Bellego, C.; Bernard, O. Simplified modelling of calcium leaching of concrete in various environments. Mater. Struct. 2002, 38, 632–640. [Google Scholar] [CrossRef]
  8. Keshu, W.; Lin, L.; Wei, S. Solid–liquid equilibrium curve of calcium in 6mol/L ammonium nitrate solution. Cem. Concr. Res. 2013, 53, 44–50. [Google Scholar]
  9. Keshu, W.; Lin, L.; Wei, S. Experimental and modelling research of the accelerated calcium leaching of cement paste in ammonium nitrate solution. Constr. Build. Mater. 2013, 40, 832–846. [Google Scholar]
  10. Phung, Q.T.; Maes, N.; Jacques, D.; Perko, J.; De Schutter, G.; Ye, G. Modelling the evolution of microstructure and transport properties of cement pastes under conditions of accelerated leaching. Constr. Build. Mater. 2016, 115, 179–192. [Google Scholar] [CrossRef]
  11. Ulm, F.; Torrenti, J.; Adenot, F. Chemoporoplasticity of calcium leaching in concrete. J. Eng. Mech. 1999, 125, 1200–1211. [Google Scholar] [CrossRef]
  12. Gawin, D.; Pesavento, F.; Schrefler, B.A. Modeling of cementitious materials exposed to isothermal calcium leaching, considering process kinetics and advective water flow. Part 1: Theoretical model. Int. J. Solids Struct. 2008, 45, 6221–6240. [Google Scholar] [CrossRef]
  13. Gawin, D.; Pesavento, F.; Schrefler, B.A. Modeling of cementitious materials exposed to isothermal calcium leaching, considering process kinetics and advective water flow. Part 2: Numerical solution. Int. J. Solids Struct. 2008, 45, 6241–6268. [Google Scholar] [CrossRef]
  14. Phung, Q.T.; Maes, N.; Jacques, D.; De Schutter, G.; Ye, G. Investigation of the changes in microstructure and transport properties of leached cement pastes accounting for mix composition. Cem. Concr. Res. 2016, 79, 217–234. [Google Scholar] [CrossRef]
  15. Hiroshi, S.; Akira, D. Leaching tests on different mortars using accelerated electrochemical method. Cem. Concr. Res. 2000, 30, 1815–1825. [Google Scholar]
  16. Nelio, H.; Juan, C.B.; Wagner, F.S. A three-parameter Kozeny–Carman generalized equation for fractal porous media. Chem. Eng. Sci. 2010, 65, 4432–4442. [Google Scholar]
  17. Henderson, N.; Brettas, J.C.; Sacco, W.F. Applicability of the three-parameter Kozeny–Carman generalized equation to the description of viscous fingering in simulations of water flood in heterogeneous porous media. Adv. Eng. Softw. 2015, 85, 73–80. [Google Scholar] [CrossRef]
  18. Katagiri, J.; Konno, Y.; Yoneda, J.; Temma, N. Pore-scale modeling of flow in particle packs containing grain-coating and pore-filling hydrates: Verification of a Kozeny-Carman-based permeability reduction model. J. Nat. Gas Sci. Eng. 2017, 45, 537–551. [Google Scholar] [CrossRef]
  19. Lala, A.M.S. Modifications to the Kozeny-Carman model to enhance petrophysical relationships. Explor. Geophys. 2017, 49, 1–19. [Google Scholar] [CrossRef]
  20. Zhang, K.-L.; Sheng, Z.-Z.; Xu, L.-Q.; Tan, J.-C.; Yang, C. Durability control index of anti-seepage curtain considering the effect of advection-diffusion-driven leaching. J. Hydraul. Eng. 2020, 51, 169–179. (In Chinese) [Google Scholar]
  21. Zhou, C.-B.; Liu, W.; Chen, Y.-F.; Hu, R.; Wei, K. Inverse modeling of leakage through a rockfill dam foundation during its construction stage using transient flow model, neural network and genetic algorithm. Eng. Geol. 2015, 187, 183–195. [Google Scholar] [CrossRef]
  22. Chegbeleh, L.P.; Akabzaa, T.M.; Akudago, J.A.; Yidana, S.M. Investigation of critical hydraulic gradient and its application to the design and construction of bentonite-grout curtain. Environ. Earth Sci. 2019, 78, 1–10. [Google Scholar] [CrossRef]
  23. Chi, S.; Ni, S.; Liu, Z. Back Analysis of the Permeability Coefficient of a High Core Rockfill Dam Based on a RBF Neural Network Optimized Using the PSO Algorithm. Math. Probl. Eng. 2015, 118, 1–15. [Google Scholar]
  24. Tan, J.; Xu, L.; Zhang, K.; Yang, C. A Biological Immune Mechanism-Based Quantum PSO Algorithm and Its Application in Back Analysis for Seepage Parameters. Math. Probl. Eng. 2020, 2020, 1–13. [Google Scholar] [CrossRef]
  25. Ren, J.; Shen, Z.-Z.; Yang, J.; Yu, C.-Z. Back analysis of the 3D seepage problem and its engineering applications. Environ. Earth Sci. 2016, 75, 1–8. [Google Scholar] [CrossRef]
  26. Virbulis, J.; Bethers, U.; Saks, T.; Sennikovs, J.; Timuhins, A. Hydrogeological model of the Baltic Artesian Basin. Hydrogeol. J. 2013, 21, 845–862. [Google Scholar] [CrossRef]
  27. Borazjani, S.; Hemmati, N.; Behr, A.; Genolet, L.; Mahani, H.; Zeinijahromi, A.; Bedrikovetsky, P. Determining water-oil relative permeability and capillary pressure from steady-state coreflood tests. J. Pet. Sci. Eng. 2021, 205, 108810. [Google Scholar] [CrossRef]
  28. Bahrami, A.; Aghamir, F.; Bahrami, M.; Khodaverdiloo, H. Inverse modeling towards parameter estimation of the nonlinear soil hydraulic functions using developed multistep outflow procedure. J. Hydrol. 2020, 590, 125446. [Google Scholar] [CrossRef]
  29. Chen, Y.F.; Zhou, C.B.; Sheng, Y.Q. Formulation of strain-dependent hydraulic conductivity for a fractured rock mass. Int. J. Rock Mech. Min. Sci. 2007, 44, 981–996. [Google Scholar] [CrossRef]
  30. Chen, Y.; Hu, S.; Zhou, C.; Jing, L. Micromechanical modeling of anisotropic damage-induced permeability variation in crystalline rocks. Rock Mech. Rock. Eng. 2014, 47, 1775–1791. [Google Scholar] [CrossRef]
  31. Kuhl, D.; Falko, B.; Meschke, G. Coupled chemo-mechanical deterioration of cementitious materials. Part I: Modeling. Int. J. Solids Struct. 2004, 41, 15–40. [Google Scholar] [CrossRef]
  32. Kuhl, D.; Falko, B.; Meschke, G. Coupled chemo-mechanical deterioration of cementitious materials Part II: Numerical methods and simulations. Int. J. Solids Struct. 2004, 41, 41–67. [Google Scholar] [CrossRef]
  33. Morteza, D. Hydrodynamic dispersion due to a variety of flow velocity profiles in a porous-walled microfluidic channel. Int. J. Heat Mass Tran. 2019, 41, 41–67. [Google Scholar]
  34. Garboczi, E.J.; Bentz, D.P. Computer simulation of the diffusivity of cement-based materials. J. Mater. Sci. 1992, 27, 2083–2092. [Google Scholar] [CrossRef]
  35. Bentz, D.; Jensen, O.; Coats, A.; Glasser, F. Influence of silica fume on diffusivity in cement-based materials: I. Experimental and computer modeling studies on cement pastes. Cem. Concr. Res. 2000, 30, 953–962. [Google Scholar] [CrossRef]
  36. Bentz, D.P. Influence of silica fume on diffusivity in cement-based materials: II. Multi-scale modeling of concrete diffusivity. Cem. Concr. Res. 2000, 30, 1121–1129. [Google Scholar] [CrossRef]
  37. Van Eijk, R.J.; Brouwers, H.J.H. Study of the realation between hydrated portland cement composition and leaching resistance. Cem. Concr. Res. 1998, 28, 815–828. [Google Scholar] [CrossRef]
  38. Javadi, A.A.; Farmani, R.; Tan, T.P. A hybrid intelligent genetic algorithm. Adv. Eng. Inform. 2005, 19, 255–262. [Google Scholar] [CrossRef]
  39. Zhang, X.; Chen, X.; Li, J. Improving Dam Seepage Prediction Using Back-Propagation Neural Network and Genetic Algorithm. Math. Probl. Eng. 2020, 2020, 1–8. [Google Scholar]
  40. Shahrokhabadi, S.; Toufigh, M.M. The solution of unconfined seepage problem using Natural Element Method (NEM) coupled with Genetic Algorithm (GA). Appl. Math. Model. 2013, 37, 2775–2786. [Google Scholar] [CrossRef]
  41. Al-Juboori, M.; Datta, B. Performance evaluation of a genetic algorithm-based linked simulation-optimization model for optimal hydraulic seepage-related design of concrete gravity dams. J. Appl. Water Eng. Res. 2019, 7, 173–197. [Google Scholar] [CrossRef]
  42. Deng, X.; Yuan, D.; Yang, D.; Zhang, C. Back Analysis of Geomechanical Parameters of Rock Masses Based on Seepage-Stress Coupled Analysis. Math. Probl. Eng. 2017, 2017, 1–13. [Google Scholar] [CrossRef]
  43. Hong, J.-M.; Chen, Y.-F.; Liu, M.-M.; Zhou, C.-B. Inverse modelling of groundwater flow around a large-scale underground cavern system considering the excavation-induced hydraulic conductivity variation. Comput. Geotech. 2017, 81, 346–359. [Google Scholar] [CrossRef]
Figure 2. Shimantan concrete gravity dam location and the calcium leaching in the corridors.
Mathematics 10 00381 g002
Figure 3. 2D finite element meshes and boundary conditions of the inverse model.
Mathematics 10 00381 g003
Figure 4. Long-term observations of upstream and downstream water level.
Mathematics 10 00381 g004
Figure 5. Comparison of the simulated leakage quantity and monitored data.
Mathematics 10 00381 g005
Figure 6. Comparison of measured and simulated hydraulic heads at piezometer: (a) hydraulic head at piezometer P 3 9 and (b) hydraulic head at piezometer P 4 9 .
Mathematics 10 00381 g006
Figure 7. Bar graph of the water head relative error.
Mathematics 10 00381 g007
Figure 8. Bar graph of the dam foundation leakage relative error.
Mathematics 10 00381 g008
Figure 9. Grout curtain porosity evolution in the leaching process: (a) porosity contour distribution, (b) porosity evolution at H = 63.0 m in 100 years, and (c) porosity evolution at different positions.
Mathematics 10 00381 g009
Figure 10. Grout curtain hydraulic conductivity evolution in the leaching process: (a) hydraulic conductivity contour distribution, (b) hydraulic conductivity evolution at H = 63.0 m in a hundred years, and (c) hydraulic conductivity evolution at different positions.
Mathematics 10 00381 g010
Table 1. Parameters in the Kozeny−Carman (KC) relation [10].
ParameterNotationUnitParameter Range
Lumped term Ω 0 11000~20,000
Lumped term increased times n 1500~2000
Initial specific pore surface S a 0 106/m10~50
Leached specific pore surface S al 106/m100~500
Rock hydraulic conductivity k r m/s1.0 × 10−6~1.0 × 10⁻⁸
Table 2. Numerical parameters used for simulation.
MaterialParameterNotationValue
RockInitial porosity φ f 0.10
RockInitial diffusivity D r 0 1 . 47   ×   10 11 m2/s
ConcreteInitial porosity φ k 0 0.10
ConcreteInitial diffusivity D k 0 7.11 × 10 12
ConcreteCH content C CH _ K 3027 mol/m3
ConcreteC-S-H content C C S H _ K 6054 mol/m3
Grout curtainCH content C CH 3027 mol/m3
Grout curtainC-S-H content C C S H 6054 mol/m3
Grout curtainInitial porosity φ g 0 0.15
Grout curtainInitial diffusivity D g 0 9 . 87   ×   10 12 m2/s
Grout curtainIntact/leached bulk density ρ 0 / ρ L 30.6/145.8
Table 3. Values of the non-equilibrium decomposition model of calcium compounds [12].
Skeleton CompoundCa2+
( mol / m 3 )
ds Ca / dc Ca   Diffusivity
( m 2 / s )
τ l e a c h  
( s )
1 η  
( mol / ( J s ) )
CH 19–222142 1 . 44   ×   10 9 1 . 17   ×   10 4 3 . 45   ×   10 8
C-S-H2–19203 1 . 62   ×   10 9 5 . 88   ×   10 2 0 . 7   ×   10 8
C-S-H0–21910 1 . 83   ×   10 9 6 . 52   ×   10 3 6 . 2   ×   10 8
Table 4. Inverse analysis results of the grout curtain and rock layers.
Parameter Ω 0   n S a 0   S al   k r  
Values12,251.431125.31 3 . 21   ×   10 7 3 . 13   ×   10 8 1 . 0   ×   10 7
Publisher’s Note: MDPI stays neutral with regard to jurisdictional claims in published maps and institutional affiliations.

